Abstract
Growing interest in the relaxation effect of nature has elicited demands for scientific verification of the various natural elements. This study investigated the physiological and psychological responses of 27 females in their 20 s to viewing a waterfall and urban images (control) presented via a large, high-resolution display for 90 s. High-frequency [HF] for parasympathetic nervous activity and the ratio of low-frequency (LF)/[LF + HF] for sympathetic nervous activity by heart rate variability and heart rate were recorded. Simultaneous changes in oxyhemoglobin concentration in the prefrontal cortex were recorded by near-infrared time-resolved spectroscopy. The modified semantic differential method and Profile of Mood States Second Edition were used to assess the psychological effects on the participants after viewing each image. The results showed that viewing the waterfall image, compared with viewing the urban image, (1) increased sympathetic nervous activity; (2) provided comfortable, relaxed, and natural impressions; (3) improved mood states. In conclusion, visual contact with a waterfall image physiologically activated sympathetic nervous activity and psychologically evoked positive moods and feelings.
Keywords: heart rate variability, natural landscape image, nature therapy, physiological and psychological responses, sympathetic nervous activity, waterfall landscape
1. Introduction
It is empirically known that viewing natural landscapes, such as forests, has a stress-reducing and relaxing effect [1]. In recent years, scientific data on the physiological relaxing effects of viewing natural landscapes, determined using physiological indices regarding brain and autonomic nervous activity, has been accumulating. Compared with viewing an urban landscape, sitting in a forest for a short time and viewing a forest landscape have been shown to sedate prefrontal cortex activity [2], enhance parasympathetic nervous activity, and suppress sympathetic nervous activity [3,4,5,6]. However, it is difficult for city dwellers to visit forests, mountains, and other natural wilderness areas frequently because of time and physical constraints. City dwellers are often exposed to natural landscapes through TV and PC displays in daily life.
Previous studies that have assessed natural landscape effects on the physiological state have often used electronic displays and demonstrated that using a visual image with a sense of realism is important for eliciting physiological effects [7]. Recent studies have been conducted using large high-resolution displays that provide a sense of realism to visual stimuli [8,9]. The results showed that prefrontal cortex activity was decreased by viewing a green forest landscape image [8] and viewing a mountain landscape image with autumn foliage increased parasympathetic activity [9], indicating that visual stimulation of forest and mountain landscape images through displays induces physiological relaxation. A previous study investigated viewing videotaped simulated natural landscapes’ physiological effects [10]. The result showed that viewing forest and field landscapes reduced systolic and diastolic blood pressure compared with urban-built landscape scenes.
Most previous studies have focused on landscapes such as forests, mountains, and fields. Meanwhile, the waterfall landscape is one type of natural landscape. However, the visual stimulation’s physiological effects provided by natural landscapes, such as waterfalls, have not yet been reported.
Therefore, this study aimed to evaluate the visual stimulation effects of a waterfall scene using a large, high-resolution display, with prefrontal cortex activity measured via near-infrared, time-resolved spectroscopy (TRS), and sympathetic and parasympathetic nervous activity assessed via heart rate variability (HRV). Furthermore, the modified semantic differential (SD) and the Profile of Mood States Second Edition (POMS 2) were used to measure and evaluate the psychological effects.
2. Materials and Methods
The study’s methods for the physiological and psychological measurements and the experimental design were those described by Jo et al. (2022) [9].
2.1. Participants
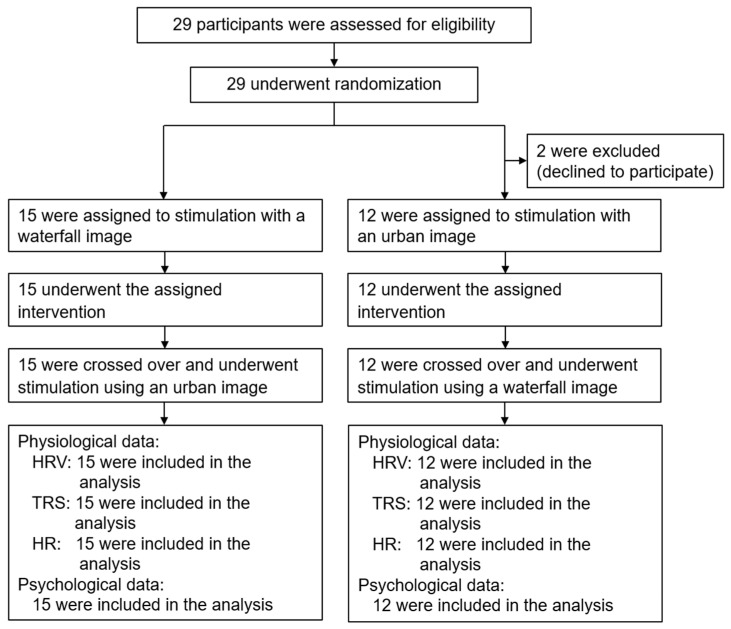
In this study, female university students aged 21–29 (mean age ± standard deviation, 23.2 ± 2.4) years participated. Initially, 29 students were scheduled to participate. However, two withdrew on the day of the experiment, resulting in 27 participants. The study used a randomized block design to assign participants to one of two intervention groups with a different viewing order of the images (Figure 1). The mean values of the participants’ physical characteristics were as follows: weight, 48.0 ± 4.4 kg; height, 155.7 ± 4.4 cm; and eyesight, 0.9 ± 0.3 (left), 0.9 ± 0.3 (right), and eyesight included the values corrected by glasses or contact lens (Landolt ring vision, 1.0 equals 20/20) [11]. The exclusion criteria were respiratory disease, habitual smoker, visual acuity of ≤0.3, poor physical condition, and menstruation. The body temperature was measured and confirmed as normal on the day of the experiment. Before the experiment, each participant was placed in a waiting room and given a detailed explanation of the study’s purpose and methods. Participants who agreed to participate signed a consent form. This study was approved by the Ethics Committee of the Center for Environment, Health, and Field Sciences at Chiba University, Japan (approval number: 42). The research protocol was registered in the University Hospital Medical Information Network of Japan (Unique ID: UMIN000039321).
Figure 1.
Flowchart of the experimental procedure, including the participant screening, enrollment, follow-up, and analysis flow. HRV (heart rate variability), TRS (near-infrared time-resolved spectroscopy), and HR (heart rate).
2.2. Stimuli
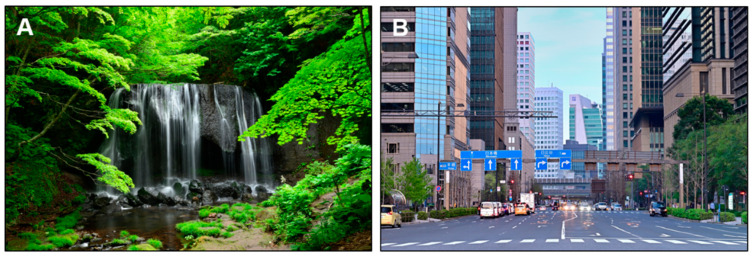
The visual stimuli were photos of a natural waterfall and of a city in Japan. The waterfall image (Figure 2A) shows Tatsusawa Fudo Falls in Fukushima Prefecture. As a control, the urban image (Figure 2B) showed Eita Street in Otemachi, Tokyo. In order to create a sense of realism, the visual stimuli were presented using a large plasma display that was 1872 mm wide × 1053 mm high (85V-type, Panasonic TH-85AX900, Osaka, Japan) with a high resolution of 3840 × 2160 pixels. The distance between the display and the seated participant was 110 cm.
Figure 2.
Images used in the visual stimulation. (A) Waterfall image: Tatsusawa Fudo Falls, Fukushima. (B) Urban image: Eitai Street in Otemachi, Tokyo.
2.3. Procedure
Measurements were made in a soundproofed artificial climate chamber wherein temperature (24.0 °C), and relative humidity (50% RH) were held constant. After receiving an overview of the study and objectives in the waiting room, the participants entered the chamber. For physiological measurements, HRV sensors were attached to the participant’s chest, and TRS sensors were attached to their forehead. The experimenter explained the measurement procedure and precautions to each participant seated in a chair. After the room lighting was turned off, a gray image was presented, and physiological responses were recorded during a 60-s resting period. The display was then switched to the waterfall image (Figure 2A) or urban image (Figure 2B), and the physiological responses to the visual exposures were recorded for 90 s. The room lighting was turned on after the physiological measurements. Based on the modified SD method and POMS 2, the psychological questionnaires were then accessed (approximately 120 s).
After providing the participant a 5 to 10-min break, the same measurement protocol was repeated before and after the viewing of the other image that had not yet been displayed. The study was a within-participants design, and the order of presentation of the waterfall and urban images was counterbalanced to eliminate order effects.
2.4. Physiological Indicators
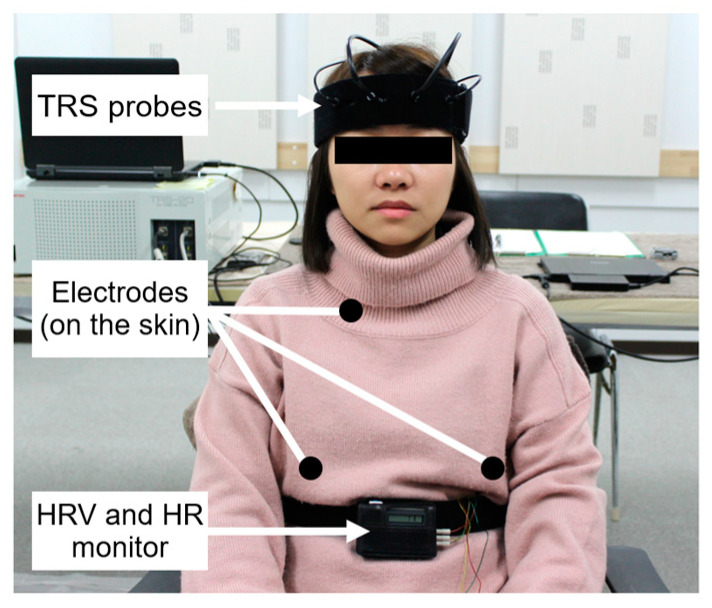
HRV was used as an autonomic nervous activity evaluation. A portable electrocardiograph (Activtracer AC-301A; GMS, Tokyo, Japan) [12,13] was used to measure HRV and heart rate (HR). The maximum entropy method (MemCalc/Win; GMS, Tokyo, Japan) was used to calculate the Power levels of the low-frequency (LF) and high-frequency (HF) [14,15]. HF data were used as an index of parasympathetic nervous activity, and the LF/(LF + HF) ratio was used as an index of sympathetic nervous activity. HF and LF/(LF + HF) data were normalized by conversion to their natural logarithms. TRS was used to evaluate brain activity (TRS-20, Hamamatsu Photonics K.K., Shizuoka, Japan) [16,17] (Figure 3). The physiological values measured during the average 90-s visual exposure were calculated as the difference from the average 30-s rest period before exposure.
Figure 3.
Assessment of physiological indicators. HRV (heart rate variability), HR (heart rate), and TRS (near-infrared time-resolved spectroscopy).
2.5. Psychological Indicators
First, the impressions evoked by the visual stimulus were examined using the modified SD method [18]. In the study, the three pairs of contrasting adjectives were rated on a 13-point scale. Second, mood states were evaluated according to the answers on the POMS 2 questionnaire with seven subscales regarding mood states [19,20,21]. Further, the total mood disturbance (TMD) score was calculated. We used the POMS 2 short version with 35 questions in the Japanese version to decrease participant burden.
2.6. Statistical Analysis
We employed the Statistical Package for the Social Sciences software (version 21.0, IBM SPSS Statistics for Windows, IBM Corp., Armonk, NY, USA) for the statistical analysis. Statistical significance was accepted for p < 0.05. For the physiological data of HRV, HR, TRS, and respiratory rate paired t tests were used to compare the differences between waterfall (stimulation–rest) and urban (stimulation–rest) images. Cohen’s d (d, [22]) was calculated as the effect size for the physiological indices. The Wilcoxon signed-rank test was used to verify the differences in psychological data assessed by the SD method and POMS 2 between the waterfall and urban images. The probability of superiority (PSdep, [23]) was calculated as the effect sizes of psychological indices.
3. Results and Discussion
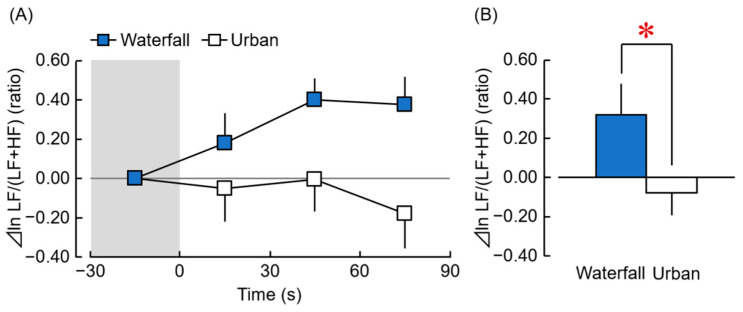
After confirming that there were no significant differences in the respiratory rate between the participants who viewed either a waterfall image or an urban image, a statistical analysis of the HRV data was performed. Figure 4 shows the results of the ratio of ⊿ln LF/(LF + HF), which reflects the sympathetic nervous activity. In the time-dependent changes per 30 s of exposure to the waterfall and urban images over 90 s, the ratio of ⊿ln LF/(LF + HF) while viewing the waterfall image gradually increased. However, while viewing the urban image, the ratio of ⊿ln LF/(LF + HF) almost remained at baseline from 1 to 60 s and then decreased from 61 to 90 s (Figure 4A). A comparison of the overall mean values of the waterfall and urban images for 90-s stimulation (Figure 4B) showed that the ratio of ⊿ln LF/(LF + HF) of the waterfall image was significantly higher than the urban image (Figure 4B, waterfall: 0.32 ± 0.16, urban: −0.08 ± 0.11; t(26) = 2.397, p = 0.024, d = 0.61). This effect size was considered medium. This finding indicated that viewing the waterfall image increased sympathetic nervous activity compared with viewing the urban image.
Figure 4.
Changes in the ratio of ln LF/(LF + HF) of HRV exposure to the waterfall vs. urban images. (A) Changes in the 30 s average ln LF/(LF + HF) over 90 s of exposure (difference from the mean value for 30-s pre-stimulation). (B) Changes in the ln LF/(LF + HF) during exposure to the waterfall vs. urban images for 90 s. (n = 27 mean ± standard error). * p < 0.05, paired t-test.
Regarding the other indicators of autonomic nervous activity, the ratio of ⊿ln HF, which reflects the parasympathetic nervous activity (waterfall: −0.03 ± 0.12 ms2; urban: −0.02 ± 0.10 ms2; t(26) = −0.143, p = 0.951, d = 0.06) and ⊿HR (waterfall: 0.58 ± 0.46 beats/min; urban: −0.44 ± 0.57 beats/min; t(26) = 1.620, p = 0.117, d = 0.11), no significant differences were noted between viewing the waterfall and urban images.
In the analysis results for the ⊿oxyhemoglobin concentrations on the left (waterfall: −0.15 ± 0.13 μM; urban: −0.39 ± 0.28 μM; t(26) = −0.464, p = 0.424, d = 0.12) and right (waterfall: −0.24 ± 0.11 μM; urban: −0.15 ± 0.16 μM; t(26) = 0.812, p = 0.647, d = 0.11) prefrontal cortices, there were no significant differences between the visual stimulation by a waterfall image and by the urban image.
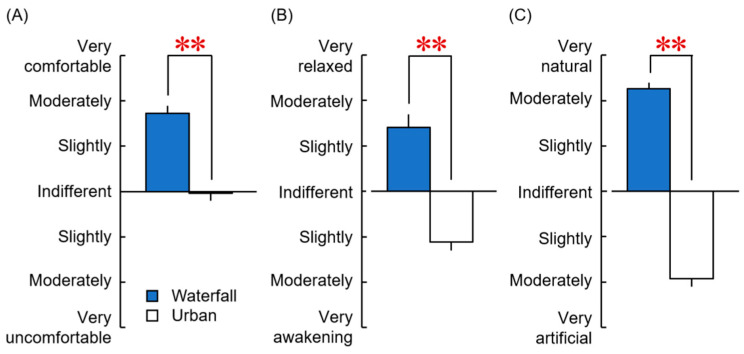
Figure 5 shows the results of the impression evaluation using three opposing adjective pairs after viewing the waterfall and city images. For the evaluation of comfortable–uncomfortable, the waterfall image was scored slightly to moderately comfortable, whereas the urban image was scored almost equally as comfortable or uncomfortable, indicating that the waterfall image gave a significantly more comfortable impression than the urban image (Figure 5A, p < 0.001, PSdep = 0.926). On the relaxed–awakening evaluation, the waterfall image was scored slightly to moderately relaxed, whereas the urban image was scored as almost slightly awakening, indicating a significant difference between the two images (Figure 5B, p < 0.001, PSdep = 0.852). In the natural–artificial impression evaluation, the waterfall image was rated moderately to very natural, whereas the urban image was rated as an almost moderately artificial impression, with a significant difference between the images (Figure 5C, p < 0.001, PSdep = 1). The findings showed that viewing the waterfall image had psychological effects associated with comfortable, relaxed, and natural impressions compared with viewing the urban image.
Figure 5.
Psychological effects were evaluated using the modified SD method based on three opposing adjective pairs after viewing the waterfall and urban images. (A) Comfortable vs. uncomfortable. (B) Relaxed vs. awakening. (C) Natural vs. artificial (n = 27, mean ± standard error). ** p < 0.01 (waterfall vs. urban). Wilcoxon signed-rank test.
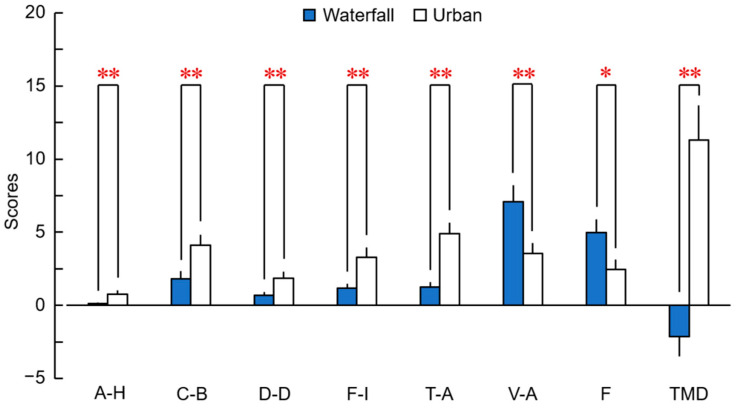
Figure 6 shows the POMS 2 mood-state results after viewing the waterfall and urban images. On the five negative subscales (mean age ± standard error), anger–hostility [A–H], waterfall: 0.11 ± 0.06, urban: 0.74 ± 0.28, p = 0.007, PSdep = 0.333; confusion–bewilderment [C–B], waterfall: 1.78 ± 0.53, urban: 4.07 ± 0.72, p < 0.001, PSdep = 0.741; depression–dejection [D–D], waterfall: 0.67 ± 0.24, urban: 1.81 ± 0.47, p < 0.001, PSdep = 0.556; fatigue–inertia [F–I], waterfall: 1.15 ± 0.32, urban: 3.25 ± 0.66, p < 0.001, PSdep = 0.667; and tension–anxiety [T–A], waterfall: 1.22 ± 0.35, urban: 4.89 ± 0.75, p < 0.001, PSdep = 0.815), the scores were significantly lower for the visual stimulation by the waterfall image than by the urban image. Conversely, the positive subscale results (vigor–activity [V–A], waterfall: 7.07 ± 1.11, urban: 3.52 ± 0.73, p = 0.005, PSdep = 0.667; friendliness [F], waterfall: 4.96 ± 0.90, urban: 2.44 ± 0.66, p = 0.012, PSdep = 0.593) showed that the waterfall image had significantly higher scores than the urban image. In the evaluation of TMD, the waterfall image had a significantly lower score than the urban image (waterfall: −2.15 ± 1.35, urban: 11.26 ± 2.39, p < 0.001, PSdep = 0.889). These findings showed that viewing a waterfall image via a large display decreased negative-mood states and increased positive-mood states.
Figure 6.
Psychological effects evaluated by POMS 2 after viewing the waterfall and urban images; n = 27, mean ± standard error, ** p < 0.01, * p < 0.05 (waterfall vs. urban), Wilcoxon signed-rank test. A–H, anger–hostility; C–B, confusion–bewilderment; D–D, depression–dejection; F–I, fatigue–inertia; T–A, tension–anxiety; V–A, vigor–activity; F, friendliness; TMD, total mood disturbance.
In previous nature therapy-related studies, the results were the same as those in the present study with respect to the modified SD method and the shortened version of the POMS 2 [9,24,25], and all findings were suppressed with respect to sympathetic nervous activity [24,26,27,28]. Similar to previous studies, the current study found that comfortable, relaxed, and natural feelings were increased. However, sympathetic nervous activity was increased, which has not been reported previously and could have been caused by the positive change associated with viewing the waterfall. On the shortened version of the POMS 2, the “vigor–activity” score was 7.07 ± 1.11 points, which was a 38% increase relative to the score found in a previous study [9] with an autumn foliage mountain image (5.11 ± 0.77 points) conducted with the same experimental design (Table 1).
Table 1.
POMS 2 scores after stimulation by viewing a waterfall image (n = 27) and a mountain image (n = 27, Jo et al., 2022 [9]) via a large, high-resolution display.
| A–H | C–B | D–D | F–I | T–A | V–A | F | TMD | ||
|---|---|---|---|---|---|---|---|---|---|
| Waterfall | Mean ± SE | 0.11 ± 0.06 | 1.78 ± 0.53 | 0.67 ± 0.24 | 1.15 ± 0.32 | 1.22 ± 0.35 | 7.07 ± 1.11 | 4.96 ± 0.90 | −2.15 ± 1.35 |
| Mountain | Mean ± SE | 0.22 ± 0.11 | 1.67 ± 0.49 | 0.89 ± 0.28 | 1.04 ± 0.41 | 1.52 ± 0.46 | 5.11 ± 0.77 | 4.33 ± 0.73 | 0.22 ± 1.49 |
Data is shown as the mean ± standard error. A–H, anger–hostility; C–B, confusion–bewilderment; D–D, depression–dejection; F–I, fatigue–inertia; T–A, tension–anxiety; V–A, vigor–activity; F, friendliness; TMD, total mood disturbance.
Compared with the normal, natural landscape stimuli [8,9], the subjective vigor–activity increased, and sympathetic nervous activity was significantly enhanced by a waterfall image. Selye proposed the concept of “distress” caused by negative and unpleasant emotions and “eustress” caused by positive emotions [29,30], and the waterfall image visual stimuli were interpreted as eustress.
This study had several limitations. Previous studies on nature-derived stimuli have shown a physiologically relaxing effect. In this study, however, the opposite result was obtained as follows: sympathetic nervous activity was increased. Since stimuli derived from the natural environment vary widely, it is necessary to accumulate data using a variety of stimuli in the future to understand the overall picture that natural stimuli’s effects bring on humans. Since the participants were young women in their 20s, further research with subjects having different demographic characteristics, such as males and various ages, should be conducted to enable results generalization. In addition, individual differences in natural stimuli’s physiological effects have been reported [1,5,31], and further verification would be needed.
4. Conclusions
This study examined the physiological and psychological effects of viewing waterfall images on a large, high-resolution display. The results showed that stimulation of the waterfall image (1) increased sympathetic nervous activity and (2) produced a positive mood and relaxation compared to the control. In conclusion, visual contact with a waterfall image was shown to produce a physiological awakening and a psychologically relaxing effect.
Acknowledgments
We would like to thank Hiromitsu Kobayashi of the Ishikawa Prefecture Nursing University for his contribution to analyzing the HRV signals to estimate the respiratory rate. This paper is an achievement of the research project of “elucidation of the physiological relaxing effects of the visual stimulation of a waterfall and a forest” commissioned from Ookawaso.
Author Contributions
Conceptualization, H.I. and Y.M.; methodology, H.I. and Y.M.; investigation, H.J., H.I. and Y.M.; resources, H.I. and Y.M.; data curation, H.J. and H.I.; writing—original draft preparation, H.J.; writing—review and editing, H.J., H.I. and Y.M.; visualization, H.J. and H.I.; supervision, Y.M.; project administration, H.I. and Y.M.; funding acquisition, H.I. and Y.M. All authors have read and agreed to the published version of the manuscript.
Institutional Review Board Statement
The study was conducted according to the guidelines of the Declaration of Helsinki and approved by the Ethics Committee of the Center for Environment, Health, and Field Sciences at Chiba University, Japan (project ID no. 42, approval date 20 January 2020).
Informed Consent Statement
Informed consent was obtained from all participants involved in the study.
Data Availability Statement
The data that support the study findings are available from the corresponding author upon reasonable request.
Conflicts of Interest
The authors declare no conflict of interest.
Funding Statement
This research was funded by Ookawaso.
Footnotes
Disclaimer/Publisher’s Note: The statements, opinions and data contained in all publications are solely those of the individual author(s) and contributor(s) and not of MDPI and/or the editor(s). MDPI and/or the editor(s) disclaim responsibility for any injury to people or property resulting from any ideas, methods, instructions or products referred to in the content.
References
- 1.Song C., Ikei H., Miyazaki Y. Physiological effects of nature therapy: A review of the research in Japan. Int. J. Environ. Res. Public Health. 2016;13:781. doi: 10.3390/ijerph13080781. [DOI] [PMC free article] [PubMed] [Google Scholar]
- 2.Song C., Ikei H., Kagawa T., Miyazaki Y. Effect of viewing real forest landscapes on brain activity. Sustainability. 2020;12:6601. doi: 10.3390/su12166601. [DOI] [Google Scholar]
- 3.Tsunetsugu Y., Park B.J., Ishii H., Hirano H., Kagawa T., Miyazaki Y. Physiological effects of Shinrin-yoku (taking in the atmosphere of the forest) in an old-growth broadleaf forest in Yamagata Prefecture, Japan. J. Physiol. Anthropol. 2007;26:135–142. doi: 10.2114/jpa2.26.135. [DOI] [PubMed] [Google Scholar]
- 4.Park B.J., Tsunetsugu Y., Kasetani T., Kagawa T., Miyazaki Y. The physiological effects of Shinrin-yoku (taking in the forest atmosphere or forest bathing): Evidence from field experiments in 24 forests across Japan. Environ. Health Prev. Med. 2010;15:18. doi: 10.1007/s12199-009-0086-9. [DOI] [PMC free article] [PubMed] [Google Scholar]
- 5.Kobayashi H., Song C., Ikei H., Kagawa T., Miyazaki Y. Analysis of individual variations in autonomic responses to urban and forest environments. Evid. Based Complement. Alternat. Med. 2015;2015:671094. doi: 10.1155/2015/671094. [DOI] [PMC free article] [PubMed] [Google Scholar]
- 6.Song C., Ikei H., Kagawa T., Miyazaki Y. Physiological and psychological effects of viewing forests on young women. Forests. 2019;10:635. doi: 10.3390/f10080635. [DOI] [Google Scholar]
- 7.Igarashi M., Yamamoto T., Lee J., Song C., Ikei H., Miyazaki Y. Effects of stimulation by three-dimensional natural images on prefrontal cortex and autonomic nerve activity: A comparison with stimulation using two-dimensional images. Cogn. Process. 2014;15:551–556. doi: 10.1007/s10339-014-0627-z. [DOI] [PubMed] [Google Scholar]
- 8.Song C., Ikei H., Miyazaki Y. Physiological effects of visual stimulation with forest imagery. Int. J. Environ. Res. Public Health. 2018;15:213. doi: 10.3390/ijerph15020213. [DOI] [PMC free article] [PubMed] [Google Scholar]
- 9.Jo H., Ikei H., Miyazaki Y. Physiological and psychological Benefits of viewing an autumn foliage mountain landscape image among young women. Forests. 2022;13:1492. doi: 10.3390/f13091492. [DOI] [Google Scholar]
- 10.Parsons R., Tassinary L.G., Ulrich R.S., Hebl M.R., Grossman-Alexander M. The view from the road: Implications for stress recovery and immunization. J. Environ. Psychol. 1998;18:113–139. doi: 10.1006/jevp.1998.0086. [DOI] [Google Scholar]
- 11.Ophthalmic Optics—Visual Acuity Testing—Standard and Clinical Optotypes and Their Presentation. 3rd ed. The International Organization for Standardization (ISO); Geneva, Switzerland: 2017. [Google Scholar]
- 12.Task Force of the European Society of Cardiology the North American Society of Pacing Electrophysiology Heart rate variability: Standards of measurement, physiological interpretation, and clinical use. Circulation. 1996;93:1043–1065. doi: 10.1161/01.CIR.93.5.1043. [DOI] [PubMed] [Google Scholar]
- 13.Kobayashi H., Ishibashi K., Noguchi H. Heart rate variability; an index for monitoring and analyzing human autonomic activities. J. Physiol. Anthropol. Appl. Human Sci. 1999;18:53–59. doi: 10.2114/jpa.18.53. [DOI] [PubMed] [Google Scholar]
- 14.Sawada Y., Ohtomo N., Tanaka Y., Tanaka G., Yamakoshi K., Terachi S., Shimamoto K., Nakagawa M., Satoh S., Kuroda S., et al. New technique for time series analysis combining the maximum entropy method and non-linear least squares method: Its value in heart rate variability analysis. Med. Biol. Eng. Comput. 1997;35:318–322. doi: 10.1007/BF02534083. [DOI] [PubMed] [Google Scholar]
- 15.Kanaya N., Hirata N., Kurosawa S., Nakayama M., Namiki A. Differential effects of propofol and sevoflurane on heart rate variability. Anesthesiology. 2003;98:34–40. doi: 10.1097/00000542-200301000-00009. [DOI] [PubMed] [Google Scholar]
- 16.Ohmae E., Ouchi Y., Oda M., Suzuki T., Nobesawa S., Kanno T., Yoshikawa E., Futatsubashi M., Ueda Y., Okada H. Cerebral hemodynamics evaluation by near-infrared time-resolved spectroscopy: Correlation with simultaneous positron emission tomography measurements. Neuroimage. 2006;29:697–705. doi: 10.1016/j.neuroimage.2005.08.008. [DOI] [PubMed] [Google Scholar]
- 17.Ohmae E., Oda M., Suzuki T., Yamashita Y., Kakihana Y., Matsunaga A., Kanmura Y., Tamura M. Clinical evaluation of time-resolved spectroscopy by measuring cerebral hemodynamics during cardiopulmonary bypass surgery. J. Biomed. Opt. 2007;12:062112. doi: 10.1117/1.2804931. [DOI] [PubMed] [Google Scholar]
- 18.Osgood C., Suci G., Tannenbaum P. The Measurement of Meaning. University of Illinois Press; Urbana, IL, USA: 1957. pp. 1–360. [Google Scholar]
- 19.Heuchert J., McNair D.M. The Profile of Mood States 2nd Edition (POMS2) Multi-Health Systems Inc.; New York, NY, USA: 2012. [Google Scholar]
- 20.Heuchert J., McNair D.M. In: Japanese Translation of POMS2: Profile of Mood States. Yokoyama K., Watanabe K., editors. Kaneko Shobo; Tokyo, Japan: 2015. pp. 1–156. [Google Scholar]
- 21.Lin S., Hsiao Y.-Y., Wang M. Test Review: The Profile of Mood States 2nd Edition. J. Psychoeduc. Assess. 2014;32:273–277. doi: 10.1177/0734282913505995. [DOI] [Google Scholar]
- 22.Cohen J. Statistical Power for the Behavioral Sciences. 2nd ed. Erlbaum; Hillsdale, NJ, USA: 1988. pp. 1–579. [Google Scholar]
- 23.Grissom R.J., Kim J.J. Effect Sizes for Research: Univariate and Multivariate Applications. 2nd ed. Routledge; New York, NY, USA: 2012. pp. 1–456. [Google Scholar]
- 24.Ikei H., Nakamura M., Miyazaki Y. Physiological effects of visual stimulation using knotty and clear wood images among young women. Sustainability. 2021;12:9898. doi: 10.3390/su12239898. [DOI] [Google Scholar]
- 25.Nakamura M., Ikei H., Miyazaki Y. Physiological effects of visual stimulation with full-scale wall images composed of vertically and horizontally arranged wooden elements. J. Wood. Sci. 2019;65:55. doi: 10.1186/s10086-019-1834-0. [DOI] [Google Scholar]
- 26.Ochiai H., Song C., Ikei H., Imai M., Miyazaki Y. Effects of visual stimulation with bonsai trees on adult male patients with spinal cord injury. Int. J. Environ. Res. Public Health. 2017;14:1017. doi: 10.3390/ijerph14091017. [DOI] [PMC free article] [PubMed] [Google Scholar]
- 27.Igarashi M., Aga M., Ikei H., Namekawa T., Miyazaki T. Physiological and psychological effects on high school students of viewing real and artificial pansies. Int. J. Environ. Res. Public Health. 2015;12:2521–2531. doi: 10.3390/ijerph120302521. [DOI] [PMC free article] [PubMed] [Google Scholar]
- 28.Ikei H., Song C., Igarashi M., Namekawa T., Miyazaki Y. Physiological and psychological relaxing effects of visual stimulation with foliage plants in high school students. Adv. Hortic. Sci. 2014;28:111–116. [Google Scholar]
- 29.Selye H. Stress without Distress. J.B. Lippincott; New York, NY, USA: 1974. pp. 137–146. [Google Scholar]
- 30.Szabo S., Tache Y., Somogyi A. The legacy of Hans Selye and the origins of stress research: A retrospective 75 years after his landmark brief "letter" to the editor# of nature. Stress. 2012;15:472–478. doi: 10.3109/10253890.2012.710919. [DOI] [PubMed] [Google Scholar]
- 31.Ikei H., Song C., Miyazaki Y. Physiological effects of wood on humans: A review. J. Wood Sci. 2017;63:1–23. doi: 10.1007/s10086-016-1597-9. [DOI] [Google Scholar]
Associated Data
This section collects any data citations, data availability statements, or supplementary materials included in this article.
Data Availability Statement
The data that support the study findings are available from the corresponding author upon reasonable request.


