

SUMMARY
BACKGROUND:
In men with a detectable Prostate Specific Antigen (PSA) after prostatectomy for prostate cancer, salvage prostate bed radiotherapy (PBRT) results in about a 70% freedom from progression (FFP) at 5 years (yr). A three-arm randomized trial was designed to determine whether there are incremental gains by adding (i) 4–6 months (mo) of short term androgen deprivation therapy (STADT) to PBRT (64.8–70.2 Gy) and (ii) the combination of STADT and pelvic lymph node radiotherapy (PLNRT; 45 Gy) to PBRT.
METHODS:
Patients were randomized to PBRT alone (Arm 1), PBRT + STADT (Arm 2), or PLNRT + PBRT + STADT (Arm 3). The FFP primary endpoint included PSA nadir+2, clinical failure, or death from any cause. A planned interim analysis of 1191 patents with minimum potential follow-up time of 5 years applied a Haybittle-Peto (HP) boundary of p < 0.001 (one sided) for comparison of 5-yr FFP rates.
FINDINGS:
From 2008 – 2015, 1716 eligible patients were enrolled and median follow-up among survivors is 8.2 yr. For the interim analysis population, the HP boundary was exceeded when Arm 1 was compared to Arm 3 (p<0.001). The difference between Arms 2 and 3 did not exceed the boundary (p = 0.002). With additional follow-up beyond the interim analysis (final planned analysis), the 5 yr FFP rates for all 1716 eligible patients were 71%, 81% and 87% for Arms 1, 2 and 3, respectively. Adjusted hazard ratios were 0.50 (97.5% CI: 0.39–0.64) for Arm 3 relative to Arm 1, 0.60 (97.5% CI: 0.47–0.77) for Arm 2 relative to Arm 1, and 0.82 (97.5% CI: 0.63–1.07) for Arm 3 relative to Arm 2. Per protocol criteria, FFP for Arm 3 is superior to Arms 1 and 2. The adjusted HR for distant metastasis was 0.52 (97.5% CI: 0.34–0.81) for Arm 3 vs Arm 1 and 0.71 (97.5% CI: 0.45–1.12) for Arm 3 vs. Arm 2. IMRT was used in 87% of cases. Acute grade 2+ and 3+ adverse events increased significantly from Arm 1 to Arm 2 to Arm 3; however, only significant late grade 2+ blood/bone marrow events were attributable to the use of PLNRT.
INTERPRETATION:
The results establish the benefit of adding STADT to PBRT and are the first randomized findings to demonstrate that extending salvage radiotherapy to treat the pelvic lymph nodes when combined with STADT results in meaningful reductions in progression.
FUNDING:
U10CA180868 (NRG Oncology Operations), U10CA180822 (NRG Oncology SDMC), UG1CA189867 (NCORP), U24CA180803 (IROC), and P30CA240139 from the National Cancer Institute, and a University of Miami Sylvester Comprehensive Cancer Center Professorship (A.P.).
INTRODUCTION
Biochemical recurrence after prostatectomy is a significant clinical management issue with 20 to 50% of men experiencing a persistently elevated or delayed rise in Prostate Specific Antigen (PSA) within 5–10 years, depending on clinical-pathologic factors.1 In three randomized adjuvant prostate bed radiotherapy (PBRT) trials,2–4 wherein patients were selected mainly for adverse prostatectomy pathologic risk factors, the 10-year biochemical failure rates were >60% without PBRT;3–5 the failure rate was improved by about 50% with the addition of adjuvant PBRT. While there has been an ongoing debate about the timing of radiotherapy (adjuvant versus early salvage) in such high risk patients, based on recent reports from three randomized trials and a meta-analysis,6–9 most patients should be recommended to have early salvage PBRT when the PSA rises after prostatectomy. The efficacy of PBRT and the preference of early salvage has been established; however, the results of salvage PBRT are suboptimal and are influenced by clinical-pathologic factors, as well as the intensity of treatment.10
The three-arm SPPORT trial was designed to address two key management questions in men treated with salvage RT. First, whether an incremental freedom from progression (FFP) benefit results from the addition of short term androgen deprivation therapy (STADT) for 4–6 months to standard PBRT, and second, whether a further benefit is realized from the addition of pelvic lymph node radiotherapy (PLNRT) to that combination. The benefit of adding androgen deprivation therapy (ADT) to radiotherapy is well-established in men treated primarily for prostate cancer; however, there is much less evidence supporting ADT use routinely in men treated for salvage after prostatectomy11,12 and considerable controversy in terms of the selection of patients for ADT.13 The SPPORT trial provides new insights into the use of STADT with postoperative radiotherapy and describes for the first time the impact of adding pelvic lymph node treatment on disease progression and associated side effects.
PATIENTS AND METHODS
Design Overview
The hypothesis of the SPPORT trial was that treatment intensification via the addition of neoadjuvant and concurrent short term ADT (STADT) to PBRT and then the further addition of PLNRT would result in incremental improvements in FFP. The three treatment arms consisted of PBRT alone (Arm 1), PBRT plus STADT (Arm 2), and PBRT plus PLNRT plus STADT (Arm 3). The primary endpoint included a biochemical failure definition (PSA nadir +2, Phoenix definition14), chosen based on association with clinical failure (Supplementary Table S1) using a large multi-institutional database.15 The Phoenix definition is widely used in men treated primarily with RT for prostate cancer and was as good or better than a number of other potential definitions in terms of sensitivity, specificity, and positive predictive value for clinical failure. The anticipated freedom from nadir+2 biochemical failure rate at five years in the PBRT alone arm of 70% was based on this multi-institutional cohort,15 which was used to inform the sample size of the trial.
The trial was supported by the NCI Cancer Trials Support Unit (NCT00567580). Patients were consented and enrolled at institutional sites with IRB approval. This was an international trial, with patient accruals in the US, Canada and Israel. The NCI reviewed and approved the trial design and the final manuscript but played no role in data collection, analysis, interpretation of the results, or writing of the report. Authors Alan Pollack, Theodore Karrison, and Wendy Seiferheld had access to the data and were responsible for the decision to submit the manuscript.
Patient Eligibility
Eligible patients included those who after prostatectomy for adenocarcinoma of the prostate had a persistently detectable or an initially undetectable and rising PSA of ≥0.1 and <2.0 ng/mL. Patients with and without lymphadenectomy (N0/Nx) were eligible if there was no clinical or pathologic evidence of lymph node involvement. Eligibility also included those with pT2 or pT3 disease, prostatectomy Gleason score 9 or less, Zubrod performance status16 of 0–1, age ≥18, adequate bone marrow function (platelets ≥ 100,000 cells/mm3, hemoglobin ≥ 10.0 g/dl), aspartate aminotransferase (AST) or alanine aminotransaminase (ALT) < 2 × the upper limit of normal, serum total testosterone ≥ 40% of the lower limit of normal, and no evidence of distant metastasis on Tc99m bone scan or CT of the abdomen and pelvis.
Patients with a palpable prostatic fossa mass on digital rectal exam, pN1 disease, ADT started more than 6 months prior to prostatectomy or given ADT for more than 3 months after prostatectomy, chemotherapy for prostate cancer, primary treatment of the prostate prior to prostatectomy, prior malignancy within five years (except non-melanomatous skin cancer or superficial bladder cancer), history of inflammatory bowel disease, or other significant comorbidities, were not eligible. (See Supplementary Methods for full inclusion/exclusion criteria.)
Treatments
The standard PBRT consensus clinical target volume (CTVp) per Michalski et al17 was used. A range of PBRT total doses to the planning target volume (PTVp; see Supplementary Methods) were allowed, from 64.8 to 70.2 Gy at 1.8 Gy per fraction daily, as there were emerging data from retrospective series suggesting that higher doses might reduce progression rates. For Arm 3 patients, the PLNRT CTVn included the obturator, external iliac, proximal internal iliac, presacral and common iliac nodes, estimated using the vascular structures, up to the level of L5-S1.18 The PTVn was to be treated to 45 Gy at 1.8 Gy per fraction, and then a volume reduction made to the PTVp for the remaining 19.8–25.2 Gy.
STADT was planned to start within 6 weeks of registration and was administered to patients in Arms 2 and 3 for a total 4–6 months, starting 2 months before the initiation of RT. A combination of an antiandrogen, either flutamide at 250 mg p.o. TID or bicalutamide at 50 mg p.o. QD, and long acting LHRH agonist (analogues approved by the FDA or Health Canada for Canadian institutions) injections were used. Antiandrogen therapy was planned to begin at approximately the same time as the initial LHRH agonist injection but could be started up to two weeks earlier. The timing and length of ADT was referenced to the LHRH agonist injections and was specified at enrollment. Antiandrogen administration was planned for 4 months, ending at the completion of RT. The ADT treatments were not blinded.
Assessments
Prior to radiotherapy, a complete blood count (CBC), AST, ALT, PSA and testosterone were obtained, and an AUA symptom index19 (AUASI) questionnaire was completed. Interval quality of life assessments and neurocognitive function were also done and will be reported separately. CTCAEv3.020 was used to monitor acute and late toxicity at every protocol specified clinic visit. During radiotherapy, the patient was seen and evaluated weekly. During week 6 a CBC, AST, ALT and testosterone were planned to be obtained, along with completion of an AUASI questionnaire. After radiotherapy, AST or ALT was planned at 1.5 mo, 3 mo and 6 mo, while a CBC was to be obtained at 3 and 6 mo. PSA was planned at 1.5 mo and 3 mo, then at 3 mo intervals for the remainder of the first two years, and then at 6 mo intervals unless the PSA was ≥0.2 ng/mL, in which case PSA was obtained at 3 mo intervals. CT or MRI of the pelvis and Tc99m bone scans were performed in follow-up as clinically indicated.
Statistical Analysis
The primary endpoint was FFP at 5 years, with an event defined as the first occurrence of biochemical failure by the Phoenix definition14 (PSA ≥ 2 ng/ml over the nadir PSA), clinical failure (local, regional or distant), or death from any cause. The initiation of second salvage therapy prior to the primary endpoint criteria being met was strongly discouraged and resulted in censoring to avoid potential bias. A sensitivity analysis was also performed in which such patients were not censored. Local failure was defined as the development of a new palpable abnormality in the prostate bed. Regional metastasis was defined as radiographic evidence of pelvic lymphadenopathy (lymph node size ≥ 1.5 cm) in a patient without the diagnosis of a hematologic/lymphomatous disorder associated with adenopathy. Distant metastasis was defined by imaging (e.g., bone scan, CT, MRI). Two investigators (Sandler and Balogh) independently reviewed the cause of death and adjudication was done by a third investigator (Pollack).
The sample size calculation was based on an assumed primary FFP rate at 5 years for Arm 1 of 70%, a hypothesized 10% improvement in patients treated in Arm 2 to 80%, and a 20% improvement in patients treated in Arm 3 to 90%. The sample size was based on the backward elimination decision rule described in Chen and Simon21 because the three treatments can be ordered in terms of decreasing preference from a toxicity standpoint. Consequently, for evaluation of efficacy the objective was to decide among three one-sided alternatives: a) Arm 3 is better than both Arms 1 and 2, b) Arm 3 is not better than Arm 2 but Arm 2 is better than Arm 1, or c) both arms 3 and 2 are not better than Arm 1. In the backward elimination procedure, Arm 3 is first compared with Arm 2. If significantly better (Z-statistic >1.6249), Arm 2 is eliminated and Arm 3 is then compared with Arm 1 at a critical Z-value of 2.0768. If Arm 3 is not significantly better than Arm 2, Arm 2 is compared with Arm 1. The critical values for each test were chosen such that the overall alpha level (probability of selecting either arm 2 or arm 3 if all three arms were equal) was maintained at the one-sided 0.025 level. To detect the postulated 10% improvements in 5-year FFP, 529 patients per arm were required to provide 90% power using the Chen and Simon approach. The final accrual target was 1764 (588 per arm) to allow for 10% non-eligible upon review of eligibility data. Patients underwent randomization to the three groups according to the permuted-block scheme of Zelen22 stratified by seminal vesicle involvement (no or yes), Gleason score (≤7 vs. 8–9), baseline PSA level (≥0.1 and ≤1.0 vs. >1.0 and <2.0 ng/mL), and pathologic stage (pT2 and margin negative vs. other).
Three interim analyses were planned to enable early stopping for efficacy or futility (Supplementary Table S2). For efficacy, a Haybittle-Peto (HP) boundary requiring p<0.001 was required.23 Futility testing was based on the Freidlin and Korn method.24 Details of the interim testing procedures are provided in the Supplementary Methods. The three interim analyses were planned when there were 397, 794, and 1191 eligible patients with 5 yr of potential follow-up from the randomization date. At the third interim analysis, the HP efficacy boundary was crossed for Arm 3 vs. Arm 1 and the findings released. In addition to comparison of five-year FFP rates, the overall FFP curves were estimated using the Kaplan-Meier method and compared via a logrank test. Cox25 regression models were fit to estimate the hazard ratio (HR), both unadjusted and adjusted for the four stratification factors, age (<65 vs. ≥65), and race (white vs. other) as stipulated in the protocol. Secondary endpoints included local failure, regional failure, distant metastases, biochemical failure according to the Phoenix definition (nadir + 2 ng/ml), alternative biochemical failure (PSA ≥ 0.4 and a second rise above nadir or start of second salvage therapy), castrate resistant disease (three rises in PSA during second salvage androgen deprivation therapy), cause-specific mortality (death due to prostate cancer or complications of protocol treatment [centrally reviewed] or death following clinical or biochemical progression in the absence of or after the initiation of any salvage therapy), overall survival, and toxicity. These endpoints (with the exception of overall survival) were analyzed by estimating cumulative incidence curves, treating death as a competing risk, followed by logrank tests and comparison of the cause-specific hazard rates.
Two post-hoc endpoints were analyzed to contextualize the findings. Metastasis Free Survival (MFS; time to distant metastasis or death from any cause), and time to initiation of second salvage ADT. Additional details on the secondary and post-hoc analyses are provided in the Supplementary Methods. Of note, one-sided p-values are denoted as “1p” for emphasis. Declarations of statistical significance for the primary endpoint (5-year FFP rates) in this report are based upon the HP boundary when referring to the interim findings and the Chen-Simon critical values for the final results, while those for logrank tests and Cox hazard ratios for FFP, as well as secondary endpoints, are based on 1p<0.0125 (to allow for multiple comparisons). The exception is toxicity, which used a per-protocol specified 1p<0.025. The cutoff date for the data included in this report was May 26, 2021.
RESULTS
Patients
The trial accrued 1792 patients over a 7 yr period from February, 2008 to March, 2015 (Supplementary Figure S1). The rate of accrual was below that planned at first because PSA doubling time calculations were required. When the PSA doubling time requirement was eliminated, the accrual rate increased and the accrual goal was met ahead of schedule. In the current analysis, PSA doubling time was only available in 471 patients (Table 1); however, the protocol arms were well balanced. Figure 1 displays the CONSORT diagram for enrollment, eligibility, and completion of treatment per protocol specifications. There were 76 patients who were randomized but subsequently found to have been ineligible and these patients were excluded from the analyses.
Table 1.
Demographic and Clinical Characteristics of the Patients at Baseline
| PBRT Alone (n=564) |
PBRT+STADT (n=578) |
PLNRT+PBRT+ STADT (n=574) |
Total (n=1716) |
|||||
|---|---|---|---|---|---|---|---|---|
| n | % | n | % | n | % | n | % | |
|
| ||||||||
| Age(Years) | ||||||||
| Mean | 63.8 | 63.9 | 63.9 | 63.9 | ||||
| Median | 64 | 64 | 64 | 64 | ||||
| Min - Max | 42 – 84 | 39 – 80 | 44 – 80 | 39 – 84 | ||||
| ≤49 | 19 | 3.4 | 15 | 2.6 | 8 | 1.4 | 42 | 2.4 |
| 50–59 | 118 | 20.9 | 137 | 23.7 | 138 | 24.0 | 393 | 22.9 |
| 60–69 | 307 | 54.4 | 299 | 51.7 | 307 | 53.5 | 913 | 53.2 |
| ≥70 | 120 | 21.3 | 127 | 22.0 | 121 | 21.1 | 368 | 21.4 |
| Race | ||||||||
| American Indian/Alaska Native | 0 | 0.0 | 0 | 0.0 | 5 | 0.9 | 5 | 0.3 |
| Asian | 3 | 0.5 | 6 | 1.0 | 8 | 1.4 | 17 | 1.0 |
| Black or African American | 74 | 13.1 | 69 | 11.9 | 77 | 13.4 | 220 | 12.8 |
| Native Hawaiian or Other Pacific Islander | 1 | 0.2 | 4 | 0.7 | 0 | 0.0 | 5 | 0.3 |
| White | 464 | 82.3 | 482 | 83.4 | 474 | 82.6 | 1420 | 82.8 |
| More than one race | 3 | 0.5 | 0 | 0.0 | 0 | 0.0 | 3 | 0.2 |
| Unknown or not reported | 19 | 3.4 | 17 | 2.9 | 10 | 1.7 | 46 | 2.7 |
| Ethnicity | ||||||||
| Hispanic or Latino | 21 | 3.7 | 23 | 4.0 | 30 | 5.2 | 74 | 4.3 |
| Not Hispanic or Latino | 511 | 90.6 | 527 | 91.2 | 517 | 90.1 | 1555 | 90.6 |
| Unknown | 32 | 5.7 | 28 | 4.8 | 27 | 4.7 | 87 | 5.1 |
| Zubrod Performance Status | ||||||||
| 0 | 522 | 92.6 | 539 | 93.3 | 540 | 94.1 | 1601 | 93.3 |
| 1 | 42 | 7.4 | 39 | 6.7 | 34 | 5.9 | 115 | 6.7 |
| Pathologic Seminal Vesicle Involvement | ||||||||
| No | 482 | 85.5 | 494 | 85.5 | 488 | 85.0 | 1464 | 85.3 |
| Yes | 82 | 14.5 | 84 | 14.5 | 86 | 15.0 | 252 | 14.7 |
| Pathological Tumor Stage | ||||||||
| T2 | 292 | 51.8 | 317 | 54.8 | 304 | 53.0 | 913 | 53.2 |
| pT3 Extraprostatic extension NOS | 13 | 2.3 | 15 | 2.6 | 18 | 3.1 | 46 | 2.7 |
| pT3a Extraprostatic extension | 177 | 31.4 | 162 | 28.0 | 166 | 28.9 | 505 | 29.4 |
| pT3b Seminal vesicle invasion | 82 | 14.5 | 84 | 14.5 | 86 | 15.0 | 252 | 14.7 |
| Gleason | ||||||||
| 4 | 0 | 0.0 | 1 | 0.2 | 1 | 0.2 | 2 | 0.1 |
| 5 | 3 | 0.5 | 1 | 0.2 | 5 | 0.9 | 9 | 0.5 |
| 6 | 80 | 14.2 | 85 | 14.7 | 89 | 15.5 | 254 | 14.8 |
| 7: 3+4 | 226 | 40.1 | 240 | 41.5 | 221 | 38.5 | 687 | 40.0 |
| 7: 4+3 | 153 | 27.1 | 148 | 25.6 | 156 | 27.2 | 457 | 26.6 |
| 7: primary/secondary not indicated | 9 | 1.6 | 5 | 0.9 | 3 | 0.5 | 17 | 1.0 |
| 8 | 57 | 10.1 | 60 | 10.4 | 57 | 9.9 | 174 | 10.1 |
| 9 | 36 | 6.4 | 38 | 6.6 | 42 | 7.3 | 116 | 6.8 |
| Prostatectomy Margins | ||||||||
| Positive | 288 | 51.1 | 289 | 50.0 | 284 | 49.5 | 861 | 50.2 |
| Negative | 267 | 47.3 | 284 | 49.1 | 287 | 50.0 | 838 | 48.8 |
| Unknown | 9 | 1.6 | 5 | 0.9 | 3 | 0.5 | 17 | 1.0 |
| Pelvic Lymphadenectomy | ||||||||
| No | 189 | 33.5 | 207 | 35.8 | 209 | 36.4 | 605 | 35.3 |
| Yes | 375 | 66.5 | 371 | 64.2 | 365 | 63.6 | 1111 | 64.7 |
| Number of Lymph Nodes Examined* | (n=349) | (n=336) | (n=336) | (n=1021) | ||||
| Mean | 7.2 | 7.8 | 7.2 | 7.4 | ||||
| Median | 5 | 6 | 5 | 6 | ||||
| Min - Max | 0 – 34 | 1 – 54 | 1 – 32 | 0 – 54 | ||||
| Pre-RT Entry PSA (ng/ml) | ||||||||
| Mean | 0.47 | 0.51 | 0.47 | 0.48 | ||||
| Median | 0.32 | 0.40 | 0.32 | 0.35 | ||||
| Min - Max | 0.1 – 1.96 | 0.1 – 1.93 | 0.1 – 1.93 | 0.1 – 1.96 | ||||
| ≥ 0.1 and ≤ 0.2 ng/ml | 155 | 27.5 | 126 | 21.8 | 154 | 26.8 | 435 | 25.3 |
| > 0.2 and ≤ 0.5 ng/ml | 247 | 43.8 | 256 | 44.3 | 247 | 43.0 | 750 | 43.7 |
| > 0.5 and ≤ 1.0 ng/ml | 105 | 18.6 | 130 | 22.5 | 114 | 19.9 | 349 | 20.3 |
| > 1.0 and < 2.0 ng/ml | 57 | 10.1 | 66 | 11.4 | 59 | 10.3 | 182 | 10.6 |
| Time from Surgery to Randomization | ||||||||
| >0 and ≤6 months | 47 | 8.6 | 29 | 5.2 | 26 | 4.6 | 102 | 6.1 |
| >6 and ≤12 months | 90 | 16.4 | 111 | 19.8 | 95 | 16.9 | 296 | 17.7 |
| >12 and ≤18 months | 55 | 10.0 | 61 | 10.9 | 71 | 12.6 | 187 | 11.2 |
| > 18 months | 356 | 65.0 | 361 | 64.2 | 371 | 65.9 | 1088 | 65.0 |
| Median (years) | 2.3 | 2.1 | 2.1 | 2.2 | ||||
| Min - Max | 0.1 – 20.5 | 0.1 – 17.6 | 0.1 – 17.7 | 0.1 – 20.5 | ||||
| Post-operative PSA Doubling Time** | (n=156) | (n=156) | (n=159) | (n=471) | ||||
| >0 and ≤6 months | 34 | 21.8 | 32 | 20.5 | 32 | 20.1 | 98 | 20.8 |
| >6 and ≤12 months | 54 | 34.6 | 55 | 35.3 | 62 | 39.0 | 171 | 36.3 |
| >12 and ≤18 months | 26 | 16.7 | 33 | 21.2 | 27 | 17.0 | 86 | 18.3 |
| > 18 months | 42 | 26.9 | 36 | 23.1 | 38 | 23.9 | 116 | 24.6 |
Data are not available for all patients who underwent a lymphadenectomy and these patients were excluded from the lymph node number calculations.
The requirement to record PSA doubling time prior to enrollment was dropped in an amendment to the protocol. Only n=471 values were available.
Figure 1:
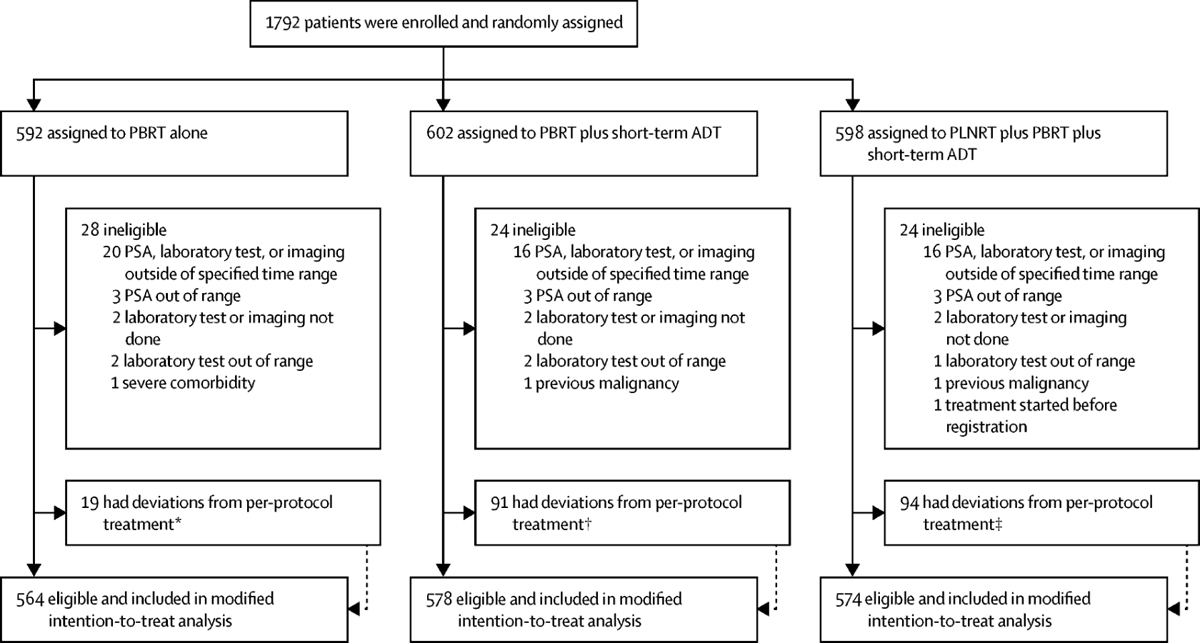
Consort diagram showing enrollment, randomization, and completion of treatment.
†8 withdrew, 1 came off treatment for other complicating disease, and 10 stopped for other or unknown reasons.
††28 due to side effects, 12 withdrawals, 1 received alternative therapy, and 50 for other/unknown reasons.
†††27 due to side effects, 1 death, 14 withdrawals, 1 alternative therapy, 2 because of other complicating diseases, and 49 for other/unknown reasons.
Patient and tumor characteristics are shown in Table 1. The arms were well-balanced. Overall, about 15% had pT3b disease, 53% had pT2 disease, 50% had positive margins, and 17% had Gleason score ≥8 disease. Pelvic lymphadenectomy was done in 65%, with a median number of lymph nodes removed of 6. The median PSA at protocol registration was 0.35 and 25% had a value of 0.2 or less. There was no significant correlation between PSA and Gleason score (Spearman rank correlation = −0.025, p=0.30). The median interval between surgery and RT treatment was 2.3, 2.1 and 2.1 years for Arms 1, 2, and 3, respectively. Median age at entry was 64 yr.
Adherence to Protocol Treatment
IMRT was used in 87% of patients. Radiation administration was assessed centrally in all patients. Total dose, fractionation, and the time window for delivery were performed per protocol in over 95% of patients in all three treatment arms (Supplementary Table S3A). The target volume to organs at risk was acceptable in over 90% overall and within each arm. Overall, RT delivery was acceptable in 94% of patients. Central review of compliance with ADT therapy was conducted on a random sample of 45% of the patients in Arms 2 and 3, stratified by region and period of enrollment (Supplementary Tables S3B and S3C). There were 76% and 86% per protocol/acceptable (receiving 80–120% of protocol dose and without delay of more than two weeks) in Arms 2 and 3, respectively, for the anti-androgen component and 86% and 89% per protocol/acceptable in Arms 2 and 3 for the LHRH targeted treatment component. Additional information regarding RT and androgen deprivation therapy delivery as reported by the sites are given in Supplementary Table S4A–S4C. The median radiotherapy dose to the prostate bed was 68.4 Gy and the median length of STADT (LHRH component) was 6 months.
Biochemical and Clinical Disease Failure Endpoints, and Survival
Primary Endpoint
Median follow-up time among surviving patients is 8.2 years (range 0–12.4 yr). The third interim analysis of the primary endpoint was reported to the DMC in July 2018. For this interim analysis there were 1191 eligible patients with 5-year FFP rates for Arms 1, 2, and 3 of 71.3%, 82.3% and 89.6% (Supplementary Figure S2A). When compared to Arm 1, Arm 3 exceeded the HP efficacy stopping boundary, with a difference in 5 yr rates of 18.3% ± 2.9% (±standard error [SE], 1p<0.001). Arm 3 was then compared to Arm 2, yielding a difference of 7.4% ± 2.5% (1p = 0.002), which was close to, but did not cross, the HP boundary. The difference between Arms 2 and 1 was 11.0% ± 3.1% (1p<0.001). Similar results were obtained for all 1716 eligible patients for this final planned analysis (Figure 2A). The 5 yr FFP rates for all eligible patients were 70.9%, 81.3% and 87.4% for Arms 1, 2 and 3, respectively. Both Arm 3 (PBRT + PLNRT + STADT) and Arm 2 (PBRT + STADT) were significantly different from Arm 1 (PBRT alone), with differences of 16.5% ± 2.5% for Arm 3 vs. Arm 1 and 10.4% ± 2.6% for Arm 2 vs. Arm 1) with both 1p < 0.001. The addition of PLNRT to PBRT + STADT (i.e., Arm 3 vs. 2) resulted in an increase in 5 yr FFP of 6.1% ± 2.2%, 1p = 0.003. Per the Chen-Simon procedure, Arm 3 can be declared superior to both Arms 1 and 2. In a sensitivity analysis of all eligible patients, in which 71 patients who were administered salvage therapy before having an event were not censored, the findings were very similar. (Supplementary Figure S2B).
Figure 2:
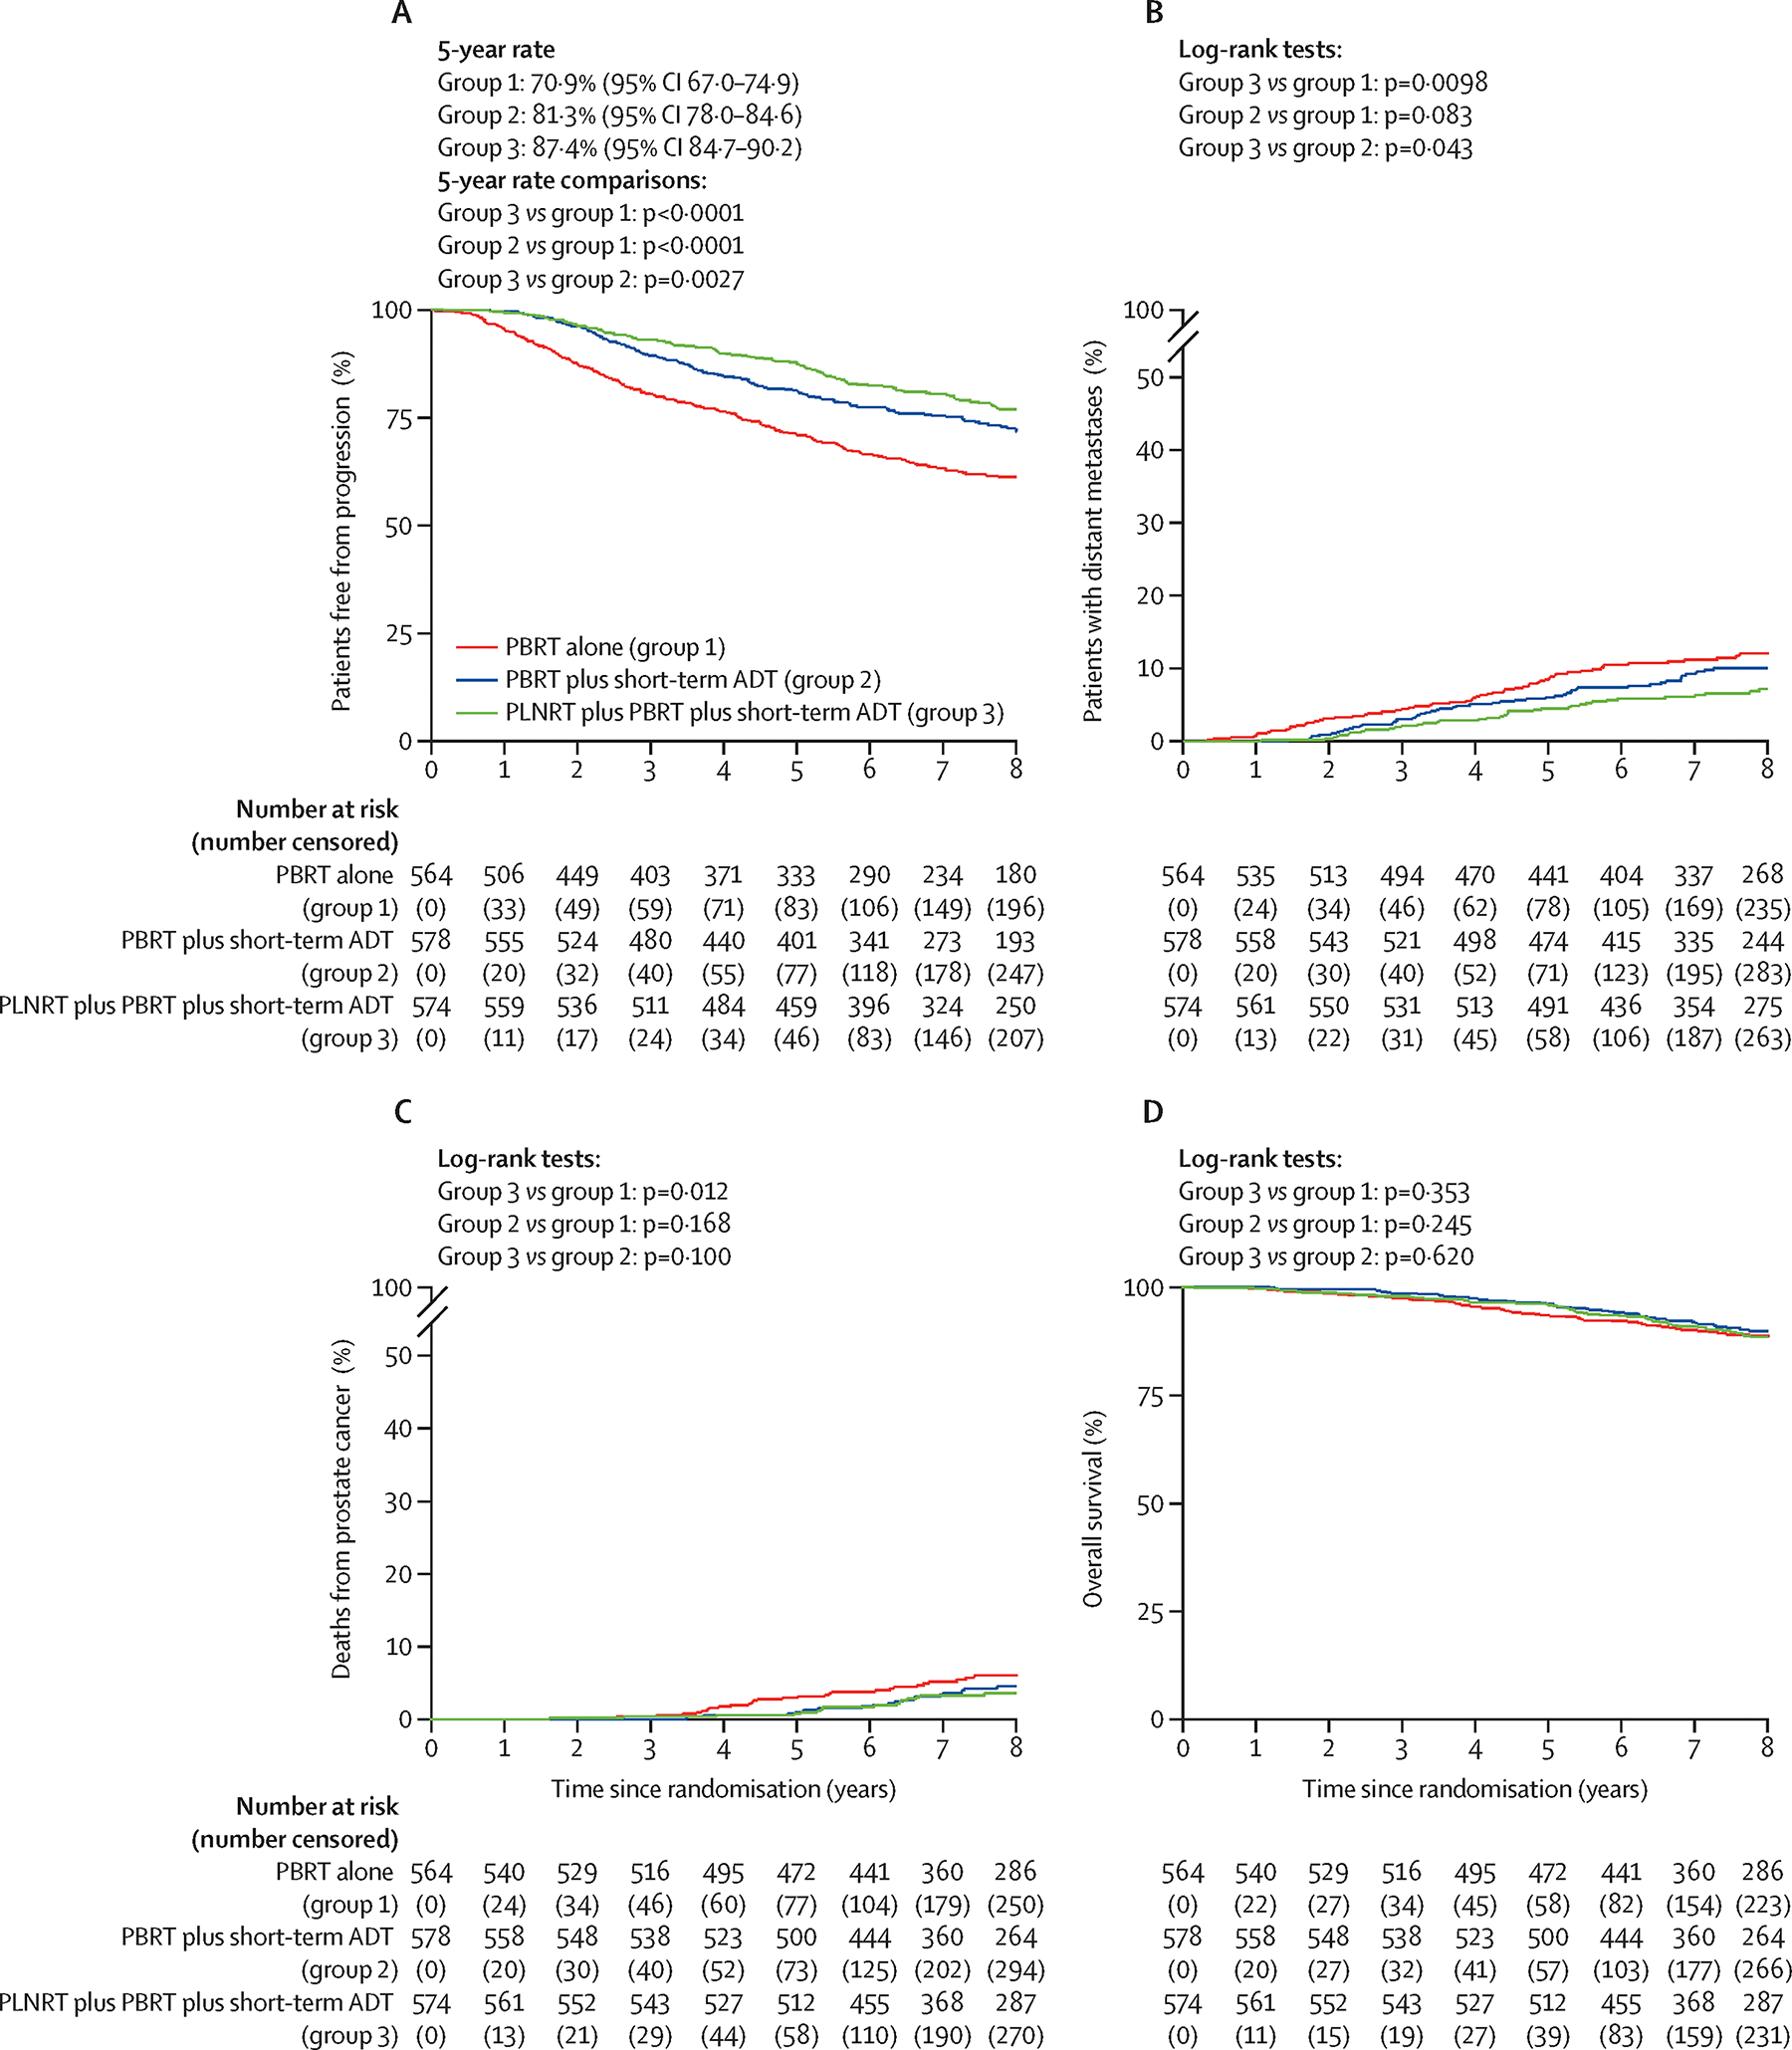
Kaplan-Meier estimates and cumulative incidence curves: (A) Freedom from progression, (B) Distant metastases, (C) Prostate-cancer death, (D) Overall survival.
Estimated treatment effects on FFP based on univariate and multivariable Cox regression models adjusting for entry PSA level, pathologic stage, seminal vesicle (SV) involvement, Gleason score, age, and race are shown in Table 2, which also includes logrank p-values. Unadjusted and adjusted hazard ratios were quite similar. Adjusted hazard ratios for FFP were 0.50 (97.5% CI: 0.39–0.64) for Arm 3 relative to Arm 1, 0.60 (97.5% CI: 0.47–0.77) for Arm 2 relative to Arm 1, and 0.82 (97.5% CI: 0.63–1.07) for Arm 3 relative to Arm 2. Again, based on the Chen-Simon procedure, Arm 3 can be declared superior to both Arms 1 and 2. Significant (p<0.05) covariate effects obtained from the multivariate analysis of FFP (not shown in Table 2) were pre-RT entry PSA level (HR 1.83 between 1.0–2.0 ng/ml vs. 0.1–1.0 ng/ml, 95% CI: 1.42–2.36), SV involvement (HR 2.19 between yes vs. no, 95% CI: 1.75–2.74), and Gleason score (HR 2.05 between 8–9 vs. ≤7, 95% CI: 1.66–2.53).
Table 2.
Univariate and Multivariable Cox Regression Analyses
| Endpoint | #Events/n | Comparison | Unadjusted HR and CI1 | p-value2* | Adjusted HR and CI1 | p-value3* |
|---|---|---|---|---|---|---|
|
| ||||||
| Freedom from Progression | Arm1: 202/564 | Arm 3 vs. Arm 1 | 0.54 (0.42–0.69) | <0.001 | 0.50 (0.39, 0.64) | <0.001 |
| Arm2: 151/578 | Arm 2 vs. Arm 1 | 0.64 (0.50–0.82) | <0.001 | 0.60 (0.47, 0.77) | <0.001 | |
| Arm3: 140/574 | Arm 3 vs. Arm 2 | 0.82 (0.63–1.07) | 0.050 | 0.82 (0.63, 1.07) | 0.048 | |
| Distant Metastases | Arm1: 69/564 | Arm 3 vs. Arm 1 | 0.55 (0.35–0.85) | <0.001 | 0.52 (0.34, 0.81) | <0.001 |
| Arm2: 56/578 | Arm 2 vs. Arm 1 | 0.78 (0.52–1.17) | 0.083 | 0.74 (0.49, 1.11) | 0.047 | |
| Arm3: 41/574 | Arm 3 vs. Arm 2 | 0.70 (0.44–1.11) | 0.043 | 0.71 (0.45, 1.12) | 0.046 | |
| Prostate Cancer Death | Arm1: 36/564 | Arm 3 vs. Arm 1 | 0.54 (0.29–1.00) | 0.012 | 0.51 (0.27, 0.94) | 0.007 |
| Arm2: 29/578 | Arm 2 vs. Arm 1 | 0.79 (0.45–1.38) | 0.168 | 0.73 (0.42, 1.28) | 0.104 | |
| Arm3: 21/574 | Arm 3 vs. Arm 2 | 0.69 (0.36–1.32) | 0.099 | 0.70 (0.37, 1.32) | 0.103 | |
| Overall Survival | Arm1: 69/564 | Arm 3 vs. Arm 1 | 0.94 (0.64–1.37) | 0.353 | 0.93 (0.63, 1.36) | 0.332 |
| Arm2: 63/578 | Arm 2 vs. Arm 1 | 0.89 (0.60–1.31) | 0.245 | 0.87 (0.59, 1.29) | 0.213 | |
| Arm3: 69/574 | Arm 3 vs. Arm 2 | 1.05 (0.71–1.56) | 0.620 | 1.07 (0.72, 1.58) | 0.645 | |
| Biochemical Failure (Phoenix) | Arm1: 145/564 | Arm 3 vs. Arm 1 | 0.48 (0.36–0.66) | <0.001 | 0.47 (0.34, 0.64) | <0.001 |
| Arm2: 104/578 | Arm 2 vs. Arm 1 | 0.65 (0.49–0.87) | <0.001 | 0.63 (0.47, 0.84) | <0.001 | |
| Arm3: 83/574 | Arm 3 vs. Arm 2 | 0.74 (0.53–1.03) | 0.020 | 0.75 (0.54, 1.04) | 0.025 | |
| Alternative Biochemical Failure† | Arm1: 245/564 | Arm 3 vs. Arm 1 | 0.43 (0.34–0.55) | <0.001 | 0.40 (0.31, 0.51) | <0.001 |
| Arm2: 168/578 | Arm 2 vs. Arm 1 | 0.59 (0.47–0.74) | <0.001 | 0.57 (0.45, 0.71) | <0.001 | |
| Arm3: 133/574 | Arm 3 vs. Arm 2 | 0.71 (0.55–0.93) | 0.002 | 0.70 (0.54, 0.91) | 0.001 | |
| Time to 2nd Salvage ADT | Arm1: 157/564 | Arm 3 vs. Arm 1 | 0.36 (0.26–0.50) | <0.001 | 0.33 (0.24, 0.46) | <0.001 |
| Arm2: 109/578 | Arm 2 vs. Arm 1 | 0.62 (0.47–0.82) | <0.001 | 0.58 (0.44, 0.77) | <0.001 | |
| Arm3: 68/574 | Arm 3 vs. Arm 2 | 0.58 (0.41–0.81) | <0.001 | 0.58 (0.41, 0.81) | <0.001 | |
| Castrate Resistant Disease‡ | Arm1: 40/564 | Arm 3 vs. Arm 1 | 0.35 (0.18–0.69) | <0.001 | 0.33 (0.17, 0.66) | <0.001 |
| Arm2: 30/578 | Arm 2 vs. Arm 1 | 0.73 (0.43–1.26) | 0.100 | 0.68 (0.40, 1.18) | 0.058 | |
| Arm3: 15/574 | Arm 3 vs. Arm 2 | 0.47 (0.23–0.96) | 0.008 | 0.49 (0.24, 0.99) | 0.012 | |
| Local Failure | Arm1: 26/564 | Arm 3 vs. Arm 1 | 0.25 (0.10–0.65) | <0.001 | 0.26 (0.10, 0.65) | <0.001 |
| Arm2: 12/578 | Arm 2 vs. Arm 1 | 0.44 (0.20–0.97) | 0.009 | 0.43 (0.20, 0.94) | 0.008 | |
| Arm3: 8/574 | Arm 3 vs. Arm 2 | 0.62 (0.22–1.72) | 0.143 | 0.60 (0.21, 1.68) | 0.133 | |
| Regional Failure | Arm1: 41/564 | Arm 3 vs. Arm 1 | 0.29 (0.14–0.59) | <0.001 | 0.28 (0.14, 0.57) | <0.001 |
| Arm2: 22/578 | Arm 2 vs. Arm 1 | 0.51 (0.28–0.93) | 0.005 | 0.49 (0.27, 0.89) | 0.004 | |
| Arm3: 13/574 | Arm 3 vs. Arm 2 | 0.57 (0.26–1.25) | 0.051 | 0.57 (0.26, 1.24) | 0.052 | |
| Metastasis-Free Survival | Arm1: 109/564 | Arm 3 vs. Arm 1 | 0.81 (0.59–1.11) | 0.066 | 0.79 (0.57, 1.08) | 0.042 |
| Arm2: 93/578 | Arm 2 vs. Arm 1 | 0.82 (0.60–1.13) | 0.082 | 0.80 (0.58, 1.10) | 0.056 | |
| Arm3: 96/574 | Arm 3 vs. Arm 2 | 0.98 (0.71–1.36) | 0.455 | 0.98 (0.71, 1.36) | 0.454 | |
Arm 1: PBRT Alone; Arm 2: PBRT+NC-STADT; Arm 3: PLNRT+PBRT+NC-STADT
97.5% confidence interval, adjusted for PSA, stage, SV involvement, Gleason score, age, and race.
One-sided logrank test.
One-sided Wald test.
The P-value required for statistical significance for freedom from progression endpoint is based on the Chen-Simon critical values (see text). All remaining endpoints required a p-value of 1p<0.0125.
PSA ≥0.4 and a second rise above nadir or start of second salvage therapy.
Three rises in PSA after institution of second salvage androgen deprivation therapy
As shown in Table 1, the median pre-treatment PSA was 0.35 (rounded from 0.3475; the true median was used in all analyses, but is referred to as 0.35). Since there is some evidence that men with lower PSAs prior to salvage RT show less benefit from the addition of ADT,12,26 we examined FFP subdivided by the median pre-treatment PSA in an unplanned post hoc analysis. The forest plots in Figure 3, along with the corresponding Kaplan-Meier plots in Supplementary Figure S3A, show that when PSA was less than or equal to the median there was not a significant difference between Arm 2 and Arm 3 (logrank 1p=0.44, 1p=0.34 adjusted for covariates in Cox proportional hazards model); but both had significantly higher FFP rates than for Arm 1 (1p<0.001). When the PSA was >0.35 ng/mL (Fig 3 and Supplementary Fig S3B), FFP for Arm 3 was greater than for Arm 2; although not reaching statistical significance (logrank 1p=0.038, 1p=0.058 adjusted for covariates), while both Arms 3 and 2 fared significantly better than Arm 1 (1p<0.001). In the case of pathological stage/margins, SV involvement, and Gleason score, the effects were similar across subgroups.
Figure 3.
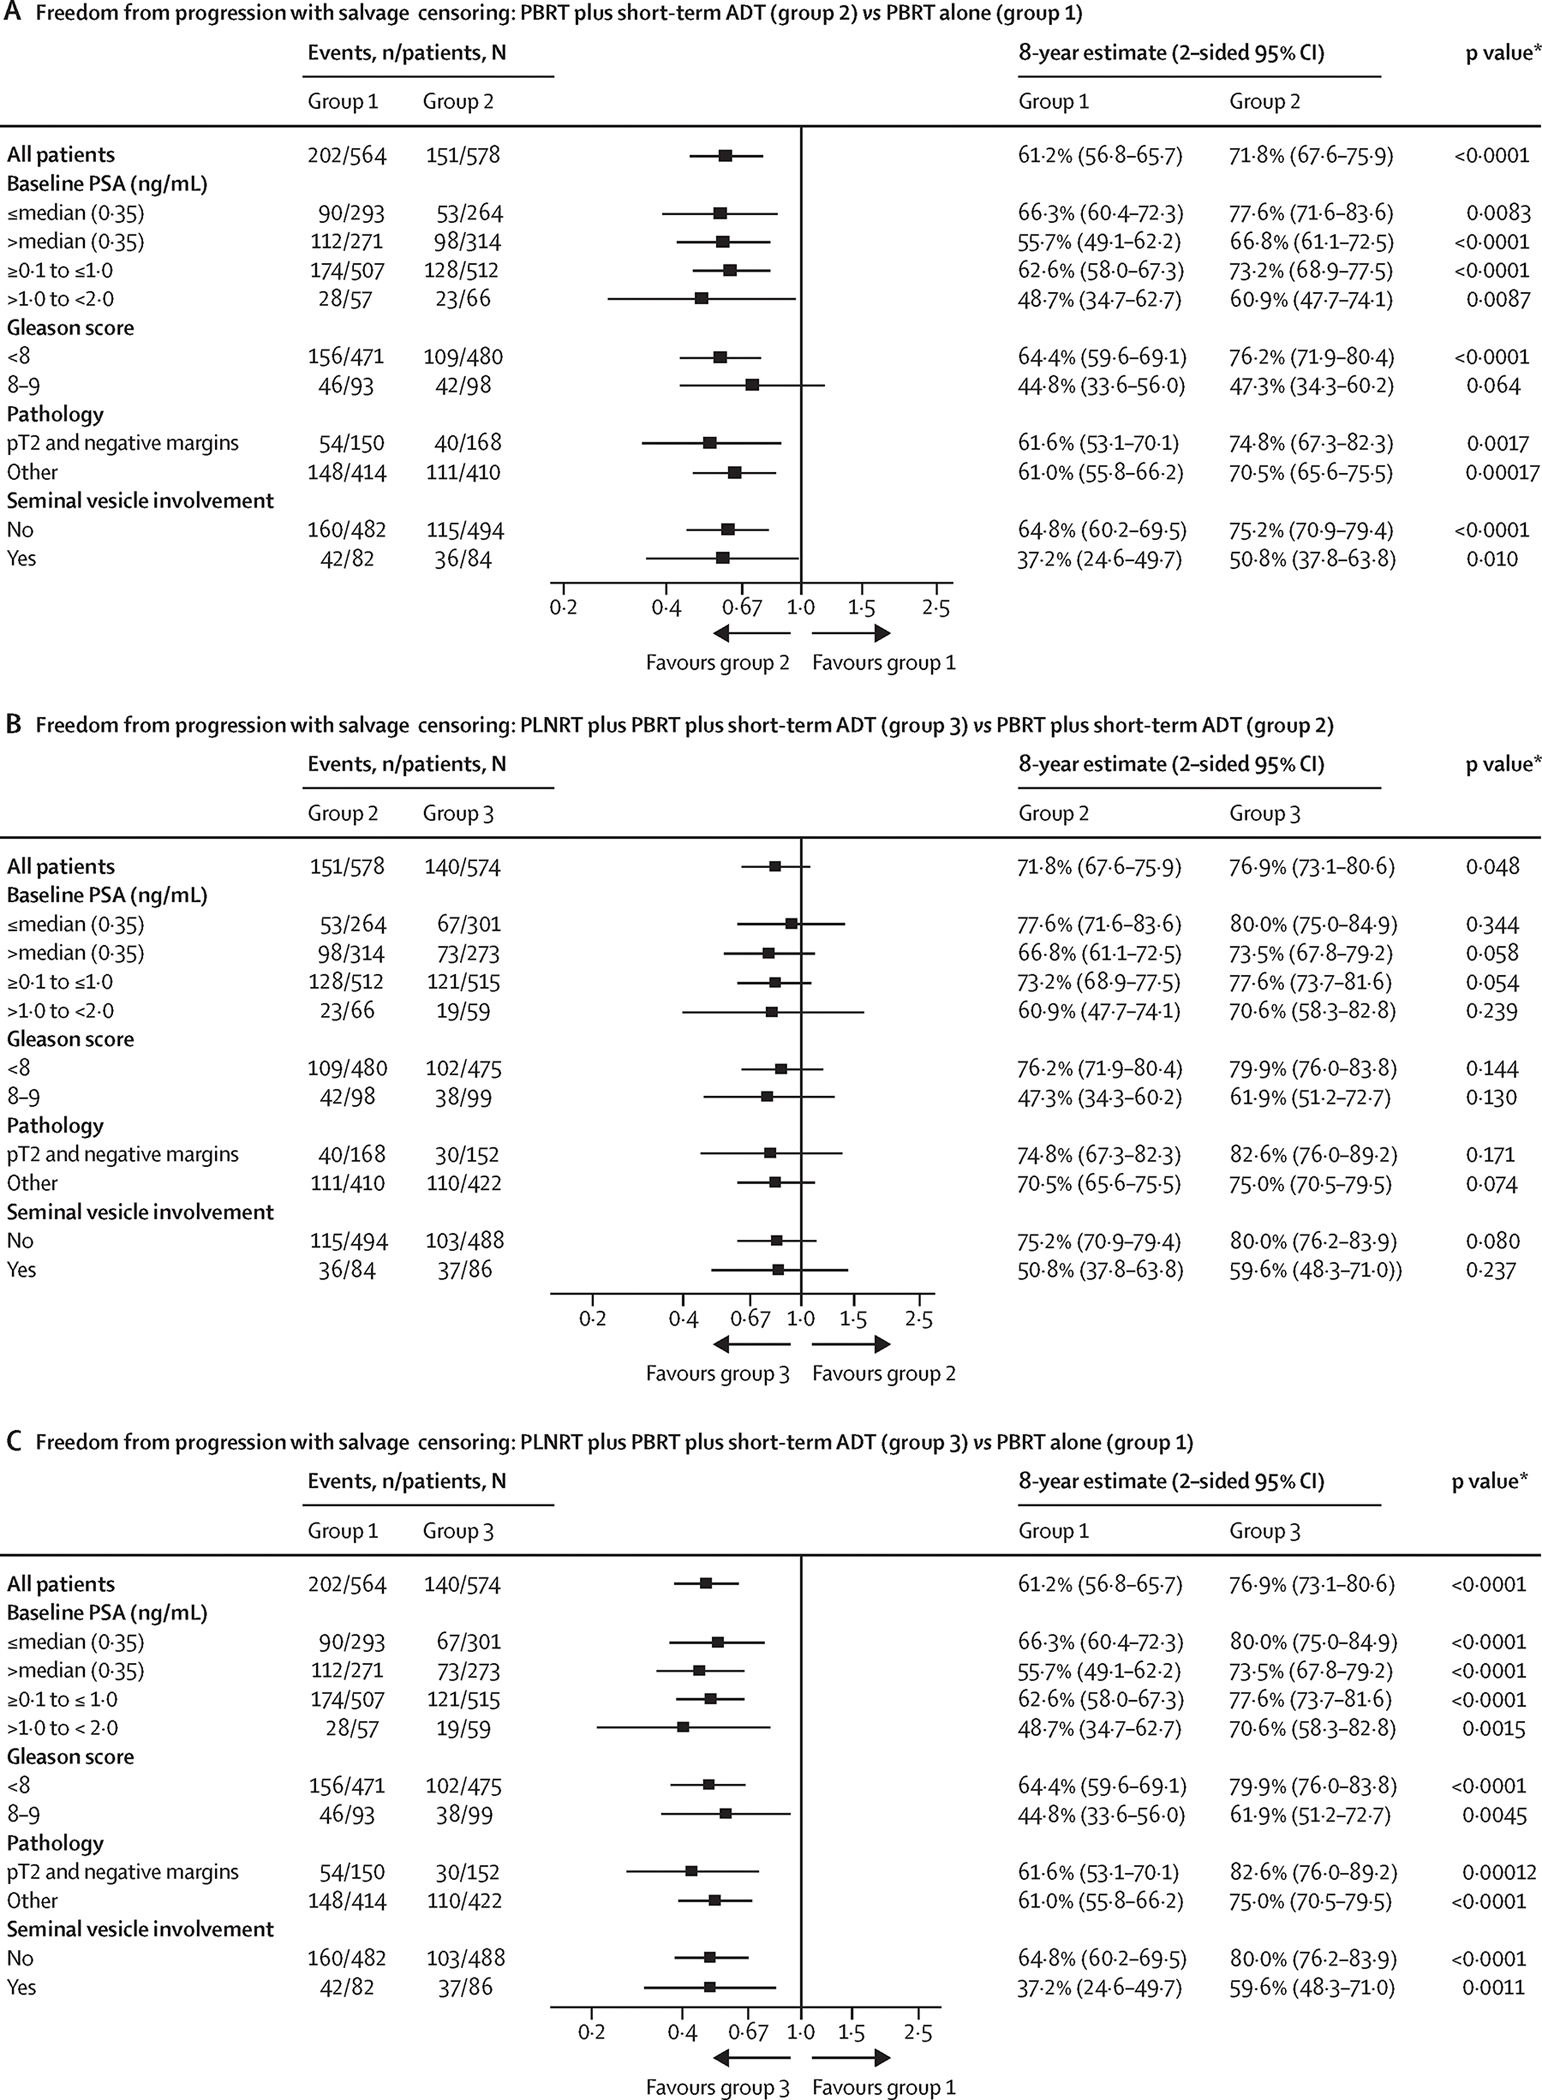
Forest plots showing effects of treatment on freedom from progression by subgroups: (A) Arm 2 vs Arm 1, (B) Arm 3 vs Arm 2, (C) Arm 3 vs Arm 1
Secondary Endpoints
Differences in the cumulative incidence of time to failure according to the alternative biochemical failure and Phoenix biochemical failure definitions with death as a competing event (Figure 4A, Supplemental Figure 4A, and Table 2) were concordant with that for FFP.
Figure 4.
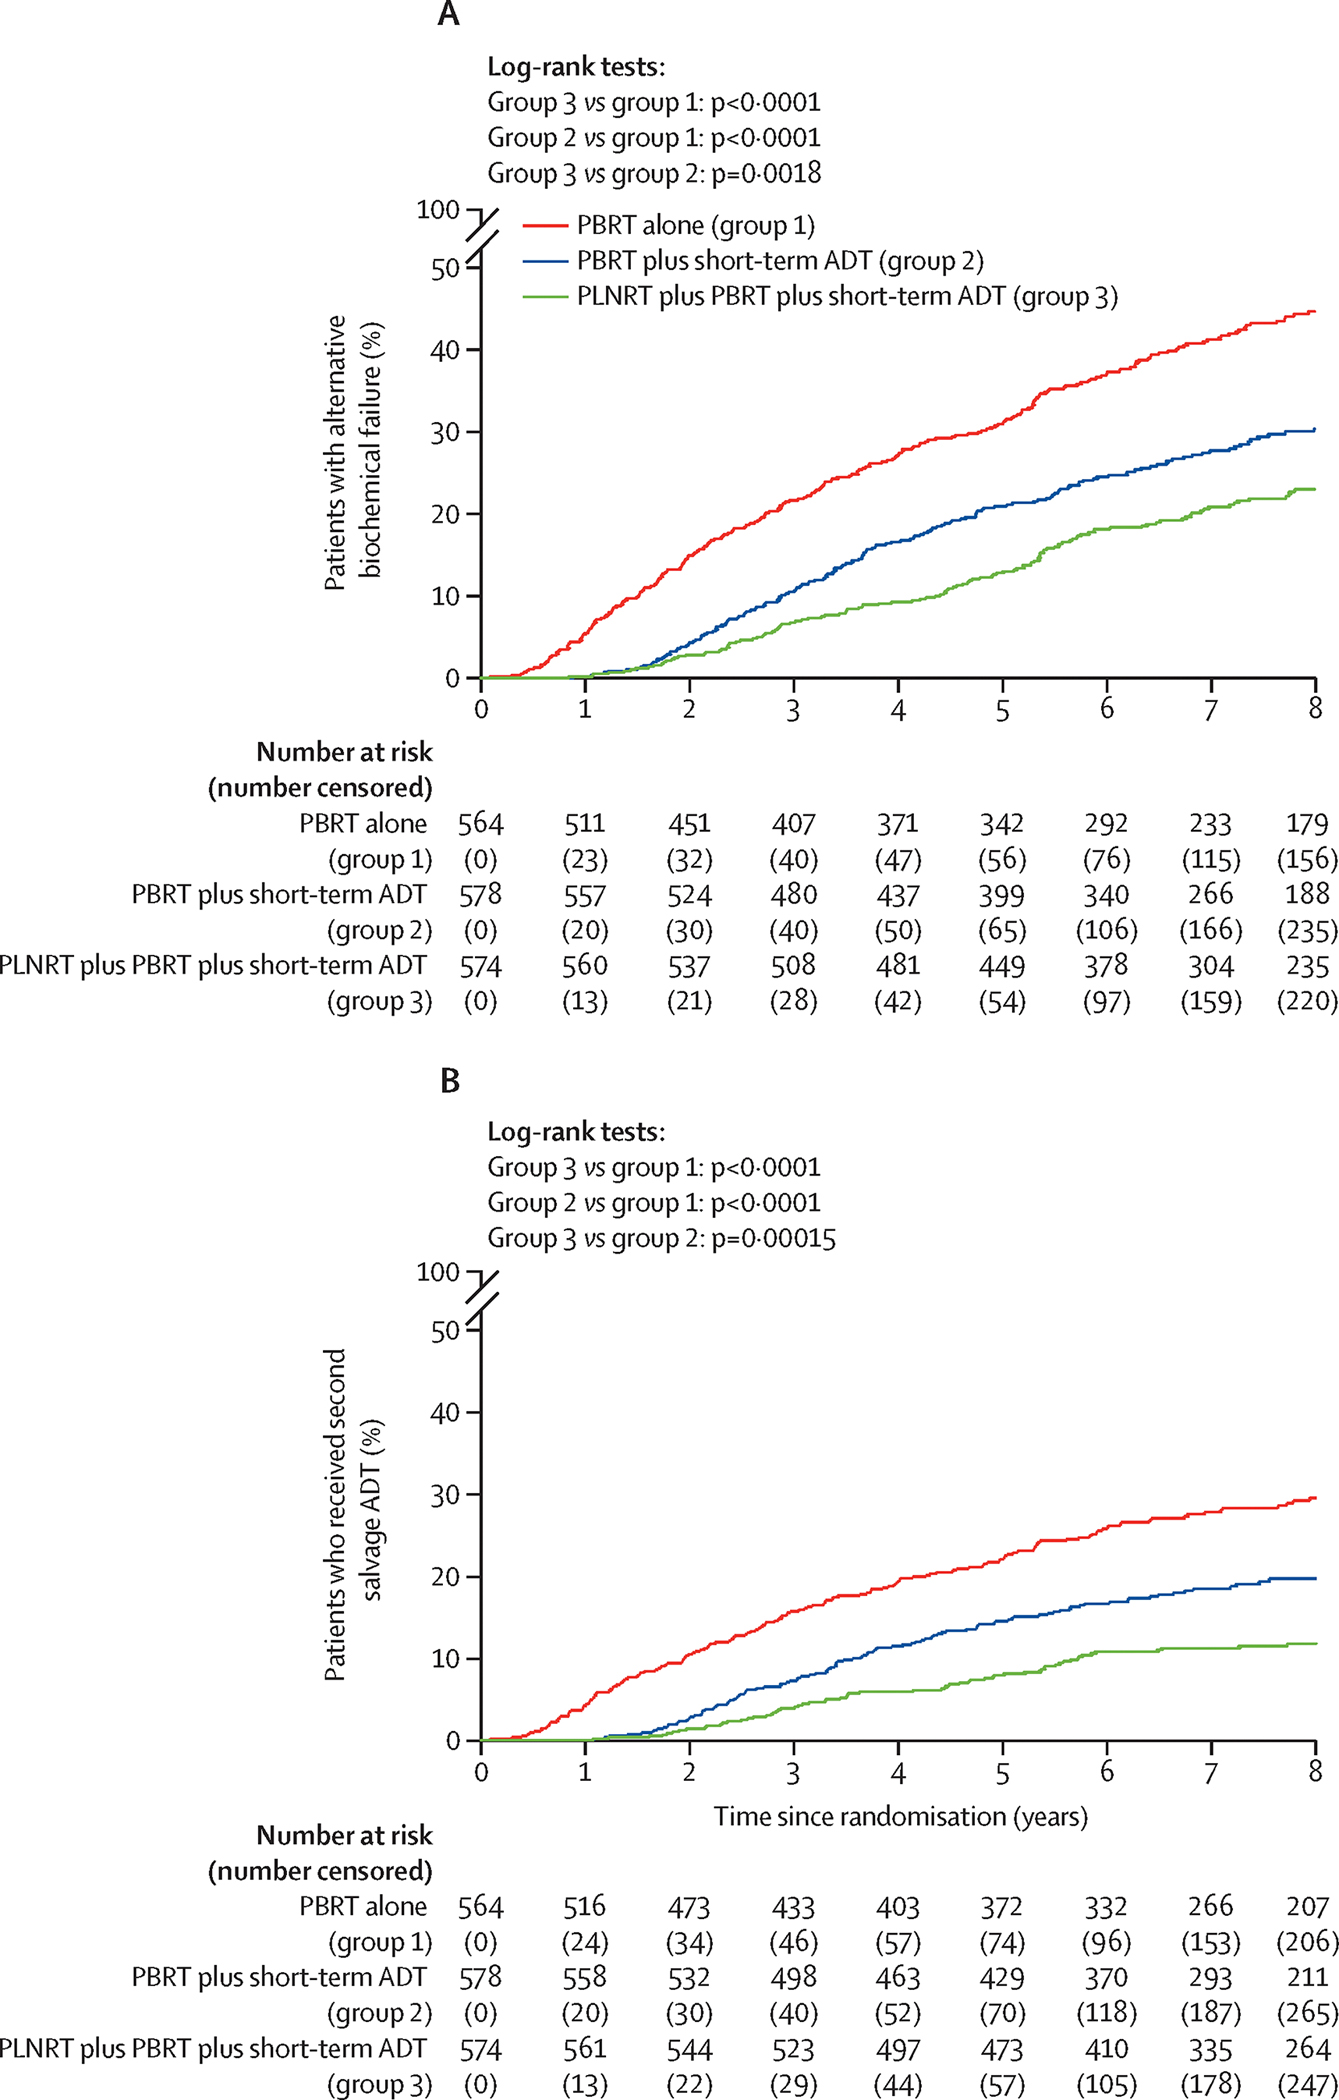
Cumulative incidence curves: (A) Alternative biochemical failure, (B) Second salvage androgen deprivation therapy.
There were also some trends seen for effects of the combined treatment arms on distant metastasis (DM). There were 69, 56 and 41 patients who developed DM in Arms 1, 2 and 3, respectively. As displayed in Figure 2B, incidence rates were lowest in Arm 3. The DM hazard ratio for Arm 3 vs Arm 1 was 0.55 (1p<0.001), for Arm 2 vs Arm 1 was 0.78 (1p=0.083), and for Arm 3 vs. Arm 2 was 0.70 (1p=0.043). Covariate-adjusted results were similar (Table 2). Only the Arm 3 vs. Arm 1 comparison surpassed the required significance level (1p<0.0125) for the DM secondary endpoint.
The incidence curves for prostate cancer related deaths as defined in the protocol (death due to prostate cancer [centrally verified] or death following clinical or biochemical progression in the absence of, or after, the initiation of any salvage therapy) are shown in Figure 2C. There were 86 such deaths: 36, 29, and 21 patients in Arms 1, 2 and 3, respectively. The cause-specific unadjusted HR between Arms 3 and 1 of 0.54 was statistically significant (1p=0.012), as was the slightly smaller adjusted HR of 0.51 (1p=0.007). These counts included 23 deaths following clinical/biochemical progression that were not classified as conclusively due to prostate cancer by the central review committee (Supplementary Table S5). There were no significant differences in overall survival (Fig. 2D and Table 2). Adjusted hazard ratios for overall survival were 0.93 (97.5% CI: 0.63–1.36) for Arm 3 relative to Arm 1, 0.87 (97.5% CI: 0.59–1.29) for Arm 2 relative to Arm 1, and 1.07 (97.5% CI: 0.72–1.58) for Arm 3 relative to Arm 2.
Although not a pre-specified endpoint, fewer men in Arms 2 and 3 were given second salvage androgen deprivation therapy (157, 109, and 68 patients in Arms 1, 2, and 3, respectively). The time from randomization until the initiation of second salvage ADT is depicted in Figure 4B. All pairwise comparisons were statistically significant (p<0.001) with hazard ratios of 0.36 for Arm 3 vs. Arm 1, 0.62 for Arm 2 vs. Arm 1, and 0.58 for Arm 3 vs. Arm 2. Covariate-adjusted results were again very similar to the unadjusted comparisons (Table 2). Additionally, Supplementary Table S6 shows that comparisons of time to second salvage therapy remained significant for those with entry PSAs below or above the median.
The results for the remaining secondary endpoints, i.e., castrate resistant disease, local failure, and regional failure are displayed in Supplementary Figures S4B–S4D and Table 2. In general, these results mirror those reported above. Significant differences were seen for the development of castrate resistant disease (Arm 3 vs. Arm 1 and Arm 3 vs. Arm 2), local failure (Arm 3 vs. Arm 1 and Arm 2 vs. Arm 1), and regional failure (Arm 3 vs. Arm 1 and Arm 2 vs. Arm 1). Finally, as another post-hoc endpoint, Supplementary Figure S4E shows Kaplan-Meier plots for metastasis-free survival where trends are seen but no significant differences; Table 2 provides unadjusted and adjusted hazard ratios. A summary of the patterns of failures is shown in Supplementary Table S7. The use of ADT in Arms 2 and 3 resulted in reductions in local and regional failures; although the greatest reductions were in those in whom the pelvic lymph nodes were treated (Arm 3), along with a concordant reduction in distant metastasis. A summary of 5-year event rates for all endpoints is given in Supplementary Table S8.
There were 350 patients who received 4 months (±0.5 mo) of LHRH treatment and 680 who received 6 months (±0.5 mo) in Arms 2 and 3 combined, with 121 patients not included because they did not meet these definitions (see Table S4C). The FFP curves for this nonrandomized comparison are shown in Supplementary Figure S5. The difference is not statistically significant (HR=0.87, 95% CI: 0.65–1.16, 2p=0.31). Adjusting for covariates yielded a slightly stronger result in favor of 6 months (adjusted HR=0.81, 95% CI: 0.63–1.04, 2p=0.10).
Toxicity
Acute and late toxicity were assessed prospectively using CTCAEv3.0 criteria and are summarized without attribution in Table 3. In terms of acute toxicity (≤3 mo after RT), 19.7% of the patients in Arm 1, 37.7% in Arm 2, and 44.6% in Arm 3 had a grade 2 or higher event (p<0.001). A similar gradient was observed with respect to grade 3 or higher acute adverse events. Patients in Arm 3 had a 1.4-fold greater odds of having a grade 3 or higher acute adverse event compared to Arm 2; in turn, patients in Arm 2 had 2.1-fold greater odds than patients in Arm 1. Significant differences were found for acute gastrointestinal (GI) toxicities and blood/bone marrow toxicities, but not for renal/genitourinary (GU) toxicities. Details of the types of acute and late events seen are provided in Supplementary Tables S9 and S10. The most obvious acute grade 2+ difference in GI adverse events between the arms was diarrhea, which was based on relatively few events for each arm at 4 of 11 overall GI events in Arm 1, 11 of 22 overall events in Arm 2, and 18 of 38 overall events in Arm 3. The acute blood/bone marrow difference between Arms 3 and 2 was related mostly to lymphopenia.
Table 3:
Frequency of Grade 2+ and Grade 3+ Adverse Events of Interest*
| Logistic Regression2 | |||||||||||||
|---|---|---|---|---|---|---|---|---|---|---|---|---|---|
| Arm 1 | Arm 2 | Arm 3 | Arm 2 vs. 1 | Arm 3 vs. 2 | |||||||||
|
|
|
|
|||||||||||
| n | % | n | % | n | % | p-value1 | OR(95% CI) | p-value2 | OR(95% CI) | p-value3 | |||
|
| |||||||||||||
| Acute4 | All | Grade 2+ | 108 | 19.7 | 212 | 37.7 | 251 | 44.6 | <0.001 | 2.46 (1.88, 3.23) | <0.001 | 1.33 (1.05, 1.69) | 0.010 |
| Grade 3+ | 25 | 4.4 | 51 | 8.8 | 70 | 12.2 | <0.001 | 2.08 (1.27, 3.41) | 0.002 | 1.43 (0.97, 2.09) | 0.034 | ||
| Blood/Bone Marrow | Grade 2+ | 13 | 2.4 | 10 | 1.8 | 29 | 5.2 | 0.002 | 0.74 (0.32, 1.71) | 0.758 | 3.00 (1.44, 6.23) | 0.002 | |
| Grade 3+ | 3 | 0.5 | 1 | 0.2 | 15 | 2.6 | <0.001 | 0.32 (0.03, 3.11) | 0.836 | 15.38 (2.03, 116.85) | 0.004 | ||
| Gastrointestinal | Grade 2+ | 11 | 2.0 | 22 | 3.9 | 38 | 6.7 | <0.001 | 2.01 (0.96, 4.19) | 0.032 | 1.76 (1.03, 3.03) | 0.020 | |
| Grade 3+ | 1 | 0.2 | 5 | 0.9 | 4 | 0.7 | 0.286 | 4.89 (0.57, 42.01) | 0.074 | 0.80 (0.21, 2.99) | 0.631 | ||
| Renal/GU | Grade 2+ | 55 | 10.1 | 71 | 12.6 | 68 | 12.1 | 0.375 | 1.29 (0.89, 1.88) | 0.090 | 0.95 (0.66, 1.35) | 0.617 | |
| Grade 3+ | 6 | 1.1 | 7 | 1.2 | 8 | 1.4 | 0.889 | 1.14 (0.38, 3.40) | 0.410 | 1.14 (0.41, 3.18) | 0.398 | ||
| Late5 | All | Grade 2+ | 308 | 56.5 | 322 | 57.6 | 350 | 62.3 | 0.067 | 1.04 (0.82, 1.32) | 0.367 | 1.22 (0.96, 1.55) | 0.054 |
| Grade 3+ | 65 | 11.5 | 87 | 15.1 | 96 | 16.7 | 0.039 | 1.36 (0.96, 1.92) | 0.040 | 1.12 (0.81, 1.53) | 0.246 | ||
| Blood/Bone Marrow | Grade 2+ | 20 | 3.7 | 10 | 1.8 | 25 | 4.4 | 0.035 | 0.47 (0.22, 1.01) | 0.973 | 2.60 (1.23, 5.47) | 0.006 | |
| Grade 3+ | 3 | 0.5 | 2 | 0.3 | 7 | 1.2 | 0.173 | 0.65 (0.11, 3.90) | 0.682 | 3.51 (0.73, 16.98) | 0.059 | ||
| Gastrointestinal | Grade 2+ | 56 | 10.3 | 57 | 10.2 | 51 | 9.1 | 0.798 | 0.99 (0.67, 1.46) | 0.518 | 0.88 (0.59, 1.31) | 0.738 | |
| Grade 3+ | 4 | 0.7 | 5 | 0.9 | 8 | 1.4 | 0.473 | 1.22 (0.33, 4.57) | 0.384 | 1.60 (0.52, 4.92) | 0.206 | ||
| Renal/GU | Grade 2+ | 202 | 37.1 | 194 | 34.7 | 223 | 39.7 | 0.173 | 0.90 (0.71, 1.15) | 0.793 | 1.24 (0.97, 1.58) | 0.043 | |
| Grade 3+ | 29 | 5.1 | 37 | 6.4 | 45 | 7.8 | 0.180 | 1.26 (0.76, 2.08) | 0.182 | 1.23 (0.78, 1.93) | 0.186 | ||
Any Attribution
Arm 1 = PBRT Alone; Arm 2 = PBRT+NC-STADT; Arm 3 = PLNRT+PBRT+NC-STADT
Two degree-of-freedom chi-square test
Grade 2+ adjusted model (entry PSA level, pathology, seminal vesicle involvement, Gleason score, age, race); Grade 3+ unadjusted model due to low number of events
One-sided Wald test of odds ratio (OR)
17, 15, and 11 patients from PBRT Alone, PBRT+STADT, and PLNRT+PBRT+STADT arms, respectively, who received no treatment or for whom no acute AE information was provided are excluded.
19, 19, and 12 patients from PBRT Alone, PBRT+STADT, and PLNRT+PBRT+STADT arms, respectively, who received no treatment or for whom no late AE information was provided are excluded.
There were no significant differences between the arms in late (> 3mo after RT) grade 2+ or 3+ GU or GI events. An increase in late grade 2+ blood/bone marrow events (Table 3) was observed for Arm 3 vs Arm 2 (1p=0.006) with an OR of 2.60, but the pattern was inconsistent, with no significant difference for Arm 3 vs Arm 1 (1p=0.26) with an OR of 1.22 (95% CI: 0.67–2.22); these differences were mostly related to leukopenia/lymphopenia.
Two additional comparisons of late grade adverse events were specified in the protocol: the time from initiation of protocol therapy until the first occurrence of a late grade 2 or higher or a late grade 3 or higher adverse event. Cumulative incidence curves (with death as a competing event) are shown in Supplementary Figures S6A and S6B. For time to late grade 3+ toxicity, there was a significantly higher incidence of adverse events in Arm 3 relative to Arm 1 (1p=0.011). Overall rates of toxicity (acute or late) in the three treatment arms by system organ class are provided in Supplementary Table S11.
DISCUSSION
The consensus recommendation for post-prostatectomy radiotherapy is treatment of the prostate surgical bed or PBRT. Based on the randomized adjuvant post-prostatectomy radiotherapy trials involving patients with adverse pathologic features,2–4 more than 60% of patients left untreated will develop a rising PSA within 10 years. Additional recent level I evidence shows that at least during the first 6.5 years of follow-up, early salvage radiotherapy is as effective as adjuvant radiotherapy, indicating that early salvage treatment will be the path selected for most patients post-prostatectomy.6–8 Randomized salvage radiotherapy trials involving men with a rising PSA after prostatectomy11,12 show biochemical failure rates at 5 and 10 years in excess of 35% and 50% following PBRT alone.
Based on a number of randomized trials,27 primary prostate radiotherapy in men with intermediate to high risk prostate cancer typically includes the addition of ADT. There are also compelling data from two randomized trials for men treated postoperatively with salvage RT that combining androgen signaling mitigation via short term ADT for 6 months11 or long term anti-androgen therapy (AAT) for 2 years12 reduces progression, increases MFS, and, in the case of long term AAT, improves survival. The SPPORT trial is complimentary to and distinguished from these salvage radiotherapy trials in several ways.
The FFP endpoint in the SPPORT trial is driven in large part by the Phoenix definition of biochemical failure14 because of stronger associations with clinical failure, as compared to the AUA definition of biochemical failure (≥0.2 ng/mL and a confirming PSA of ≥0.2 ng/mL) and similar definitions using PSA cutpoints of 0.4 and 0.5.11 The Phoenix definition has been associated with clinical failure, distant metastasis and overall survival in men treated primarily with radiotherapy.28 Based on the FFP definition in the SPPORT trial, a failure event would be based on a PSA level of ≥2 ng/mL, which is a significant level post-prostatectomy that often triggers further intervention. The implementation of second salvage ADT in the SPPORT trial reflected the incremental differences in FFP between the three treatment arms, with all comparisons being highly significant in post hoc analyses.
The two key clinical questions addressed by the SPPORT trial are central to current salvage radiotherapy management considerations - the potential benefit of adding STADT to standard PBRT and the further potential benefit from the addition of PLNRT to this combination. The SPPORT trial results are concordant with the hypotheses that there would be statistically significant incremental gains in FFP with intensification of treatment, including the addition of STADT in Arm 2 and the further addition of PLNRT in Arm 3. Concerning the impact of STADT on failure, the SPPORT trial is consistent with the GETUG-AFU 16 findings, showing a significant improvement in biochemical failure from PBRT+STADT over that of PBRT alone. The 5 year biochemical failure rates for the SPPORT (alternative biochemical failure with a 0.4 ng/mL PSA cutpoint) and GETUG-AFU 16 (0.5 ng/mL PSA from nadir) trials were 31% and 38%, respectively, for PBRT alone and 21% and 20%, respectively, for PBRT + STADT.
There are some methodological differences between the SPPORT and GETUG-AFU 16 trials that should be mentioned. Intensity modulated radiotherapy was used in 87% of the SPPORT trial patients and conformal radiotherapy was used in 96% of those in the GETUG-AFU 16 trial. Also, 6 months of ADT was used in the GETUG-AFU 16 trial, while 4–6 months was allowed in the SPPORT trial. In a post hoc analysis of 4 vs 6 months in the SPPORT trial, there was no significant difference in FFP; however, this comparison was not randomized and lacks sufficient power to be conclusive. The SPPORT and GETUG-AFU 16 trial patients had relatively similar risk features; median PSAs at entry were 0.35 and 0.3 ng/mL, respectively, and the majority had Gleason score ≤7 disease (83% and 89%, respectively). In contrast, the median PSA in the RTOG 96-01 trial was 0.6 ng/mL, indicating a higher risk cohort.
The SPPORT trial is the first post-prostatectomy trial to test the benefit of increasing RT field size to treat the pelvic lymph nodes. The decision to limit the study to three arms, without a PBRT + PLNRT arm, was based in part on the early results of RTOG 94-13,29 wherein a 2×2 design with four primary prostate cancer treatments were studied. The treatments included prostate RT ± STADT and prostate RT+PLNRT ± STADT. In RTOG 94-13 there was an early reduction in progression free survival when PLNRT + STADT was added to prostate RT. The SPPORT trial was designed to take advantage of the perceived interplay between STADT and PLNRT. With longer follow-up, there remains some evidence of an interactive effect between PLNRT and neoadjuvant and concurrent STADT in RTOG 94-13;30 although, a clear advantage over the other combinations was not evidenced, most probably because the dose to the prostate was low, allowing for local persistence of disease to impact the lasting effect from PLNRT. In a recent report by Murthy and colleagues31 on the randomized POP-RT trial in which a higher biologically equivalent radiation dose at 2 Gy was administered to the prostate primarily, in combination with long term ADT (2+ years), significant improvements in biochemical failure free survival (primary endpoint), disease free survival, and MFS were realized with the addition of whole pelvis radiotherapy at 6.8 years of follow-up.
In contrast to the significant tumor burden for men treated primarily for high risk prostate cancer on the RTOG 94-13 and POP-RT trials, patients treated postoperatively in the SPPORT trial had relatively low volume microscopic disease in the prostate bed at the time of radiotherapy (patients with palpable tumor on digital rectal exam were ineligible). The significant FFP benefit from PLNRT in the SPPORT trial was realized with standard RT doses and STADT. Nevertheless, there is newer evidence that there is a radiotherapy dose response with PBRT,32 suggesting that further improvements with more aggressive dose-escalated radiotherapy might, among other potential mechanisms, add to the gains seen with STADT. Alternatively, our results on the reduction in local failure from STADT suggest that higher radiation dose may not be needed with the use of STADT, potentially by reducing the tumor burden and/or through supra-additive or radiosensitizing effects.33,34
Pre-radiotherapy PSA is a strong predictor of outcome after salvage radiotherapy. To examine the relationship to the treatments tested, the median PSA at protocol entry (0.35 ng/mL) was used as a cutpoint in exploratory post hoc analyses. Two observations are of particular import. First, all patients benefitted from STADT in terms of FFP, including those with entry PSAs of ≤0.35 ng/mL, which is consistent with the GETUG-AFU 16 post hoc analysis of those with entry PSAs ≤0.5 ng/mL.26 However, when such a post hoc analysis in RTOG 96-01 was done for those with entry PSAs of ≤0.7, there was no realized benefit on overall survival from two years of AAT added to PBRT. Long term AAT with bicalutamide at 150 mg per day has been established to increase cardiovascular events and mortality, including in RTOG 96-01,35 and would be expected to counterbalance potential gains in survival in those with low PSAs prior to PBRT. Moreover, overall survival as an endpoint should not be used as the sole criterion for considering the use of ADT in combination with salvage radiotherapy in men with low pre-radiotherapy PSAs. In the SPPORT trial, a post hoc analysis showed that STADT in both arms 2 and 3 was associated with significantly lower rates of second salvage ADT in those with entry PSAs at or below the median of 0.35 ng/mL, as compared to PBRT alone. In clinical practice, second salvage ADT is typically a life-long management approach, whether it is given intermittently or continuously.
The entry PSA subgroup analysis also indicated that the FFP benefit of PLNRT was greatest in those with PSAs above the median of 0.35 ng/mL. The lack of statistical significance in Arm 2 vs Arm 3 comparisons in entry PSA subgroups should be interpreted with caution, however, since the study was not powered to look at these subgroups independently. Follow-up may be too short, especially for the more favorable subgroup, and second salvage therapy was applied significantly less frequently in Arm 3 even when the entry PSA was low.
The FFP endpoint was chosen because of association with clinical failure, which is concordant with the finding that the combination of PBRT+PLNRT+STADT resulted in the lowest rate of distant metastasis and greatest improvement in MFS; although MFS was not significant by protocol criteria. The follow-up period is relatively short for the distant metastasis and survival secondary endpoints. The GETUG-AFP 16 trial did not show an MFS gain from the addition of STADT until an analysis at a median follow-up of 112 months was performed.11 As RTOG/NRG 96-01 has demonstrated,12 the overall survival endpoint requires follow-up of over 10 years because it is influenced to a greater degree by both advances in the management of recurrent prostate cancer and advances in medicine overall that reduce the risk of death from all causes. Our post hoc analysis finding that the use of second salvage ADT was highest in patients on Arm 1 and lowest in Arm 3 with all cross-comparisons being highly significant, indicates that the slight, but significant, increased side effects with treatment intensification is offset by a reduction in the morbidity that is anticipated from second salvage ADT.
In conclusion, extending the standard post-prostatectomy salvage prostate bed radiotherapy fields to include the pelvic lymph nodes, when used in combination with STADT, was found to result in the greatest impact on outcomes in the SPPORT trial. Limitations of the the SPPORT trial include that longer follow-up is needed to better define the influence of PLNRT on the distant metastasis and survival endpoints and that newer developments in more prostate specific PET imaging tracers that are becoming a major part of clinical practice will probably affect recommendations on how PLNRT is applied. The new PET tracers confirm that recurrence after primary or salvage treatment is often in the lymph nodes36 and, based on lymph node recurrence distribution studies37,38 also suggest that further extending lymph node treatment volumes superiorly might result in additional reductions in progression.
Supplementary Material
Figure S1. Patient enrollment over time.
Figure S2. Freedom from progression findings: (A) At interim analysis, (B) Without censoring of second salvage intervention.
Figure S3. Freedom from progression by baseline (pre-radiotherapy) PSA: (A) ≤0.35 ng/mL, (B) >0.35 ng/mL. Of note, the actual median was 0.3475, which has been rounded to 0.35.
Figure S4. Cumulative incidence curves: (A) Biochemical failure (Phoenix), (B) Castrate resistant disease, (C) Local failure, (D) Regional failure, and (E) Metastasis-free survival.
Figure S5. Freedom from progression by duration of ADT (4 months vs 6 months).
Figure S6. Cumulative incidence curves: (A) Time to late grade 2 or higher adverse event, (B) time to late grade 3 or higher adverse event.
Research in Context.
Evidence before this study
Salvage radiotherapy to the post-prostatectomy surgical bed for a detectable PSA is a curative option for recurrent prostate cancer; however, biochemical failure occurs in over 50% and effectuates life-long systemic treatment. For men with high risk prostate cancer treated primarily, androgen deprivation therapy (ADT) combined with radiotherapy was established in randomized trials to significantly improve long term outcome. There was also a suggestion that pelvic lymph node radiotherapy treatment reduced progression when added to prostate radiotherapy plus short term ADT (RTOG 94-13). At the time the trial was conceived there were no published randomized trials evaluating the gains from the addition of ADT and pelvic lymph node treatment to salvage prostate bed radiotherapy.
Added value of this study
SPPORT is the first salvage radiotherapy randomized trial to evaluate whether short term ADT and extended radiotherapy field coverage of the pelvic lymph nodes improve patient outcome when applied incrementally to conventional prostate bed treatment. The greatest benefit was realized in men who received both short term ADT and pelvic lymph node coverage. There was a minor increase in late bone marrow adverse events from the combined treatment.
Implications of all available science
SPPORT is the third randomized trial to show a benefit from adding ADT to salvage prostate bed radiotherapy and the first to show further gains from pelvic lymph node radiotherapy. Pelvic lymph node coverage should be strongly considered in conjunction with prostate bed radiotherapy and ADT.
ACKNOWLEDGMENTS:
This work was funded by U10CA180868 (NRG Oncology Operations), U10CA180822 (NRG Oncology SDMC), UG1CA189867 (NCORP), U24CA180803 (IROC), and P30CA240139 grants from the National cancer Institute (support for A.P. effort), and a University of Miami, Sylvester Comprehensive Cancer Center Professorship (A.P. effort).
Supported by:
This project was supported by U10CA180868 (NRG Oncology Operations), U10CA180822 (NRG Oncology SDMC), UG1CA189867 (NCORP), U24CA180803 (IROC), and P30CA240139 grants from the National Cancer Institute, and a University of Miami Sylvester Comprehensive Cancer Center Professorship (A.P.).
Footnotes
Presented in part at ASTRO’s 60th Annual Meeting, San Antonio, TX, October, 2018
Data Sharing Statement:
Per NCI requirements, the data from this article will be submitted to the National Cancer Institute NCTN/NCORP data archive (https://nctn-data-archive.nci.nih.gov) no later than 6 months after publication. After the required NCI reviews are completed, it will be released and available in the data archive for data sharing proposals. The study protocol is available on the ClinicalTrials.gov website.
REFERENCES
- 1.Stephenson AJ, Scardino PT, Eastham JA, et al. Preoperative nomogram predicting the 10-year probability of prostate cancer recurrence after radical prostatectomy. J Natl Cancer Inst 2006; 98(10): 715–7. [DOI] [PMC free article] [PubMed] [Google Scholar]
- 2.Thompson IM, Tangen CM, Paradelo J, et al. Adjuvant radiotherapy for pathological T3N0M0 prostate cancer significantly reduces risk of metastases and improves survival: long-term followup of a randomized clinical trial. J Urol 2009; 181(3): 956–62. [DOI] [PMC free article] [PubMed] [Google Scholar]
- 3.Bolla M, van Poppel H, Tombal B, et al. Postoperative radiotherapy after radical prostatectomy for high-risk prostate cancer: long-term results of a randomised controlled trial (EORTC trial 22911). Lancet 2012; 380(9858): 2018–27. [DOI] [PubMed] [Google Scholar]
- 4.Wiegel T, Bartkowiak D, Bottke D, et al. Adjuvant radiotherapy versus wait-and-see after radical prostatectomy: 10-year follow-up of the ARO 96-02/AUO AP 09/95 trial. Eur Urol 2014; 66(2): 243–50. [DOI] [PubMed] [Google Scholar]
- 5.Swanson GP, Hussey MA, Tangen CM, et al. Predominant treatment failure in postprostatectomy patients is local: analysis of patterns of treatment failure in SWOG 8794. J Clin Oncol 2007; 25(16): 2225–9. [DOI] [PubMed] [Google Scholar]
- 6.Parker CC, Clarke NW, Cook AD, et al. Timing of radiotherapy after radical prostatectomy (RADICALS-RT): a randomised, controlled phase 3 trial. Lancet 2020; 396(10260): 1413–21. [DOI] [PubMed] [Google Scholar]
- 7.Kneebone A, Fraser-Browne C, Duchesne GM, et al. Adjuvant radiotherapy versus early salvage radiotherapy following radical prostatectomy (TROG 08.03/ANZUP RAVES): a randomised, controlled, phase 3, non-inferiority trial. Lancet Oncol 2020; 21(10): 1331–40. [DOI] [PubMed] [Google Scholar]
- 8.Sargos P, Chabaud S, Latorzeff I, et al. Adjuvant radiotherapy versus early salvage radiotherapy plus short-term androgen deprivation therapy in men with localised prostate cancer after radical prostatectomy (GETUG-AFU 17): a randomised, phase 3 trial. Lancet Oncol 2020; 21(10): 1341–52. [DOI] [PubMed] [Google Scholar]
- 9.Vale CL, Fisher D, Kneebone A, et al. Adjuvant or early salvage radiotherapy for the treatment of localised and locally advanced prostate cancer: a prospectively planned systematic review and meta-analysis of aggregate data. Lancet 2020; 396(10260): 1422–31. [DOI] [PMC free article] [PubMed] [Google Scholar]
- 10.Tendulkar RD, Agrawal S, Gao T, et al. Contemporary Update of a Multi-Institutional Predictive Nomogram for Salvage Radiotherapy After Radical Prostatectomy. J Clin Oncol 2016; 34(30): 3648–54. [DOI] [PubMed] [Google Scholar]
- 11.Carrie C, Magne N, Burban-Provost P, et al. Short-term androgen deprivation therapy combined with radiotherapy as salvage treatment after radical prostatectomy for prostate cancer (GETUG-AFU 16): a 112-month follow-up of a phase 3, randomised trial. Lancet Oncol 2019; 20(12): 1740–9. [DOI] [PubMed] [Google Scholar]
- 12.Shipley WU, Seiferheld W, Lukka HR, et al. Radiation with or without Antiandrogen Therapy in Recurrent Prostate Cancer. N Engl J Med 2017; 376(5): 417–28. [DOI] [PMC free article] [PubMed] [Google Scholar]
- 13.Spratt DE. Evidence-based Risk Stratification to Guide Hormone Therapy Use With Salvage Radiation Therapy for Prostate Cancer. Int J Radiat Oncol Biol Phys 2018; 102(3): 556–60. [DOI] [PubMed] [Google Scholar]
- 14.Roach M 3rd, Hanks G, Thames H Jr, et al. Defining biochemical failure following radiotherapy with or without hormonal therapy in men with clinically localized prostate cancer: recommendations of the RTOG-ASTRO Phoenix Consensus Conference. Int J Radiat Oncol Biol Phys 2006; 65(4): 965–74. [DOI] [PubMed] [Google Scholar]
- 15.Stephenson AJ, Scardino PT, Kattan MW, et al. Predicting the outcome of salvage radiation therapy for recurrent prostate cancer after radical prostatectomy. J Clin Oncol 2007; 25(15): 2035–41. [DOI] [PMC free article] [PubMed] [Google Scholar]
- 16.Zubrod CG, SChneiderman M, Frei III E, et al. Appraisal of methods for the study of chemotherapy of cancer in man: Comparative therapeutic trial of nitrogen mustard and triethylene thiophosphoramide. J Chronic Diseases 1960; 11(1): 7–33. [Google Scholar]
- 17.Michalski JM, Lawton C, El Naqa I, et al. Development of RTOG consensus guidelines for the definition of the clinical target volume for postoperative conformal radiation therapy for prostate cancer. Int J Radiat Oncol Biol Phys 2010; 76(2): 361–8. [DOI] [PMC free article] [PubMed] [Google Scholar]
- 18.Lawton CA, Michalski J, El-Naqa I, et al. RTOG GU Radiation oncology specialists reach consensus on pelvic lymph node volumes for high-risk prostate cancer. Int J Radiat Oncol Biol Phys 2009; 74(2): 383–7. [DOI] [PMC free article] [PubMed] [Google Scholar]
- 19.Barry MJ, Fowler FJ, Jr., O’Leary MP, Bruskewitz RC, Holtgrewe HL, Mebust WK. Correlation of the American Urological Association symptom index with self-administered versions of the Madsen-Iversen, Boyarsky and Maine Medical Assessment Program symptom indexes. Measurement Committee of the American Urological Association. J Urol 1992; 148(5): 1558–63; discussion 64. [DOI] [PubMed] [Google Scholar]
- 20.Program CTE. Common Terminology Criteria for Adverse Eevents, Version 3.0. 2003. (accessed March 31, 2003. [Google Scholar]
- 21.Chen TT, Simon RM. Extension of one-sided test to multiple treatment trials. Control Clin Trials 1994; 15(2): 124–34. [DOI] [PubMed] [Google Scholar]
- 22.Zelen M The randomization and stratification of patients to clinical trials. J Chronic Dis 1974; 27(7–8): 365–75. [DOI] [PubMed] [Google Scholar]
- 23.Peto R, Pike MC, Armitage P, et al. Design and analysis of randomized clinical trials requiring prolonged observation of each patient. I. Introduction and design. Br J Cancer 1976; 34(6): 585–612. [DOI] [PMC free article] [PubMed] [Google Scholar]
- 24.Freidlin B, Korn EL. A comment on futility monitoring. Control Clin Trials 2002; 23(4): 355–66. [DOI] [PubMed] [Google Scholar]
- 25.Cox DR. Regression models and life tables. J Royal Statistsics Soc 1972; 34: 187–220. [Google Scholar]
- 26.Carrie C, Hasbini A, de Laroche G, et al. Salvage radiotherapy with or without short-term hormone therapy for rising prostate-specific antigen concentration after radical prostatectomy (GETUG-AFU 16): a randomised, multicentre, open-label phase 3 trial. Lancet Oncol 2016; 17(6): 747–56. [DOI] [PubMed] [Google Scholar]
- 27.Siddiqui ZA, Krauss DJ. Adjuvant androgen deprivation therapy for prostate cancer treated with radiation therapy. Transl Androl Urol 2018; 7(3): 378–89. [DOI] [PMC free article] [PubMed] [Google Scholar]
- 28.Abramowitz MC, Li T, Buyyounouski MK, et al. The Phoenix definition of biochemical failure predicts for overall survival in patients with prostate cancer. Cancer 2008; 112(1): 55–60. [DOI] [PubMed] [Google Scholar]
- 29.Roach M 3rd, DeSilvio M, Lawton C et al. Phase III trial comparing whole-pelvic versus prostate-only radiotherapy and neoadjuvant versus adjuvant combined androgen suppression: Radiation Therapy Oncology Group 9413. J Clin Oncol 2003; 21(10): 1904–11. [DOI] [PubMed] [Google Scholar]
- 30.Roach M, Moughan J, Lawton CAF, et al. Sequence of hormonal therapy and radiotherapy field size in unfavourable, localised prostate cancer (NRG/RTOG 9413): long-term results of a randomised, phase 3 trial. Lancet Oncol 2018; 19(11): 1504–15. [DOI] [PMC free article] [PubMed] [Google Scholar]
- 31.Murthy V, Maitre P, Kannan S, et al. Prostate-Only Versus Whole-Pelvic Radiation Therapy in High-Risk and Very High-Risk Prostate Cancer (POP-RT): Outcomes From Phase III Randomized Controlled Trial. J Clin Oncol 2021; 39(11): 1234–42. [DOI] [PubMed] [Google Scholar]
- 32.Pisansky TM, Agrawal S, Hamstra DA, et al. Salvage Radiation Therapy Dose Response for Biochemical Failure of Prostate Cancer After Prostatectomy-A Multi-Institutional Observational Study. Int J Radiat Oncol Biol Phys 2016; 96(5): 1046–53. [DOI] [PubMed] [Google Scholar]
- 33.Polkinghorn WR, Parker JS, Lee MX, et al. Androgen receptor signaling regulates DNA repair in prostate cancers. Cancer Discov 2013; 3(11): 1245–53. [DOI] [PMC free article] [PubMed] [Google Scholar]
- 34.Chua ML, Bristow RG. Testosterone in Androgen Receptor Signaling and DNA Repair: Enemy or Frenemy? Clin Cancer Res 2016; 22(13): 3124–6. [DOI] [PubMed] [Google Scholar]
- 35.Dess RT, Sun Y, Jackson WC, et al. Association of Presalvage Radiotherapy PSA Levels After Prostatectomy With Outcomes of Long-term Antiandrogen Therapy in Men With Prostate Cancer. JAMA Oncol 2020. [DOI] [PMC free article] [PubMed] [Google Scholar]
- 36.Calais J, Ceci F, Eiber M, et al. (18)F-fluciclovine PET-CT and (68)Ga-PSMA-11 PET-CT in patients with early biochemical recurrence after prostatectomy: a prospective, single-centre, single-arm, comparative imaging trial. Lancet Oncol 2019; 20(9): 1286–94. [DOI] [PMC free article] [PubMed] [Google Scholar]
- 37.Schiller K, Stohrer L, Dusberg M, et al. PSMA-PET/CT-based Lymph Node Atlas for Prostate Cancer Patients Recurring After Primary Treatment: Clinical Implications for Salvage Radiation Therapy. Eur Urol Oncol 2020. [DOI] [PubMed] [Google Scholar]
- 38.Onal C, Ozyigit G, Guler OC, et al. Role of 68-Ga-PSMA-PET/CT in pelvic radiotherapy field definitions for lymph node coverage in prostate cancer patients. Radiother Oncol 2020; 151: 222–7. [DOI] [PubMed] [Google Scholar]
Associated Data
This section collects any data citations, data availability statements, or supplementary materials included in this article.
Supplementary Materials
Figure S1. Patient enrollment over time.
Figure S2. Freedom from progression findings: (A) At interim analysis, (B) Without censoring of second salvage intervention.
Figure S3. Freedom from progression by baseline (pre-radiotherapy) PSA: (A) ≤0.35 ng/mL, (B) >0.35 ng/mL. Of note, the actual median was 0.3475, which has been rounded to 0.35.
Figure S4. Cumulative incidence curves: (A) Biochemical failure (Phoenix), (B) Castrate resistant disease, (C) Local failure, (D) Regional failure, and (E) Metastasis-free survival.
Figure S5. Freedom from progression by duration of ADT (4 months vs 6 months).
Figure S6. Cumulative incidence curves: (A) Time to late grade 2 or higher adverse event, (B) time to late grade 3 or higher adverse event.
Data Availability Statement
Per NCI requirements, the data from this article will be submitted to the National Cancer Institute NCTN/NCORP data archive (https://nctn-data-archive.nci.nih.gov) no later than 6 months after publication. After the required NCI reviews are completed, it will be released and available in the data archive for data sharing proposals. The study protocol is available on the ClinicalTrials.gov website.