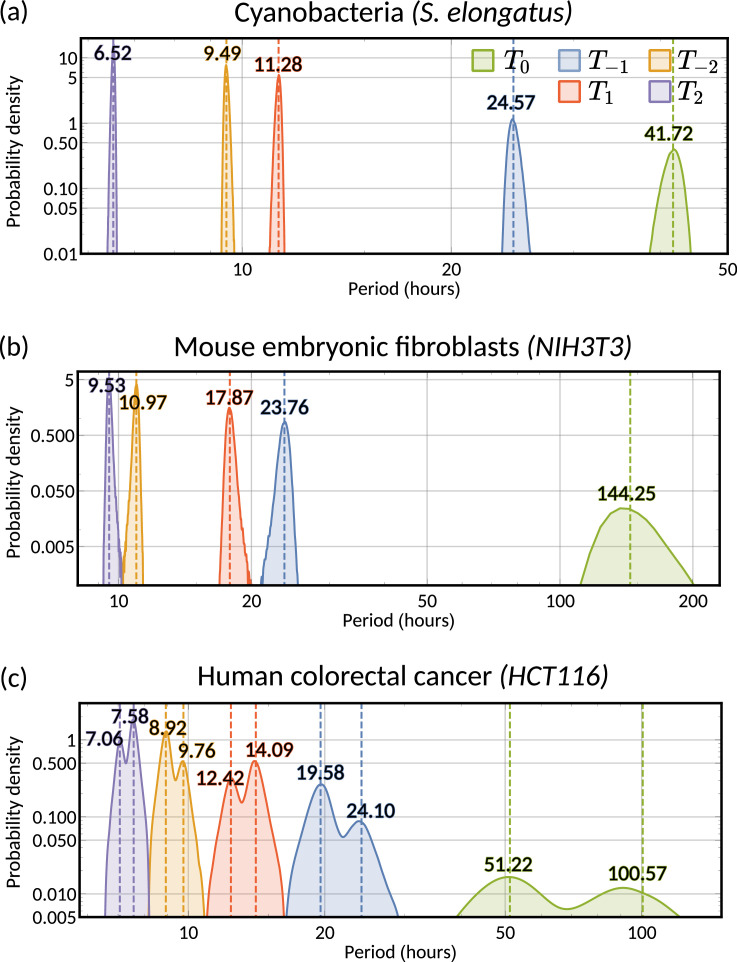
Appendix 1—figure 7. A range of oscillator periods can explain oscillatory interdivision time patterns.
Histogram of the posteriors of the possible periods underlying the lineage correlation function for (a) cyanobacteria, (b) mouse embryonic fibroblasts and (c) human colorectal cancer, calculated using Equation 7. Numerical values give medians of the posterior distributions for each . For (c) human colorectal cancer, we take the median period of each cluster where the clusters are allocated through the sign of the real part of the eigenvalue (see Figure 5f). For all panels the correlation oscillation period is given in green and the oscillator periods in different colours. The period analysed in ‘The inheritance matrix model predicts the hidden dynamical correlations of cell cycle factors’ corresponds to the histograms of (blue).

