. 2022 Dec 14;11:e80949. doi: 10.7554/eLife.80949

Figure 10. Summary of LV transcriptome and proteome analysis of TGAC8 and WT.

(A) Schematic of the total number of transcripts (subset ‘a’ – 11,810), and proteins (subset ‘b’ 6834), identified in LV lysates, the number of transcripts (subset ‘c’ 2323), and proteins (subset ‘d’ 2184), that differed by genotype, and number of identified transcripts and proteins that both differed by genotype (subset ‘e’ - 544). (B) WEBGESTALT analysis of the 2323 transcripts (Panel A subset ‘c’) and 2184 proteins (Panel A subset ‘d’) that significantly differed by genotype. Biological Processes (BP), Cell Compartment (CC), Molecular Functions (MF). (C) Top canonical signaling pathways differing in enrichment (-log10(pvalue) >1.3) and activation status by genotype in IPA analysis of transcripts and proteins.

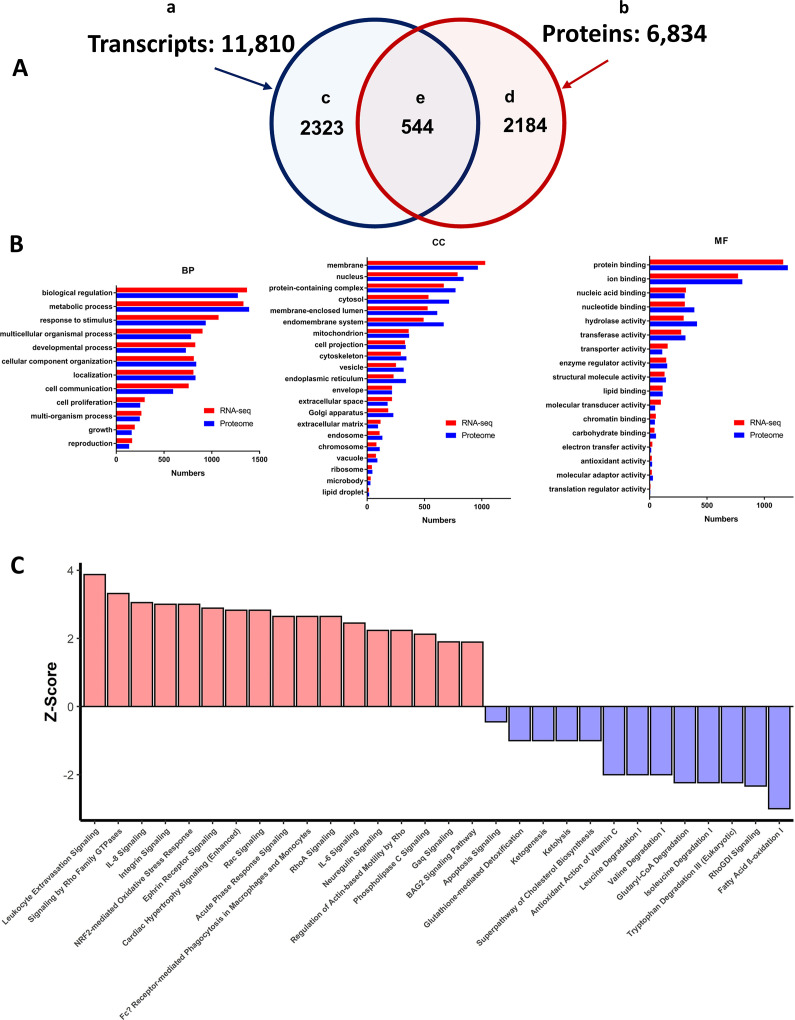
Figure 10.

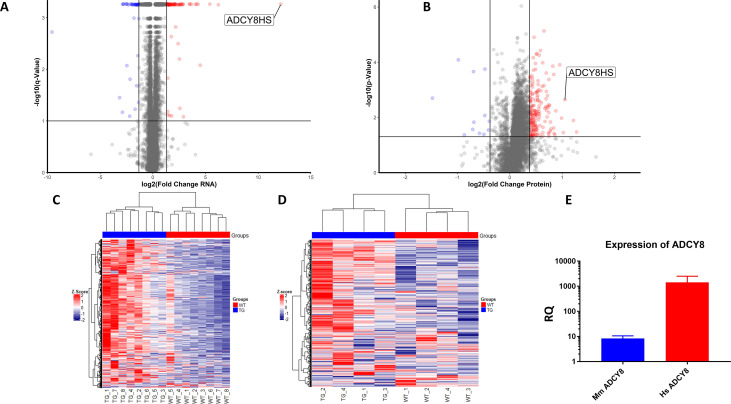
Figure 10—figure supplement 1. Volcano plots and heat maps of transcripts and proteins.

Figure 10—figure supplement 1.

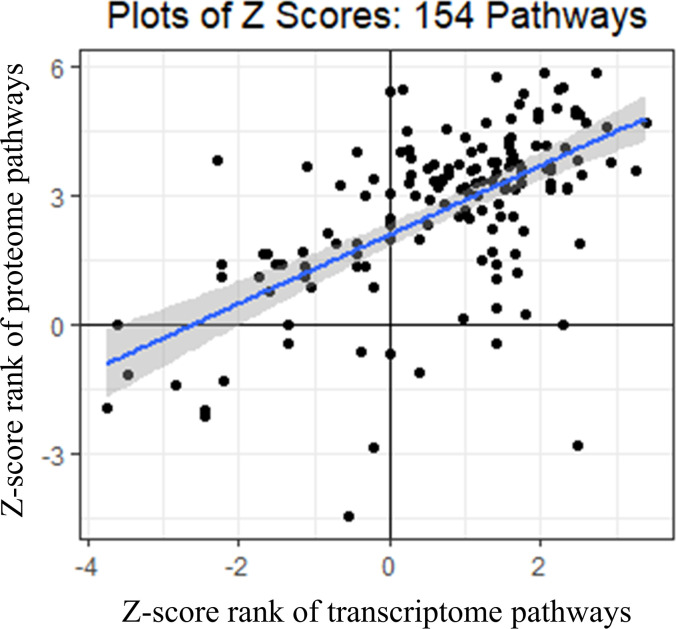
Figure 10—figure supplement 2. Spearman’s correlations of Z-scores of IPA canonical pathways that significantly differed by genotype in transcriptome and proteome.

Figure 10—figure supplement 2.

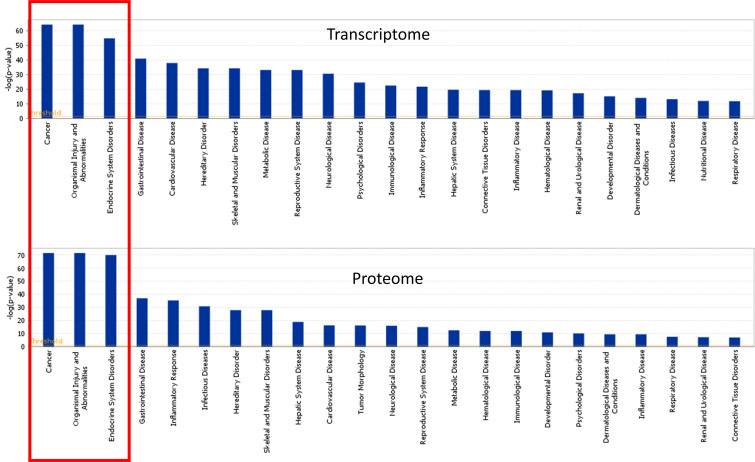
Figure 10—figure supplement 3. IPA representation of top disease-related functions within the LV transcriptome and proteome of TGAC8 and WT.

Figure 10—figure supplement 3.

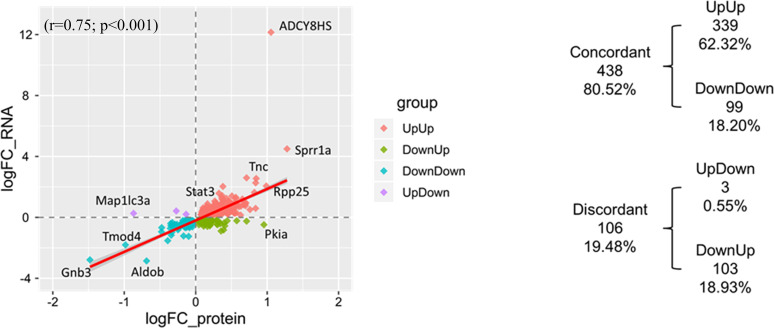
Figure 10—figure supplement 4. Correlation plot of 544 identified molecules of which both transcripts and proteins differed by genotype.

Figure 10—figure supplement 4.

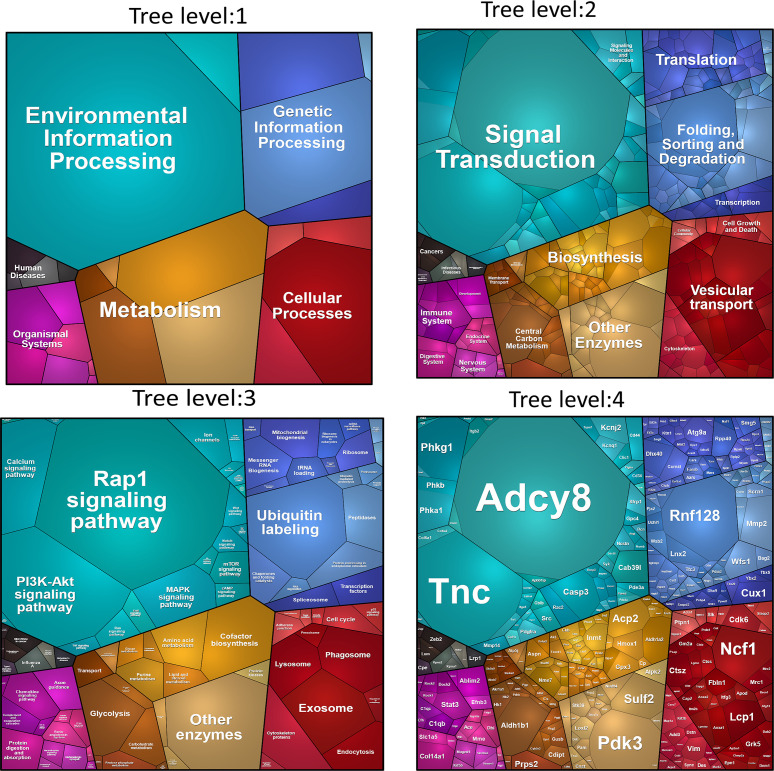
Figure 10—figure supplement 5. PROTEOMAP.

Figure 10—figure supplement 5.

Visualization of functional categories of the 544 proteins that differed by genotype. Four levels of functional tree consist of number of polygons. The areas of each polygon reflect genotypic differences in protein abundances.