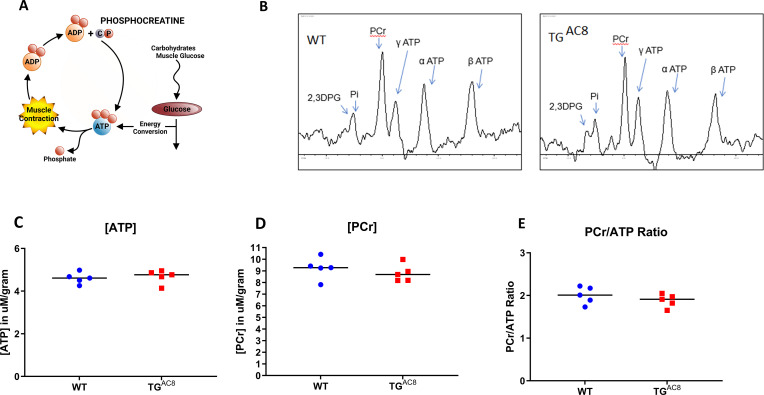
Figure 9. High-energy phosphates in TGAC8 and WT hearts.
(A) A schematic of ATP creatine energy system, (B) Representative P31 NMR spectra of TGAC8 and WT hearts. (C–E) Average levels of ATP, PCr, and ATP/PCr in TGAC8 and WT hearts derived from NMR spectra. Data are presented as Mean± SEM. The statistical significance is indicated by * p<0.05 (two-tailed t test).

