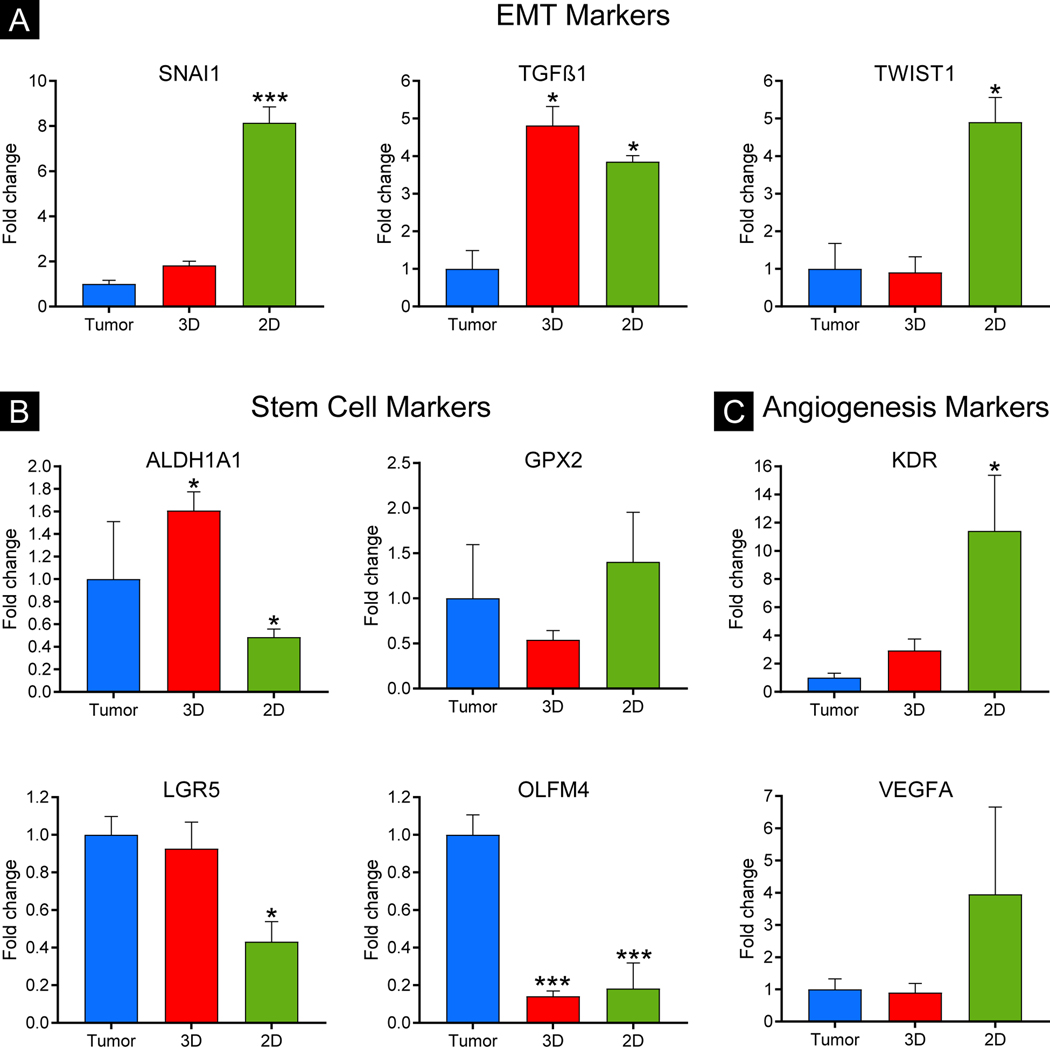
Figure 4. Gene expression of epithelial to mesenchymal transition (EMT), stem cell, and angiogenesis markers in CRC-PDX tumors was more similar to 3D-eCRC-PDX tissues than 2D-CRC-PDX cells.
Gene expression of (A) EMT markers, SNAI1 and TWIST1, (B) stem cell markers, GPX2 and LGR5, and (C) angiogenesis markers, KDR and VEGFA, in the 3De-CRC-PDX tissues was not significantly different compared to the CRC PDX tumors. In 2D-CRC-PDX cultures, however, gene expression of four out of these six markers (SNAI1, TWIST1, LGR5, and KDR) was significantly different compared to the CRC PDX tumors. Data are mean ± SE (*p ≤ 0.05 and ***p ≤ 0.001 compared to the CRC-PDX tumors. n = 3–4 separately obtained tumors and the corresponding batches of 3D-eCRC-PDX tissues and 2D-CRC-PDX cultures).

