



Abstract
Background:
While aortic valve sclerosis (AVS) is well-described as preceding aortic stenosis (AS), the association of AS with antecedent mitral aortic annular calcification and aortic annulus increased reflectivity (MAC and AAIR, respectively) has not been characterized. In a population-based prospective study, we evaluated whether MAC, AAIR, and AVS are associated with the risk of incident AS.
Methods:
Among participants of the Cardiovascular Health Study (CHS) free of AS at the 1994–1995 visit, the presence of MAC, AAIR, AVS, and the combination of all three were evaluated in 3041 participants. Cox proportional hazards regression was used to assess the association between the presence of calcification and the incidence of moderate/severe AS in three nested models adjusting for factors associated with atherosclerosis and inflammation both relevant to the pathogenesis of AS.
Results:
Over a median follow-up of 11.5 years (IQR 6.7 to 17.0), 110 cases of incident moderate/severe AS were ascertained. Strong positive associations with incident moderate/severe AS were found for all calcification sites after adjustment for the main model covariates: AAIR (HR=2.90, 95% CI=[1.95, 4.32], p<0.0005), AVS (HR=2.20, 95% CI=[1.44, 3.37], p<0.0005), MAC (HR=1.67, 95% CI=[1.14, 2.45], p=0.008), and the combination of MAC, AAIR, and AVS (HR=2.50, 95% CI=[1.65, 3.78], p<0.0005). In a secondary analysis, the risk of AS increased with the number of sites at which calcification was present.
Conclusions:
In a large cohort of community-dwelling elderly individuals, there were strong associations between each of AAIR, AVS, MAC, and the combination of MAC, AAIR, and AVS with incident moderate/severe AS. The novel finding that AAIR had a particularly strong association with incident AS, even after adjusting for other calcification sites, suggests its value in identifying individuals at risk for AS, and potential inclusion in the routine assessment by transthoracic echocardiography.
Keywords: mitral annular calcification, aortic annulus increased reflectivity, aortic valve sclerosis, incident aortic stenosis
Introduction
The prevalence of aortic valve sclerosis (AVS), increases with age such that approximately 30% of individuals over the age of 65 years have AVS while 4% have overt aortic stenosis (AS) (1). Moreover, there is a marked increase in AS with advancing age such that the prevalence of AS increases almost eight-fold in healthy individuals from 75–76 to 85–86 years old (2).
The association of AVS with other sites of valvular calcification has been reported in observational studies, which suggest that mitral annular calcification (MAC) and AVS are associated with AS (3,4). In a previous study of community-dwelling older adults in the Cardiovascular Health Study (CHS), AVS, MAC, and aortic annulus increased reflectivity (AAIR), then named aortic annular calcification, were found in 54%, 42%, and 44% of participants, respectively, with combined MAC, AAIR, and AVS in 17% of individuals (5).
Similarities between atherosclerosis and AS-like inflammation, lipid deposition, fibrosis, and calcification (6,7) have led to the hypothesis that atheroclerosis and inflammation may play a central role in the initial stages of aortic valve calcification, and possibly initial stages of MAC and AAIR. However, previous studies (8,9) failed to find an association of hs C-reactive protein (CRP) with AVS or incident AS.
While AVS is known to progress to AS (10,11), the associations of MAC and AAIR with incident AS, as separate exposures and as a combined exposure with AVS, have not been thoroughly studied. Recently, we completed the adjudication of incident AS in CHS over a 25-year follow-up period, which gave us the opportunity to evaluate the relationships of clinically adjudicated AS with AVS, as well as components of fibrous skeleton calcification: AAIR and MAC (12).
We postulated that the presence of AVS, AAIR, and MAC, both separately and combined, are associated with subsequent development of moderate/severe AS, independently of covariates known to be associated with incident AS.
Material and Methods
Participants
All individuals evaluated for this study were participants in the CHS, a prospective, community-based, epidemiologic observational study that was designed to assess cardiovascular risk factors and outcomes in elderly individuals. The design, rationale, and examination details of CHS have been published elsewhere (13). Of 5888 participants (age 65 to 100 years) who were enrolled in the study, 5201 were recruited in 1989–1990, and 687 predominantly Black participants were enrolled in 1992–1993. The study was approved by the institutional review board at each participating center, and informed consent was obtained from participants. Hospitalizations among participants were identified during semi-annual contacts and medical records for all hospitalizations were obtained. Cardiovascular events and deaths were adjudicated by a committee of physicians using standardized criteria. Echocardiograms were performed on CHS participants at the 1989–1990 and the 1994–1995 study examinations. The baseline for the present analyses was the 1994–1995 examination, during which echocardiographic assessment of cardiac calcification was performed.
Echocardiographic identification of AVS, AAIR, and MAC
At the 1994–1995 exam, 2-D echocardiographic studies were recorded on videotape using a cardiac ultrasound machine (model SSH-160A, Toshiba, Tustin, California) as previously described (13). Echocardiographic studies were interpreted at a centralized core echocardiography laboratory (Georgetown University, Washington DC) by readers blinded to clinical information.
MAC was defined by an intense echo-producing structure located at the junction of the atrioventricular groove and posterior mitral leaflet on any of the parasternal long-axis, apical 4-chamber, or parasternal short-axis views.
AAIR was defined as increased reflectivity of the aortic root at the insertion of the aortic cusps suggesting possible fibrosis and/or calcification. AVS was identified by aortic cusp thickening, normal aortic cusp excursion, and peak transaortic valve flow velocity < 2.0 m/s (10). Examples of these calcifications are illustrated in the Supplemental files, Figures S1 A–D. Intra-observer kappa scores (116 observations) for MAC, AAIR, and AVS are 0.69, 0.60, and 0.80, respectively, indicating good agreement. For inter-observer agreement (250 observations), the kappa values for MAC, AAIR and AVS are 0.36, 0.13, and 0.08, respectively.
Adjudication of AS
The endpoint adjudication methodology is described in detail elsewhere (12). Briefly, prevalent and incident AS was ascertained on the 5647 participants who had an initial echocardiogram in either 1989–1990 or 1994–1995 and sufficient information available to classify AS.
The presence of AS on baseline CHS echocardiograms was based on restriction of leaflet opening of mild or greater severity or peak transaortic velocity ≥ 2.0 m/s. Five screening methods were used to identify participants most likely to have AS during follow-up: (i) aortic valve procedure codes, (ii) ICD diagnosis codes for AS and rheumatic aortic valve disease, (iii) CHS heart failure hospitalization reviews, (iv) CHS echo data, and (v) cause of death reviews. Based on these screening methods, 990 unique individuals were identified. To adjudicate AS, three physicians reviewed all available hospitalization records (and death records for those who were deceased) for these 990 participants through June 2014, including any echocardiography and procedure reports. The severity of AS during follow-up was ascertained from information in participant medical records, including echocardiographic and cardiac catheterization reports as available. Moderate AS was based on a peak transaortic velocity of 3.0 to 3.9 m/s, a mean transaortic gradient of 25 to 39 mmHg, or a calculated aortic valve area of 1.1 to 1.5 cm2. Severe AS required a peak transaortic velocity ≥ 4.0 m/s, a mean transaortic gradient ≥ 40 mmHg, or a calculated aortic valve area ≤ 1.0 cm2. AS was considered probable or definite if at least 2 of the 3 foregoing criteria were met. For the present analysis, the primary endpoint was probable or definite moderate/severe AS. We chose a primary outcome of moderate/severe AS because there were only a limited number of participants with severe AS. An aortic valve procedure for AS (surgical or transcatheter aortic valve replacement or percutaneous balloon valvuloplasty) was included in this primary outcome. Among those screened, the yield of probable or definite moderate/severe AS was: procedure code: 84.8% (67/79), heart failure screen: 51.4% (91/177), CHS echocardiogram: 43.7% (118/270), diagnostic code (ICD-9): 39.6% (263/664). The cause of death screen among those not identified above had a yield of 20.8% (5/24). The yield based on a number of positive screens among the four main methods is: one screen: 17.1% (112/656), two screens: 72.0% (134/186), three screens: 97.8% (45/46), four screens: 100% (6/6). A sensitivity analysis showed that these screening methods achieved high capture for incident AS (12).
Covariates
Covariates included age, sex, race (Black or not Black), enrollment year (1989–1990 or 1992–1993), BMI, systolic BP, antihypertensive medication use, diabetes, smoking (never, former, or current), estimated glomerular filtration rate (eGFR) by cystatin C, LDL-C, HDL-C, CRP, and interleukin-6 (IL-6), coronary heart disease (CHD) (myocardial infarction, angina pectoris, or coronary revascularization), stroke or transient ischemic attack (TIA), and peripheral arterial disease (PAD). Demographic information was collected at enrollment. All other covariates were measured at the analysis baseline (1994–1995), except for height (used with weight measured at the 1994–1995 visit to calculate BMI), eGFR, LDL-C, HDL-C, CRP, and IL-6, which were measured in 1992–1993.
Diabetes was defined as fasting glucose ≥ 126 mg/dL, non-fasting glucose ≥ 200 mg/dL, or use of diabetes medication (assessed via medication inventory) (15). CHD, stroke/TIA, heart failure, and PAD were based on standardized criteria and adjudicated by a committee of experts as previously described (13). Cystatin C concentration was used to calculate eGFR, as a measure of renal function (16). The biomarkers of inflammation, CRP and IL-6, were measured in serum stored at −70°C to −80°C. As in previous studies, standardized approaches to collecting, aliquoting, and freezing samples were followed to minimize degradation.
Inclusion and Exclusion Criteria
Of the 5888 participants enrolled in CHS, 718 died before the 1994–1995 echocardiogram exam, 1110 were alive but did not report for the 1994–1995 visit, and 31 reported for the visit but did not have an echocardiogram. Overall, 4029 were eligible for evaluation of MAC, AAIR, and AVS. The sample for the present study consisted of all participants evaluated for moderate/severe AS status diagnosed after the 1994–1995 echocardiographic examination. Participants were excluded from the analysis if they had prior aortic valve replacement, were missing information on valve calcification on the echocardiogram, or had prior AS of any severity, resulting in 3629 individuals. After omitting those with any missing calcification sites or main model covariates (described below), 3041 participants were included in the analysis sample. After omitting those with missing exploratory model covariates (described below), 2747 participants were included in the exploratory sample. The selection processes of the participants included in the analyses are presented in Figure 1.
Figure 1.
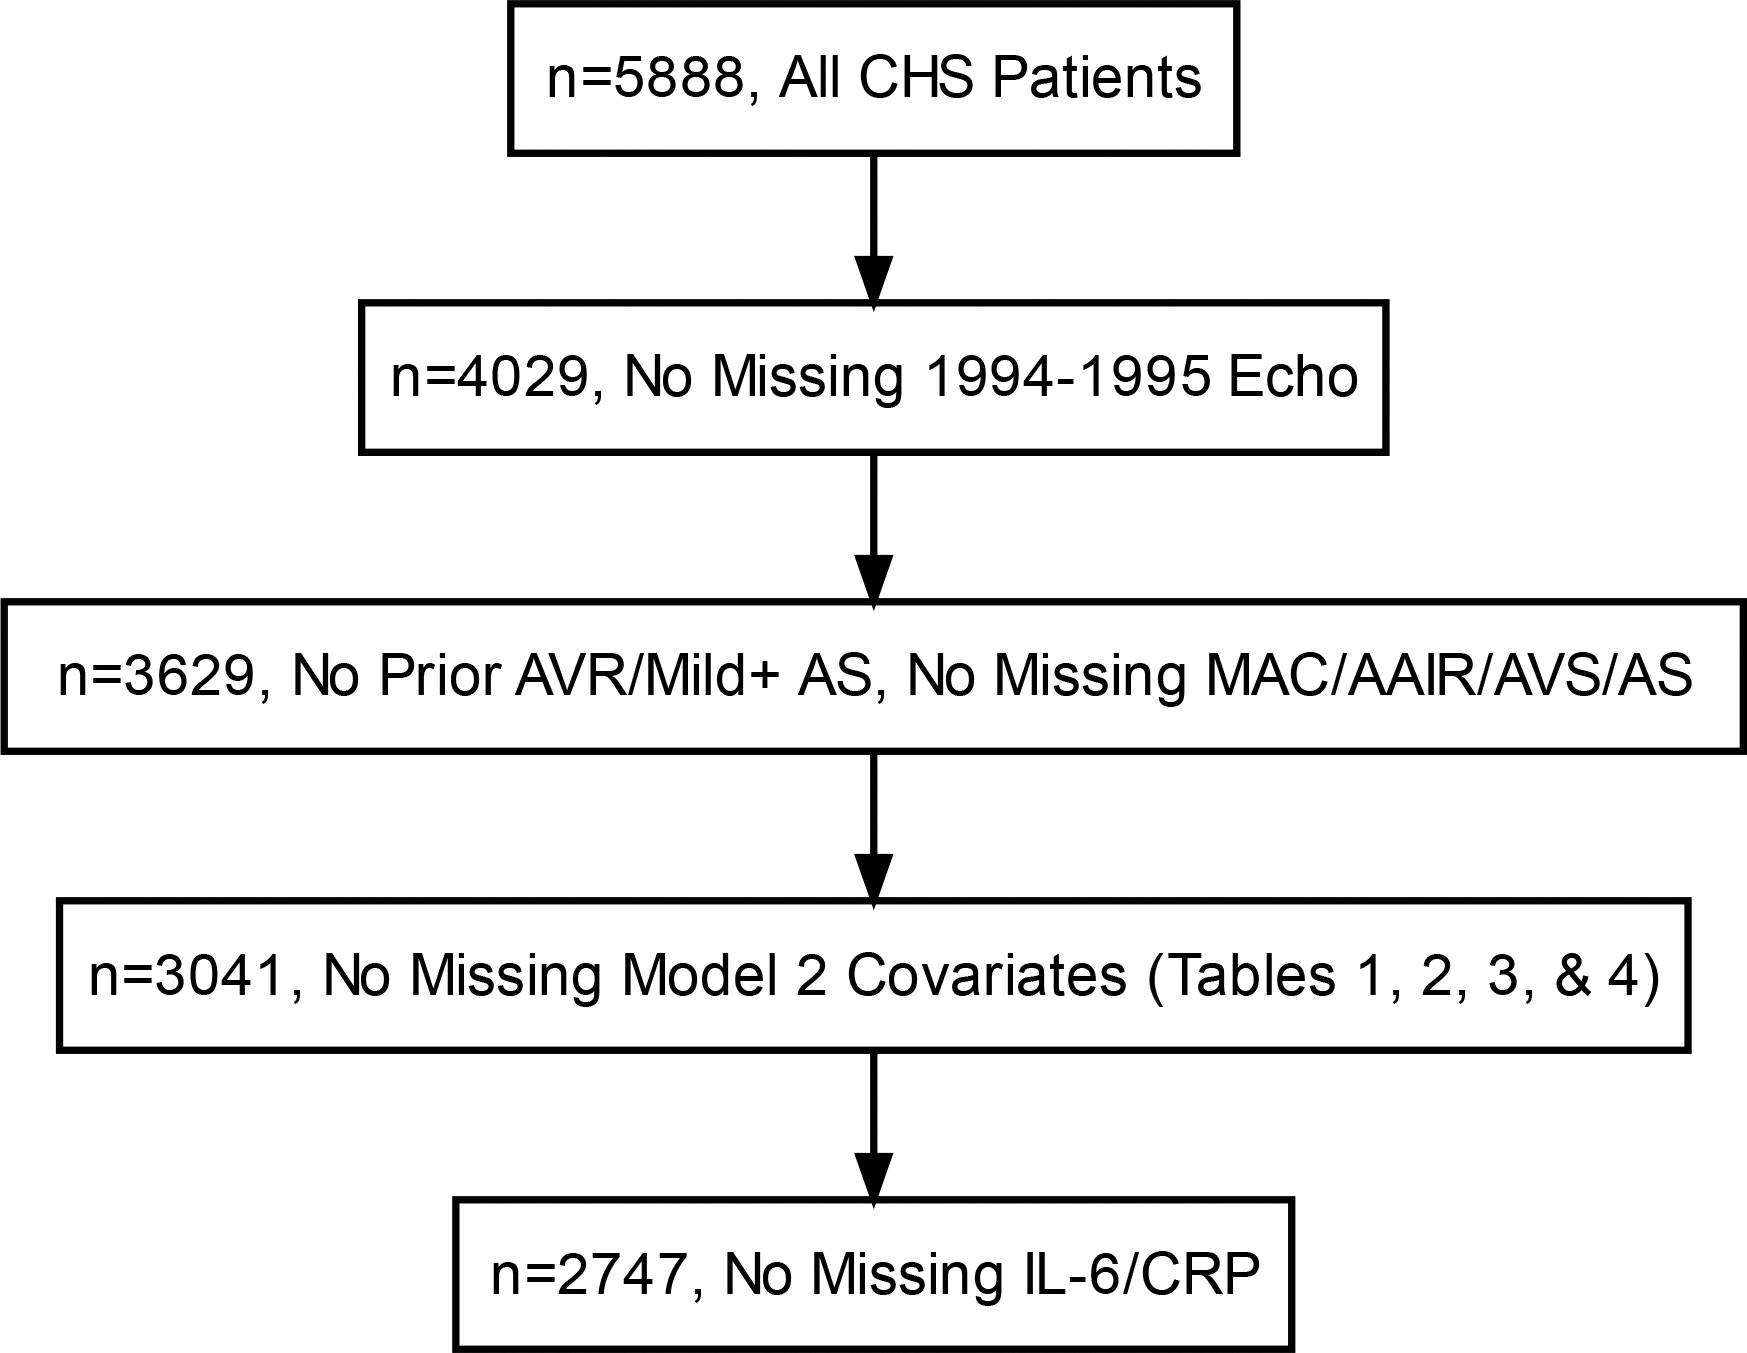
Flowchart of sample sizes used in the study
Statistical Methods
For the 3041 participants in the main analysis, we calculated descriptive statistics, summarizing continuous variables using means and standard deviations and summarizing categorical variables using counts and percentages. These descriptive statistics were calculated among those with MAC and those without MAC, regardless of other sites of calcification. This process of calculating descriptive statistics was repeated for those with and without AAIR and with and without AVS. Descriptive statistics were also calculated for those with MAC, AAIR, and AVS in combination, and for the samples of those who had calcification at two, one, or zero sites. Finally, these descriptive statistics were calculated for those who did not have any of MAC, AAIR, or AVS.
Kaplan-Meier plots were generated to show the unadjusted association of moderate/severe AS with each calcification measure individually and the combination of MAC, AAIR, and AVS versus zero, one, or two calcification sites. Cox proportional hazards regression was employed to quantify the association between MAC, AAIR, and AVS, individually and combined, and the AS outcome in the groups as defined above. In the combined model, those with MAC, AAIR, and AVS were compared to the group of those with zero, one, or two calcification sites. Time to event was calculated as the time between the 1994–1995 visit to the earliest of incident AS, death, loss to follow-up, or end of AS follow-up (June 2014). Tests of the proportional hazards assumption revealed no meaningful violations. Hazard ratio (HR) point estimates and confidence intervals are presented, along with Wald p-values. Sample sizes, numbers of events, and person-years for the time-to-event analyses are also presented.
Adjustment for covariates was done using three nested models. These were Model 1: adjusted for age, sex, race, and enrollment year; Model 2 (Main Model): Model 1 + body mass index (BMI), systolic blood pressure, antihypertensives, diabetes, smoking, LDL-C, HDL-C, history of CHD, history of stroke or TIA, history of PAD, and eGFR by cystatin C; Model 3 (Exploratory Model): Model 2 + CRP and IL-6. Primary analyses with Models 1 and 2 used the sample of 3041 individuals without any missing Model 2 covariates, while exploratory analyses with Model 3 used the sample of 2747 individuals without any missing Model 3 covariates.
After observing the results of the primary analyses detailed above, secondary analyses were conducted to assess whether the associations of each calcification site with incident AS were affected by adjusting for either or both additional calcification sites. All regression models in these secondary analyses adjusted for Model 2 covariates and used the sample of 3041 participants. We present HR point estimates, 95% CIs, and Wald p-values, followed by pairwise Linear Hypothesis Chi-Squared Test p-values testing the null hypothesis of equality of calcification site HRs.
Additional exploratory analyses were conducted to evaluate the association of the number of calcification sites (AVS, AAIR, MAC) with AS. The group with no calcification sites was the reference category, while the presence of one, two, and three calcification sites were each treated as binary variables in the same model. A likelihood ratio test (LRT) was performed to evaluate the significance of including variables for the number of calcification sites, comparing models with and without variables for one, two, and three calcification sites. Finally, we assessed the association of calcification with incident AS restricted to cases classified as severe. All regression models in these exploratory analyses used the sample of 3041 participants.
Sensitivity analyses were conducted to test for effect modification of the association between the presence of calcification and AS by either sex or race by including the cross-product term into the model in the primary analyses.
Throughout this paper, p-values were not adjusted for multiple comparisons. Statistical analyses were done using R version 4.0.5.
Results
Among those with no missing Model 2 covariates, 3041 participants had adequate echocardiograms to evaluate MAC, AAIR, and AVS. MAC, AAIR, AVS, and the combination of MAC, AAIR, and AVS were identified in 40%, 43%, 57%, and 18% of included participants, respectively. There were substantial overlaps in calcification sites (Figure 2).
Figure 2.

Venn diagram of calcification types (MAC, AAIR, AVS) among the 3629 individuals without prior AVR or mild or greater AS, and without missing values for any of the 1994–1995 echo, MAC, AAIR, AVS, or AS. Not illustrated are 832 individuals without any calcifications.
Abbreviations – CHS: Cardiovascular Health Study, Echo: echocardiogram, AVR: aortic valve replacement, AS: aortic stenosis, MAC: mitral annular calcification, AAIR: aortic annulus increased reflectivity, AVS: aortic valve sclerosis, IL-6: Interleukin 6, CRP: C-reactive protein.
Demographic and clinical characteristics are shown in Table 1. There were no large differences between the calcification types. Compared with individual calcification sites, the prevalence of CHD, chronic kidney disease, and diabetes were slightly higher in the combined calcification exposure. Kaplan-Meier plots are shown for each calcification measure individually as well as MAC, AAIR, and AVS versus zero, one, or two calcification sites (Figure 3).
Table 1.
Clinical characteristics and biomarker serum levels by calcification exposure, N (%) or Mean (SD), excluding those missing Model 2 covariates or calcification information
| Variables | MAC | AAIR | AVS | MAC & AAIR & AVS | No Calcification | ||||
|---|---|---|---|---|---|---|---|---|---|
| N (%) | Yes 1217 (40%) | No 1824 (60%) | Yes 1312 (43%) | No 1729 (57%) | Yes 1740 (57%) | No 1301 (43%) | Yes 542 (18%) | No 2499 (82%) | 689 (23%) |
| Age (years) | 77 (5) | 76 (5) | 77 (5) | 75 (5) | 76 (5) | 76 (5) | 78 (5) | 76 (5) | 75 (5) |
| Male Sex | 467 (38%) | 742 (41%) | 528 (40%) | 681 (39%) | 744 (43%) | 465 (36%) | 210 (39%) | 999 (40%) | 244 (35%) |
| Black Race | 176 (14%) | 327 (18%) | 201 (15%) | 302 (17%) | 304 (17%) | 199 (15%) | 85 (16%) | 418 (17%) | 124 (18%) |
| Weight (kg) | 72 (14) | 73 (14) | 72 (14) | 73 (14) | 72 (14) | 73 (14) | 71 (14) | 73 (14) | 73 (15) |
| Height* (cm) | 164 (10) | 165 (9) | 164 (10) | 165 (9) | 165 (10) | 164 (9) | 163 (10) | 165 (9) | 164 (9) |
| BMI** (kg/m^2) | 27 (5) | 27 (4) | 27 (4) | 27 (5) | 27 (4) | 27 (4) | 27 (5) | 27 (4) | 27 (5) |
| Systolic BP (mmHg) | 135 (21) | 133 (20) | 135 (21) | 133 (20) | 135 (21) | 133 (20) | 137 (22) | 133 (20) | 133 (19) |
| Enrollment Year | 138 (11%) | 262 (14%) | 169 (13%) | 231 (13%) | 239 (14%) | 161 (12%) | 71 (13%) | 329 (13%) | 101 (15%) |
| HTN | 736 (60%) | 996 (55%) | 773 (59%) | 959 (55%) | 1025 (59%) | 707 (54%) | 333 (61%) | 1399 (56%) | 368 (53%) |
| Diabetes | 237 (19%) | 308 (17%) | 242 (18%) | 303 (18%) | 332 (19%) | 213 (16%) | 118 (22%) | 427 (17%) | 117 (17%) |
| Ever smoker | 636 (52%) | 966 (53%) | 666 (51%) | 936 (54%) | 932 (54%) | 670 (51%) | 289 (53%) | 1313 (53%) | 367 (53%) |
| CHD | 298 (24%) | 359 (20%) | 307 (23%) | 350 (20%) | 412 (24%) | 245 (19%) | 152 (28%) | 505 (20%) | 117 (17%) |
| PAD | 33 (3%) | 49 (3%) | 38 (3%) | 44 (3%) | 55 (3%) | 27 (2%) | 17 (3%) | 65 (3%) | 15 (2%) |
| Stroke or TIA | 114 (9%) | 109 (6%) | 100 (8%) | 123 (7%) | 136 (8%) | 87 (7%) | 54 (10%) | 169 (7%) | 41 (6%) |
| CKD* | 258 (21%) | 313 (17%) | 281 (21%) | 290 (17%) | 346 (20%) | 225 (17%) | 127 (23%) | 444 (18%) | 100 (15%) |
| Anti-HTN | 698 (57%) | 906 (50%) | 720 (55%) | 884 (51%) | 968 (56%) | 636 (49%) | 323 (60%) | 1281 (51%) | 326 (47%) |
| eGFR by CysC* (mL/min/ (1.73 m^2)) | 74 (18) | 76 (18) | 74 (19) | 76 (17) | 75 (19) | 75 (17) | 73 (19) | 75 (18) | 76 (16) |
| Total C* (mg/dL) | 205 (37) | 201 (36) | 203 (38) | 202 (36) | 203 (37) | 202 (37) | 206 (38) | 202 (37) | 201 (37) |
| LDL-C* (mg/dL) | 124 (33) | 119 (33) | 122 (33) | 120 (33) | 122 (33) | 120 (33) | 125 (33) | 120 (33) | 118 (33) |
| HDL-C* (mg/dL) | 53 (14) | 54 (15) | 53 (14) | 54 (15) | 53 (14) | 55 (15) | 53 (14) | 54 (14) | 55 (15) |
| TG* (mg/dL) | 139 (63) | 136 (65) | 137 (65) | 137 (64) | 136 (64) | 138 (65) | 138 (64) | 137 (65) | 138 (67) |
| CRP* (mg/L) | 5.26 (9.61) | 4.78 (7.52) | 4.88 (7.62) | 5.04 (8.98) | 5.02 (8.93) | 4.91 (7.7) | 5.22 (8.08) | 4.92 (8.5) | 4.95 (7.16) |
| IL-6* (pg/mL) | 3.32 (2.12) | 3.14 (2.02) | 3.33 (2.1) | 3.12 (2.03) | 3.26 (2.05) | 3.14 (2.08) | 3.37 (2.01) | 3.17 (2.07) | 3.02 (1.93) |
Measured at 1992–1993
BMI calculated from weight measured at 1994–1995, height measured at 1992–1993, and all other covariates measured at enrollment or analysis baseline of 1994–1995.
Abbreviations - MAC: mitral annular calcification, AAIR: aortic annulus increased reflectivity, AVS: aortic valve sclerosis, BMI: body mass index, BP: blood pressure, HTN: hypertension, CHD: coronary heart disease, PAD: peripheral arterial disease, TIA: transient ischemic attack, CKD: chronic kidney disease, Anti-HTN: anti-hypertensives, eGFR by CysC: estimated glomerular filtration rate by Cystatin C, Total C: total cholesterol, LDL-C: low-density lipoprotein cholesterol, HDL-C: high-density lipoprotein cholesterol, TG: triglycerides, CRP: C-reactive protein, IL-6: Interleukin 6.
Figure 3.

Kaplan-Meier curves for incident moderate/severe AS according to the cardiac calcification groups.
Association of valve calcification exposures with incident moderate/severe AS
The median follow-up time was 11.5 years. In all analyses of the sample of 3041 individuals, there were 110 incident AS events and a total of 35084 person-years. Strong positive associations with incident AS were found for all calcification sites in Models 1 and 2, with minimal decreases in the hazard ratios from Model 1 to Model 2. In each model, AAIR had the highest HR for incident AS, while MAC had the lowest. Adjusting for Model 2 covariates, the risk of AS among those with AAIR was 2.90 times higher than in those without AAIR (95% CI=[1.95, 4.32], p<0.0005) (Table 2). Adjusting for Model 2 covariates, comparing participants with a calcification site to those without that calcification site, MAC, AVS, and the combination of MAC, AAIR, and AVS had HRs of 1.67 (95% CI=[1.14, 2.45], p=0.008), 2.20 (95% CI=[1.44, 3.37], p<0.0005), and 2.50 (95% CI=[1.65, 3.78], p<0.0005), respectively (Table 2). Additional adjustment for CRP and IL-6 had virtually no effect on the hazard ratio estimates (results not shown).
Table 2.
Association of calcification by site with incident probable/definite moderate/severe AS. For all models, n=3041, n Events=110, Person-Years=35084.
| Model | Calcification | AS HR (95% CI), p-value |
|---|---|---|
| Model 1 | MAC | 1.79 (1.23, 2.62), 0.002 |
| AAIR | 2.97 (2.00, 4.41), <0.0005 | |
| AVS | 2.32 (1.52, 3.53), <0.0005 | |
| MAC & AAIR & AVS | 2.76 (1.83, 4.16), <0.0005 | |
| Model 2 | MAC | 1.67 (1.14, 2.45), 0.008 |
| AAIR | 2.90 (1.95, 4.32), <0.0005 | |
| AVS | 2.20 (1.44, 3.37), <0.0005 | |
| MAC & AAIR & AVS | 2.50 (1.65, 3.78), <0.0005 |
Model 1 was adjusted for age, sex, race, and enrollment wave.
Model 2 was adjusted for Model 1 plus BMI, systolic BP, antihypertensives, diabetes, smoking, LDL-C, HDL-C, history of CHD (myocardial infarction, angina pectoris, or coronary revascularization), history of stroke or TIA, history of PAD, and eGFR by cystatin C.
Abbreviations - AS: aortic stenosis, HR: hazard ratio, MAC: mitral annular calcification, AAIR: aortic annulus increased reflectivity, AVS: aortic valve sclerosis, BMI: body mass index, BP: blood pressure, LDL-C: low-density lipoprotein cholesterol, HDL-C: high-density lipoprotein cholesterol, CHD: coronary heart disease, TIA: transient ischemic attack, PAD: peripheral arterial disease, eGFR by CysC: estimated glomerular filtration rate by Cystatin C.
In the secondary analysis in which calcification sites were mutually adjusted for other calcification sites, AAIR was still strongly associated with AS after additionally adjusting for each of MAC (HR=2.72, 95% CI=[1.80, 4.11], p<0.0005), AVS (HR=2.61, 95% CI=[1.75, 3.91], p<0.0005), and MAC and AVS (HR=2.48, 95% CI=[1.64, 3.77], p<0.0005) (Table 3). The hazard ratio for MAC associated with AS was slightly decreased when adjusted for AVS (HR=1.54, 95% CI=[1.05, 2.26], p=0.028), but more so when adjusted for AAIR (HR=1.26, 95% CI=[0.84, 1.87], p=0.261) or both AAIR and AVS (HR=1.20, 95% CI=[0.81, 1.79], p=0.362). Similarly, the hazard ratio for AVS decreased slightly with adjustment for MAC (HR=2.09, 95% CI=[1.36, 3.20], p=0.001), but more so after adjustment by AAIR (HR=1.84, 95% CI=[1.20, 2.84], p=0.006), and MAC and AAIR (HR=1.82, 95% CI=[1.18, 2.80], p=0.007).
Table 3.
Association of calcification site with incident probable/definite moderate/severe AS after adjusting for additional calcification sites and Model 2 covariates. For all models, n=3041, n Events=110, Person-Years=35084. Wald p-values correspond to significance of calcification regression coefficients. Additionally, the null hypotheses of equality of calcification site coefficients are tested and p-values presented.
| Calcification Site | Additional Calcification Covariates | Calcification Site AS HR (95% CI), Wald p-value | Null Hypothesis: MAC=AAIR p-value | Null Hypothesis: MAC=AVS p-value | Null Hypothesis: AAIR=AVS p-value |
|---|---|---|---|---|---|
| MAC | None | 1.67 (1.14, 2.45), 0.008 | |||
| AAIR | 1.26 (0.84, 1.87), 0.261 | 0.019 | |||
| AVS | 1.54 (1.05, 2.26), 0.028 | 0.323 | |||
| AAIR & AVS | 1.20 (0.81, 1.79), 0.362 | 0.028 | 0.184 | ||
| AAIR | None | 2.90 (1.95, 4.32), <0.0005 | |||
| MAC | 2.72 (1.80, 4.11), <0.0005 | 0.019 | |||
| AVS | 2.61 (1.75, 3.91), <0.0005 | 0.284 | |||
| MAC & AVS | 2.48 (1.64, 3.77), <0.0005 | 0.028 | 0.341 | ||
| AVS | None | 2.20 (1.44, 3.37), <0.0005 | |||
| MAC | 2.09 (1.36, 3.20), 0.001 | 0.323 | |||
| AAIR | 1.84 (1.20, 2.84), 0.006 | 0.284 | |||
| MAC & AAIR | 1.82 (1.18, 2.80), 0.007 | 0.184 | 0.341 |
Model 1 was adjusted for age, sex, race, and enrollment wave.
Model 2 was adjusted for Model 1 covariates plus BMI, systolic blood pressure, antihypertensives, diabetes, smoking, LDL-C, HDL-C, history of CHD (myocardial infarction, angina pectoris, or coronary revascularization), history of stroke or TIA, history of PAD, and eGFR by cystatin C.
Abbreviations - AS: aortic stenosis, HR: hazard ratio, MAC: mitral annular calcification, AAIR: aortic annulus increased reflectivity, AVS: aortic valve sclerosis, BMI: body mass index, BP: blood pressure, LDL-C: low-density lipoprotein cholesterol, HDL-C: high-density lipoprotein cholesterol, CHD: coronary heart disease, TIA: transient ischemic attack, PAD: peripheral arterial disease, eGFR by CysC: estimated glomerular filtration rate by Cystatin C.
Additionally, the AAIR HR was significantly different from the MAC HR in the AAIR & MAC (p=0.019) and AAIR & MAC & AVS (p=0.028) models, while the AAIR HR was not significantly different from the AVS HR in either the AAIR & AVS (p=0.284) or AAIR & MAC & AVS (p=0.341) models. The MAC HR was not significantly different from the AVS HR in either the MAC & AVS (p=0.323) or AAIR & MAC & AVS (p=0.184) models.
For the exploratory analyses comparing the number of calcification sites, among the 3041 individuals without any missing MAC, AAIR, AVS, or Model 2 covariates, 23% of participants did not have calcification at any site, 32% had one calcification site, 27% had two calcification sites, and 18% had MAC, AAIR, and AVS. Table 4 shows that the inclusion of the number of calcification sites in the model resulted in a significantly better fit to the data than the model without any calcification covariates, with a LRT p-value < 0.0005. Each calcification category was strongly positively associated with AS risk, and the HR was larger for those with more calcification sites.
Table 4.
Association of number of calcification types with incident probable/definite moderate/severe AS. For all models, n=3041, n Events=110, Person-Years=35084.
| Model | Calcification | AS HR (95% CI), p-value | Likelihood Ratio Test p-value |
|---|---|---|---|
|
| |||
| Model 1 | 0 Calcifications | 1.0 (Ref.) | <0.0005 |
| 1 Calcification | 2.96 (1.36, 6.45), 0.006 | ||
| 2 Calcifications | 4.62 (2.15, 9.94), <0.0005 | ||
| MAC & AAIR & AVS | 7.97 (3.67, 17.29), <0.0005 | ||
|
| |||
| Model 2 | 0 Calcifications | 1.0 (Ref.) | <0.0005 |
| 1 Calcification | 2.90 (1.33, 6.32), 0.008 | ||
| 2 Calcifications | 4.52 (2.09, 9.76), <0.0005 | ||
| MAC & AAIR & AVS | 7.16 (3.28, 15.62), <0.0005 | ||
Model 1 was adjusted for age, sex, race, and enrollment wave.
Model 2 was adjusted for Model 1 covariates plus BMI, systolic blood pressure, antihypertensives, diabetes, smoking, LDL-C, HDL-C, history of CHD (myocardial infarction, angina pectoris, or coronary revascularization), history of stroke or TIA, history of PAD, and eGFR by cystatin C.
Abbreviations - AS: aortic stenosis, HR: hazard ratio, MAC: mitral annular calcification, AAIR: aortic annulus increased reflectivity, AVS: aortic valve sclerosis, BMI: body mass index, BP: blood pressure, LDL-C: low-density lipoprotein cholesterol, HDL-C: high-density lipoprotein cholesterol, CHD: coronary heart disease, TIA: transient ischemic attack, PAD: peripheral arterial disease, eGFR by CysC: estimated glomerular filtration rate by Cystatin C.
We found no evidence of effect modification on the association between calcification and AS by either sex or race.
Of the 3041 individuals included in our primary analyses, only 2% had incident severe AS. Compared to the analysis of moderate/severe AS, the hazard ratios for the associations of calcification sites with severe AS were generally of similar magnitude, with the possible exception of the AVS HR, which appeared substantially higher for severe AS, albeit with wide confidence intervals (HR=5.66, 95% CI=[2.67, 11.98]) (Supplemental files, Table S1).
Discussion
The main finding of this study was that AAIR, MAC, AVS, and the combination of MAC, AAIR, and AVS were each significantly associated with incident moderate/severe AS over a median follow-up of 11.5 years. Moreover, in our exploratory analyses, there was a progressive increase in the strength of the association of number of calcification sites with incident moderate/severe AS such that, in comparison to no calcification, the group with MAC, AAIR, and AVS had a markedly (seven-fold) greater risk of developing probable or definite moderate/severe AS. In an exploratory analysis of the association of cardiac calcification sites with incident severe AS found in 67 (2%) of participants, when compared to the association with moderate/severe AS, the only calcification category that appeared to have an outstanding higher hazard ratio was AVS, but the wide confidence intervals dictate caution in the interpretation of this finding. Of particular interest is the novel finding that AAIR, rarely assessed in clinical practice, was strongly associated with incident AS, even after adjustment for risk factors, inflammation markers, and calcification at other sites. The increased aortic annulus reflectivity could be the result of fibrosis, calcification, or of other processes. None of these hypotheses could be proved in the present study.
The poor inter-reader agreement did not prevent the determination of strong associations of calcification or AAIR with incident aortic stenosis. Since the echocardiograms were performed (1994–1995), there have been substantial improvements in echocardiography equipment. It is likely that improved image quality and techniques such as biplane imaging available in current machines might improve detection and quantitation of aortic annulus reflectivity, as well as AVS and MAC. How this might affect association of these echo findings with incident AS remains to be determined in future population studies.
Although the aortic root wall lacks valve interstitial cells, the aorta and aortic annulus do contain myofibroblasts as a related cell type that can also undergo differentiation into calcifying cells (17). Moreover, studies employing histopathologic techniques showed similarities between atherosclerosis in the vasculature and chronic fibrocalcific changes in the aortic valve and the mitral valve or annulus (18–20).
It is likely that pathobiologic pathways (e.g., atherosclerosis and inflammation) are common to the development of AS, other ectopic calcifications (e.g., aortic and mitral annuli) and adverse outcomes in older individuals. Consistent with this is a previous study in CHS, which showed that all three valve calcification sites are associated with all-cause and cardiovascular mortality (5). Yet, differences in risk factor profiles for AVC, AAIR, and MAC have been documented (21, 22), as has variation in their associations with outcomes (23). As relates to the prominent association of AAIR with incident AS, it is possible that, beyond shared underlying mechanisms, alteration in blood flow characteristics due to structural abnormality of the aortic annulus could increase biomechanical injury of the aortic valve leaflets, hastening development of significant AS (24). However, the present study does not permit evaluation of the causal mechanisms linking AAIR to incident AS.
In a retrospective study of 1494 patients, the prevalence of MAC was three-fold greater in the individuals with AS than those without AS, and it was postulated that MAC may play a direct role in the pathogenesis of AS (6).
In 381 individuals enrolled from the general population in the Stroke Prevention: Assessment of Risk in a Community (SPARK) study, atherosclerotic changes in proximity to the aortic valve (sino-tubular debris and atherosclerosis of the ascending aorta) were strongly associated with AVS (25). In another study of 1242 individuals free of CAD who were evaluated by electron-beam computed tomography for the extent of calcium due to atherosclerosis in five distinct vascular beds and calcium in the aortic and mitral annuli, increased age and history of hypertension were the only traditional cardiovascular risk factors that were independently associated with prevalent aortic annular calcification and MAC. However, individuals with hypercholesterolemia, who were current or former smokers, or who had a family history of CHD had a significantly higher risk for aortic annular calcification but not MAC, as those with calcium in the thoracic aorta (26). Other studies have provided further evidence for the association between MAC and aortic annular calcification with CVD events (27, 28).
In concordance with prior studies, we found that participants with one or all sites of calcification were more likely to have a history of CHD, hypertension, and chronic kidney disease than those without those calcifications, suggesting that the presence of advanced atherosclerosis and hemodynamic alteration are associated with ectopic calcification on the valvular structures. Moreover, with an increased number of cardiac calcifications, the pace of calcium deposition on the aortic cusps could be accelerated, leading to clinically significant AS, which progresses over time.
Overall, we found AAIR in 43% of the participants, which concurs with the results of another large study (26). Importantly, the association of AAIR with the risk of incident AS remained robust after adjusting for factors that were potentially associated with advanced atherosclerosis and ectopic calcification.
Strengths and Limitations
The prospective design and use of a population-based free-living cohort is a strength of the study, as is the adjudication of AS. However, due to the observational nature of the analyzed data, we could not infer mechanistic explanations for the strong association of AAIR and MAC calcification with AS. Although less clinically consequential than severe AS, moderate AS is an important outcome in its own right because it requires increased medical follow-up and, in the setting of a primary indication for CABG, is itself an indication for aortic valve replacement (29). Nonetheless, the findings were consistent with our prespecified hypotheses that there were associations between incident AS and the three studied cardiac calcification sites. Despite the low inter-observer agreement regarding AAIR, its association with incident moderate/severe AS remained robust in all statistical models. Nonetheless, we recognize that poor inter-observer reliability as well as variability in echo acquisition may negatively impact clinical application of these (and other) echo findings. However, the echocardiographic studies that provided the data for this study were done using cardiac ultrasound technology available at that time. We believe that using modern echocardiographic equipment and enhanced examination techniques may improve the inter-observer agreement.
Due to low numbers, we could not conduct a meaningful analysis of the risk of AS by calcification severity. The evaluation of ectopic cardiac calcification by echocardiography precludes accurate quantification of the calcium burden such as that provided by the Agatston method using cardiac-computed tomography (30). Despite this limitation, echocardiography can provide a qualitative or semi-quantitative measure of calcification severity with important diagnostic and prognostic implications.
Conclusions
In a large cohort sampled from an elderly population, MAC, AAIR, AVS, and the combination of all three, were found in a significant number of subjects and had robust associations with significant AS, with AAIR having the strongest association. In exploratory analyses, the risk of AS increased with the number of calcification sites. AAIR retained a strong association with incident AS after additional adjustment for each of MAC, AVS, and MAC and AVS. The particularly strong association of AAIR with incident AS suggests that this simple echocardiographic assessment might be utilized routinely in the clinical echocardiographic examination of older individuals. Research studies on AS prevention may consider including these echocardiographic measures of MAC and AAIR, as well as the more commonly utilized assessment of AVS. Further studies should be conducted to determine if the results of this study can be replicated.
Supplementary Material
Sources of funding
This research was supported by contracts HHSN268201200036C, HHSN268200800007C, HHSN268201800001C, N01HC55222, N01HC85079, N01HC85080, N01HC85081, N01HC85082, N01HC85083, N01HC85086, 75N92021D00006, and grants U01HL080295 and U01HL130114 from the NHLBI, with additional contribution from the National Institute of Neurological Disorders and Stroke (NINDS). Additional support was provided by R01AG023629 from the National Institute on Aging (NIA) and by the St. Francis Hospital. The Heart Center, Research Foundation, Roslyn, NY
Abbreviations
- AAIR
aortic annulus increased reflectivity
- AS
aortic stenosis
- AVS
aortic valve sclerosis
- CHD
coronary heart disease
- CHS
Cardiovascular Health Study
- CVD
cardiovascular disease
- MAC
mitral annular calcification
- PAD
peripheral arterial disease
Footnotes
Declarations of interest: none
References
- 1.Cowell SJ, Newby DE, Boon NA, Elder AT. Calcific Aortic Stenosis: Same Old Story? Age Ageing. 2004; 33:538–544. [DOI] [PubMed] [Google Scholar]
- 2.Lindroos M, Kupari M, Heikkila J, Tilvis R. Prevalence of Aortic Valve Abnormalities in the Elderly: An Echocardiographic Study of a Random Population Sample. J Am Coll Cardiol.. 1993;21:1220–1225. [DOI] [PubMed] [Google Scholar]
- 3.Movahed M, Saito Y, Ahmadi-Kashani M, Ebrahami R. Mitral Annulus Calcification is Associated with Valvular and Cardiac Structural Abnormalities. Cardiovasc Ultrasound. 2007;5:14. [DOI] [PMC free article] [PubMed] [Google Scholar]
- 4.Messika-Zeitoun D, Bielak LF, Peyser PA, Sheedy PF, Turner ST, Nkomo VT, et al. Aortic Valve Calcification: Determinants and Progression in the Population. Arterioscler Thromb Vasc Biol. 2007;27:642–648. [DOI] [PubMed] [Google Scholar]
- 5.Barasch E, Gottdiener JS, Larsen KE, Newman AB, Manolio TA. Calcification of the Fibrous Skeleton of the Heart and Aortosclerosis in the Community Dwelling Elderly. The Cardiovascular Health Study. Am Heart J. 2006;151:39–47. [DOI] [PubMed] [Google Scholar]
- 6.Dweck MR, Boon NA, Newby DE. Calcific Aortic Stenosis: A Disease of the Valve and the Myocardium. J Am Coll Cardiol. 2012;60:1854–63. [DOI] [PubMed] [Google Scholar]
- 7.Dweck MR, Khaw HJ, Sng GK, Luo EL, Baird A, Williams MC, et al. Aortic Stenosis, Atherosclerosis, and Skeletal Bone: Is there a Common Link with Calcification and Inflammation? Eur Heart J. 2013;34:1567–1574. [DOI] [PubMed] [Google Scholar]
- 8.Novaro GM, Katz R, Aviles RJ, Gottdiener JS, Cushman M, Psaty BM, et al. Clinical Factors, But Not C-Reactive Protein, Predict Progression of Calcific Aortic-Valve Disease: The Cardiovascular Health Study. J Am Coll Cardiol. 2007;50:1992–1999. [DOI] [PubMed] [Google Scholar]
- 9.Ngo DTM, Sverdlov AL, Willoughby SR, Nightingale AK, Chirkov YY, McNeil JJ, et al. Determinants of Occurrence of Aortic Sclerosis in an Aging Population. J Am Coll Cardiol Img. 2009;2:919–927. [DOI] [PubMed] [Google Scholar]
- 10.Otto CM, Lind BK, Kitzman DW, Gersh BJ, Siscovick DS. Association of Aortic-Valve Sclerosis with Cardiovascular Mortality and Morbidity in the Elderly. N Engl J Med. 1999;341:142–147. [DOI] [PubMed] [Google Scholar]
- 11.Cosmi JE, Kort S, Tunick PA, Rosenzweig BP, Freedberg RS, Katz ES, et al. The Risk of Development of Aortic Stenosis in Patients with Benign Aortic Valve Thickening. Arch Intern Med. 2002;162:2345–2347. [DOI] [PubMed] [Google Scholar]
- 12.Owens DS, Bartz TM, Buzkova P, Massera D, Biggs ML, Carlson SD, et al. Cumulative Burden of Clinically Significant Aortic Stenosis in Community-Dwelling Older Adults. Heart. 2021;107):1493–1502. [DOI] [PMC free article] [PubMed] [Google Scholar]
- 13.Fried LP, Borhani NO, Enright P, Furberg CD, Gardin JM, Kronmal RA, et al. The Cardiovascular Health Study: Design and Rationale. Ann Epidemiol. 1991;1:263–276. [DOI] [PubMed] [Google Scholar]
- 14.Gardin JM, Wong ND, Bommer W, Klopfenstein HS, Smith VE, Tabatznik B, et al. Echocardiographic Design of a Multicenter Investigation of Free-Living Elderly Subjects: The Cardiovascular Health Study. J Am Soc Echocardiogr. 1992;5:63–72. [DOI] [PubMed] [Google Scholar]
- 15.American Diabetes Association (2014) Standards of Medical Care in Diabetes—2014. Diabetes Care 37(Suppl 1):S14–S80. [DOI] [PubMed] [Google Scholar]
- 16.Newman DJ, Thakkar H, Edwards RG, Wilkie M, White T, Grubb AO, et al. Serum Cystatin C Measured by Automated Immunoassay: A More Sensitive Marker of Changes in GFR Than Serum Creatinine. Kidney Int. 1995;47:312–318. [DOI] [PubMed] [Google Scholar]
- 17.Proudfoot D, Skepper JN, Shanahan CM, Weissberg PL. Calcification of Human Vascular Cells in Vitro is Correlated with High Levels of Matrix GlaProtein and Low Levels of Osteopontin Expression. Arterioscler ThrombVasc Biol. 1998;18:379–388. [DOI] [PubMed] [Google Scholar]
- 18.Walton K, Williamson N, Johnson A. The Pathogenesis of Atherosclerosis of the Mitral and Aortic Valves. J Pathol. 1970;101:205–220. [DOI] [PubMed] [Google Scholar]
- 19.Otto CM, Kuusisto J, Reichenbach DD, Gown AM, O’Brien KD. Characterization of the Early Lesion of “Degenerative” Valvular Aortic Stenosis: Histological and Immunohistochemical Studies. Circulation. 1994;90:844–853. [DOI] [PubMed] [Google Scholar]
- 20.Massera D, Kizer JR, Dweck MR. Mechanisms of mitral annular calcification. Trends Cardiovasc Med. 2020;30:289–295. [DOI] [PubMed] [Google Scholar]
- 21.Bortnick AE, Xu S, Kim RS, Kestenbaum B, Ix JH, Jenny NS, et al. Biomarkers of mineral metabolism and progression of aortic valve and mitral annular calcification: The Multi-Ethnic Study of Atherosclerosis. Atherosclerosis. 2019;285:79–86. [DOI] [PMC free article] [PubMed] [Google Scholar]
- 22.Bortnick AE, Bartz TM, Ix JH, Chonchol M, Reiner A, Cushman M, et al. Association of inflammatory, lipid and mineral markers with cardiac calcification in older adults. Heart. 2016;2 1826–1834. [DOI] [PMC free article] [PubMed] [Google Scholar]
- 23.Kizer JR, Wiebers DO, Whisnant JP, Galloway JM, Welty TK, Lee ET, et al. Mitral annular calcification, aortic valve sclerosis, and incident stroke in adults free of clinical cardiovascular disease: The Strong Heart Study. Stroke. 2005; 36:2533–7. [DOI] [PubMed] [Google Scholar]
- 24.Dutta P, James JF, Kazik H, Lincoln J. Genetic and Developmental Contributors to Aortic Stenosis. Circ Res. 2021;128:1330–1343. [DOI] [PMC free article] [PubMed] [Google Scholar]
- 25.Agmon Y, Khandheria BK, Meissner I, Sicks JR, O’Fallon WM, Wiebers DO, et al. Aortic Valve Sclerosis and Aortic Atherosclerosis: Different Manifestations of the Same Disease? Insights from a Population-Based Study. J Am Coll Cardiol. 2001;38:827–834. [DOI] [PubMed] [Google Scholar]
- 26.Allison MA, Cheung P, Criqui MH, Langer RD, Wright CM. Mitral and Aortic Annular Calcification are Highly Associated with Systemic Calcified Atherosclerosis. Circulation. 2006;113:861–6. [DOI] [PubMed] [Google Scholar]
- 27.Benjamin EJ, Plehn JF, D’Agostino RB, Belanger AJ, Comai K, Fuller DL, et al. Mitral Annular Calcification and the Risk of Stroke in an Elderly cohort. N Engl J Med. 1992;327:374–379. [DOI] [PubMed] [Google Scholar]
- 28.Jeon DS, Atar S, Brasch AV, Luo H, Mirocha J, Naqvi TZ, et al. Association of Mitral Annulus Calcification, Aortic Valve Sclerosis and Aortic Root Calcification with Abnormal Myocardial Perfusion Single Photon Emission Tomography in Subjects Age ≤65 years old. J Am Coll Cardiol. 2001;38:1988–1993. [DOI] [PubMed] [Google Scholar]
- 29.Otto CM, Nishimura RA, Bonow RO, Carabello BA, Erwin JP 3rd, Gentile F, Jneid H, Krieger EV, Mack M, McLeod C, O’Gara PT, Rigolin VH, Sundt TM 3rd, Thompson A, Toly C. 2020 ACC/AHA Guideline for the Management of Patients With Valvular Heart Disease: Executive Summary: A Report of the American College of Cardiology/American Heart Association Joint Committee on Clinical Practice Guidelines. Circulation. 2021;143:e35–e71. Erratum in: Circulation. 2021;143:e228. Erratum in: Circulation. 2021;143:e784. [DOI] [PubMed] [Google Scholar]
- 30.Koshkelashvili N, Codolosa JN, Goykhman I, Romero-Corral A, Pressman GS. Distribution of Mitral Annular and Aortic Valve Calcium as Assessed by Unenhanced Multidetector Computed Tomography. Am J Cardiol. 2015;116:1923–7. [DOI] [PubMed] [Google Scholar]
Associated Data
This section collects any data citations, data availability statements, or supplementary materials included in this article.