

Abstract
Purpose:
To evaluate the effects of cyclic vs daily of teriparatide treatment (TPTD) on volumetric bone mineral density (vBMD) and bone strength at the hip and spine in women who were previously untreated.
Methods:
A total of 86 women were randomized to a 24-month open label treatment of either daily TPTD (20 μg daily) or cyclic TPTD (20 μg daily for 3 months followed by 3 months off). During a 2-year extension, women in the daily TPTD group were switched to alendronate (ALN) and those in the cyclic TPTD group continued on cyclic TPTD (without any ALN). QCT images were acquired at baseline, 2-years (n=54) and 4-years (n=35) and analyzed for volumetric integral, cortical and trabecular bone mineral density (vBMD) and bone strength (by finite element analysis) at the hip and spine. The primary analysis presented here compared the responses across equal total TPTD doses (2 years daily vs 4 years cyclic).
Results:
In the spine, integral vBMD and strength increased substantially after 2 years daily and 4 years cyclic TPTD, with no significant differences (vBMD +12% vs +11%, respectively, p=0.70); spine strength +21% vs +16%, respectively, p=0.35. At the hip, the gains were smaller, but again no significant differences were detected between the groups for the increases in either vBMD (+2% in both groups, p=0.97) or hip strength (3% vs 3%, p=0.91). In the spine, the vBMD increment was about twice as large in the trabecular vs peripheral compartment; in the hip, significant vBMD gain was seen only in the trabecular compartment.
Conclusions:
The gains in volumetric BMD and bone strength for an equivalent dose of TPTD did not depend on whether it was administered every day over two years or cyclically over four years.
Keywords: teriparatide, volumetric bone mineral density, bone strength, QCT
Introduction
Parathyroid hormone 1–34 (teriparatide, TPTD) is recommended as initial therapy in women at very high risk of fracture 1. TPTD stimulates bone formation and bone remodeling with resulting increased bone mass, improved microarchitecture, increased strength, and reduced risk of fracture 2–13. The biochemical response to TPTD is well characterized, with a sharp increase in markers of bone formation upon initiation 3,7,11,12, peak levels within the year and subsequent decline to near baseline within 18–24 months 13. In contrast, the rise in markers of bone resorption is delayed, but the peak occurs at a similar time as seen with formation markers 3,5,11,13. Accordingly, the increase in spine bone mineral density (BMD) following TPTD is most rapid within the first 6 months of treatment. 3–5,7,10–12. Histomorphometric analyses of iliac crest biopsies also indicate dramatic direct stimulation of bone formation (modeling-based formation) as early as 1 month, and subsequent stimulation of remodeling-based formation between 1 and 6 months 9,14–16. Both types of bone formation are mitigated by 18–36 months 8,17–19. Collectively, the biochemical marker levels, BMD, and histomorphometric data suggest a dampened response and developing resistance to the effects of continued TPTD administration during the second year. This may be due to depletion of the osteoblast progenitor pool, or to the induction of bone formation inhibitors, such as the Wnt antagonist DKK1 20,21.
Considering these findings, we proposed an alternative cyclic administration of TPTD (in 3-month cycles) based on two specific hypotheses. The first was that early direct stimulation of bone formation without prior resorption 22 might be more important to accrual of new bone tissue than later activation of bone remodeling. The second hypothesis was that repeated short cycles of TPTD might circumvent the partial tachyphylaxis that develops after 6–18 months of continuous daily therapy. Short TPTD cycles could potentially dissociate the early modeling-based anabolic effect from the later remodeling-based effect. We previously published DXA-based areal BMD outcomes results from the two and four-year arms of this trial 23,24; in previously untreated women, those in the cyclic group, who received half the dose of TPTD over 2 years, had half the increment in spine and total hip BMD23. However, comparing equal doses of TPTD given daily over 2 years vs cyclic over 4 years, there were no group differences in the BMD gains. Similarly, comparing equal times, at the end of 4 years, there were no significant differences in BMD increment between groups at any site except the total hip, where the BMD increment was higher in the Daily group (4.7%), which received 2 years of alendronate after finishing TPTD vs. the Cyclic group (2.6%)24.
A limitation of BMD measurements using DXA is their 2-dimensional nature; the modality cannot measure true volumetric BMD and cannot estimate relative amounts of cortical and trabecular bone, variations in cortical thickness, or volumetric spatial distribution of bone density, nor can they quantify bone strength 25. These limitations can be important for anabolic treatments, which can affect the cortical and trabecular compartments differently 26. Also, for the spine, changes in the posterior elements can obscure the more biomechanically relevant changes in the vertebral body 27. In-vivo assessment of these parameters can be non-invasively obtained through quantitative computed tomography (QCT) scans and finite element analysis, a computational method for strength analysis of complex structures 28-26,29. This technique has been applied previously to assess the biomechanical effects of daily administration of TPTD 30–33 and is cleared by the FDA to assess treatment effects in bone strength. In this study, we assessed QCT-based measurements of vBMD and bone strength determined by finite element analysis, at the hip and spine, to compare the effects of the same total dose of TPTD administered over two (daily) versus four (cyclic) years, in a large subset (77%) of participants from the original study.
Methods
Patient Population
This was a randomized, open-label study in postmenopausal women with osteoporosis recruited from our osteoporosis clinic and bone density center and from the community by advertisement and public speaking at educational programs and support groups. Sample selection was described in previously published manuscripts23,24. Briefly, women with minimal or no prior osteoporosis therapy (Rx-naive; n = 86) were recruited and randomized to daily TPTD or cyclic TPTD for a total treatment period of 24 months. After completion of the 2-year study 23, participants who had BMD t-scores ≤ −2.0 at the lumbar spine (LS), total hip (TH), or femoral neck (FN) were offered enrollment in a 2 year extension study; 87% (n=54) of women were eligible. A separate cohort of women who had been treated with Alendronate were recruited separately and randomized to receive daily or cyclic TPTD following the same protocol. The focus of this paper is the treatment naive group; results for the ALN-Rx cohort are presented in the Supplemental Material.
This study was approved by the Helen Hayes Hospital Institutional Review Board and all women provided informed consent with oversight by a DSMB appointed by NIH-NIAMS.
Treatment Assignment
At the start of the primary two-year study, volunteers were randomly assigned (via SAS generated allocation) to open label daily TPTD treatment (20 μg daily subcutaneously for 24 months) or cyclic TPTD (3 months on 20μg TPTD, followed by 3 months off) for 24 months. During the extension study, women who had 2 years of daily TPTD were given ALN for the next two years and those on the cyclic regimen continued their cyclic TPTD treatment for 4 years, with no other intervening treatment.
Volunteers presented to the Clinical Research Center every 3 months for assessment of compliance, side effects, medication distribution, bone density imaging and lab assessment. QCT measurements were made at baseline, 2 and 4 years at a local radiology center (Ramapo Radiology in Rockland County, NY). Scans were acquired at 120kV with a pitch of 1 using 170 mAs in the hip, and 100 mAs in the spine, and then reconstructed using a medium kernel and field of view of 400 mm in the hip and 360 mm in the spine, such that the reconstructed slice thickness was <1.25 mm.
QCT Calculations and Finite Element Models
All image processing and analysis was done blinded to treatment by O.N. Diagnostics (Berkeley, CA) using the VirtuOst software. Briefly, each image was first calibrated using a model Liquid K2HPO4 calibration phantom that was imaged with each patient. The images were then segmented and rotated into a standard coordinate system. For the finite element analysis,10,26,29,34,35 the images were then converted into cube-shaped 8-noded brick finite elements (1.5mm/side for the hip, 1.0mm/side for the spine) to form the final finite element mesh (typically, about 40,000 elements per model). Material properties were assigned to each element based on the underlying calibrated BMD data for each element, and then non-linear finite element analysis was run to provide measurements of the strength of the L1 vertebral body for a simulated compressive overload and the strength of the left proximal femur for a simulated sideways fall.
As described previously35 volumetric BMD of the entire vertebral body and total hip regions was measured, by a QCT analyst blinded to the outcomes. In addition, the BMD and strength measurements were made for the cortical and trabecular compartments. Volumetric bone density was calculated by dividing the mineral content from the model calibration phantom by the corresponding volume. The “cortical” compartment was defined to include all obvious cortical bone (defined as bone having an apparent BMD of >1.0 g/cm3), while the “peripheral” compartment was defined as all cortical bone plus any bone within a fixed distance of the periosteal surface (3 mm for the hip, and 2 mm for the spine). The trabecular compartment was defined as all remaining trabecular bone.
Statistical Analysis
Statistical Analyses were performed using R Studio version 1.3.1056 (Boston, MA)36. Graphs were made using GraphPad Prism version 8.0.0 for Windows, GraphPad Software, San Diego, California USA, www.graphpad.com”. Baseline comparisons of demographics were made using one-way ANOVA. These analyses included only women who had both baseline and 2-year QCT scans for the 2-year assessments and only women who completed both baseline and 4-year QCT scans for the 4-year assessments.
Within-group differences between times and between-group differences at 2 and 4 years were analyzed using linear mixed-effects models for repeated measures. Normality was assessed via Shapiro-Wilkes test. In the primary analysis, we considered a comparison of equal TPTD doses which compared two years of daily to 4 years of cyclic TPTD. For this analysis, both Daily and Cyclic groups had the equivalent cumulative doses of TPTD and no other treatment. A secondary analysis (equal time period) was performed comparing changes in the Cyclic and Daily Groups at 2 years and again at 4 years. For this analysis, at 2 years, the Cyclic group had half the TPTD dose compared with the Daily group. At 4 years, although Daily and Cyclic groups had the same cumulative TPTD dose, the Daily group also had 2 years of ALN that the Cyclic group did not.
Results
62 women completed the 2-year parent study and 54 were eligible and enrolled in the extension study. On the basis of monthly diaries, the self-reported compliance was above 80% for all subjects in this study. For the 2-year QCT endpoint, 49 subjects completed QCT visits at baseline and 2 years. A total of 4 QCT scans, including 2 spine and 2 hip scans, were excluded from the final 24-month analysis because the difference in QCT measurements exceeded 3 SD beyond the mean difference for the cohort and were considered outliers. For the 48-month endpoint, 28 subjects completed all 3 QCT visits (baseline, 24 months, 48 months).
Baseline Characteristics for the 2 Year Endpoint
Table 1 illustrates baseline characteristics for subjects who completed the 24-month parent study and had either a spine and/or hip QCT (n=54). The Daily and Cyclic groups had similar age, height, weight, body mass index (BMI), spine and hip BMD, integral spine and hip strength, and QCT variables including total hip and spine density, peripheral and trabecular density. The mean BMD t-score was in the osteoporosis range for the spine whereas it was in the low bone mass range for the hip. Mean breaking strength at the hip was 2840 ± 382 N for the “daily” group and 2960 ± 573 N for the “cyclic” group, both of which are just below the clinical threshold for “fragile bone strength” (≤ 3,000 N), placing these patients at high risk of hip fracture25. Similarly at the spine, mean vertebral strength was the same in both groups (3940 ± 729 and 4010 ± 719) and was in the fragile bone strength range for the spine (≤ 4,500 N), placing the patients at high risk of vertebral fracture25.
Table 1.
Baseline Characteristics
| Daily (N=25) | Cyclic (N=29) | |
|---|---|---|
| Age (Years) | 61.7 ± 7.18 | 62.9 ± 7.07 |
| YFM (Years) | 13.8 ± 9.41 | 14.4 ± 9.01 |
| Height (cm) | 160 ± 6.16 | 163 ± 6.55 |
| Weight (Kg) | 60.8 ± 8.41 | 65.4 ± 14.2 |
| BMI (Kg/m2) | 23.7 ± 2.99 | 24.6 ± 5.47 |
| Years ALN | NA | NA |
| Spine Areal BMD T-score | −3.17 ± 0.942 | −3.04 ± 0.653 |
| Hip Areal BMD T-Score | −2.11 ± 0.731 | −2.05 ± 0.826 |
| Total Spine Density (mg/cm3) | 139 ± 17.5 | 141 ± 17.8 |
| Trabecular Spine Density (mg/cm3) | 115 ± 16.5 | 117 ± 17.2 |
| Peripheral Spine Density (mg/cm3) | 189 ± 20.1 | 190 ± 19.7 |
| Total Spine Strength (N) | 3940 ± 729 | 4010 ± 719 |
| Total Hip Density (mg/cm3) | 213 ± 28.7 | 209 ± 33.3 |
| Trabecular Hip Density (mg/cm3) | 149 ± 25 | 151 ± 29.7 |
| Peripheral Hip Density (mg/cm3) | 345 ± 34.6 | 334 ± 39.3 |
| Cortical Hip Thickness (mm) | 2.47 ± 0.2 | 2.52 ± 0.27 |
| Total Hip Strength (N) | 2840 ± 382 | 2960 ± 573 |
Changes Over 2 Years
Spine (Figure 1):
Fig 1.

Mean absolute change ± SD and percentage change at two years from baseline for the CT-based measurements of the spine. There were significant increases in both the Daily (n=27) and Cyclic (n=22) groups for all four measurements, but increments in integral density, trabecular density, and strength in the Daily group exceeded those in the Cyclic group (group difference # = p<0.05, ## = p<0.01; within group differences from baseline *= p<0.05, **= p<0.01).
In both groups, there were significant increases in all spine QCT variables including strength over 2 years. The increases in integral vBMD reflected increases in both the trabecular and peripheral compartments. For all variables, increments in the Daily group exceeded those of the Cyclic group: for total bone density 12% vs 8% (p<0.001) and for vertebral strength 22% in vs 12% (p<0.001), respectively.
Hip (Figure 2):
Fig 2.

Mean absolute change ± SD and percentage change at two years from baseline for the CT-based measurements of the hip. In the Daily group (n=17), increases in all variables were seen except for peripheral hip density. Significant increments were seen in the Cyclic group (n=27) only for trabecular hip density. However, differences between Daily and Cyclic groups were only significant for trabecular hip density (group difference ## = p<0.01; within group differences from baseline *= p<0.05, **= p<0.01).
The effect sizes for all hip QCT variables were lower than those seen for spine QCT variables. In the Daily group, total hip bone density increased 2% (p<0.05), solely due to the increment in trabecular BMD of 6% (p<0.001), with no change in peripheral bone density. In the Cyclic group, the increment in total hip BMD was only 1% (NS), with an increase of 2% (p<0.05) in trabecular hip density and again no change in peripheral bone density. Total hip strength increased 5% (p<0.005) in the Daily group and only 1% (NS) in the Cyclic group. However, group differences were only noted for trabecular hip density.
Changes Over 4 Years
Changes over 4 years were compared in the subgroups of individuals who attended and completed all 3 QCT visits (baseline, 24 months, and 48 months). 10 people from the Daily and 15 from the Cyclic group completed all 3 visits. Baseline demographics and QCT variables were not significantly different between these subgroups and the groups who enrolled in the 24-month study. In addition, baseline characteristics for these subgroups were also similar to the full groups that completed the 2-year trial. Significance testing was performed for measurements comparing baseline to 48 months and 24 to 48 months.
Spine (Figure 3):
Fig 3.
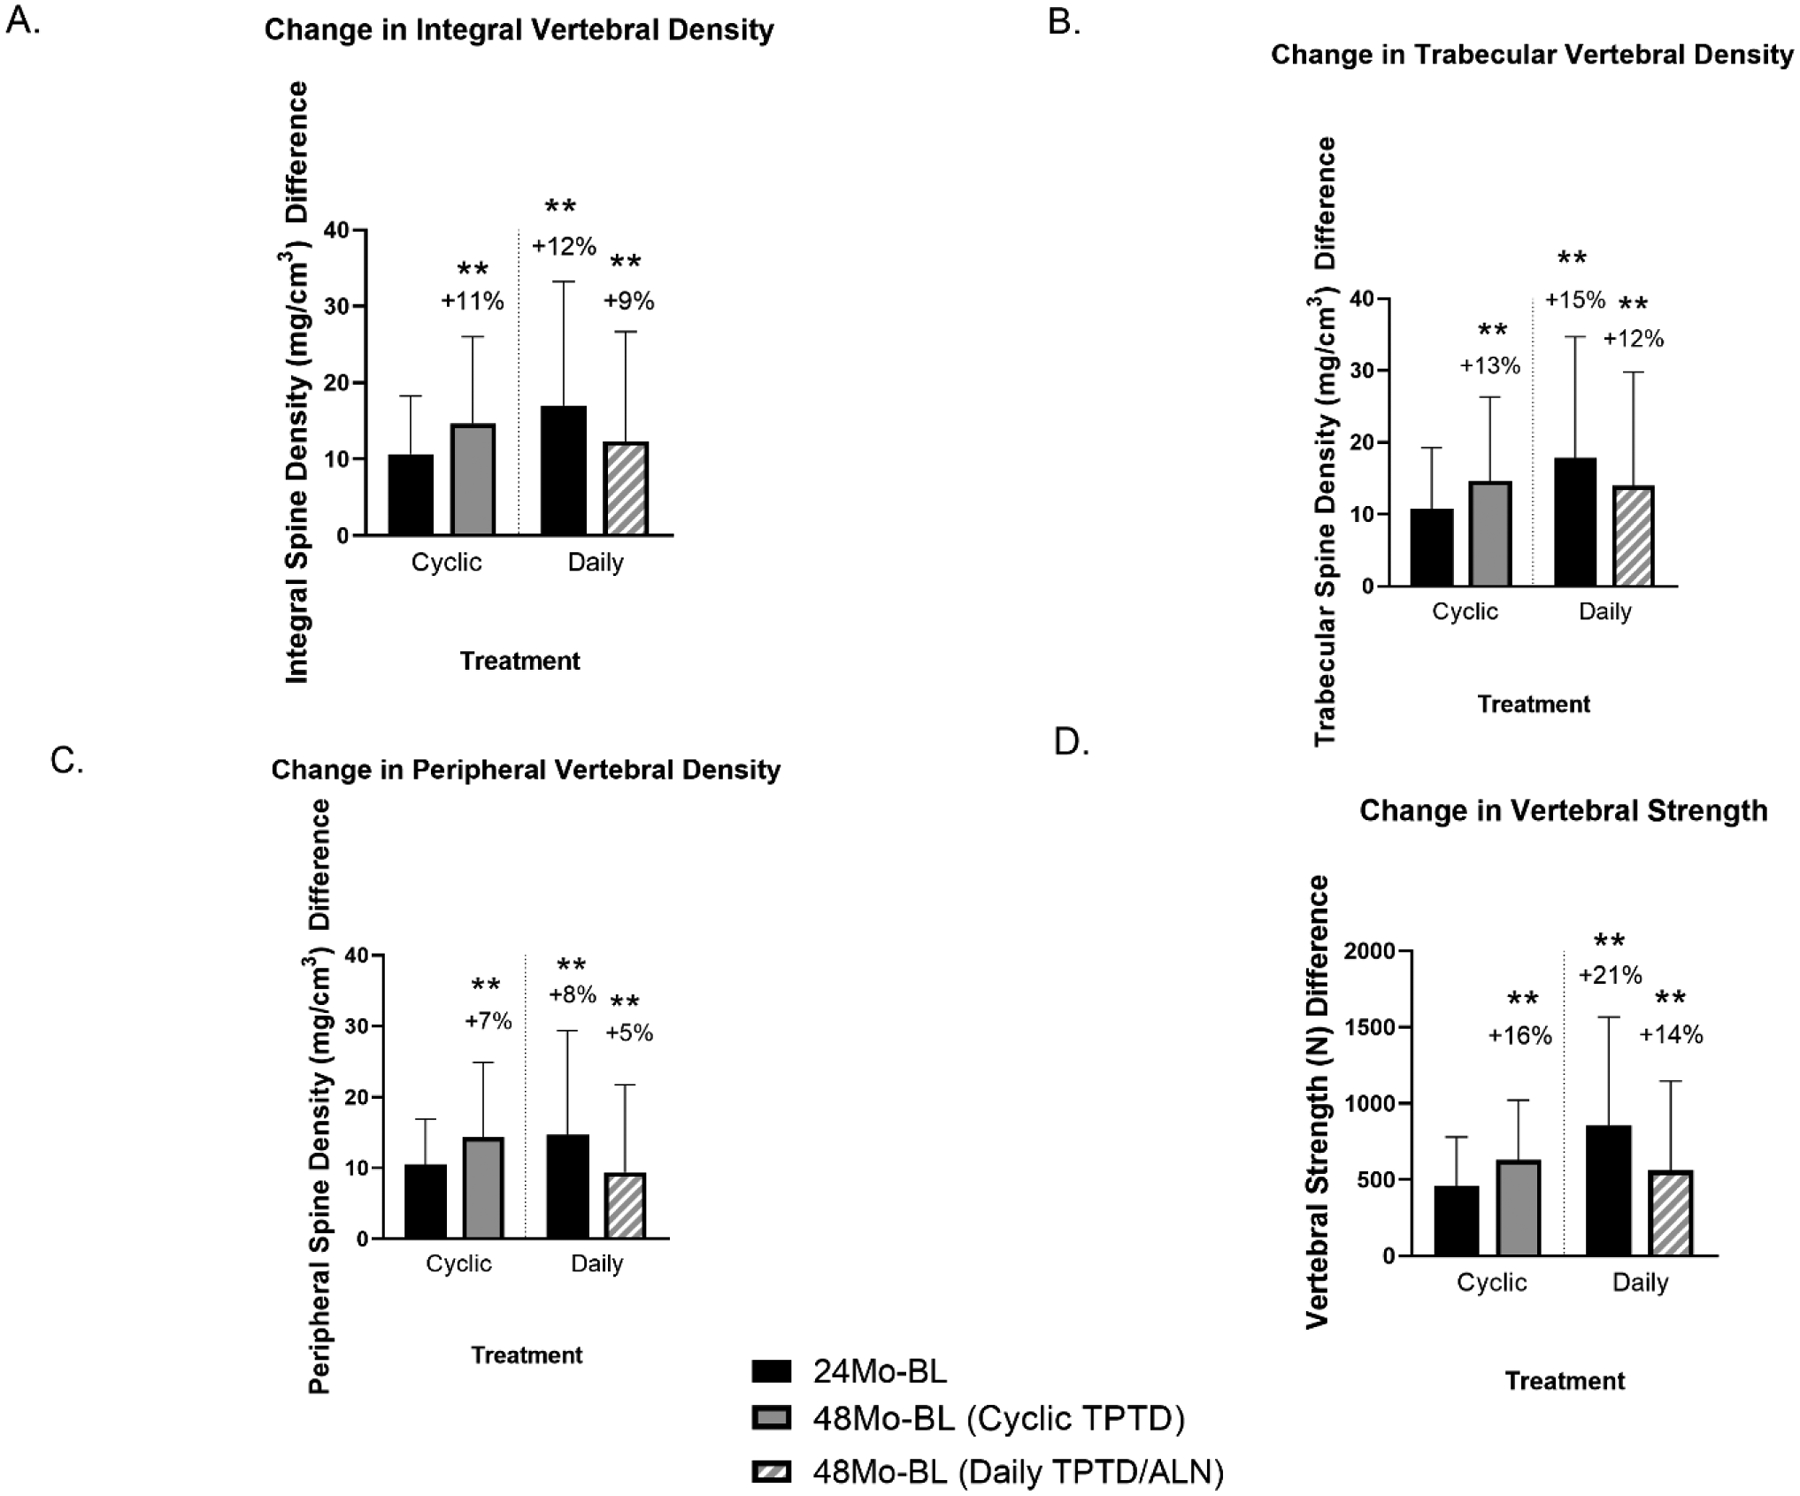
Mean absolute change ± SD and percentage change at four years from baseline for CT-based measurements of the spine over 4 years. The cross-hatched red bar serves to distinguish the 48-month Daily group, since the cohort was on ALN treatment for 24 months after TPTD. Sample sizes were cyclic (n=15) and daily (n=11). Over 4 years, after administration of the same cumulative TPTD dose, increases in all 4 variables did not differ between the groups (within group differences from baseline *= p<0.05, **= p<0.01).
Equal doses:
All QCT variables increased similarly comparing 24 months of Daily TPTD vs 48 months of Cyclic TPTD and there were no group differences: total spine density +12% vs +11%; trabecular spine density +15% vs +13%; peripheral spine density +8% vs +7%; and total spine strength +21% vs +16%, respectively.
Equal time:
Both groups demonstrated significant increases in all 4 spine QCT variables over the course of 4 years. In the Daily group, after cessation of TPTD and initiation of ALN at 24 months, there were no further increases in any of the variables during the ALN treatment period (24–48 months), but all increments seen at 2 years were maintained. In the Cyclic group, there were modest gains in each of the variables between months 24 and 48 as Cyclic TPTD was continued. At 48 months, total spine density had increased 9% in Daily (p<0.001) and 11% in Cyclic (p<0.001; NS group difference). Similarly, spine strength had increased 14% in Daily (p<0.001) and 16% in Cyclic (p<0.001; NS group difference).
Hip (Figure 4):
Fig 4.

Mean absolute change ± SD and percentage change at four years from baseline for the CT-based measurements of the hip over 4 years. The cross-hatched red bar serves to distinguish the 48-month Daily group, since the cohort was on ALN treatment for 24 months after TPTD. Sample sizes were cyclic (n=15) and daily (n=9). In the Daily group, there were significant increases in total hip density, trabecular hip density, and total hip strength. The only significant increase over 4 years in the Cyclic group was for trabecular hip density; however no significant between-group differences were found (within group differences from baseline *= p<0.05, **= p<0.01).
Equal Dose:
A comparison of Daily TPTD changes at 24 months with Cyclic TPTD changes at 48 months revealed no significant differences for any QCT variables: total hip density +2% vs +2%; trabecular hip density +5% vs +3%; peripheral hip density −2% vs +0.4%; cortical hip thickness +4% vs +2%; and total hip strength +3% vs +3%, respectively.
Equal Time:
Over 48 months, in the Daily group, total hip density increased 3% (p<0.05), trabecular hip density 6% (p<0.001) and total strength 5% (p<001). There were no significant differences in any of the variables from 24 to 48 months as women transitioned from TPTD to ALN. In the Cyclic group, significant increases were seen in trabecular hip density and hip strength over 48 months, but despite continued cyclic TPTD from 24 to 48 months, there were no increments in any of the variables during this period. At 48 months, the Cyclic group only exhibited an increase in trabecular hip density (p<0.05). However, there were no significant group differences for any of these variables.
Discussion:
In the spine, over 2 years, increments in volumetric BMD and strength were substantial in both cyclic and daily groups but significantly higher with daily therapy, which provided twice the dosage of TPTD. After transition to alendronate in the Daily cohort, the increments at 2 years were maintained, whereas in the Cyclic group, which continued to receive cyclic TPTD, BMD and strength continued to increase modestly. Ultimately, equal dose comparisons demonstrated no benefit for cyclic over daily administration, with increments that were remarkably similar with the same cumulative TPTD dose. Hip density and strength increments were lower than those demonstrated in the spine, but still increases in hip indices were largest in the Daily group with additional gains in hip BMD during ALN treatment from years 2–4. In our secondary analysis (equal time comparison over 48 months), there were again similar increases in spine density and spine strength in both groups and hip BMD changes did not differ significantly between Daily and Cyclic groups. Only the Daily regimen exhibited significantly higher hip strength after 4 years of treatment. This could be partially explained by the observed improvement in peripheral density between the 2- and 4-year timepoints with reduced cortical porosity and/or additional cortical mineralization of new tissue formed in the first two years contributing to increases in total hip strength.
Our original hypothesis underlying this study was that cyclic administration of TPTD might allow greater bone accrual by circumventing tachyphylaxis from daily therapy. Our prior studies demonstrated no significant benefit to DXA-measured BMD via cyclic administration23,24, and our current study supports those findings with a volumetric analysis including peripheral and trabecular bone density. Clearly 3-month periods off TPTD do not enhance cellular responsivity to subsequent administration of TPTD. It is important to note that women in the Daily group received 2 years of ALN in addition to the 2 years of TPTD, while women in the Cyclic group received only the 2-year equivalent cumulative dose of TPTD. This might suggest that the Daily group should have had a greater BMD increase at 4 years compared to the Cyclic group; however, this was not seen. There were no significant group differences between Daily and Cyclic groups in any hip or spine QCT variables after 4 years of study, despite significant group differences found in all spine QCT variables (with the exception of peripheral density) over 2 years. Thus, daily administration of TPTD may have a significant benefit in improving vertebral bone mass over 2 years, but this advantage is attenuated over 4 years, once the equivalent TPTD dose has been administered. For hip strength, it is possible that maximal effects require closure of the remodeling space with an antiresorptive and reduced cortical porosity, and/or more complete mineralization33,37.
Importantly, QCT data has permitted a better understanding of alterations in peripheral and trabecular compartments from daily and cyclic TPTD administration. For example, gains in volumetric hip density with Daily or Cyclic TPTD over 2 years were almost entirely due to increases in trabecular hip density, with an actual decline in peripheral density, likely due to increased cortical porosity. Over 4 years, gains in both the trabecular and peripheral compartments were seen, with larger gains still seen in the trabecular compartment.
This study does not address the issue of longer-term treatment sequences where data suggest that anabolic followed by antiresorptive treatment is the best approach for BMD gain, bone strengthening and fracture resistance 37,38. Here we have shown that when no antiresorptive is administered between 3- month TPTD cycles, cyclic TPTD can be given with no reduction or enhancement of the overall effect. In fact, gains in volumetric BMD and bone strength for an equivalent dose of teriparatide were similar whether administered every day over two years or cyclically over four years. This cyclic approach could potentially be useful in selective patients, such as those who may not be candidates for an intervening antiresorptive drug. Beyond selective circumstances, however, we do not see a clinical role for short-term cyclic therapy; the standard approach with proven fracture outcomes remains the preferred regimen for TPTD therapy 2,38,39.
The limitations of this study include a small sample size with limited power to elucidate differences in strength and BMD, particularly at 4 years. It is very likely that we were underpowered to see some of the differences between groups. As pointed out, both the primary and secondary analyses were limited by inequivalent ALN doses and unequal time and aging (although only 2 years) of the groups. We defined the “peripheral” compartment as a fixed distance from the periosteal surface in order to include the thin cortex and any adjacent trabecular bone. While using a fixed distance might introduce some error in assessing cortical vs trabecular bone across patients with highly variable bone size, these measurements were used only to measure change with each patient serving as her own control. Thus, it is unlikely that results would have differed with a different measurement protocol. One additional limitation of using the clinical CT scans for FEA calculation is that with the available resolution, we cannot differentiate an imaging voxel with low porosity and low mineralization (i.e., a lot of newly formed tissue) from an imaging voxel with high porosity and high mineralization (i.e., very little mature highly mineralized tissue) because the individual voxel averages out the total mineralization at that scale. Thus, when cortical density declines, it could signify new porosity of mineralized cortical bone, or replacement of mineralized cortical bone with newly formed less well mineralized tissue31,33.
The strengths of our study included relatively strong study retention, with 89% of eligible participants of the group that completed the parent study entering the extension study and 65% of that group completing it. In addition, the outcomes were obtained and analyzed robustly, with good quality control and with investigators who were unaware of treatment assignments.
In conclusion, gains in total density and strength with TPTD are due to larger gains in the trabecular compared with cortical envelopes. BMD gains after 2 years of TPTD are maintained with ALN over the ensuing 2 years. BMD and strength gain with TPTD appear largely dependent on the cumulative dose administered, rather than the way it is administered. Cyclic TPTD administration does not provide any advantage to bone density or bone strength in either spine or hip regions.
Supplementary Material
Highlights.
Volumetric BMD and strength improved in both the spine and hip in both daily and cyclic groups.
In the spine, with the same dose of TPTD given over 2 years daily vs. 4 years in 3-month cycles, volumetric BMD increased 12% and 11%, and spine strength increased 21% and 16%, respectively.
In the hip, volumetric BMD increased 2% and hip strength increased 3% regardless of whether TPTD was given over 2 years daily vs. 4 years in 3-month cycles.
The majority of the gain in volumetric BMD at both spine and hip sites was in trabecular bone, with smaller effects on cortical bone.
Administration of TPTD in 3 month cycles, with 3 months off in between, does not provide any substantial benefit to volumetric BMD or strength of the spine or hip compared to standard daily subcutaneous administration.
Funding
This work was supported by the National Institutes of Health AR059204 and AR056651
Disclosure Summary:
F.C. consults for Amgen and Radius; received lecture fees from Amgen and Radius and received grant support from Eli Lilly and Amgen. J.N. has received study drug for an NIH trial from Eli Lilly and Radius. T.M.K. consults for O.N. Diagnostics, Amgen, and Bone Health Technologies; owns equity in O.N. Diagnostics A.G. has nothing to declare.
Footnotes
Publisher's Disclaimer: This is a PDF file of an unedited manuscript that has been accepted for publication. As a service to our customers we are providing this early version of the manuscript. The manuscript will undergo copyediting, typesetting, and review of the resulting proof before it is published in its final form. Please note that during the production process errors may be discovered which could affect the content, and all legal disclaimers that apply to the journal pertain.
Trial Registration: NCT00668941
References
- 1.Camacho PM, Petak SM, Binkley N, et al. American Association of Clinical Endocrinologists/American College of Endocrinology clinical practice guidelines for the diagnosis and treatment of postmenopausal osteoporosis—2020 update. Endocr Pract. 2020;26:1–46. [DOI] [PubMed] [Google Scholar]
- 2.Neer RM, Arnaud CD, Zanchetta JR, et al. Effect of parathyroid hormone (1–34) on fractures and bone mineral density in postmenopausal women with osteoporosis. N Engl J Med. 2001;344(19):1434–1441. [DOI] [PubMed] [Google Scholar]
- 3.McClung MR, San Martin J, Miller PD, et al. Opposite bone remodeling effects of teriparatide and alendronate in increasing bone mass. Arch Intern Med. 2005;165(15):1762–1768. [DOI] [PubMed] [Google Scholar]
- 4.Obermayer-Pietsch BM, Marin F, McCloskey EV, et al. Effects of two years of daily teriparatide treatment on BMD in postmenopausal women with severe osteoporosis with and without prior antiresorptive treatment. J Bone Miner Res. 2008;23(10):1591–1600. [DOI] [PubMed] [Google Scholar]
- 5.Cosman F, Nieves J, Woelfert L, et al. Parathyroid hormone added to established hormone therapy: effects on vertebral fracture and maintenance of bone mass after parathyroid hormone withdrawal. J Bone Miner Res. 2001;16(5):925–931. [DOI] [PubMed] [Google Scholar]
- 6.Cosman F, Nieves J, Zion M, Woelfert L, Luckey M, Lindsay R. Daily and cyclic parathyroid hormone in women receiving alendronate. N Engl J Med. 2005;353(6):566–575. [DOI] [PubMed] [Google Scholar]
- 7.Cosman F, Wermers RA, Recknor C, et al. Effects of teriparatide in postmenopausal women with osteoporosis on prior alendronate or raloxifene: differences between stopping and continuing the antiresorptive agent. The Journal of Clinical Endocrinology & Metabolism. 2009;94(10):3772–3780. [DOI] [PubMed] [Google Scholar]
- 8.Dempster DW, Cosman F, Kurland ES, et al. Effects of daily treatment with parathyroid hormone on bone microarchitecture and turnover in patients with osteoporosis: a paired biopsy study. J Bone Miner Res. 2001;16(10):1846–1853. [DOI] [PubMed] [Google Scholar]
- 9.Arlot M, Meunier PJ, Boivin G, et al. Differential effects of teriparatide and alendronate on bone remodeling in postmenopausal women assessed by histomorphometric parameters. J Bone Miner Res. 2005;20(7):1244–1253. [DOI] [PubMed] [Google Scholar]
- 10.Keaveny TM, Donley DW, Hoffmann PF, Mitlak BH, Glass EV, San Martin JA. Effects of teriparatide and alendronate on vertebral strength as assessed by finite element modeling of QCT scans in women with osteoporosis. J Bone Miner Res. 2007;22(1):149–157. [DOI] [PubMed] [Google Scholar]
- 11.Lindsay R, Nieves J, Formica C, et al. Randomised controlled study of effect of parathyroid hormone on vertebral-bone mass and fracture incidence among postmenopausal women on oestrogen with osteoporosis. The Lancet. 1997;350(9077):550–555. [DOI] [PubMed] [Google Scholar]
- 12.Tsai JN, Uihlein AV, Lee H, et al. Teriparatide and denosumab, alone or combined, in women with postmenopausal osteoporosis: the DATA study randomised trial. The Lancet. 2013;382(9886):50–56. [DOI] [PMC free article] [PubMed] [Google Scholar]
- 13.Leder BZ, Tsai JN, Uihlein AV, et al. Two years of Denosumab and teriparatide administration in postmenopausal women with osteoporosis (The DATA Extension Study): a randomized controlled trial. The Journal of Clinical Endocrinology & Metabolism. 2014;99(5):1694–1700. [DOI] [PMC free article] [PubMed] [Google Scholar]
- 14.Dempster DW, Zhou H, Recker RR, et al. Skeletal histomorphometry in subjects on teriparatide or zoledronic acid therapy (SHOTZ) study: a randomized controlled trial. The Journal of Clinical Endocrinology & Metabolism. 2012;97(8):2799–2808. [DOI] [PubMed] [Google Scholar]
- 15.Dempster DW, Cosman F, Zhou H, Nieves JW, Bostrom M, Lindsay R. Effects of daily or cyclic teriparatide on bone formation in the iliac crest in women on no prior therapy and in women on alendronate. J Bone Miner Res. 2016;31(8):1518–1526. [DOI] [PubMed] [Google Scholar]
- 16.Dempster DW, Zhou H, Recker RR, et al. Differential effects of teriparatide and denosumab on intact PTH and bone formation indices: AVA osteoporosis study. The Journal of Clinical Endocrinology & Metabolism. 2016;101(4):1353–1363. [DOI] [PMC free article] [PubMed] [Google Scholar]
- 17.Jiang Y, Zhao JJ, Mitlak BH, Wang O, Genant HK, Eriksen EF. Recombinant human parathyroid hormone (1–34)[teriparatide] improves both cortical and cancellous bone structure. J Bone Miner Res. 2003;18(11):1932–1941. [DOI] [PubMed] [Google Scholar]
- 18.Bogado C, Zanchetta J, Zhou H, et al. Temporal effects of teriparatide on bone microarchitecture assesed by high resolution peripheral quantitative computerized tomography and paired bone biopsies in postmenopausal women with osteoporosis. J Bone Miner Res. 2009;24. [Google Scholar]
- 19.Dempster DW, Zhou H, Recker RR, et al. A longitudinal study of skeletal histomorphometry at 6 and 24 months across four bone envelopes in postmenopausal women with osteoporosis receiving teriparatide or zoledronic acid in the SHOTZ trial. J Bone Miner Res. 2016;31(7):1429–1439. [DOI] [PubMed] [Google Scholar]
- 20.Gatti D, Viapiana O, Idolazzi L, Fracassi E, Rossini M, Adami S. The waning of teriparatide effect on bone formation markers in postmenopausal osteoporosis is associated with increasing serum levels of DKK1. The Journal of Clinical Endocrinology & Metabolism. 2011;96(5):1555–1559. [DOI] [PubMed] [Google Scholar]
- 21.Eastell R, Walsh JS. Anabolic treatment for osteoporosis: teriparatide. Clinical Cases in Mineral and Bone Metabolism. 2017;14(2):173. [DOI] [PMC free article] [PubMed] [Google Scholar]
- 22.Lindsay R, Cosman F, Zhou H, et al. A novel tetracycline labeling schedule for longitudinal evaluation of the short-term effects of anabolic therapy with a single iliac crest bone biopsy: early actions of teriparatide. J Bone Miner Res. 2006;21(3):366–373. [DOI] [PubMed] [Google Scholar]
- 23.Cosman F, Nieves JW, Zion M, et al. Daily or cyclical teriparatide treatment in women with osteoporosis on no prior therapy and women on alendronate. The Journal of Clinical Endocrinology & Metabolism. 2015;100(7):2769–2776. [DOI] [PMC free article] [PubMed] [Google Scholar]
- 24.Cosman F, Nieves JW, Roimisher C, et al. Administration of teriparatide for four years cyclically compared to two years daily in treatment Naive and alendronate treated women. Bone. 2019;120:246–253. [DOI] [PubMed] [Google Scholar]
- 25.Keaveny T, Clarke B, Cosman F, et al. Biomechanical Computed Tomography analysis (BCT) for clinical assessment of osteoporosis. Osteoporos Int. 2020:1–24. [DOI] [PMC free article] [PubMed] [Google Scholar]
- 26.Keaveny TM, Hoffmann PF, Singh M, et al. Femoral bone strength and its relation to cortical and trabecular changes after treatment with PTH, alendronate, and their combination as assessed by finite element analysis of quantitative CT scans. J Bone Miner Res. 2008;23(12):1974–1982. [DOI] [PMC free article] [PubMed] [Google Scholar]
- 27.Brown JP, Engelke K, Keaveny TM, et al. Romosozumab improves lumbar spine bone mass and bone strength parameters relative to alendronate in postmenopausal women: results from the Active-Controlled Fracture Study in Postmenopausal Women With Osteoporosis at High Risk (ARCH) trial. J Bone Miner Res. 2021. [DOI] [PMC free article] [PubMed] [Google Scholar]
- 28.Reddy JN. Introduction to the finite element method. McGraw-Hill Education; 2019. [Google Scholar]
- 29.Christiansen BA, Kopperdahl DL, Kiel DP, Keaveny TM, Bouxsein ML. Mechanical contributions of the cortical and trabecular compartments contribute to differences in age-related changes in vertebral body strength in men and women assessed by QCT-based finite element analysis. J Bone Miner Res. 2011;26(5):974–983. [DOI] [PMC free article] [PubMed] [Google Scholar]
- 30.Kleerekoper M, Greenspan SL, Lewiecki EM, et al. Assessing the effects of teriparatide treatment on bone mineral density, bone microarchitecture, and bone strength. JBJS. 2014;96(11):e90. [DOI] [PMC free article] [PubMed] [Google Scholar]
- 31.Keaveny TM, McClung MR, Wan X, Kopperdahl DL, Mitlak BH, Krohn K. Femoral strength in osteoporotic women treated with teriparatide or alendronate. Bone. 2012;50(1):165–170. [DOI] [PubMed] [Google Scholar]
- 32.Cosman F, Keaveny TM, Kopperdahl D, et al. Hip and spine strength effects of adding versus switching to teriparatide in postmenopausal women with osteoporosis treated with prior alendronate or raloxifene. J Bone Miner Res. 2013;28(6):1328–1336. [DOI] [PubMed] [Google Scholar]
- 33.Eriksen EF, Keaveny TM, Gallagher ER, Krege JH. Literature review: the effects of teriparatide therapy at the hip in patients with osteoporosis. Bone. 2014;67:246–256. [DOI] [PubMed] [Google Scholar]
- 34.Crawford RP, Cann CE, Keaveny TM. Finite element models predict in vitro vertebral body compressive strength better than quantitative computed tomography. Bone. 2003;33(4):744–750. [DOI] [PubMed] [Google Scholar]
- 35.Keaveny TM, McClung MR, Genant HK, et al. Femoral and vertebral strength improvements in postmenopausal women with osteoporosis treated with denosumab. J Bone Miner Res. 2014;29(1):158–165. [DOI] [PMC free article] [PubMed] [Google Scholar]
- 36.Team RC. R: A language and environment for statistical computing. 2013.
- 37.Cosman F, Nieves JW, Dempster DW. Treatment sequence matters: anabolic and antiresorptive therapy for osteoporosis. Journal of bone and mineral research. 2017;32(2):198–202. [DOI] [PubMed] [Google Scholar]
- 38.Cosman F Anabolic therapy and optimal treatment sequences for patients with osteoporosis at high risk for fracture. Endocrine Practice. 2020;26(7):777–786. [DOI] [PubMed] [Google Scholar]
- 39.Miller PD, Hattersley G, Riis BJ, et al. Effect of abaloparatide vs placebo on new vertebral fractures in postmenopausal women with osteoporosis: a randomized clinical trial. Jama. 2016;316(7):722–733. [DOI] [PubMed] [Google Scholar]
Associated Data
This section collects any data citations, data availability statements, or supplementary materials included in this article.