Abstract
Lipopolysaccharide (LPS), the major glycolipid component of gram-negative bacterial outer membranes, is a potent endotoxin responsible for pathophysiological symptoms characteristic of infection. The observation that the majority of LPS is found in association with plasma lipoproteins has prompted the suggestion that sequestering of LPS by lipid particles may form an integral part of a humoral detoxification mechanism. Previous studies on the biological properties of isolated lipoproteins used differential ultracentrifugation to separate the major subclasses. To preserve the integrity of the lipoproteins, we have analyzed the LPS distribution, specificity, binding capacity, and kinetics of binding to lipoproteins in human whole blood or plasma by using high-performance gel permeation chromatography and fluorescent LPS of three different chemotypes. The average distribution of O111:B4, J5, or Re595 LPS in whole blood from 10 human volunteers was 60% (±8%) high-density lipoprotein (HDL), 25% (±7%) low-density lipoprotein, and 12% (±5%) very low density lipoprotein. The saturation capacity of lipoproteins for all three LPS chemotypes was in excess of 200 μg/ml. Kinetic analysis however, revealed a strict chemotype dependence. The binding of Re595 or J5 LPS was essentially complete within 10 min, and subsequent redistribution among the lipoprotein subclasses occurred to attain similar distributions as O111:B4 LPS at 40 min. We conclude that under simulated physiological conditions, the binding of LPS to lipoproteins is highly specific, HDL has the highest binding capacity for LPS, the saturation capacity of lipoproteins for endotoxin far exceeds the LPS concentrations measured in clinical situations, and the kinetics of LPS association with lipoproteins display chemotype-dependent differences.
The lipopolysaccharide (LPS) components of gram-negative bacterial outer membranes are potent endotoxins responsible for hemodynamic, hematological, and metabolic changes observed during severe infection. Activation of responsive cells of the host immune system by low concentrations of LPS results in the production of high levels of endogenous mediators of inflammation such as tumor necrosis factor alpha (TNF-α) and interleukin-1β (IL-1β), IL-6, and IL-8, which are capable of sustaining the inflammatory state. Among the observed metabolic changes in patients are profound disturbances in plasma lipid profiles (1, 5, 14) that may also be induced in experimental animals by LPS challenge (12). Lipid metabolism appears to be extensively regulated during the host response to infection; however, increased cytokine levels do not solely appear to be responsible for the characteristic alterations in plasma lipid profiles. It has recently been suggested that disturbances in lipid metabolism may, in fact, form part of the host defense because the immune response is tightly linked to the metabolic response (15). LPS binding protein (LBP) is an acute-phase protein (29) that plays a central role in the attenuation of the cellular response to endotoxin by the presentation of LPS monomers to membrane-bound CD14 on monocytes and macrophages (24, 45). On the basis of structural homology with bactericidal permeability/increasing protein located in the granulocytes (2), LBP together with cholesterol ester transfer protein (CETP) and phospholipid transfer protein (PLTP) have recently been described as belonging to a family of lipid transport proteins (16). CETP and PLTP are known to be associated with high-density lipoprotein (HDL) particles and to be essential for lipoprotein remodeling (4). Recent evidence suggests that LBP, like other members of the lipid transport family, is bound to HDL (32, 47). A number of studies have demonstrated that LPS binds to all of the lipoprotein classes (9, 36, 44) and inhibits activity of proteins essential for lipoprotein homeostasis, such as CETP, PLTP, lecithin cholesterol acyltransferase (LCAT), and lipoprotein lipase (15). The mechanism of transfer of LPS to reconstituted HDL particles in vitro has recently been elucidated and shown to require LBP and soluble CD14. The rate of LPS transfer to native lipoproteins in whole plasma appears to occur at a similar rate but shows no soluble CD14 dependence (48).
Several observations indicate that in humans, lipid transport and LPS-detoxifying mechanisms converge on similar routes. Lipoprotein-bound LPS has been shown to be less biologically active in vitro (10, 13, 27, 44). Generally, clearing of LPS from plasma is enhanced when LPS is associated with lipoproteins and results in increased biliary excretion (35). The rate of hepatic clearing of LPS appears to be chemotype dependent. LPS from a bacterial strain with a rough phenotype contains shorter O-antigenic polysaccharide chains and is cleared more rapidly than LPS from a smooth strain (37). Although these observations suggest that lipoproteins constitute an endogenous LPS detoxification system (31), the mechanism and dynamics of the association of different LPS chemotypes with native lipoproteins, as well as the biologic consequences of these interactions, remain to be elucidated. The majority of LPS binding studies (27, 28, 36, 38, 44) have used differential ultracentrifugation for the isolation of lipoproteins and analysis of lipoprotein-bound LPS. However, a number of studies have indicated that shear forces generated during high-speed centrifugation results in extensive stripping of protein components of the lipoprotein particles (8, 11, 20, 39, 46). In this context, the relatively gentle lipoprotein separation technique of size exclusion chromatography has been described as eminently more suitable for maintenance of the compositional integrity of lipoproteins and associated proteins that constitute native particles (6, 23, 40, 43). Here we present the LPS binding characteristics of the major lipoprotein classes determined with the use of high-performance gel permeation chromatography (HPGC) and three different chemotypes of fluorescently labeled LPS. We report a comparison of the lipoprotein distribution, binding capacity, and kinetics of smooth Escherichia coli serotype O111:B4, the rough E. coli serotype J5, and the deep rough Salmonella enterica serovar Typhimurium Re595 LPS under simulated physiological conditions.
MATERIALS AND METHODS
Reagents and materials.
LPS of the highest purity were obtained from commercial sources. E. coli O111:B4 LPS was from Sigma Chemical Co. (St. Louis, Mo.); E. coli J5 (Rc) and Salmonella serovar Typhimurium Re595 LPS were from List Biological Laboratories (Campbell, Calif.) or Calbiochem-Novabiochem International (La Jolla, Calif.). Pyrogen-free distilled water, used throughout the experiments, was from Ecotainer (Braun Medical AG, Melsungen, Germany). The fluorescent labels 7-nitrobenz-2-oxa-1,3 diazole fluoride (NBD-F) and 4,4-difluoro-4-bora-3n,4n-diaza-S-indacene (BODIPY-R6G) were obtained from Molecular Probes Inc. (Eugene, Oreg.). phenol 4-amino-antiperine peroxidase (PAP) reagent for postcolumn cholesterol detection was from Bio-Merieux (Marcy l'Etoile, France). Pyrogen-free heparin was purchased from LEO Pharmaceuticals B.V. (Weesp, The Netherlands), and Tris was purchased from Boehringer Mannheim (Mannheim, Germany). NaCl, Tween 20, diisopropyl ether (DIPE), and n-butanol of the highest purity were purchased from Merck (Darmstadt, Germany). TNF-α was determined with a Pelikine human TNF-α enzyme-linked immunosorbent assay kit (CLB, The Netherlands). Centricon-100 filters were from Amicon (Beverly, Mass.). Apolipoprotein B (apo B) and apo A-I levels of lipoprotein fractions were measured by an automated turbidimetric assay using APA and APB kits on an Array protein system nephelometer (Beckman, Mijdrecht, The Netherlands). NaIO4 and Purpald reagent for LPS quantification was obtained from A1drich Sigma (Steinheim, Germany).
BODIPY labeling of O111 LPS.
Purified E. coli O111:B4 LPS was labeled using the BODIPY-R6G oligonucleotide amine labeling kit (Molecular Probes) by modifications of the manufacturer's protocol for oligosaccharide labeling. LPS was prepared for labeling by sonication of a suspension at a concentration of 2 mg/ml in pyrogen-free water with a Branson Sonifier at maximum output for a total of 10 min on ice. Using 12 kDa for the average size of the O111:B4 monomer (22, 25), LPS at a final concentration of 1 mg/ml in 0.1 M sodium bicarbonate buffer (pH 8.3) was derivatized in polypropylene tubes by addition of a fivefold molar excess of BODIPY-R6G dissolved in dimethyl sulfoxide, and the reaction was allowed to proceed for 2 h in the dark at room temperature. Nonconjugated BODIPY label remaining after the derivatization was allowed to react with a 20-fold molar excess of glycine for a further 30 min. The BODIPY-LPS conjugate was separated from BODIPY-glycine by gel filtration on a 5-ml Sephadex G15 column (Pharmacia Biotech, Inc., Uppsala, Sweden) using pyrogen-free water. The BODIPY-LPS micelles elute in the void volume, while BODIPY-glycine is retained by the matrix. The efficiency of label incorporation was determined by measurement of the optical density at 528 nm, using the quoted extinction coefficient of 70,000 cm−1 M−1, and the stoichiometry of labeling was found to be approximately 1 BODIPY:1 LPS. Labeling of O111:B4 with NBD resulted in considerably lower labeling efficiencies. The concentration of the peak fraction of labeled LPS determined by the 2-keto-3-deoxyoctulosonic acid (KDO) assay (21) was 0.76 mg/ml.
NBD labeling of J5 and Re595 LPS.
Purified J5 or Re595 LPS was labeled using NBD-F (Molecular Probes) according to modifications of the manufacturer's instructions for oligosaccharides. LPS was prepared for labeling by sonication of J5 LPS for a total of 5 min and Re595 LPS for 2.5 min as described for O111:B4. Using 3,800 kDa (J5) and 2,300 kDa (Re595) for the average sizes of the monomers, LPS suspensions at 1 mg/ml in 0.1 M sodium bicarbonate buffer (pH 9.0) were labeled by addition of a fivefold molar excess of NBD-F dissolved in dimethyl fluoride, and the reaction was allowed to proceed in the dark for 1 h at room temperature. Nonconjugated NBD label remaining after the derivatization was allowed to react with a 20-fold molar excess of glycine for a further 30 min. Derivatized NBD-LPS was separated by gel filtration on Sephadex G15 as described above. The efficiency of label incorporation was determined by measurement of the optical density at 465 nm, using the quoted extinction coefficient of 8000 cm−1 M−1, and the stochiometry of labeling found to be approximately 1 NBD: 4 J5-LPS and 1 NBD:6.5 Re595-LPS. Labeled LPS was monomerized by heating for 5 min at 100°C in the presence of 2% (wt/vol) sodium dodecyl sulfate (SDS) and characterized by reverse-phase high-performance liquid chromatography on a C18 column using 20% (vol/vol) ethanol containing 0.5% (wt/vol) SDS as eluant. No free label was detected in any of the LPS preparations. BODIPY O111:B4 eluted in four major peaks, which is consistent with the known heterogeneity of O111:B4 (34). By contrast, single peaks were evident for the homogeneous J5 and Re595 chemotypes. The concentrations of the peak fractions of J5 and Re595 LPS were 0.73 and 0.83 μg/ml, respectively determined by KDO assay. LPS suspensions could be stored for up to 6 months at 4°C without appreciable loss of fluorescence yield. Derivatization of J5 or Re595 LPS with BODIPY in our hands yielded significantly lower labeling efficiencies compared with the NBD fluorophore. Additionally, BODIPY or fluorescein isothiocyanate derivatives of Re595 LPS have previously been described as having variable biological activities (41, 42, 49). We therefore chose to minimize the potential influence of the label on the biophysical and/or biological properties of the smaller LPS preparations (J5 and Re595) by using a fluorescent label of lower molecular weight (NBD) for these chemotypes.
Biophysical-chemical properties of fluorescent LPS.
To determine whether the fluorescent label influences the biophysical-chemical behavior of derivatized LPS, competition analysis was done using samples containing mixtures of labeled and unlabeled LPS of the same chemotype, in defined ratios from 6.25% (wt/wt) labeled LPS:93.75% (wt/wt) unlabeled LPS to 100% (wt/wt) labeled LPS to achieve final concentrations of 200, 300, and 200 μg/ml of plasma, which approach saturation for O111:B4, J5, and Re595 LPS, respectively. The volume of the LPS mixtures added to aliquots of plasma was kept constant, and incubations were for 20 min at 37°C.
Blood sampling and handling.
Whole blood was drawn from healthy volunteers, after informed consent, by venipuncture and generally collected in pyrogen-free polypropylene tubes containing heparin (2 U/ml) or in some instances tubes containing sodium citrate (Becton Dickinson, Lincoln Park, N.J.). Blood or plasma obtained by centrifugation (1,000 × g for 20 min at 12°C) was always used in the experiments within 1 h after collection.
Plasma delipidation.
Total delipidation of plasma was done essentially as described by Cham and Knowles (7). Aliquots of 2.5 ml of fresh citrated plasma were added to 5 ml of n-butanol–DIPE (40:60 [vol/vol]) in 14-ml polypropylene tubes (Becton Dickinson). The mixture was gently agitated on a roller for 30 min at room temperature and centrifuged at 1,000 × g for 10 min at room temperature for phase separation. The aqueous phase was collected by needle puncture at the bottom of the tubes and reextracted with 2 volumes of DIPE for 2 min. Residual butanol was removed under vacuum at 37°C for 5 min, followed by a continuous stream of nitrogen. Delipidated plasma was generally used immediately for further experimentation.
Separation of the major lipoprotein classes by HPGC.
The system contained a PU-980 ternary pump with an LG-980-02 linear degasser, a FP-920 fluorescence detector, and UV-975 UV/VIS detector (Jasco, Tokyo, Japan). An extra P-50 pump (Pharmacia Biotech) was used for online cholesterol detection. The separation matrix was Superose 6 HR 10/30 (Pharmacia Biotech). The injection volume was 60 μl of plasma diluted 1:1 with Tris-buffered saline (pH 7.4) (46) containing 0.005% (vol/vol) Tween 20 (pH 7.4) (TBST), and the chromatograms were developed with TBST at a continuous flow rate of 0.31 ml/min. Chromatograms were analyzed with Borwin chromatographic software, version 1.23 (JMBS Developments, Le Fontanil, France).
Distribution, lipoprotein binding capacity, and kinetics of different LPS chemotypes.
For the LPS distribution experiments, 50-μl aliquots of labeled LPS in saline were added to 0.5-ml portions of fresh whole blood in polypropylene tubes to attain a concentration of 20 to 30 μg/ml and incubated for 1 h at 37°C. For the saturation experiments, LPS was used at concentrations in excess of 200 μg/ml. Chromatographic profiles of the association of fluorescent LPS with lipoproteins in plasma samples were analyzed in plasma by HPGC with fluorescence and postcolumn cholesterol detection. BODIPY-LPS was monitored by excitation wavelength at 530 nm and emission wavelength at 550 nm; NBD-LPS was monitored at 465 and 535 nm, respectively. Cholesterol concentration in the column effluent was continuously monitored at 505 nm by enzymatic reaction with PAP reagent (Bio-Merieux) in a reactor coil (1 m by 0.5 mm [inside diameter]) at a flow rate of 0.1 ml/min. For the time course experiments, LPS was added to heparinized plasma (2 U/ml) to a final concentration of 24 to 40 μg/ml and incubated for 10 to 120 min at 37°C prior to HPGC analysis. In some instances, peak fractions collected from sequential chromatographic runs were pooled and concentrated for protein analysis using a Centricon-100 filter.
SDS-PAGE analysis of purified lipoprotein classes.
Protein profiles of the individual lipoprotein classes isolated by HPGC were analyzed by SDS-polyacrylamide gel electrophoresis (PAGE) on precast linear, 4 to 15% (wt/vol) acrylamide gradient gels containing a 4% (wt/vol) acrylamide stacking layer (Bio-Rad, Hercules, Calif.) (17). Lipoprotein fractions were prepared for electrophoresis by heating for 5 min at 100°C in sample buffer consisting of 50 mM Tris (pH 6.8) containing 10% (vol/vol) glycerol, 2% (wt/vol) SDS, 0.01% (wt/vol) bromphenol blue, and 20 mM dithiothreitol. Separation was for 1.5 h at 15 mA in electrophoresis buffer consisting of 25 mM Tris (pH 8.3), 192 mM glycine, and 0.1% (wt/vol) SDS. Protein bands were developed by silver staining as described by Morrissey (26).
RESULTS
Comparison of biological activities of fluorescent LPS and unlabeled LPS.
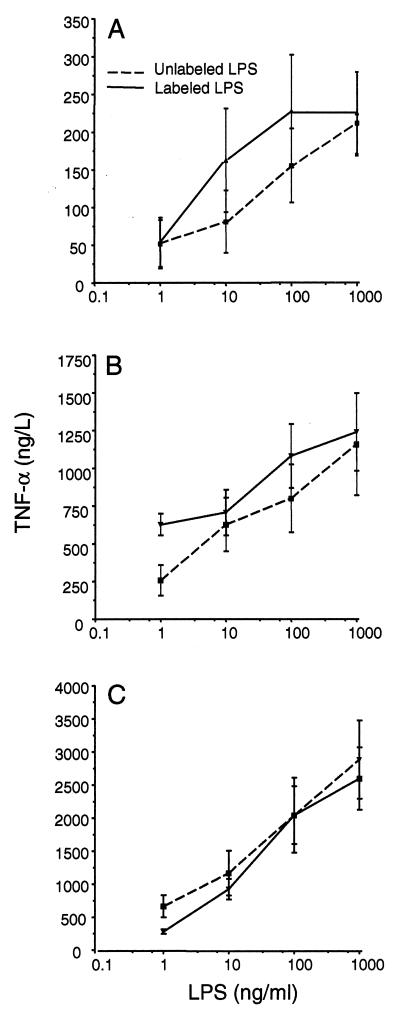
The biological activities of all fluorescent LPS derivatives were compared with the activity of unlabeled LPS on the basis of TNF-α-inducing capacity in whole blood stimulation assays. TNF-α production by labeled LPS (BODIPY-O111:B4, NBD-J5, and NBD-Re595) in the concentration range of 1 to 1,000 ng/ml was essentially similar to that by unlabeled LPS, within the limits of experimental error (Fig. 1).
FIG. 1.
Comparison of the TNF-α-inducing capacity of labeled or unlabeled O111:B4 (A), J5 (B), or Re595 (C) in whole blood from three healthy volunteers. LPS at concentrations of 1, 10, 100, and 1,000 ng/ml of whole blood was incubated for 4 h at 37°C, and TNF-α levels were measured in duplicate. The values represent the average ± 1 standard deviations.
Competitive analysis of labeled and unlabeled LPS.
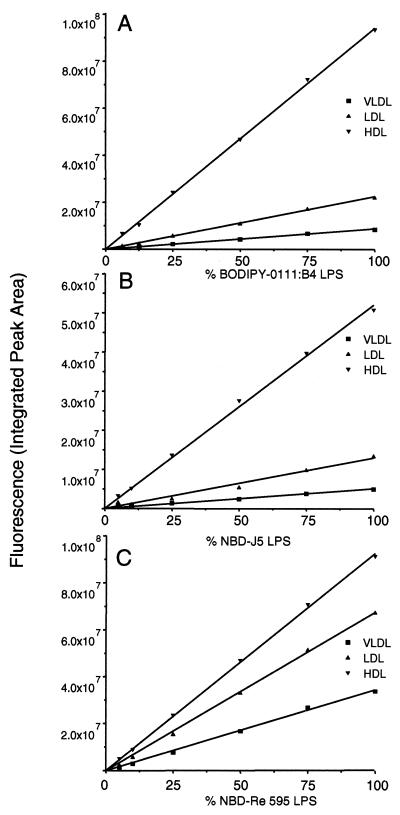
Analysis of lipoprotein-associated fluorescence by HPGC revealed a linear response for all labeled LPS chemotypes (Fig. 2), indicating that no competitive inhibition by unlabeled LPS had occurred and that the lipoprotein binding of derivatized LPS is identical to that of unlabeled LPS.
FIG. 2.
Competition between labeled and unlabeled LPS for binding to plasma lipoproteins. Graphs for BODIPY-O111:B4 (A), NBD-J5 (B), and NBD-Re595 (C) show the distribution of labeled LPS lipoprotein in association with VLDL, LDL, or HDL in plasma in the presence of unlabeled LPS for plasma concentrations approaching saturation (200, 300, and 200 μg/ml) for the three chemotypes. The LPS mixtures were added to the plasma samples and incubated for 20 min at 37°C. Correction was done for the natural fluorescent background of the plasma components at the excitation and emission wavelengths used. Linear regression was used to generate the curves.
Characterization and purity of lipoproteins separated by size exclusion chromatography.
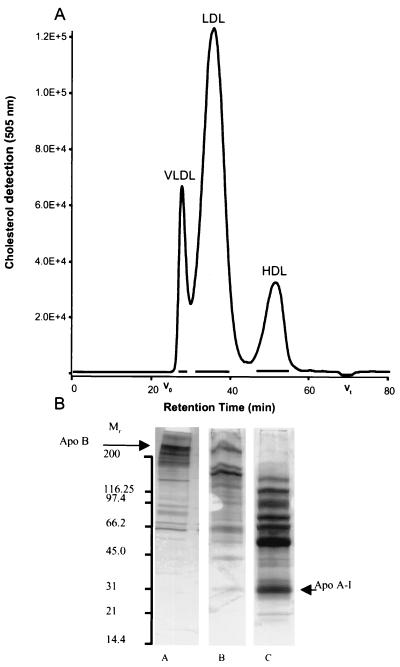
Total plasma lipoproteins were completely separated into the main lipoprotein classes by HPGC on Superose 6 as demonstrated by a typical cholesterol profile in Fig. 3A. To verify the resolution of the separation, peak fractions were analyzed for apolipoprotein content. Apo A-I was found exclusively in the HDL fraction, and apo B was only detectable in the low-density and very low density lipoprotein (LDL and VLDL) peak fractions, indicating that no cross-contamination of the lipoprotein classes had occurred (data not shown). SDS-PAGE profiles of the isolated HDL, LDL, and VLDL fractions revealed multiple protein bands in addition to the normal apolipoprotein complement of each lipoprotein class. The molecular weights of a number of major bands in the HDL fraction, for example, correspond well with those of known lipid-LPS transport proteins such as LCAT, CETP, LBP, and PLTP (Fig. 3B). Pooled HDL fractions were in fact shown to contain almost all of the plasma LCAT activity (data not shown). Separation of the lipoprotein classes by size exclusion chromatography under the conditions described in this work yielded pure fractions containing particles with a unique and reproducible protein profile comprising apolipoproteins and lipid-LPS transport proteins as well as a number of additional lipoprotein-associated proteins.
FIG. 3.
(A) Chromatographic profile of the major plasma lipoprotein classes separated by HPGC with online cholesterol detection. The average molecular masses calculated from retention characteristics were 5 MDa for VLDL, 1 MDa for LDL, and 300 kDa for HDL. Horizontal bars indicate the lipoprotein fractions pooled for further analysis. (B) SDS-PAGE analysis of these lipoprotein fractions with subsequent silver staining, showing the protein composition of the lipoproteins. M, molecular weight in thousands; lane A, VLDL; lane B, LDL; lane C, HDL. Each well was loaded with 20 μl containing a total of approximately 2 μg of protein.
Specificity of LPS binding.
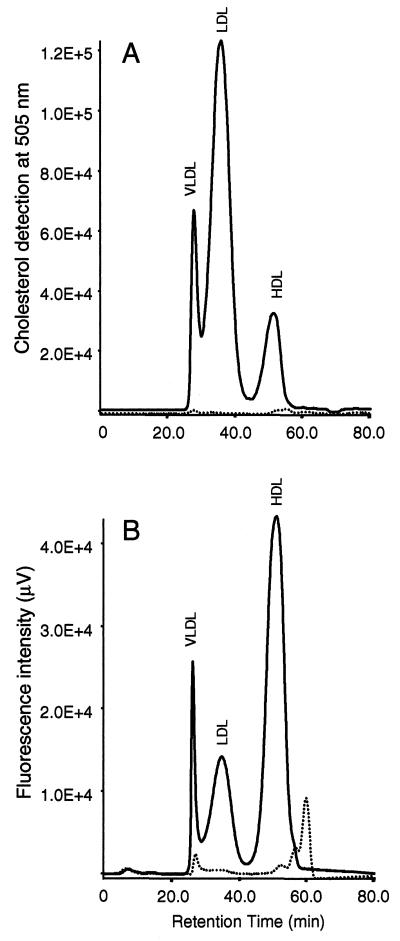
To determine the binding specificity of LPS for lipoproteins, we incubated equal amounts of J5 LPS with delipidated or normal plasma and determined the LPS fluorescence profiles by HPGC (Fig. 4). The cholesterol profile of delipidated plasma demonstrates extremely low levels of residual cholesterol and a total absence of a typical lipoprotein profile, indicating that delipidation was complete and that the plasma is essentially devoid of lipid particles (Fig. 4A). The LPS fluorescence chromatogram of lipoprotein-deficient plasma displays an entirely different profile (Fig. 4B) and yielded approximately 5% of the total LPS fluorescence signal for normal plasma (Fig. 4B).
FIG. 4.
Chromatographic LPS cholesterol (A) and fluorescence (B) profiles of normal (continuous lines) and delipidated (dotted lines) plasma. Both normal plasma and delipidated plasma were incubated with NBD-J5 LPS for 60 min at 37°C, and the fluorescence and cholesterol lipoprotein profiles were determined as described in Materials and Methods.
Distribution, saturation, and LPS binding capacity.
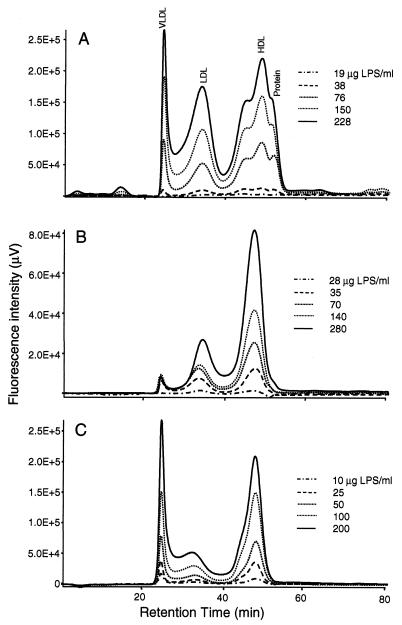
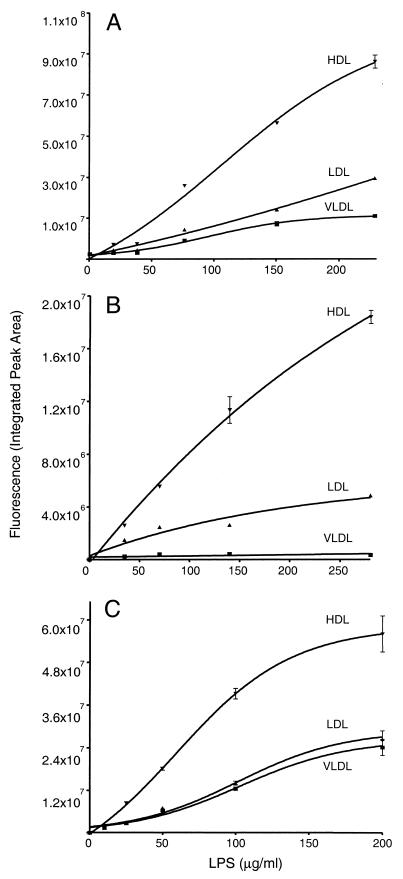
To determine the relative distribution of LPS among the lipoprotein classes under simulated physiological conditions, we incubated fluorescent LPS with aliquots of whole blood for a preselected (1-h) time interval and subsequently determined bound LPS by HPGC. We found that 93 to 99% of the total LPS signal coeluted with the lipoprotein peaks. The average distributions for all three LPS chemotypes in the HDL and LDL fractions were found to be essentially similar. HDL showed the highest, LDL showed intermediate, and VLDL showed the lowest LPS binding in the LPS concentration range used (Table 1). Heat treatment and clarification of plasma (60°C, 30 min; 12,000 × g, 20 min) prior to LPS addition resulted in a normal cholesterol profile but severely reduced lipoprotein-associated fluorescence (data not shown), indicating that proteins participate in the loading of the particles with LPS. A chemotype-dependent variation in VLDL-bound LPS was apparent. Re595 LPS appears to have a two- or and fourfold higher preference for VLDL than J5 or O111:B4 LPS, respectively. A relatively small percentage of the total LPS signal was detected in the plasma protein fraction. LPS saturation analysis indicated a dose-dependent binding of O111:B4, J5, or Re595 LPS to the lipoprotein classes (Fig. 5). The total binding capacity of plasma lipoproteins for all LPS chemotypes examined was found to be in excess of 200 μg/ml (Fig. 6). HDL shows the highest binding capacity for LPS and appears to be saturated at an Re595 LPS concentration of 200 μg/ml of whole blood. Saturation was not achieved with O111:B4 or J5 LPS concentrations up to 200 μg/ml. Chemotype-dependent differences in saturation capacity are evident for VLDL and LDL.
TABLE 1.
Distribution of LPS among human lipoprotein classesa
| LPS | Concn (μg/ml) | Mean (±SD) % of total
|
|||
|---|---|---|---|---|---|
| VLDL | LDL | HDL | Protein | ||
| BODIPY-O111:B4 | 30 | 11 (±6) | 25 (±7) | 57 (±7) | 7 (±5) |
| NBD-J5 (Rc) | 35 | 5 (±5) | 29 (±10) | 65 (±13) | 1 |
| NBD-Re595 | 30 | 19 (±4) | 22 (±2) | 58 (±5) | 1 |
Relative distribution of LPS among lipoprotein classes in whole blood from healthy volunteers (n = 10) after incubation for 1 h at 37°C and analysis by HPGC.
FIG. 5.
Chromatographic profiles showing dose response of LPS-lipoprotein association with three LPS chemotypes, O111:B4, (A), J5 (B), and Re595 (C). All main lipoprotein classes indicated in panel A apply also to panels B and C. LPS at the concentrations indicated was incubated for 1 h at 37°C. All chromatograms were corrected for the inherent fluorescence of plasma components. The data are representative of a number of independent experiments.
FIG. 6.
LPS binding capacities of plasma lipoproteins. Diagrams of lipoprotein-associated BODIPY-O111:B4 (A), NBD-J5 (B), and NBD-Re595 (C) LPS show a dose-dependent distribution of LPS on VLDL, LDL, and HDL in plasma obtained from healthy volunteers. The values represent the mean ± 1 standard deviation of duplicate results after correction of the natural fluorescent background of the plasma components at the excitation and emission wavelengths used. Nonlinear regression data fit was used to generate the curves.
Kinetics of LPS binding.
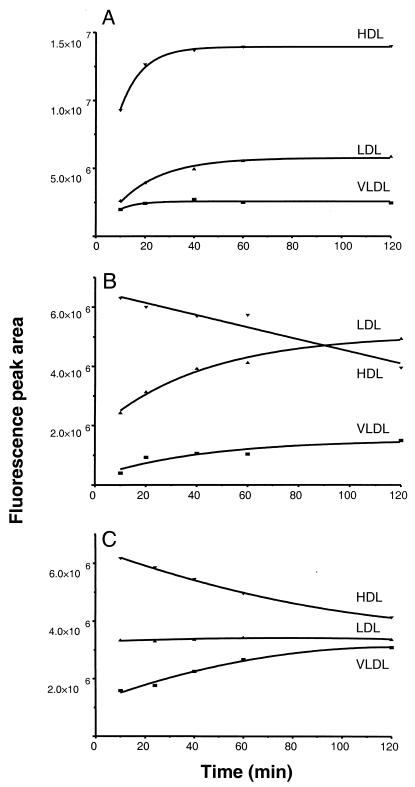
To determine the effect of incubation time on the LPS distribution among the lipoprotein classes, we added four different LPS concentrations (Table 2) to plasma samples drawn at various time points and determined the amount of lipoprotein-bound LPS by HPGC (Fig. 7). The data show that the loading of lipoprotein particles with O111:B4 LPS progressively increased to 40 min, with no further change in distribution on continued incubation (Fig. 7A). The loading of J5 or Re595 LPS, however, was essentially complete at 10 min, and a redistribution of LPS from HDL to other lipoprotein classes was evident at all LPS concentrations (Table 2). A progressive decrease in HDL-bound J5 LPS coincided with an increase in LDL and VLDL signals (Fig. 7B). The 20% reduction in HDL-bound J5 LPS at 1 h appeared to be compensated for by a 70% increase in LDL-bound LPS (relative to the amount of bound LPS at 10 min). Similarly, an 18% reduction in HDL-associated Re595 LPS coincided with a 79% increase in VLDL-bound LPS relative to the amount of bound LPS at 10 min (Fig. 7C). Continued incubation with J5 LPS showed that the relative distribution of this chemotype changes with time, reaching equivalent amounts bound to LPS on HDL and LDL at 90 min and LDL-bound LPS exceeding HDL-bound LPS at 2 h. O111:B4, however, showed no decrease in HDL fluorescence signal within the 2-h incubation period (Table 2).
TABLE 2.
Overall changes of lipoprotein-associated LPS distribution over timea
| LPS chemotype | Concn tested (μg/ml) | Mean (±SD) change
|
||
|---|---|---|---|---|
| VLDL | LDL | HDL | ||
| O111:B4 | 6, 12, 24, 36 | 38 (±16) | 24 (±10) | 6 (±7) |
| J5 | 9, 15, 21, 35 | 7 (±12) | 61 (±14) | −23 (±3) |
| Re595 | 10, 15, 30, 40 | 76 (±8) | 14 (±14) | −32 (±4) |
Percent change of LPS association over time (10 to 120 min) to the main lipoprotein classes relative to the amount of bound LPS at 10 min.
FIG. 7.
LPS binding kinetics of plasma lipoproteins after incubation of 24 μg of BODIPY-O111:B4 (A), 35 μg of NBD-J5 (B), and 40 μg of NBD-Re595 (C) per ml. After incubation of individual plasma samples for 10, 20, 40, 60, and 120 min at 37°C, 60 μl of plasma diluted 1:1 with TBST elution buffer was analyzed by HPGC as described in the text. All points represent peak areas corrected for inherent background fluorescence of plasma components at the excitation and emission wavelengths used. Nonlinear regression data fit was used to generate the curves. The graphs are representative of one of the four LPS concentrations used in these experiments which all produced similar results.
DISCUSSION
In this study we present the overall distribution, saturation analysis, and association kinetics of three biologically active labeled LPS chemotypes among the major lipoprotein classes, using HPGC for the quantitation of LPS binding. We examined the binding characteristics of three different LPS chemotypes representing the range from smooth to deep rough phenotypes which may all be present in the outer membranes of wild-type bacterial pathogens, depending on the growth stage and nutrient source. The LPS of E. coli serotype O111:B4 is a smooth LPS that contains long O-antigenic polysaccharide side chains, whereas the E. coli serotype J5 and Salmonella serovar Typhimurium Re LPS, which contain relatively short polysaccharide side chains, yield rough and deep-rough colony morphologies, respectively (22). Evaluation of the resolution of the lipoprotein separation by nephelometric and SDS-PAGE analyses revealed the presence of apo A-I exclusively in the HDL fraction and apo B only in the LDL and VLDL fractions. No apolipoprotein cross-reactivity in any of the lipoprotein classes was detected with the use of monoclonal antibodies, indicating that separation of all three lipoprotein classes by size exclusion chromatography was complete. Lipoproteins isolated by differential ultracentrifugation generally show a much lower protein content of the HDL and LDL fractions and no detectable proteins within the VLDL fraction. Hence, these findings are in accordance with the observation that ultracentrifugation removes the majority of lipoprotein-associated proteins (18, 20). Kunitake and Kane have demonstrated that HDL loses substantial amounts of associated apo A-I and probably several other proteins which may be of importance in lipid-LPS transfer (20). SDS-PAGE analysis of the lipoprotein-associated proteins reveals multiple protein bands in the <200-kDa region (Fig. 3B), confirming that in addition to the major apolipoproteins, as well as LBP (47), PLTP (33), CETP (3), and LCAT, known to be associated with HDL, a number of specific proteins appear to be uniquely associated with all of the lipoprotein classes.
In this study, we demonstrate that averages of 60, 25, and 12% of the fluorescent LPS signal were recovered in HDL, LDL, and VLDL fractions respectively, after incubation for 1 h at 37°C. Compared to previous results on the LPS distribution among the lipoprotein classes (36, 44), we demonstrate markedly lower levels of LPS associated with the plasma protein fraction (Table 1). Total delipidation of plasma resulted in a complete absence of lipoprotein classes, as reflected by a 95% reduction in fluorescent LPS signal in the lipoprotein region of the chromatogram (Fig. 4), indicating that the binding of LPS by plasma lipoproteins is highly specific. Additionally, the dramatic decrease in LPS associated with the lipoprotein classes present in heat-treated, clarified plasma (30 min at 60°C; 12,000 × g, for 20 min) provides additional evidence that ancillary proteins are involved in the loading of lipoproteins with LPS in an active process (unpublished observations).
A relatively higher amount of O111:B4 LPS was recovered in the plasma protein fraction compared to J5 or Re595 LPS. This is probably a consequence of a faster loading mechanism of LPS for the more hydrophobic LPS chemotypes containing shorter O-antigen polysaccharide chains such as J5 and Re595 (Table 1). Furthermore, we observed that LPS association is dose dependent, even at LPS concentrations far exceeding those observed in clinical situations. Nonetheless, these high LPS concentrations have been used in animal models of endotoxemia, and it is feasible that comparable or even higher LPS concentrations at a local focus of infection may be prevalent in the clinical setting.
Our results related to the kinetics of LPS association indicate a strict chemotype dependence (Fig. 7). The polysaccharide chain length of LPS is presumably responsible for the velocity of the association: the shorter the polysaccharide chain, the more hydrophobic the LPS molecule, in the order O111:B4 > J5 > Re595, and the higher the apparent affinity of LPS for the lipoprotein phospholipid layer. During the 2-h incubation, the overall amount of lipoprotein-bound LPS was nearly unchanged with time, indicating that the initial loading of LPS was complete within 10 to 20 min and was relatively chemotype independent. However, the amount of HDL-bound J5 LPS was seen to decrease with time and was accompanied by a corresponding increase in LDL-bound LPS. Similarly, a portion of the Re595 LPS fluorescence signal shifted from HDL to VLDL, indicating a redistribution of these LPS chemotypes. Because it has been reported that the transport proteins LBP, CETP, and PLTP are able to bind and transfer LPS to lipoproteins (16, 47), it is tempting to speculate that these transfer proteins may also be responsible for the redistribution of more hydrophobic LPS species with short polysaccharide chains. It has been documented that rough-type LPS such as J5 and Re595 is cleared from the circulation more rapidly than smooth-type LPS such as O111:B4 (37). Therefore, the observed redistribution toward LDL or VLDL of J5 or Re595 LPS, respectively, may play a role in the enhanced clearing of lipoproteins containing these LPS chemotypes from the circulation.
It remains unknown why the inherently high endotoxin binding capacity of lipoproteins, especially HDL, is not sufficient to diminish the effects of LPS during severe infection. This may be explained by two proposed pathways in the kinetics of LPS. First, binding of LPS to peripheral blood mononuclear cells may be more rapid than the second mechanism responsible for the loading of the lipoproteins with LPS. However, as we have demonstrated in this work, approximately 96% of added LPS is found to be associated with the lipoproteins within 10 to 20 min, a time period probably too short to induce an inflammatory response as proposed by Netea et al. (30). Further, the recently described (19) capacity of lipoproteins to promote the release of LPS from the macrophage surface should favor a protective role for lipoproteins. Therefore, it is feasible that after the initial loading phase whereby LPS monomers are actively transferred from large micellar LPS structures predominantly to HDL, the subsequent chemotype-dependent redistribution of LPS between the lipoprotein classes may inadvertently result in the presentation of LPS to monocytes and macrophages, thus triggering the inflammatory response.
In summary, binding of smooth and rough LPS to lipoprotein particles is specific and of relatively high affinity. The binding capacity of all LPS chemotypes exceeds concentrations observed in most clinical situations, and added LPS is mainly associated with HDL particles. In addition, we describe an LPS chemotype-dependent redistribution of HDL-associated LPS to LDL (J5 LPS) or VLDL (ReLPS). This mechanism may have important implications in the magnitude and duration of the inflammatory reaction initiated by the presence LPS in the host.
ACKNOWLEDGMENTS
We thank K. Bakhtiari and H. P. van Barreveld for excellent technical assistance and are indebted to B. J. Appelmelk (Department of Medical Microbiology, Vrije Universiteit, Amsterdam, The Netherlands) for critical reading of the manuscript.
REFERENCES
- 1.Alvarez C, Ramos A. Lipids, lipoproteins and apoproteins in serum during infection. Clin Chem. 1986;32:142–145. [PubMed] [Google Scholar]
- 2.Beamer L J, Caroll S F, Eisenberg D. Crystal structure of human BPI and two bound phospholipids at 2 Å resolution. Science. 1997;276:1861–1864. doi: 10.1126/science.276.5320.1861. [DOI] [PubMed] [Google Scholar]
- 3.Bolanos-Garcia V M, Soriano-Garcia M, Mas-Oliva J. CETP and exchangeable apoproteins: common features in lipid. Mol Cell Biochem. 1997;175:1–10. doi: 10.1023/a:1006887729274. [DOI] [PubMed] [Google Scholar]
- 4.Bruce C, Chouinard R A, Tall A. Plasma lipid transfer proteins, high-density lipoproteins, and reverse cholesterol transport. Annu Rev Nutr. 1998;18:297–330. doi: 10.1146/annurev.nutr.18.1.297. [DOI] [PubMed] [Google Scholar]
- 5.Cabana V G, Siegel J N, Sabesin S M. Effects of the acute phase response on the concentration and density distribution of plasma lipids and apolipoproteins. J Lipid Res. 1989;30:39–49. [PubMed] [Google Scholar]
- 6.Carroll R M, Rudel L L. Lipoprotein separation and low density lipoprotein molecular weight determination using high performance gel-filtration chromatography. J Lipid Res. 1983;24:200–207. [PubMed] [Google Scholar]
- 7.Cham B E, Knowles B R. A solvent system for delipidation of plasma or serum without protein precipitation. J Lipid Res. 1976;17:176–181. [PubMed] [Google Scholar]
- 8.Cheung M C, Wolf A C. Differential effect of ultracentrifugation on apolipoprotein A-I-containing lipoprotein subpopulations. J Lipid Res. 1988;29:15–25. [PubMed] [Google Scholar]
- 9.Eggesbo J B, Lyberg T, Aspelin T, Hjermann I, Kierulf P. Different binding of 125I-LPS to plasma proteins from persons with high or low HDL. Scand J Clin Lab Investig. 1996;56:533–543. doi: 10.3109/00365519609088809. [DOI] [PubMed] [Google Scholar]
- 10.Emancipator K, Sako G, Elin R J. In vitro inactivation of bacterial endotoxin by human lipoproteins and apolipoproteins. Infect Immun. 1992;60:596–601. doi: 10.1128/iai.60.2.596-601.1992. [DOI] [PMC free article] [PubMed] [Google Scholar]
- 11.Fainaru M, Havel R J, Imaizumi K. Apoprotein content of plasma lipoproteins of the rat separated by gel chromatography or ultracentrifugation. Biochem Med. 1977;17:347–355. doi: 10.1016/0006-2944(77)90040-0. [DOI] [PubMed] [Google Scholar]
- 12.Feingold K R, Funk J L, Moser A H, Shigenaga J K, Rapp J H, Grunfeld C. Role for circulating lipoproteins in protection from endotoxin toxicity. Infect Immun. 1995;63:2041–2046. doi: 10.1128/iai.63.5.2041-2046.1995. [DOI] [PMC free article] [PubMed] [Google Scholar]
- 13.Flegel W A, Wölpl A, Northhoff H, Männel D N. Inhibition of endotoxin-induced activation of human monocytes by human lipoproteins. Infect Immun. 1989;57:2237–2245. doi: 10.1128/iai.57.7.2237-2245.1989. [DOI] [PMC free article] [PubMed] [Google Scholar]
- 14.Gordon B R, Parker T S, Levine D M, Saal S D, Wang J C L, Sloan B J, Barie P S, Rubin A L. Low lipid concentrations in critical illness: implications for preventing and treating endotoxemia. Crit Care Med. 1996;24:584–589. doi: 10.1097/00003246-199604000-00006. [DOI] [PubMed] [Google Scholar]
- 15.Grunfeld C, Feingold K R. Regulation of lipid metabolism by cytokines during host defence. Nutrition. 1996;12:24–26. doi: 10.1016/0899-9007(96)90013-1. [DOI] [PubMed] [Google Scholar]
- 16.Hailman E, Albers J J, Wolfbauer G, Tu A, Wright S D. Neutralisation and transfer of lipopolysaccharide by phospholipid transfer protein. J Biol Chem. 1996;271:12172–12178. doi: 10.1074/jbc.271.21.12172. [DOI] [PubMed] [Google Scholar]
- 17.Irwin D, O'Looney P A, Quinet E, Vahouny G V. Application of SDS gradient polyacrylamide slab gel electrophoresis to analysis of apolipoprotein mass and radioactivity of rat lipoproteins. Atherosclerosis. 1984;53:163–172. doi: 10.1016/0021-9150(84)90192-8. [DOI] [PubMed] [Google Scholar]
- 18.Kane J, Kunitake S T. Isolation of plasma lipoproteins by ultracentrifugation and immunosorption. In: Betteridge D J, Illingworth D R, Shepherd J, editors. Lipoproteins in health and disease. London, England: Arnold; 1999. pp. 463–471. [Google Scholar]
- 19.Kitchens R L, Wolfbauer G, Albers J J, Munford R S. Plasma lipoproteins promote the release of bacterial lipopolysaccharide from the monocyte cell surface. J Biol Chem. 2000;274:34116–34122. doi: 10.1074/jbc.274.48.34116. [DOI] [PubMed] [Google Scholar]
- 20.Kunitake S T, Kane J. Factors affecting the integrity of high density lipoproteins in the ultracentrifuge. J Lipid Res. 1982;23:936–940. [PubMed] [Google Scholar]
- 21.Lee C H, Tsai C M. Quantification of bacterial lipopolysaccharides by the Purpald assay: measuring formaldehyde generated from 2-keto-3-deoxyoctonate and heptose at the inner core by periodate oxidation. Anal Biochem. 1999;267:161–168. doi: 10.1006/abio.1998.2961. [DOI] [PubMed] [Google Scholar]
- 22.Martin G, Ghabrial H, Morgan D J, Smallwood R A, Sewell R B. High-performance liquid chromatography method to resolve and determine lipopolysaccharide sub-groups of Escherichia coli endotoxin in isolated perfused rat liver perfusate. J Chromatogr. 1992;574:205–211. doi: 10.1016/0378-4347(92)80031-k. [DOI] [PubMed] [Google Scholar]
- 23.Marz W, Siekmeier R, Scharnagl H, Seiffert U B, Gross W. Fast lipoprotein chromatography: new method of analysis for plasma lipoproteins. Clin Chem. 1993;39:2276–2281. [PubMed] [Google Scholar]
- 24.Mathison J, Tobias P, Wolfson E, Ulevitch R. Regulatory mechanisms of host responsiveness to endotoxin (lipopolysaccharide) Pathobiology. 1991;59:185–188. doi: 10.1159/000163641. [DOI] [PubMed] [Google Scholar]
- 25.Morrison D C, Leive L. Fractions of lipopolysaccharide from Escherichia coli O111:B4 prepared by two extraction procedures. J Biol Chem. 1975;250:2911–2919. [PubMed] [Google Scholar]
- 26.Morrissey J H. Silver stain for proteins in polyacrylamide gels: a modified procedure with enhanced uniform sensitivity. Anal Biochem. 1981;117:307–310. doi: 10.1016/0003-2697(81)90783-1. [DOI] [PubMed] [Google Scholar]
- 27.Munford R S, Dietschy J M. Effects of specific antibodies, hormones and lipoproteins on bacterial lipopolysaccharides injected into rat. J Infect Dis. 1985;152:177–184. doi: 10.1093/infdis/152.1.177. [DOI] [PubMed] [Google Scholar]
- 28.Munford R S, Hall C L, Dietschy J M. Binding of Salmonella typhimurium lipopolysaccharides to rat high-density lipoproteins. Infect Immun. 1981;49:835–843. doi: 10.1128/iai.34.3.835-843.1981. [DOI] [PMC free article] [PubMed] [Google Scholar]
- 29.Myc A, Buck J, Gonin J, Reynolds B, Hammerling U, Emanuel D. The level of lipopolysaccharide-binding protein is significantly increased in plasma patients with the systemic inflammation response syndrome. Clin Diagn Lab Immunol. 1997;4:113–116. doi: 10.1128/cdli.4.2.113-116.1997. [DOI] [PMC free article] [PubMed] [Google Scholar]
- 30.Netea M G, Demacker P N M, Kullberg B J, Jacobs L E H, Verver-Jansen T J G, Boerman O C, Slalenhoef A F, van der Meer J W M. Bacterial lipopolysaccharide binds and stimulates cytokine-producing cells before neutralization by endogenous lipoproteins can occur. Cytokine. 1998;10:766–772. doi: 10.1006/cyto.1998.0364. [DOI] [PubMed] [Google Scholar]
- 31.Northhoff H, Flegel W A, Yurttas R, Weinstock C. The role of lipoproteins in the inactivation of endotoxin by serum. Infus Ther. 1992;19:202–203. doi: 10.1159/000222624. [DOI] [PubMed] [Google Scholar]
- 32.Park C T, Wright S D. Plasma lipopolysaccharide-binding protein is found associated with a particle containing apolipoprotein A-I, phospholipid, and factor H-related protein. J Biol Chem. 1996;271:18054–18060. doi: 10.1074/jbc.271.30.18054. [DOI] [PubMed] [Google Scholar]
- 33.Pussinen P J, Jauhiainen M, Metso J, Pyle L E, Marcel Y L, Fidge N H, Ehnholm C. Binding of phospholipid transfer protein (PLTP) to apolipoproteins A-I and A-II: location of PLTP binding domain in the terminal region of apo A-I. J Lipid Res. 1998;39:152–161. [PubMed] [Google Scholar]
- 34.Qureshi N, Takayama K, Mascagni P, Honovich J, Wong R, Cotter R J. Complete structural determination of lipopolysaccharide obtained from deep rough mutant of Escherichia coli. J Biol Chem. 1988;263:11971–11976. [PubMed] [Google Scholar]
- 35.Read T E, Harris H W, Grunfeld C, Feingold K R, Calhoun M C, Kane J P, Rapp J H. Chylomicrons enhance endotoxin excretion in bile. Infect Immun. 1993;61:3496–3502. doi: 10.1128/iai.61.8.3496-3502.1993. [DOI] [PMC free article] [PubMed] [Google Scholar]
- 36.Roth R I, Levin F C, Levin J. Distribution of bacterial endotoxin in human and rabbit blood and effects of stroma-free hemoglobin. Infect Immun. 1993;61:3209–3215. doi: 10.1128/iai.61.8.3209-3215.1993. [DOI] [PMC free article] [PubMed] [Google Scholar]
- 37.Salomao R, Rigato O, Pignatari A C, Freudenberg M A, Galanos C. Bloodstream infections: epidemiology, pathophysiology and therapeutic perspectives. Infection. 1999;27:1–11. doi: 10.1007/BF02565163. [DOI] [PubMed] [Google Scholar]
- 38.Schichtling E, Aspelin T, Lyberg T. Interactions of endotoxin with human blood cells and serum proteins. Scand J Clin Lab Investig. 1996;56:167–176. doi: 10.3109/00365519609088604. [DOI] [PubMed] [Google Scholar]
- 39.Tadey T, Purdy W C. Chromatographic techniques for the isolation and purification of lipoproteins. J Chromatogr B. 1995;671:237–253. doi: 10.1016/0378-4347(95)00051-j. [DOI] [PubMed] [Google Scholar]
- 40.Tallis G A, Shephard M D S, Whiting M J. Lipoprotein profiling by high performance gel chromatography. Clin Chim Acta. 1994;228:171–179. doi: 10.1016/0009-8981(94)90287-9. [DOI] [PubMed] [Google Scholar]
- 41.Tobias P S, Soldau K, Gegner J A, Mintz D, Ulevitch R J. Lipopolysaccharide binding protein-mediated complexation of lipopolysaccharide with soluble CD14. J Biol Chem. 1995;270:10482–10488. doi: 10.1074/jbc.270.18.10482. [DOI] [PubMed] [Google Scholar]
- 42.Troelstra A, Antal-Szalmas P, Graaf-Miltenburg L A, Weersink A J, Verhoef J, van Kessel K P, van Strijp J A. Saturable CD14-dependent binding of fluorescein-labeled lipopolysaccharide to human monocytes. Infect Immun. 1997;65:2272–2277. doi: 10.1128/iai.65.6.2272-2277.1997. [DOI] [PMC free article] [PubMed] [Google Scholar]
- 43.van Gent T, van Tol A. Automated gel permeation chromatography of plasma lipoproteins by preparative fast protein liquid chromatography. J Chromatogr A. 1990;572:433–441. doi: 10.1016/s0378-4347(00)83420-9. [DOI] [PubMed] [Google Scholar]
- 44.Van Lenten B J, Fogelman A M, Haberland M E, Edwards P A. The role of lipoproteins and receptor-mediated endocytosis in the transport of bacterial lipopolysaccharide. Proc Natl Acad Sci USA. 1986;83:2704–2708. doi: 10.1073/pnas.83.8.2704. [DOI] [PMC free article] [PubMed] [Google Scholar]
- 45.Wang P Y, Kitchens R L, Munford R S. Bacterial lipopolysaccharide binds to CD14 in low-density domains of the monocyte-macrophage plasma membrane. J Inflamm. 1996;47:126–137. [PubMed] [Google Scholar]
- 46.Westerlund J, Yao Z. Elution of lipoprotein fractions containing apolipoproteins E and A-I in size on superose 6 columns is sensitive to mobile phase pH and ionic strength. J ChromatogrA. 1995;718:59–66. doi: 10.1016/0021-9673(95)00640-0. [DOI] [PubMed] [Google Scholar]
- 47.Wurfel M M, Kunitake S T, Lichenstein H, Kane J P, Wright S D. Lipopolysaccharide (LPS)-binding protein is carried on lipoproteins and acts as a cofactor in the neutralization of LPS. J Exp Med. 1994;180:1025–1035. doi: 10.1084/jem.180.3.1025. [DOI] [PMC free article] [PubMed] [Google Scholar]
- 48.Wurfel M M, Wright S D. Lipopolysaccharide-binding protein and soluble CD14 transfer lipopolysaccharide to phospholipid bilayers. J Immunol. 1997;158:3925–3934. [PubMed] [Google Scholar]
- 49.Yu B, Wright S D. Catalytic properties of lipopolysaccharide (LPS) binding protein. J Biol Chem. 1996;271:4100–4105. doi: 10.1074/jbc.271.8.4100. [DOI] [PubMed] [Google Scholar]


