Abstract
Gas sensors play an important role in many areas of human life, including the monitoring of production processes, occupational safety, food quality assessment, and air pollution monitoring. Therefore, the need for gas sensors to monitor hazardous gases, such as ammonia, at low operating temperatures has become increasingly important in many fields. Sensitivity, selectivity, low cost, and ease of production are crucial characteristics for creating a capillary network of sensors for the protection of the environment and human health. However, developing gas sensors that are not only efficient but also small and inexpensive and therefore integrable into everyday life is a difficult challenge. In this paper, we report on a resistive sensor for ammonia detection based on thin V2O5 nanosheets operating at room temperature. The small thickness and porosity of the V2O5 nanosheets give the sensors good performance for sensing ammonia at room temperature (RT), with a relative change of resistance of 9.4% to 5 ppm ammonia (NH3) and an estimated detection limit of 0.4 ppm. The sensor is selective with respect to the seven interferents tested; it is repeatable and stable over the long term (four months). Although V2O5 is generally an n-type semiconductor, in this case the nanosheets show a p-type semiconductor behavior, and thus a possible sensing mechanism is proposed. The device’s performance, along with its size, low cost, and low power consumption, makes it a good candidate for monitoring freshness and spoilage along the food supply chain.
Keywords: gas sensor, vanadium pentoxide, ammonia, nanosheet, room temperature, food quality
1. Introduction
Ammonia sensors are widely requested in different application areas, such as automotive, environmental monitoring, industrial processes, medicine, agricultural processes (fertilizer, feed), and food [1,2]. Ammonia is not a greenhouse gas, but it can indirectly contribute to greenhouse gas emissions, which can cause serious harm to human health. According to the American Conference of Governmental Industrial Hygienists (ACGIH) and the US Occupational Safety and Health Administration (OSHA), the threshold limit value (TLV) for NH3 exposure is 25 ppm [3,4].
Ammonia in human breath is produced by the metabolism of protein, and is related to the ammonia produced in the body in various organs and processes [5,6]. For these reasons, it is indicated as a biomarker for specific diseases and conditions, such as renal failure [7], halitosis [8], hepatic encephalopathy [9], and Helicobacter pylori [10]. In exhaled breath, the concentration of NH3 reaches 15 and 1.5 ppm, respectively, for end-stage renal disease patients and kidney patients, whereas its concentration is approximately 0.8 ppm in healthy individuals [11].
Ammonia is also among the main indicators of bacterial degradation of protein-rich food (fish, poultry, and meat) [12]. For instance, the concentration of NH3 produced during pork decomposition ranges from 10 to 50 ppm [13]. Monitoring of NH3 emissions from food would allow early degradation of food to be detected and establish safe consumption. As a result, the development of sensors for NH3 detection with high sensitivity, selectivity, speed of response, and low detection limit at room temperature (RT) is crucial [13,14,15,16,17].
Resistive sensors are among the most common gas sensors; they are simple, cheap, fast, sensitive, and stable, and are therefore widely investigated for food analysis. Nanostructured semiconducting metal oxides (SMOs) have gained great attention due to their above-mentioned properties. Nanostructures of metal oxides such as SnO2, ZnO, TiO2, In2O3, Fe2O3, WO3, CuO, NiO, MoO3, and V2O5 with different morphologies have been prepared by different methods and used as gas sensors [18,19]. Among them, vanadium oxide is attracting considerable attention because of its multivalent phases and layered structure. Vanadium pentoxide (V2O5) is an n-type semiconductor with a bandgap between 2.04 and 2.8 eV. It shows high stability, variable oxidation states, high specific capacitance, high energy density, resistivity, and excellent electrical properties [15,16]. Different morphologies of V2O5 such as nanoparticles, nanowires, thin films, nanospheres, nanorods, nanofibers, and others, have been tested as sensors for many gases such as hydrogen (H2), ethanol (C2H5OH), NOx, and ammonia.
Nanomaterials with a porous structure can be easily prepared using inexpensive hydrothermal methods with environmentally friendly reagents. In particular, V2O5 nanostructures are characterized by high porosity and high surface-to-volume ratio that promote the diffusion of gas molecules inside the sensor material, improving the utilization rate of the sensor and its gas sensitivity [20].
Mounasamy et al. [21] proposed a non-invasive wearable health monitoring device based on V2O5 nanosheets for ammonia detection. Surface-modified poly-l-lactic acid (PLLA) substrates were used to improve the sensing performance of the V2O5 film. The sensing mechanism of the PLLA/V2O5 film was aided by the large specific surface formed by the molding process. The adsorption properties of V2O5 were exploited to develop ammonia nanogravimetric sensors consisting of V2O5 nanoplatelets deposited on a QCM piezoelectric transducer [22]. The physical adsorption mechanism and the unique porous structure of the V2O5 material were used to explain the detection performance towards ammonia. The rough and hydrophilic surface of the V2O5 thin film promotes the synthesis of additional adsorbed species, increasing the production of ammonium hydroxide (NH4OH) and hence the sensitivity of the sensor.
In this paper, we further investigated the sensitivity of V2O5 to ammonia by testing a V2O5 nanosheets-based resistive gas sensor obtained using the hydrothermal technique followed by calcination. In addition to being sensitive, the sensor showed good selectivity with respect to seven possible interferers. Despite the known n character of V2O5, the response to ammonia (an electron donor) is compatible with p-type behavior. It is known that a p-type material can result under particular growth conditions, such as hydrated amorphous V2O5 [23]. Here, the inversion of the conductivity character is compatible with the formation of a surface inversion layer induced by molecular surface adsorption.
2. Materials and Methods
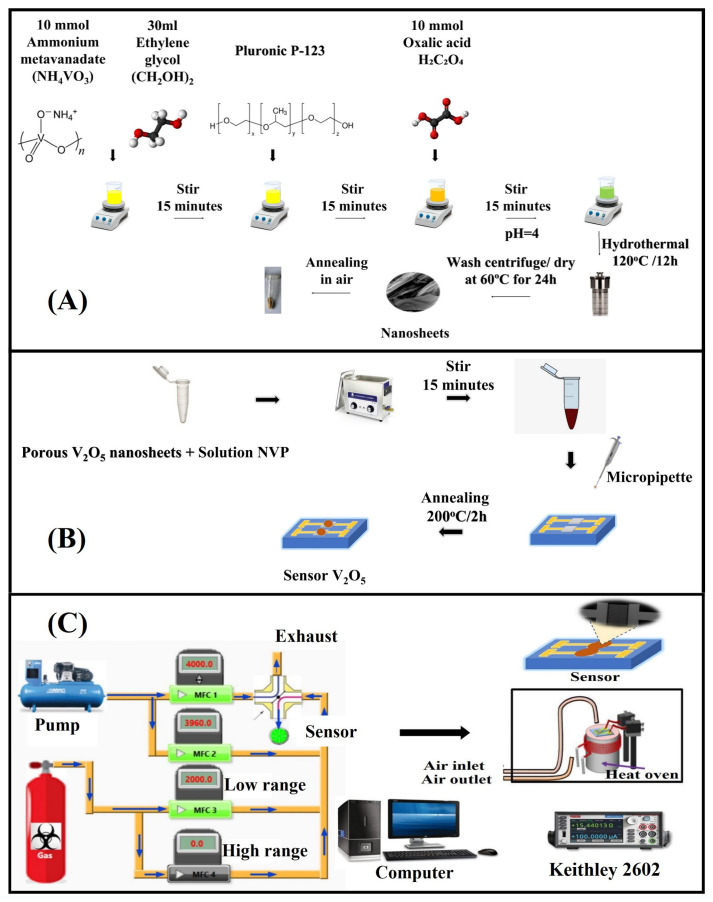
The following chemicals were used: ammonium metavanadate (NH4VO3, 99.99%), Poly (ethylene glycol)-block-poly (propylene glycol)-block-poly (ethylene glycol) (Pluronic P-123, HO(CH2CH2O)20(CH2CH(CH3)O)70(CH2CH2O)20H, 99%), ethylene glycol (C2H6O2, 99%), and ethanol (CH3CH2OH, 99.8%) were bought from Sigma-Aldrich (St. Louis, MO, USA). All reagents were analytic grade and used as received without further purification. Deionized water was used as a solvent to prepare the solution. The V2O5 nanosheets were synthesized using the hydrothermal method. In a typical procedure, ammonium metavanadate (NH4VO3) (10 mmol) was dissolved in 30 mL of deionized water and 30 mL of ethylene glycol and stirred for 15 min. Then, Pluronic P-123 was added and stirred for 30 min. After that, oxalic acid (C2H2O4) (10 mmol) was added and stirred for another 15 minutes until pH 4 was obtained. The obtained solution was transferred to a 100 mL Teflon-lined stainless-steel autoclave for the hydrothermal process and was maintained at 200 °C for 24 h. After being gradually cooled to room temperature, the precipitate at the bottom was centrifuged and washed several times with deionized water. It was then washed twice with ethanol and collected by centrifugation at 4000 rpm. The obtained product was dried in an oven at 60 °C for 24 h and finally calcined at 500 °C for 2 h.
The structure, morphology, and composition of the synthesized material were characterized using field-emission scanning electron microscopy (FESEM, Hitachi S-4800, Tokyo, Japan), high-resolution transmission electron microscopy (HRTEM, JEM 2100, JEOL Ltd., Tokyo, Japan), X-ray diffraction (XRD, X-Pert Pro, Malvern Panalytical Ltd., Malvern, UK) with a Cu-Kα source in a 2θ range from 10° to 80°, energy-dispersive X-ray spectroscopy (EDS, 7395H, HORIBA, Minami-ku Kyoto, Japan), Raman spectroscopy (Renishaw, InVia confocal micro-Raman Spectroscope, Renishaw, UK), and thermogravimetric analysis (TGA 550, TA Instruments, New Castle, DE, USA). Specific surface area was estimated through BET analysis (Micromeritics Gemini VII 2390, Micromeritics Instrument Corporation, Narcross, GA, USA). The oxidation levels of the material were investigated using X-ray photoelectron spectroscopy (XPS, ULVAC-PHI, 370 Enzo, Kanagawa, Japan).
The gas sensors were prepared, as shown in Figure 1, using drop-casting and following a method found in the literature [24]. The V2O5 nanosheets were dispersed in N-vinylpyrrolidone to form a colloidal solution and then deposited on a silicon dioxide substrate. The substrate was endowed with a pair of interdigitated comb-shaped Pt electrodes was fabricated by UV photolithography.
Figure 1.
Process diagram of (A) hydrothermal synthesis of V2O5 nanosheets, (B) drop coating of the nanomaterial on electrodes to make the gas sensor, and (C) homemade gas measurement system.
The sensing properties were tested using a homemade gas test station. Prior to the measurements, the sensors were preheated at 500 °C for 2 h to stabilize the resistance and enhance the contact between the Pt electrodes and the vanadium pentoxide. The sensor resistance was recorded with a source meter (Keithley 2602, Keithley, Solon, OH, USA) as the atmosphere in the measuring chamber changed from air to analyte gas, and vice versa. The limit of detection was calculated using the sensitivity at the origin and the signal-to-noise ratio of the current signal [25].
3. Results and Discussion
3.1. Morphological, Compositional, and Structural Characterization
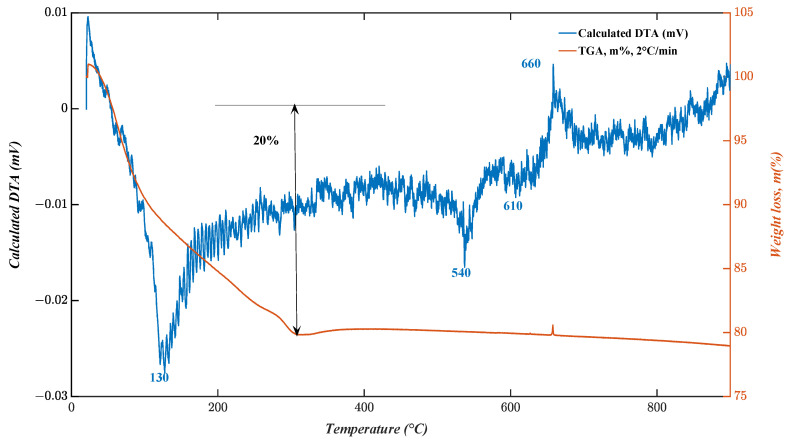
Thermogravimetric (TGA) and differential thermal measurements (DTA) were performed in a N2 atmosphere at temperatures ranging from 20 to 950 °C to determine both the precursor breakdown temperature and the most suitable calcination temperature required to generate the V2O5 phase. The results are shown in Figure 2, where two distinct phases are identified.
Figure 2.
TGA–DTG curves of V2O5 nanosheets.
The modest weight loss is probably due to moisture evaporation. At 320 °C, the TGA curve shows a large weight loss of 20%, which corresponds to the small sharp endothermic peak at 130 °C in the DTA curve. The endothermic peak and the related weight loss are consistent with the combustion of the organic polymer component (Pluronic P123). The formation of V–O bonds has been reported to occur at temperatures above 330 °C [26]. The V–O bonds are supposed to act as crystallization centers for different crystalline vanadium oxides. At temperatures above 550 °C, no further weight loss was found since all organic material had already been destroyed at this temperature. The following increase in mass at 660 °C is most likely caused by the emergence of orthorhombic V2O5 [27].
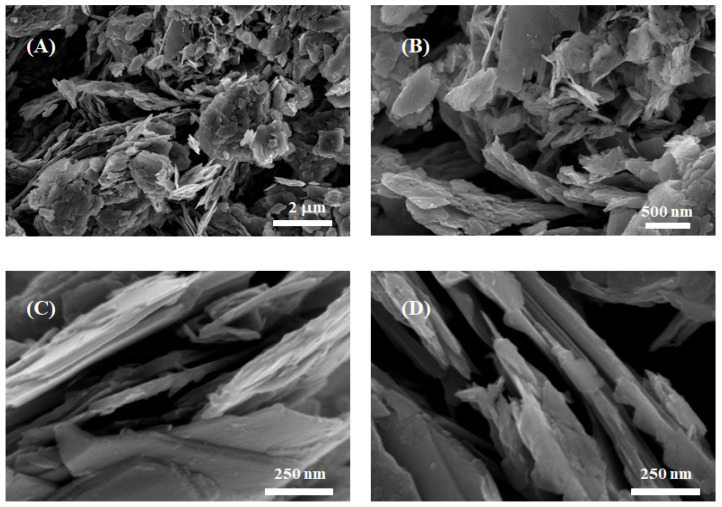
The morphology of the growth material was investigated using scanning electron microscopy (SEM). The SEM images in Figure 3 show low, medium, and high magnification and illustrate the uniform presence of wide and thin nanosheets tightly stacked on top of each other. The high magnification images (Figure 3C,D) show an average thickness of approximately 50–60 nm. The large surface area and the small thickness are attributed to the difference in growth rates along different crystal orientations. The formation of stacked V2O5 thin nanosheets during the hydrothermal process can be described by the following reactions:
| (1) |
| (2) |
Figure 3.
SEM images of the grown nanostructures: (A) low magnification; (B) medium magnification; (C,D) high magnification.
In detail, NH4VO3, a precursor of vanadium, tends to dissociate into NH4+ and VO3− ions in deionized water [28]. During synthesis, the production of oxalic acid increases the concentration of H+ ions that, by reacting with the VO3− species, lead to the formation of V2O5. The addition of the surfactant P123 and the control of the pH value at 5 allow optimization of the formation of thin nanosheets. The resulting nanostructures are characterized by numerous active surface sites that can accelerate the adsorption of target gases.
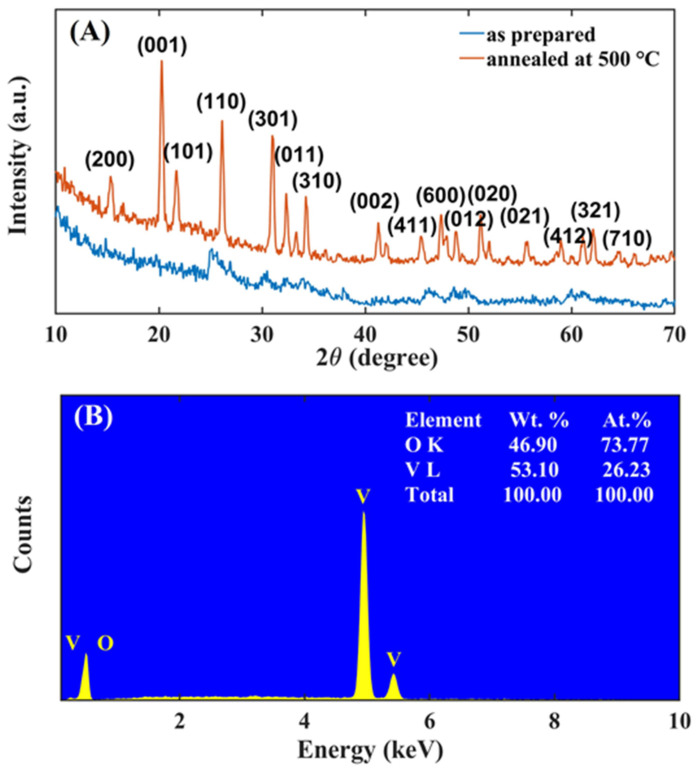
The structure, purity, and crystalline phase of the nanostructures were investigated using X-ray diffraction analysis. The XRD diffraction patterns of the V2O5 nanomaterial, unannealed and annealed at 500 °C, are shown in Figure 4A.
Figure 4.
(A) XRD spectra of as-prepared V2O5 nanosheets (blue) and of those annealed at 500 °C (red). (B) EDS spectrum.
Before thermal treatment, the material shows no evident peaks, demonstrating that hydrothermal growth itself produces amorphous nanosheets. Conversely, the spectrum of the nanosheets after calcination at 500 °C (red line in Figure 4A) shows peaks at 2θ = 15.41°, 20.11°, 21.78°, 26.02°, 30.98°, 34.28°, which correspond, respectively, to the lattice planes (200), (001), (101), (110), (301), and (310) of the orthorhombic structure of V2O5. The diffraction peaks are in good agreement with reference data (JCPDS 41-1426) [29,30,31]. The lack of additional peaks indicates that neither contaminants nor amorphous phases affect the purity of the material [32]. XRD analysis confirms that calcination at 500 °C is crucial to transform the hydrothermally grown material into crystalline V2O5 nanosheets. The crystallite size of V2O5 was determined using the Debye–Scherrer equation:
| (3) |
where D is the crystallite size, k is the Scherrer constant (approximately 0.89), λ is the wavelength of the incident radiation, β is the FWHM of the peak, and ϑ is the Bragg diffraction angle (ϑ = 10°–90°). From the above equation, the average crystallite size in the annealed V2O5 sample is 32.7 nm.
The elemental composition of the material was characterized by EDS, the results of which are shown in Figure 4B. The EDS spectrum confirms that the nanosheets are composed only of V and O at weight percentages of 46.90 wt.% and 53.10 wt.%, respectively. EDS does not show additional peaks due to either impurities or contaminants. The atomic ratio between V and O is approximately 2:5, a value compatible with the values in the literature [28].
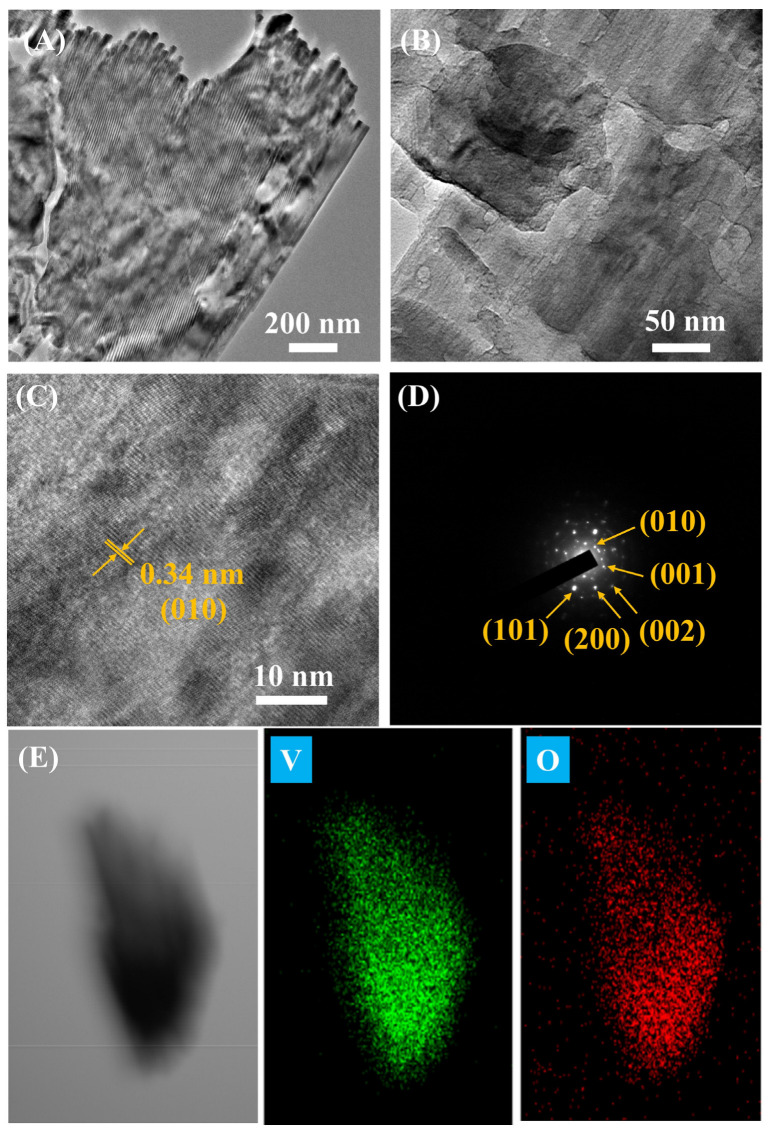
HRTEM images of V2O5 nanosheets at different magnifications are shown in Figure 5A–C. Crystal lattice fringes are visible in Figure 5C, indicating that the V2O5 nanosheets have good crystallinity. The lattice spacing at 0.34 nm can be assigned to the (010) plane of the orthorhombic structure of V2O5 [33,34].
Figure 5.
(A–C) TEM images, (D) SEAD, and (E) EDS elemental mapping of annealed V2O5 material. V and O labeled images show the distribution of vanadium (V) and oxygen (O) atoms.
Figure 5D shows the selected area electron diffraction (SAED) pattern. The image shows a sharp and regular pattern of diffraction spots, indicating that the calcined nanosheets are well crystallized. The diffraction points in the crystal correspond to the V2O5 planes (010), (001), (002), (200), and (101) [35]. The elemental composition maps in Figure 5E show the homogeneous distribution of the elements (V and O).
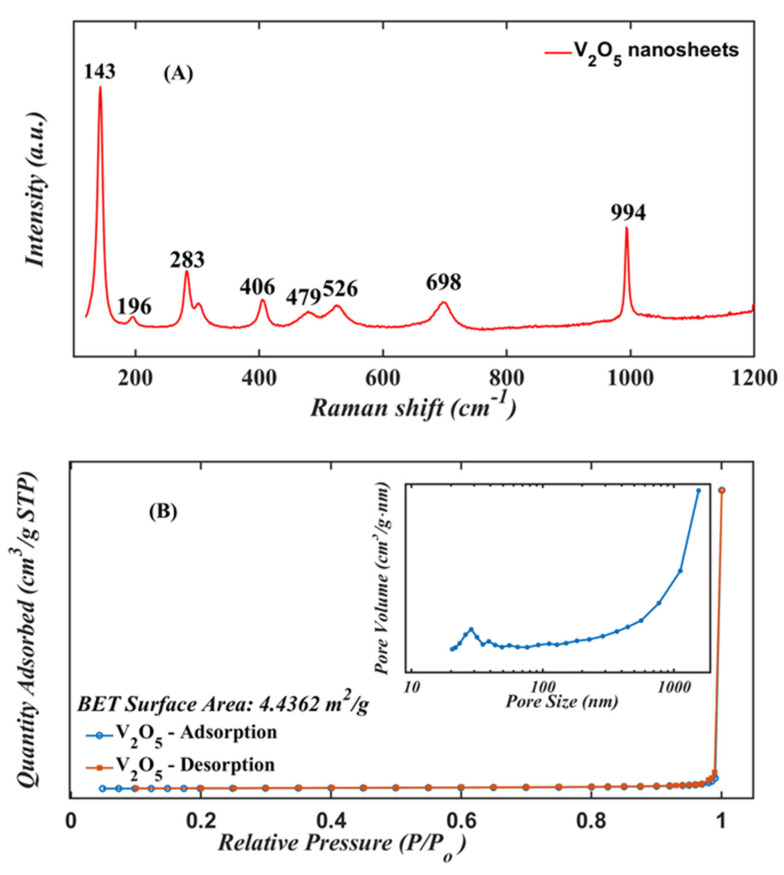
The Raman spectrum of the annealed nanomaterial is shown in Figure 6A. The annealed sample shows peaks at 143, 196, 283, 406, 479, 526, 698, and 994 cm−1 [36]. The most intense peak at 143 cm−1 corresponds to the vibration of the V–O–V bonds. This peak is evidence of the layered structure of the V2O5 phase. The peaks at 283 and 406 cm−1 correspond to the bending vibrations of the V=O bonds [37]. The peak at 479 cm−1 is attributed to the bending vibrations of the V–O–V bonds, whereas the peaks at 526 and 698 cm−1 are relative to the phonons band V3–O. Finally, the peak at 994 cm−1 indicates the terminal oxygen V=O stretching mode, and confirms the crystal quality of the V2O5 nanosheets [38].
Figure 6.
(A) Raman scattering and (B) BET curve of the V2O5 nanosheets annealed at 500 °C.
Figure 6B shows the nitrogen adsorption/desorption isotherm. The porous structure of the V2O5 nanosheets is characterized by a specific surface area SBET = 4.4362 m2/g. The distribution of pores in the range 20–1000 nm exhibits a peak at about 1000 nm compatible with the presence of multiple nanopores. Because pore size has a direct influence on the diffusion rate of the gas molecules into the sensor layer, the diffusion rate can be estimated from the Knudsen diffusion model:
| (4) |
where Dk is the diffusion rate, r is the pore size, T is the operating temperature, M is the molecular weight of the diffusing gas, and R is the universal gas constant. The diffusion rate is proportional to the pore size, so an abundance of pores and/or an increase in their size is expected to enhance gas sensitivity [33].
The V2O5 nanosheets were analyzed with XPS to understand their composition and chemical states, and the results are shown in Figure 7. The binding energy spectrum of V2O5 is depicted in Figure 7A, where the main peaks related to vanadium and oxygen are visible, as well as the sub-peak from carbon at 283 eV. The V2p and O1s core levels of the XPS spectrum are shown in Figure 7B and 7C, respectively. In Figure 7B, there are two broad peaks centered at 516.5 eV and 523.3 eV, which are associated to V2p3/2 and V2p1/2 doublets and confirm the V5+ oxidation state [34]. The binding energy difference of approximately 7.8 eV between V2p3/2 and V2p1/2 confirms the formation of the orthorhombic structure. The core level of O1s spectrum (Figure 7C) splits into two peaks located at 529.73 and 531.13 eV, which are attributed to the oxygen species O2− adsorbed on the surface of the sensing material. In particular, the peak at 529.73 eV corresponds to the binding of the O and V elements.
Figure 7.
(A) Wide binding energy, (B) core level V2p, and (C) core level O1s of XPS spectrums of V2O5 nanosheets.
3.2. Electrical and Gas Sensing Characteristics
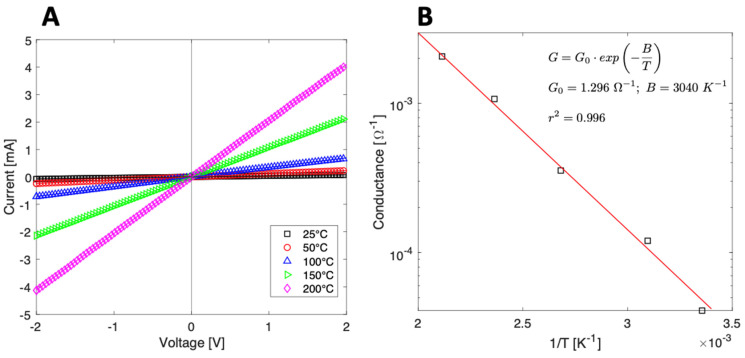
The electrical properties of the sensor were analyzed by measuring the I–V curves in the range of −2 V to 2 V. Figure 8A shows the I–V curves in nitrogen at different temperatures, from room temperature to 300 °C. The linearity of the I–V curves indicates good ohmic contact between V2O5 and the Pt electrodes. Figure 8B shows the Arrhenius plot of the conductance, where the material exhibits the typical negative temperature coefficient of semiconductors. The relationship between conductance and temperature is defined by an activation energy (Ea), i.e., the minimum energy required to promote the charge carriers [39]:
| (5) |
where G is the conductance, kB is the Boltzmann constant, and T is the temperature. The fit in Figure 8B estimates an activation energy of 0.26 ± 0.01 eV, which is compatible with band gap values in the literature [22].
Figure 8.
(A) I–V curves from V2O5 nanosheets measured at different working temperatures; (B) Arrhenius plot: conductance vs. the inverse of temperature.
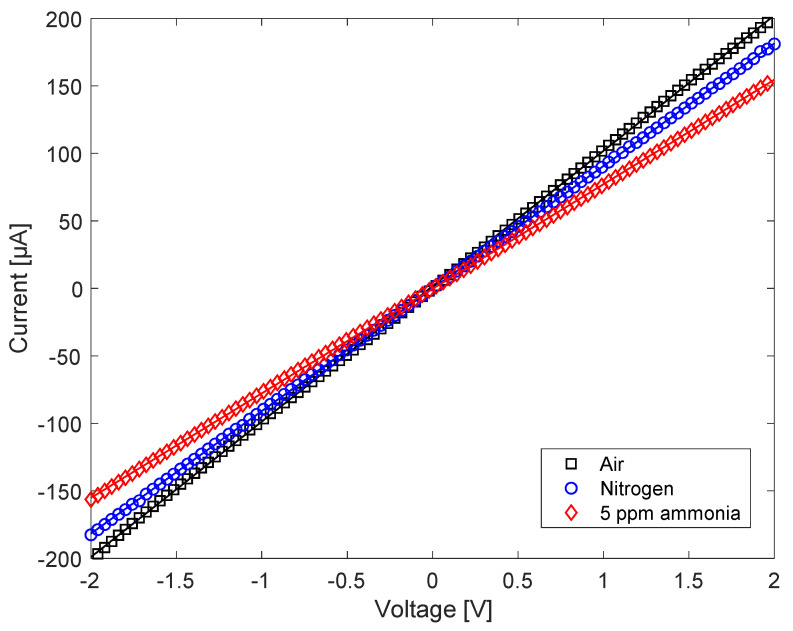
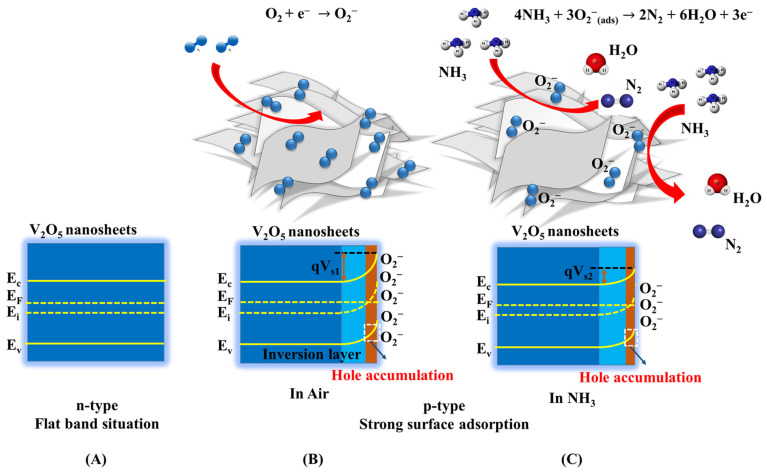
The gas effects were initially studied by measuring, at room temperature, the I–V curves of V2O5 exposed to air, nitrogen, and 5 ppm ammonia in nitrogen. The three curves are shown in Figure 9, and they show that the conductivity decreases from air to nitrogen and even more by adding ammonia to air. Considering the electron acceptor character of oxygen and water vapor and the electron donor character of ammonia, this behavior is compatible with that of a p-type semiconductor. This result is surprising because V2O5 is commonly known to be an n-type semiconductor. The change in conductivity character has previously been found in hydrated amorphous materials [26], but in this case it seems to be induced by gas adsorption. A thorough explanation of the character change is beyond the scope of this paper and will require more in-depth experimental and theoretical studies. Here, we may assume that this might be caused by the surface depletion of electrons. The mechanism is outlined in Figure 10. When the sensor is exposed to air, the adsorbed oxygen and water molecules are expected to act as electron acceptors, and thus produce an upward band bending at the surface, corresponding to an electron-depleted but hole-enriched region (Figure 10B). The conductivity, on the other hand, increases relative to nitrogen, as expected in a p-type semiconductor.
Figure 9.
I–V curves of the V2O5 nanosheets in air, in pure nitrogen, and with 5 ppm of ammonia in air.
Figure 10.
Schematic diagrams of the energy bands of V2O5 nanosheets in vacuum (A); with strong surface adsorption of oxygen in air (B); and with ammonia injection (C).
In presence of ammonia, the NH3 molecules might react with O2− on the surface (as in reaction 6), releasing electrons in the material and leading to the decrease of the hole concentration through electron-hole recombination:
| (6) |
Thus, with the injection of NH3, the density of absorbed O2− decreases, the energy band bends down, as in Figure 10C, and the sensor resistance increases. This phenomenon is emphasized in a nanometric material where the surface dominates over the bulk.
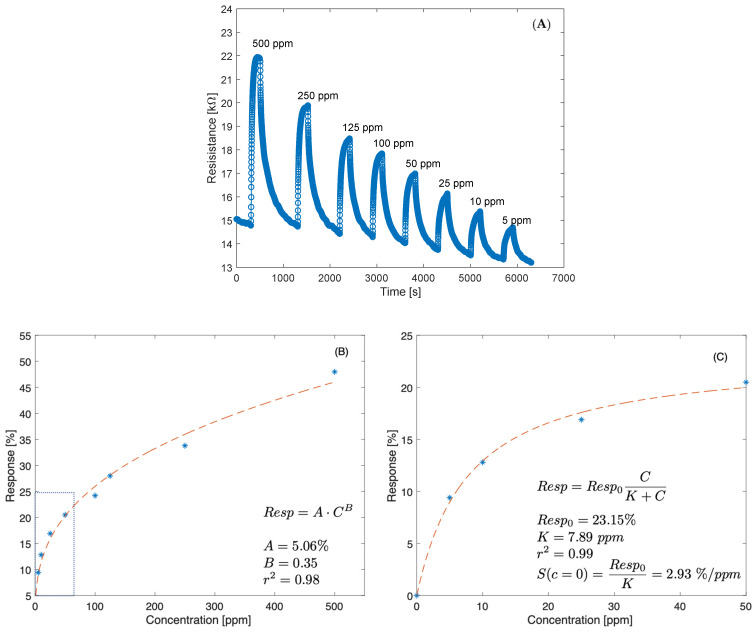
In most metal oxide semiconductor gas sensors, sensitivity is activated at high temperatures, with the obvious drawback of high-power consumption and the necessity to maintain the sensor temperature stable. Instead, V2O5 nanosheets have the advantage of being sensitive at room temperature. The sensor sensitivity to ammonia was tested at room temperature and 45% relative humidity. The sensor was exposed to ammonia concentrations ranging from 5 to 500 ppm in air. Each injection of ammonia lasted for 200 s and was followed by exposure to pure air for 800 s to recover the initial baseline.
The dynamic resistance of the sensor in response to a pulse sequence of ammonia of different concentrations is shown in Figure 11A. As previously mentioned, resistance increases with ammonia concentration. Figure 11B shows the sensor response versus ammonia concentration. The sensor response is calculated as the relative change in resistance:
| (7) |
where Ra and Rg are the resistance in air and in ammonia, respectively. The response curve was fitted with the Freundlich power-law isotherm (Figure 11B). The Freundlich isotherm fits the response over the entire concentration range. However, since the slope (sensitivity) of the Freundlich isotherm at the origin is infinite, it is not adequate to represent sensor behavior in the low concentration range. The response at concentrations below 50 ppm is better fitted by the Langmuir isotherm (see Figure 11C). The deviation at a high concentration from the Langmuir behavior suggests the presence of a low density of high affinity adsorption sites.
Figure 11.
(A) Dynamic resistance of the sensor at room temperature and 45% relative humidity towards different NH3 concentrations. (B) Sensor response curve as a function of the ammonia concentration. Freundlich isotherm fit is also shown (red dashed line). (C) Sensor response in the range 0–50 ppm of ammonia fitted by a Langmuir isotherm function. The sensitivity at the origin is calculated as the derivative of the Langmuir function in c = 0 ppm.
The limit of detection for ammonia was calculated using the signal-to-noise ratio and sensitivity at the origin. The sensitivity at the origin, estimated from the Langmuir function, is approximately 2.9%/ppm. The signal-to-noise ratio was calculated in steady-state conditions as the ratio of the average current divided by three times its standard deviation. The measured signal-to-noise ratio is of the order of 50. Thus, the estimated limit of detection is of the order to 0.4 ppm, sufficient for most food quality monitoring applications.
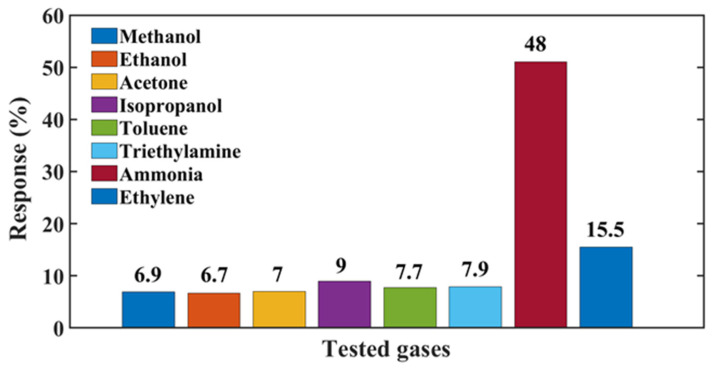
In terms of practical applications (for example, in the detection of spoilage of meats or fish), selectivity plays a fundamental role in the correct interpretation of sensor signals. The sensor was exposed to 500 ppm of NH3 to study its selectivity against 500 ppm of the following interfering compounds: trimethylamine, toluene, isopropyl alcohol, acetone, ethanol, methanol, and ethylene. Sensor responses to the different gases are compared in Figure 12. The change in resistance for NH3 is three times larger than for ethylene, and between 5 and 7 times larger than for the other volatile compounds. It is worth mentioning that in most applications, the ethylene concentration is much lower than 500 ppm. The selectivity behavior suggests a high affinity between ammonia and the active sites of V2O5 [40].
Figure 12.
Comparison of the responses of the sensor to various gases.
Another factor to consider is humidity, which is almost always present, in particular in food and breath. The effect of humidity was tested by measuring the response to 500 ppm ammonia at various levels of relative humidity in the range 45%–95%. The dynamics of the sensor responses are shown in Figure 13A.
Figure 13.
(A) Dynamic resistance of the sensor under different humidity conditions; (B) sensor response to 500 ppm ammonia under various relative humidity conditions.
Figure 13B shows that the ammonia response is largest at the lowest humidity tested, while at RH larger than 65%, the response to ammonia drops from 50% to 30% but becomes almost insensitive to a further increase in humidity. The decreased response in the presence of humidity suggests that the adsorbed water molecules compete with ammonia for adsorption sites.
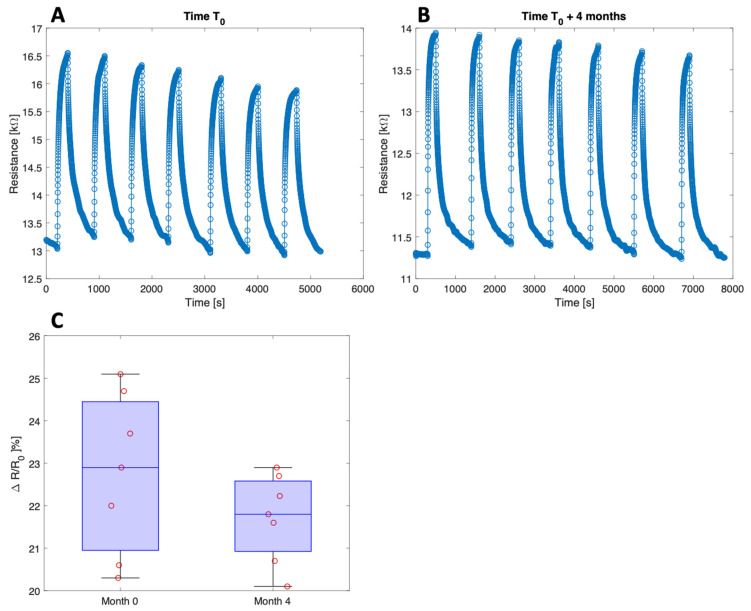
Other important parameters to ensure sensor accuracy in real-time monitoring are sensor repeatability and stability. The repeatability and stability were evaluated by measuring the sensor response to repeated cycles of 100 ppm ammonia and by repeating the measurement after four months. The results are shown in Figure 14A,B. Despite the drift of the resistance baseline, the response of the sensor is comparable. Figure 14C shows the distributions of the repeated responses at four months of distance. The stability of the sensor response can be appreciated by calculating the ANOVA of the two distributions. The results indicate that the response to the same ammonia concentration remains statistically undistinguishable (p-value = 0.22).
Figure 14.
Repeatability and stability tests. (A) Sensor dynamic resistance under consecutive exposures to 100 ppm ammonia at 45% relative humidity; (B) same measurement repeated four months later. (C) Comparison of sensor responses.
A comparison with recent results reported in the scientific literature from chemoresistive sensors based on pristine and composite V2O5 nanostructures is summarized in Table 1. V2O5-based resistive sensors, grown by different methods and with different morphologies, have been tested to detect various gases, such as NO2, xylene, ethanol, butylamine, acetone, trimethylamine (TMA), and ammonia. Table 1 indicates that vanadium pentoxide-based sensors are mostly used at high temperatures, in the range of 200–300 °C.
Table 1.
Performance comparison of V2O5 nanostructures as gas sensors in recent scientific literature.
| Material | Method | Gases | Conc. | Response | Temp. (°C) | Ref. |
|---|---|---|---|---|---|---|
| SnO2@ V2O5 | ALD | NO2 | 100 ppm | 2.5 a | 250 | [41] |
| V2O5 flower-like | Hydrothermal | Xylene | 100 ppm | 2.2 b | 300 | [34] |
| V2O5 nanosphere | Solvothermal | Xylene | 100 ppm | 2.757 b | 290 | [42] |
| V2O5 nanorods | Hydrothermal | C2H5OH | 3000 ppm | 13.3 % c | 100 | [43] |
| V2O5 thin film | Chemical spray | NO2 | 100 ppm | 20.3 % d | 200 | [44] |
| V2O5 nanofibers | Spray pyrolysis | Xylene | 100 ppm | 27 b | RT | [45] |
| V2O5@TiO2 core-shell | Sol-gel | NH3 | 100 ppm | 8 b | 365 | [46] |
| V2O5 hierarchical | Hydrothermal | 1-butylamine | 100 ppm | 2.6 b | 140 | [47] |
| MoO3-V2O5 | Spray pyrolysis | NO2 | 100 ppm | 80 % d | 200 | [48] |
| V2/O5 flower-like | Hydrothermal | TMA | 5 ppm | 2.25 b | 200 | [28] |
| 3.5% Au/V2O5 microflowers | In situ reduction and thermal oxidization | 1-butylamine | 100 ppm | 7.3 b | 240 | [49] |
| V2O5/CuO nanostructures | Electrospinning | Acetone | 500 ppm | 8.8 b | 440 | [50] |
| 2 wt% Sn doped V2O5 | NH3 | 50 ppm | 77.84% c | RT | [51] | |
| V2O5/PVP | Electrospinning | NH3 | 0.6 ppm | 6% e | 260 | [52] |
| V2O5 Fibers | Sol–gel | NH3 | 2.1 ppm | 11% e | 200 | [53] |
| V2O5 Films | RF sputtering | NH3 | 75 ppm | 17 b | [21] | |
| V2O5 nanosheets | Hydrothermal | NH3 | 100 ppm | 24.2% d | RT | This work |
a Response defined as Rg/Ra; b Response defined as Ra/Rg; c Response defined as (Igas – Iair)/Iair × 100 (%); d Response defined as (Rgas – Rair)/Rair × 100 (%), e Response defined as (Rair − Rgas)/Rgas × 100 (%).
4. Conclusions
Nanostructured V2O5 was prepared using an environmentally friendly hydrothermal method followed by heat treatment at 500 °C in air. Thanks to the morphology of very thin nanosheets stacked on top of each other, the material has a high surface/volume ratio. The V2O5 nanosheets show p-type semiconductor character, probably due to the growth process and the peculiar morphology. The resistive sensor based on V2O5 nanosheets works at room temperature, showing high sensitivity and low limit of detection towards ammonia, a typical gas generated, for instance, by bacterial spoilage of food products. The sensor also exhibits high selectivity to ammonia versus interfering gases such as methanol, ethanol, acetone, isopropanol, toluene, trimethylamine, good repeatability, and good long-term stability. The performance of the chemosensor, together with its simplicity and cost-effectiveness, makes it a candidate for real-time monitoring of ammonia, for instance in breath and for assessing food quality along the production and distribution chain.
Acknowledgments
L.V.D. acknowledges the support of Fondazione Ernest Mach and the University of Rome Tor Vergata.
Author Contributions
Conceptualization, D.T.T.L., N.V.D., C.D.N. and N.D.H.; methodology, N.V.D. and N.D.H.; software, N.V.D. and N.D.H.; formal analysis, L.V.D., M.T. and N.V.D.; investigation, L.V.D., T.T.N. and H.N.; resources, M.T., N.V.D. and H.N.; data curation, L.V.D., T.T.N. and N.V.D.; writing—original draft preparation, L.V.D., M.T, and F.B; writing—review and editing, D.T.T.L., N.V.D., C.D.N. and N.D.H.; visualization, L.V.D. and N.V.D.; supervision, N.V.D., M.T., C.D.N. and F.B.; funding acquisition, D.T.T.L. and N.D.H. All authors have read and agreed to the published version of the manuscript.
Data Availability Statement
Not applicable.
Conflicts of Interest
The authors declare no conflict of interest.
Funding Statement
Research under the research support program B2022-BKA-26 CTVL.
Footnotes
Disclaimer/Publisher’s Note: The statements, opinions and data contained in all publications are solely those of the individual author(s) and contributor(s) and not of MDPI and/or the editor(s). MDPI and/or the editor(s) disclaim responsibility for any injury to people or property resulting from any ideas, methods, instructions or products referred to in the content.
References
- 1.Timmer B., Olthuis W., Van Den Berg A. Ammonia sensors and their applications—A review. Sens. Actuators B Chem. 2005;107:666–677. doi: 10.1016/j.snb.2004.11.054. [DOI] [Google Scholar]
- 2.Mounasamy V., Mani G.K., Tsuchiya K., Madanagurusamy S. Preparation of free-standing V2O5 nanosheets for ammonia sensing application: A potential candidate for flexible sensors. J. Sci. Adv. Mater. Devices. 2022;7:100415. doi: 10.1016/j.jsamd.2021.100415. [DOI] [Google Scholar]
- 3.Lindgren T. A case of indoor air pollution of ammonia emitted from concrete in a newly built office in Beijing. Build. Environ. 2010;45:596–600. doi: 10.1016/j.buildenv.2009.07.014. [DOI] [Google Scholar]
- 4.Mahdinia M., Adeli S.H., Mohammadbeigi A., Heidari H., Ghamari F., Soltanzadeh A. Respiratory Disorders Resulting From Exposure to Low Concentrations of Ammonia: A 5-Year Historical Cohort Study. J. Occup. Environ. Med. 2020;62:e431–e435. doi: 10.1097/JOM.0000000000001932. [DOI] [PubMed] [Google Scholar]
- 5.Chen W., Metsälä M., Vaittinen O., Halonen L. The origin of mouth-exhaled ammonia. J. Breath Res. 2014;8 doi: 10.1088/1752-7155/8/3/036003. [DOI] [PubMed] [Google Scholar]
- 6.Spacek L.A., Strzepka A., Saha S., Kotula J., Gelb J., Guilmain S., Risby T., Solga S.F. Repeated Measures of Blood and Breath Ammonia in Response to Control, Moderate and High Protein Dose in Healthy Men. Sci. Rep. 2018;8:2554. doi: 10.1038/s41598-018-20503-0. [DOI] [PMC free article] [PubMed] [Google Scholar]
- 7.Narasimhan L.R., Goodman W., Patel C.K.N. Correlation of breath ammonia with blood urea nitrogen and creatinine during hemodialysis. Proc. Natl. Acad. Sci. USA. 2001;98:4617–4621. doi: 10.1073/pnas.071057598. [DOI] [PMC free article] [PubMed] [Google Scholar]
- 8.Aydin M., Harvey-Woodworth C.N. Halitosis: A new definition and classification. Br. Dent. J. 2014;217:E1. doi: 10.1038/sj.bdj.2014.552. [DOI] [PubMed] [Google Scholar]
- 9.DuBois S., Eng S., Bhattacharya R., Rulyak S., Hubbard T., Putnam D., Kearney D.J. Breath ammonia testing for diagnosis of hepatic encephalopathy. Dig. Dis. Sci. 2005;50:1780–1784. doi: 10.1007/s10620-005-2937-6. [DOI] [PubMed] [Google Scholar]
- 10.Kearney D.J., Hubbard T., Putnam D. Breath ammonia measurement in Helicobacter pylori infection. Dig. Dis. Sci. 2002;47:2523–2530. doi: 10.1023/A:1020568227868. [DOI] [PubMed] [Google Scholar]
- 11.Brannelly N.T., Hamilton-Shield J.P., Killard A.J. The Measurement of Ammonia in Human Breath and its Potential in Clinical Diagnostics. Crit. Rev. Anal. Chem. 2016;46:490–501. doi: 10.1080/10408347.2016.1153949. [DOI] [PubMed] [Google Scholar]
- 12.Kim K.-H., Pal R., Ahn J.-W., Kim Y.-H. Food decay and offensive odorants: A comparative analysis among three types of food. Waste Manag. 2009;29:1265–1273. doi: 10.1016/j.wasman.2008.08.029. [DOI] [PubMed] [Google Scholar]
- 13.Ma Z., Chen P., Cheng W., Yan K., Pan L., Shi Y., Yu G. Highly Sensitive, Printable Nanostructured Conductive Polymer Wireless Sensor for Food Spoilage Detection. Nano Lett. 2018;18:4570–4575. doi: 10.1021/acs.nanolett.8b01825. [DOI] [PubMed] [Google Scholar]
- 14.Yuan Z., Bariya M., Fahad H.M., Wu J., Han R., Gupta N., Javey A. Trace-Level, Multi-Gas Detection for Food Quality Assessment Based on Decorated Silicon Transistor Arrays. Adv. Mater. 2020;32:1908385. doi: 10.1002/adma.201908385. [DOI] [PubMed] [Google Scholar]
- 15.Wang C., Yu Z., Zhao X., Lu H., Wang Q. Rapid response to amine vapor based on fluorescent light-up sensor for real-time and visual detection of crawfish and fish freshness. Dye. Pigment. 2021;189:109228. doi: 10.1016/j.dyepig.2021.109228. [DOI] [Google Scholar]
- 16.Shaalan N.M., Ahmed F., Saber O., Kumar S. Gases in Food Production and Monitoring: Recent Advances in Target Chemiresistive Gas Sensors. Chemosensors. 2022;10:338. doi: 10.3390/chemosensors10080338. [DOI] [Google Scholar]
- 17.Galstyan V., Bhandari M., Sberveglieri V., Sberveglieri G., Comini E. Metal Oxide Nanostructures in Food Applications: Quality Control and Packaging. Chemosensors. 2018;6:16. doi: 10.3390/chemosensors6020016. [DOI] [Google Scholar]
- 18.Pereira P.F.M., de Sousa Picciani P.H., Calado V., Tonon R.V. Electrical gas sensors for meat freshness assessment and quality monitoring: A review. Trends Food Sci. Technol. 2021;118:36–44. doi: 10.1016/j.tifs.2021.08.036. [DOI] [Google Scholar]
- 19.Meng F., Qi T., Zhang J., Zhu H., Yuan Z., Liu C., Qin W., Ding M. MoS2-Templated Porous Hollow MoO3 Microspheres for Highly Selective Ammonia Sensing via a Lewis Acid-Base Interaction. IEEE Trans. Ind. Electron. 2022;69:960–970. doi: 10.1109/TIE.2021.3053902. [DOI] [Google Scholar]
- 20.Xing X., Xiao X., Wang L., Wang Y. Highly sensitive formaldehyde gas sensor based on hierarchically porous Ag-loaded ZnO heterojunction nanocomposites. Sens. Actuators B Chem. 2017;247:797–806. doi: 10.1016/j.snb.2017.03.077. [DOI] [Google Scholar]
- 21.Mounasamy V., Mani G.K., Tsuchiya K., Madanagurusamy S. Nanoimprint assisted free standing porous vanadium oxide nanosheet based ammonia sensor. Appl. Surf. Sci. 2021;541:148271. doi: 10.1016/j.apsusc.2020.148271. [DOI] [Google Scholar]
- 22.Berouaken M., Talbi L., Yaddadene C., Maoudj M., Menari H., Alkama R., Gabouze N. Room temperature ammonia gas sensor based on V2O5 nanoplatelets/Quartz crystal microbalance. Appl. Phys. A. 2020;126:949. doi: 10.1007/s00339-020-04129-6. [DOI] [Google Scholar]
- 23.Choi H., Kwon Y.J., Paik J., Seol J.-B., Jeong Y.K. P-Type Conductivity of Hydrated Amorphous V2O5 and Its Enhanced Photocatalytic Performance in ZnO/V2O5/rGO. ACS Appl. Electron. Mater. 2019;1:1881–1889. doi: 10.1021/acsaelm.9b00397. [DOI] [Google Scholar]
- 24.Van Duy L., Nguyet T.T., Hung C.M., Thanh Le D.T., Van Duy N., Hoa N.D., Biasioli F., Tonezzer M., Di Natale C. Ultrasensitive NO2 gas sensing performance of two dimensional ZnO nanomaterials: Nanosheets and nanoplates. Ceram. Int. 2021 doi: 10.1016/j.ceramint.2021.07.042. [DOI] [Google Scholar]
- 25.D’Amico A., Di Natale C. A contribution on some basic definitions of sensors properties. IEEE Sens. J. 2001;1:183–190. doi: 10.1109/JSEN.2001.954831. [DOI] [Google Scholar]
- 26.Benkahoul M., Zayed M.K., Solieman A., Alamri S.N. Spray deposition of V4O9 and V2O5 thin films and post-annealing formation of thermochromic VO2. J. Alloys Compd. 2017;704:760–768. doi: 10.1016/j.jallcom.2017.02.088. [DOI] [Google Scholar]
- 27.Rasheed R.T., Mansoor H.S., Abdullah T.A., Juzsakova T., Al-Jammal N., Salman A.D., Al-Shaikhly R.R., Le P.C., Domokos E., Abdulla T.A. Synthesis, characterization of V2O5 nanoparticles and determination of catalase mimetic activity by new colorimetric method. J. Therm. Anal. Calorim. 2021;145:297–307. doi: 10.1007/s10973-020-09725-5. [DOI] [Google Scholar]
- 28.Meng D., Si J., Wang M., Wang G., Shen Y., San X., Meng F. In-situ growth of V2O5 flower-like structures on ceramic tubes and their trimethylamine sensing properties. Chin. Chem. Lett. 2020;31:2133–2136. doi: 10.1016/j.cclet.2019.12.021. [DOI] [Google Scholar]
- 29.Meng D., Qiao T., Wang G., San X., Meng F. One-step synthesis of rGO/V2O5 flower-like microsphere composites with enhanced trimethylamine sensing properties. Mater. Lett. 2021;299:130023. doi: 10.1016/j.matlet.2021.130023. [DOI] [Google Scholar]
- 30.Dhoundiyal H., Das P., Bhatnagar M.C. Electrical and magnetic properties of V2O5 microstructure formed by self-assembled nanorods. Phys. B Condens. Matter. 2021;603:412622. doi: 10.1016/j.physb.2020.412622. [DOI] [Google Scholar]
- 31.Zhang G., Ren L., Hu D., Zhang S., Gu H. Fabrication of mesoporous carbon hollow spheres intercalated three-dimensional network structure V2O5 nanosheets with enhanced electrochemical performance. J. Alloys Compd. 2019;781:407–414. doi: 10.1016/j.jallcom.2018.12.096. [DOI] [Google Scholar]
- 32.Zhang H., Rong Y., Jia W., Chai H., Cao Y. Simple solvent-free synthesis of rod-like Cu-doped V2O5 for high storage capacity cathode materials of lithium ion batteries. J. Alloys Compd. 2019;802:139–145. doi: 10.1016/j.jallcom.2019.06.192. [DOI] [Google Scholar]
- 33.Hung C.M., Van Duy L., Thanh Le D.T., Nguyen H., Van Duy N., Hoa N.D. ZnO coral-like nanoplates decorated with Pd nanoparticles for enhanced VOC gas sensing. J. Sci. Adv. Mater. Devices. 2021 doi: 10.1016/j.jsamd.2021.05.005. [DOI] [Google Scholar]
- 34.Cao P., Gui X., Navale S.T., Han S., Xu W., Fang M., Liu X., Zeng Y., Liu W., Zhu D., et al. Design of flower-like V2O5 hierarchical nanostructures by hydrothermal strategy for the selective and sensitive detection of xylene. J. Alloys Compd. 2020;815:152378. doi: 10.1016/j.jallcom.2019.152378. [DOI] [Google Scholar]
- 35.Yang X.H., Xie H., Fu H.T., An X.Z., Jiang X.C., Yu A.B. Synthesis of hierarchical nanosheet-assembled V2O5 microflowers with high sensing properties towards amines. RSC Adv. 2016;6:87649–87655. doi: 10.1039/C6RA18848F. [DOI] [Google Scholar]
- 36.Surya Bhaskaram D., Cheruku R., Govindaraj G. Reduced graphene oxide wrapped V2O5 nanoparticles: Green synthesis and electrical properties. J. Mater. Sci. Mater. Electron. 2016;27:10855–10863. doi: 10.1007/s10854-016-5194-x. [DOI] [Google Scholar]
- 37.Wang S., Yu T., Li Y., Fu H., Sun C. General methods for large-scale production of nanostructured V2O5 with controlled morphologies. Mater. Res. Bull. 2019;111:284–288. doi: 10.1016/j.materresbull.2018.11.008. [DOI] [Google Scholar]
- 38.Abd-Alghafour N.M., Ahmed N.M., Hassan Z. Fabrication and characterization of V2O5 nanorods based metal–semiconductor–metal photodetector. Sens. Actuators A Phys. 2016;250:250–257. doi: 10.1016/j.sna.2016.09.001. [DOI] [Google Scholar]
- 39.Zhang P., Pan G., Zhang B., Zhen J., Sun Y. High sensitivity ethanol gas sensor based on Sn-doped ZnO under visible light irradiation at low temperature. Mater. Res. 2014;17:817–822. doi: 10.1590/1516-1439.235713. [DOI] [Google Scholar]
- 40.Sun D., Liu Q., Liu Z., Gui G., Huang Z. Adsorption and oxidation of NH3 over V2O5/AC surface. Appl. Catal. B Environ. 2009;92:462–467. doi: 10.1016/j.apcatb.2009.09.005. [DOI] [Google Scholar]
- 41.Ko W.C., Kim K.M., Kwon Y.J., Choi H., Park J.K., Jeong Y.K. ALD-assisted synthesis of V2O5 nanoislands on SnO2 nanowires for improving NO2 sensing performance. Appl. Surf. Sci. 2020;509:144821. doi: 10.1016/j.apsusc.2019.144821. [DOI] [Google Scholar]
- 42.Cao P., Gui X., Pawar D., Han S., Xu W., Fang M., Liu X., Zeng Y., Liu W., Zhu D., et al. Highly ordered mesoporous V2O5 nanospheres utilized chemiresistive sensors for selective detection of xylene. Mater. Sci. Eng. B. 2021;265:115031. doi: 10.1016/j.mseb.2020.115031. [DOI] [Google Scholar]
- 43.Abd-Alghafour N.M., Naeem G.A., Ibraheam A.S., Afzal N., Mohammad S.M., Muslim R.F. Fabrication and characterization of ethanol gas sensor based on hydrothermally grown V2O5 nanorods. Optik (Stuttg) 2020;222:165441. doi: 10.1016/j.ijleo.2020.165441. [DOI] [Google Scholar]
- 44.Mane A.A., Maldar P.S., Dabhole S.H., Nikam S.A., Moholkar A.V. Effect of substrate temperature on physicochemical and gas sensing properties of sprayed orthorhombic V2O5 thin films. Measurement. 2019;131:223–234. doi: 10.1016/j.measurement.2018.08.042. [DOI] [Google Scholar]
- 45.Vijayakumar Y., Mani G.K., Ponnusamy D., Shankar P., Kulandaisamy A.J., Tsuchiya K., Rayappan J.B.B., Ramana Reddy M.V. V2O5 nanofibers: Potential contestant for high performance xylene sensor. J. Alloys Compd. 2018;731:805–812. doi: 10.1016/j.jallcom.2017.10.056. [DOI] [Google Scholar]
- 46.Fu H., Yang X., An X., Fan W., Jiang X., Yu A. Experimental and theoretical studies of V2O5@TiO2 core-shell hybrid composites with high gas sensing performance towards ammonia. Sens. Actuators B Chem. 2017;252:103–115. doi: 10.1016/j.snb.2017.05.027. [DOI] [Google Scholar]
- 47.Yang T., Yu H., Xiao B., Li Z., Zhang M. Enhanced 1-butylamine gas sensing characteristics of flower-like V2O5 hierarchical architectures. J. Alloys Compd. 2017;699:921–927. doi: 10.1016/j.jallcom.2017.01.028. [DOI] [Google Scholar]
- 48.Mane A.A., Nikam S.A., Moholkar A.V. NO2 gas sensing properties of sprayed composite porous MoO3-V2O5 thin films. Mater. Chem. Phys. 2018;216:294–304. doi: 10.1016/j.matchemphys.2018.05.043. [DOI] [Google Scholar]
- 49.Yang X., Wang W., Wang C., Xie H., Fu H., An X., Jiang X., Yu A. Synthesis of Au decorated V2O5 microflowers with enhanced sensing properties towards amines. Powder Technol. 2018;339:408–418. doi: 10.1016/j.powtec.2018.08.024. [DOI] [Google Scholar]
- 50.Wu J., Xing X., Zhu Z., Zheng L., Chen J., Wang C., Yang D. Electrospun hollow CuO modified V2O5 nano-string of pearls with improved acetone sensitivity. Chem. Phys. Lett. 2019;727:19–24. doi: 10.1016/j.cplett.2019.04.043. [DOI] [Google Scholar]
- 51.Singh N., Umar A., Singh N., Fouad H., Alothman O.Y., Haque F.Z. Highly sensitive optical ammonia gas sensor based on Sn Doped V2O5 Nanoparticles. Mater. Res. Bull. 2018;108:266–274. doi: 10.1016/j.materresbull.2018.09.008. [DOI] [Google Scholar]
- 52.Modafferi V., Trocino S., Donato A., Panzera G., Neri G. Electrospun V2O5 composite fibers: Synthesis, characterization and ammonia sensing properties. Thin Solid Films. 2013;548:689–694. doi: 10.1016/j.tsf.2013.03.137. [DOI] [Google Scholar]
- 53.Modafferi V., Panzera G., Donato A., Antonucci P.L., Cannilla C., Donato N., Spadaro D., Neri G. Highly sensitive ammonia resistive sensor based on electrospun V2O5 fibers. Sens. Actuators B Chem. 2012;163:61–68. doi: 10.1016/j.snb.2012.01.007. [DOI] [Google Scholar]
Associated Data
This section collects any data citations, data availability statements, or supplementary materials included in this article.
Data Availability Statement
Not applicable.


