Abstract
This paper presents an integrated and easy methodology for bibliometric analysis. The proposed methodology is evaluated on recent research activities to highlight the role of the Internet of Things in healthcare applications. Different tools are used for bibliometric studies to explore the breadth and depth of different research areas. However, these Methods consider only the Web of Science or Scopus data for bibliometric analysis. Furthermore, bibliometric analysis has not been fully utilised to examine the capabilities of the Internet of Things for medical devices and their applications. There is a need for an easy methodology to use for a single integrated analysis of data from many sources rather than just the Web of Science or Scopus. A few bibliometric studies merge the Web of Science and Scopus to conduct a single integrated piece of research. This paper presents a methodology that could be used for a single bibliometric analysis across multiple databases. Three freely available tools, Excel, Perish or Publish and the R package Bibliometrix, are used for the purpose. The proposed bibliometric methodology is evaluated for studies related to the Internet of Medical Things (IoMT) and its applications in healthcare settings. An inclusion/exclusion criterion is developed to explore relevant studies from the seven largest databases, including Scopus, Web of Science, IEEE, ACM digital library, PubMed, Science Direct and Google Scholar. The study focuses on factors such as the number of publications, citations per paper, collaborative research output, h-Index, primary research and healthcare application areas. Data for this study are collected from the seven largest academic databases for 2012 to 2022 related to IoMT and their applications in healthcare. The bibliometric data analysis generated different research themes within IoMT technologies and their applications in healthcare research. The study has also identified significant research areas in this field. The leading research countries and their contributions are another output from the data analysis. Finally, future research directions are proposed for researchers to explore this area in further detail.
Keywords: bibliometrics, internet of medical things, internet of things for medical devices, healthcare applications, bibliometric study
1. Introduction
The recent trends, such as the growth in the elderly population, a shift in disease patterns, an increase in the proportion of women in the labour force, and a rising need for care, are among the factors driving the expansion of European home healthcare services [1]. However, these trends are also witnessed in other countries, and the demand for home healthcare is expected to rise globally. Home healthcare fills a void in the healthcare system by providing care at all three levels (primary, secondary, and tertiary) of pre-hospitalisation and post-hospitalisation. The current pandemic of COVID-19 has also brought much-needed attention to home healthcare [2]. Consequently, there has been a change in patient (consumer) behaviour regarding the consumption of healthcare services due to the increased risk of disease transmission. As a result, there is increased adoption of “Home Health” and “Telemedicine” services [3].
1.1. The Importance of IoT in Healthcare
While it is understood that technology cannot stop the population from ageing or eradicate chronic diseases at once, it can make healthcare more accessible and more cost-effective by equipping users with pocket-friendly medical facilities. A new paradigm, known as the Internet of Things (IoT), has extensive applicability in numerous areas, including healthcare [4]. The complete application of this paradigm in the healthcare service is of mutual benefit because it allows medical service providers to function proficiently and patients to obtain better treatment. With this technology-based healthcare method, unparalleled benefits could improve the quality and efficiency of medicines and the health of elderly patients.
1.2. Potential Advantages and Challenges
Although IoT in healthcare is a recent phenomenon, its advantages are already evident. The most important advantage of using IoT devices in healthcare is monitoring and reporting patient health conditions simultaneously. IoMT devices can also be helpful for patient data collection and analysis of this data. Patient health data analysis can then track their health and generate alerts if something unexpected occurs. IoMT devices not only enable remote health monitoring but can also help in providing remote medical assistance. In summary, IoMT can provide end-to-end connectivity between patients and their carers/doctors and can help reduce the cost of health monitoring and physical visits by medical professionals. The IoMT devices can also aid in further research on patient health, monitoring and telemedicine.
However, like any other technological field, IoT in healthcare comes with risks and challenges. The most significant risk can be data security and privacy [5]. Integrating different devices and protocols can pose multiple challenges to successfully implementing such systems in healthcare. With the passage of time and continuous use, such IoT systems are also prone to data overload and accuracy challenges [6]. The cost of purchasing/hiring IoT devices can also be challenging.
1.3. An Overview of the Related Studies
Recently, a bibliometric analysis of home health was performed using Scopus databases [4]. The objective of this study was to carry out a bibliometric analysis of Home Health with the Internet of Health Things (IoHT). A total of 1000 documents retrieved from Scopus were used for bibliometric analysis. The results have revealed that the key theme in the future could be a congruence of assisted living for older patients with health monitoring devices. The Internet of Things in Health trends is examined in [7] through bibliometrics and text mining. A total of 778 articles were extracted from the Web of Science from 1998 to 2016. Based on abstract text analysis, the papers were categorised into thirty clusters, resulting in eight trends of IoMT.
Similarly, a bibliometric study was performed to examine research publications in the smart home Internet of Things field [8]. A total of 2339 articles from the SCOPUS database released between 2015 and 2019 were used for analysis. A thorough study of Internet of Things (IoT) research from 1970 to 2019 is performed in [9]. The study adopts a bibliometric technique to examine the IoT trend by considering the publication year from its inception to the present. This study uncovers the publication patterns, significant prominent papers, publication locations, and several notable subjects. However, these studies are limited to the Scopus database only. A systematic mapping study explores the Internet of Things’ role in medicine [10]. This systematic mapping analysis evaluated studies published between 2000 and 2018 in key online scientific databases such as IEEE Xplore, Web of Science, Scopus, and PubMed. A total of 3678 papers were discovered, of which 89 were chosen based on inclusion/exclusion criteria. A bibliometric analysis of global research publications related to digital and mobile health was performed in [11]. The data were retrieved from Scopus due to its compatibility with the Bibliometrix R package. The analysis reveals a progressive increase in the publication of research articles on digital and mobile health until 2016, followed by a sudden surge in 2017.
There are various tools available to perform bibliometric analysis, including tools for data acquisition, performance analysis, science mapping, and visualisation. Currently, the Bibliometrix R package and its user-friendly web-based Biblioshiny platform have the most comprehensive set of techniques and are commonly used for bibliometric analysis [12]. A bibliometric analysis of gene editing using the R package on data retrieved from WoS is performed in [13]. Similarly, Scopus data were used to perform a bibliometric analysis of insurance literacy using the R package in [14]. The web-based interface of the R package, Biblioshiny, was used to perform bibliometric analysis on cross-cultural learning in [15]. In the study, WoS was used as a source of information, and the publication period was limited to 2002–2021. Microsoft Excel, VOSviewer, and Bibliometrix were used for statistical analysis of the publications in Scopus on the Omicron Variant of COVID-19 from 2020 to 2022 in [16]. In another study [7], BibExcel was used to perform a bibliometric analysis of IoMT. A total of 778 articles retrieved from the WoS were used to perform the analysis. A comprehensive overview of healthcare waste management research and its associated research themes and trends using VOSviewer was presented in [17]. It also identifies research gaps and proposes future avenues for research on sustainable healthcare waste management within the healthcare industry.
The Publish or Perish software has been previously used to retrieve data from Google Scholar (GS) for a bibliometric study on digital learning articles related to COVID-19 [18]. The paper also provides a step-by-step process of data retrieval from GS. Similarly, publish or perish software was used to assess the current state of IoT applications in irrigation [19]. The data were retrieved from the Scopus database and analysed using Publish or Perish and VOSviewer for citation and bibliometric map, respectively. The Scopus database data were used to examine the available scientific literature on the topic of Industry 4.0 [20]. Publish or Perish was used to include the collected data, while VOSviewer was utilised to visualise the data. Microsoft Excel and SPSS were used for data analysis. A similar work uses Scopus data to analyse Society 5.0 literature’s features, subjects, geographical distribution, keywords, and general themes [21]. Harzing’s Publish or Perish, and VOSviewer were used to analyse publication features, topics, and geographical distribution.
1.4. The Need for an Integrated Methodology
Bibliometric studies are used to evaluate research collaboration across scholars and institutions. This methodology provides a systematic, visible, and static depiction of research [22]. Bibliometric analysis is a well-established form of meta-analytical study [23] and a statistical technique that finds qualitative and quantitative changes in a particular research topic [4]. This research strategy has been utilised extensively to assess enormous quantities of publications in disciplines and domains as diverse as sustainability [24,25], healthcare [26,27,28] and green supply chain management [22,29], blockchain [30] and IoT [31,32]. Bibliometric analysis is a common and thorough technique for examining and interpreting vast quantities of scientific data [33]. It helps us examine a specific field’s evolutionary dynamics and offer insights into its emerging areas.
The current bibliometric studies retrieve papers from only Scopus or Web of Science (WoS) databases for analysis. A few researchers combine the two databases by undertaking a single analysis, although they do not describe the method. Recently, a technique of bibliometric analysis was proposed that merges Scopus and WoS databases [34]. A four-step procedure was presented to merge these two databases. The method was evaluated by conducting a bibliometric analysis of the sale force literature. The study assesses only two types of documents, articles and conference proceedings.
Similarly, a user-friendly method based on [34] is proposed to merge data obtained from Scopus and WoS [35]. The paper proposed a method to simplify some critical phases of merging datasets while performing bibliometric studies with the R package Bibliometric. A three-step, user-friendly method that does not require any coding skills or specialised software is provided. The proposed method can be used to perform a bibliometric study without compromising the integrity of the data. However, it is limited to only two databases.
Therefore, there is a need for an integrated methodology that considers all major databases for collecting data. This paper proposes an integrated methodology for bibliometric analysis to examine the state of the art of IoMT research. To our knowledge, this is the first extensive bibliometric analysis methodology that could be used to perform bibliometric analysis on data retrieved from multiple databases. The proposed bibliometric methodology will enable researchers new to a field to find leading articles based on citation counts, prolific authors, and research hotspots from multiple databases. The method is suitable for assessing the present state of a given field based on markers such as highly cited publications, researchers, journals, academic institutions, and countries. The proposed method could be used to perform an integrated bibliometric analysis in any research field without the use of coding or specialised tools.
1.5. Research Objectives
Traditionally, bibliometric studies cover a research domain from broader angles and provide an in-depth analysis of that research domain. Although there are various surveys, systematic mappings and bibliometric studies performed, for example, the Internet of Things research, there is no study conducted to explore the Internet of medical things as an emerging field. Therefore, this paper aims to aggregate knowledge from major research databases related to IoT use in healthcare and highlight essential research themes within this research domain. This aim is achieved by accomplishing the following research objectives.
The first objective of this research is to present an integrated methodology to perform bibliometric analysis based on data from multiple sources rather than just WoS and Scopus.
To describe the data collection, data cleaning and integration process of the proposed methodology in detail, along with the tools required.
To evaluate the proposed methodology by performing a bibliometric study on IoMT research and its applications in healthcare settings.
To use a systematic approach to identify the most influential scholars, their associations, their chosen keywords, and, most importantly, the connections between academic works [36].
To explore essential research themes and highlight open areas that need further research efforts.
2. Proposed Methodology
This section describes the details of the proposed methodology used for this study. The proposed methodology consists of three significant steps: data collection, integration, and cleaning.
2.1. Data Collection
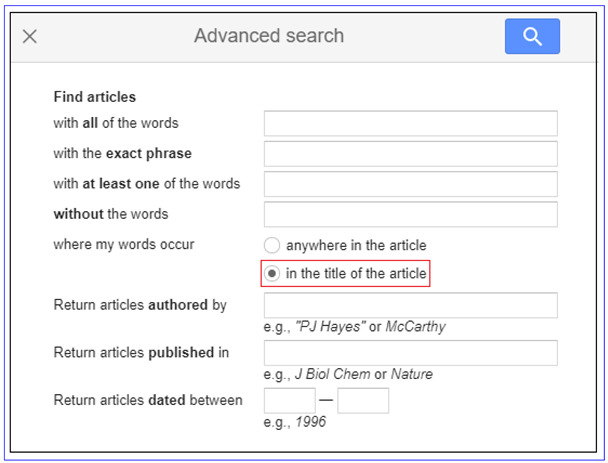
For data collection, we have used Scopus, Web of Science, IEEE, ACM, PubMed, Science Direct, and GS. Search strings are used to extract relevant articles to download the relevant data. Scopus, PubMed, and Web of Science allow users to download the search results in various formats, including CSV, Excel, and Latex. The results of the search were downloaded and saved as .bib file. The advanced search feature of IEEE, Science Direct and GS was used. The advanced search allows users to specify more targeted search criteria before conducting a search. A simple tutorial for performing an advanced search for IEEE Xplore and Science Direct can be found in [37] and [38], respectively. The advanced search option on Google Scholar provides additional search filters and options that can help users narrow down their search results and find more relevant articles. These advanced search options include filters such as the publication date range, authors and source. A step-by-step process of retrieving data using an advanced GS search can be found in Appendix A. The results were exported in BibTeX format for IEEE and Science Direct.
The search string in these databases was limited to the article title, abstract, and keywords, except in GS, where the search string was limited to the document title only. This is because GS does not allow a search based on the abstract and keywords. For ACM digital library, a maximum of 50 papers’ data can be displayed at one time. These data were selected and exported as a .bib file. The data were downloaded in chunks of 50 papers and merged into one .bib file. GS, however, does not have any such feature. To retrieve GS results, the Publish or Perish software is used [39]. The Publish or Perish software does not allow downloading more than 1000 results. Therefore, the search string is divided into sub-strings and used to retrieve the relevant results. It is essential to ensure that the search string in GS and the Publish or Perish software retrieve the same results. The search strings used to retrieve the results can be found in Table 1.
Table 1.
Databases searched along with the search strings, retrieved results, and data format for each database. The GS string is divided into two strings because the Publish or Perish software does not allow downloading more than 100 results.
| Database | Search Terms | Results | Data Format |
|---|---|---|---|
| Scopus | “Internet of medical things” OR “IoMT” OR “Internet of Health Things” OR “IoHT” OR “Internet of Things for Medical Devices” OR “IoT Medical Devices” OR “Smart Health” OR “Wearable Devices” AND “healthcare” AND “Medical”. |
1561 Results | .bib |
| Google Scholar | 1. healthcare “internet of medical things” OR IoMT OR “Internet of Health Things” OR IoHT OR “Internet of Things for Medical Devices” OR “IoT Medical Devices” OR “Smart Health” OR “Wearable Devices”. |
1. 408 Results | Exported to Excel from Perish or Publish software |
| 2. medical “internet of medical things” OR IoMT OR “Internet of Health Things” OR IoHT OR “Internet of Things for Medical Devices” OR “IoT Medical Devices” OR “Smart Health” OR “Wearable Devices”. |
2. 958 Results | ||
| Total: 1045 | |||
| Web of Science | “Internet of medical things” OR IoMT OR “Internet of Health Things” OR IoHT OR “Internet of Things for Medical Devices” OR “IoT Medical Devices” |
997 Results | .bib |
| IEEE Explore | “Internet of medical things” OR “IoMT” OR “Internet of Things for Medical Devices” OR “IoT Medical Devices” OR “Internet of Health Things” OR “IoHT”. |
788 Results | .bib |
| ACM | “Internet of medical things” OR “IoMT” OR “Internet of Health Things” OR “IoHT” OR “Internet of Things for Medical Devices” OR “IoT Medical Devices” OR “Smart Health” OR “Wearable Devices” AND “healthcare” AND “Medical”. |
985 Results | .bib |
| Science Direct: | “Internet of medical things” OR “IoMT” OR “Internet of Things for Medical Devices” OR “IoT Medical Devices” OR “Internet of Health Things” OR “IoHT”. |
120 results | .bib |
| Pubmed: | “Internet of medical things” OR “IoMT” OR “Internet of Things for Medical Devices” OR “IoT Medical Devices” OR “Internet of Health Things” OR “IoHT”. |
926 results | .txt |
| Total Results | 6422 Results | .xlsx | |
| Not in the English Language | Eliminated while downloading | .xlsx | |
| Eliminate Duplicates and Irrelevant | 1184 | .xlsx | |
| Final dataset | 5238 | .xlsx | |
The retrieved results using Publish or Perish will not contain citation information essential for citation, co-citation, and the most popular authors’ analyses. Publish or Perish allows users to inspect and modify the attributes of the selected data and search for citations. The GS citing references pane displays information regarding a citing reference search. When one or more results are chosen in a list of another search, citing information can be retrieved. For both sub-strings for GS, the citation information was retrieved using Publish or Perish. The retrieved data were then exported to an Excel file with headers. To use these data in Biblioshiny, it needs to be formatted before integrating with data from other databases. The keywords are separated by ‘,’ which needs to be replaced with a ‘;’. Similarly, the names of the tag are different. The tags are renamed according to the guidelines provided by Biblioshiny. The data need to be formatted according to the format exported from R.
2.2. Data Integration
In previous bibliometric studies, authors have used the Web of Science or Scopus databases separately due to their different output results. This work integrates data from various search engines, presenting a holistic view. This section describes the data integration process. There are two different ways to incorporate the data. The R package or Excel software can be used. We chose Excel for its various advantages, including its capability to retain uncommon tags (columns of data), which is of utmost importance for bibliometric analysis. The R package is an easy and more efficient way to integrate data into databases with similar tags. However, it discards the uncommon columns and merges the data with similar tags. The methodology for data integration using R can be found in Appendix B.
This study uses Biblioshiny and Excel to integrate the data from all seven databases. Biblioshiny is a web-based application embedded in the bibliometric package [40]. The functionality of Bibliometric is combined with the web interface using the Shiny packaged environment. The advantage of the Biblioshiny is that it allows non-coders to use the Bibliometric package. The data were imported from all databases to Biblioshiny and exported to Excel one by one. The format of the data can be found in Table 1. A step-by-step guide on how to merge the data exported from Biblioshiny and Perish and Publish (for GS) using Excel is provided in Appendix C.
2.3. Data Cleaning
Data cleaning is a necessary process to remove irrelevant and duplicate articles. In data integration, all the raw data were integrated without considering duplicate articles. The duplicate criteria were set to author, year, and title. These criteria ensured that different papers with the same title were not removed. Using R is just a line of code to remove duplicates, but it deletes all uncommon columns, resulting in data loss. In Excel, the data were cleaned using the following steps.
Remove any spaces in the merged file in the Author “AU” column.
Replace the Empty values for “SR” and “SR full” columns as Nil for GS Data.
Sort the data using the “PY” column in Excel and remove any documents before 2012 and after 2022 (there may be some early access articles).
Fully automated duplicate detection and merging are challenging and almost impossible, at least if accuracy/precision is valued. While there are ways to match records 1 to 1, such as with a DOI, different databases can have different degrees of completeness for items such as author names, etc. Human decision-making will always need to be involved in the selection and merging process. This is because of similar records, except one has information that the other does not. Some records could have different information for the same field but are otherwise identical. Therefore, the duplicates are removed using “TI”, AU and PY. The “Remove Duplicates” features in Excel (In the Data Tab) are used. This removed 668 using author, documents title and publication year. This will delete only those documents with the same data in all fields, such as Authors, title, and year but will not delete all duplicates. Furthermore, the TI and URL were used to remove the remaining duplicates.
To check if all the duplicates are removed, the Conditional Formatting (in the Home Tab), Highlight Cell rules -> Duplicate values are used. This will highlight all the duplicated titles. These duplicates then need to be merged. It is essential to ensure that these duplicates are not deleted but merged. The potential problem is merging multiple types of items, for example, the same article in a journal and a book chapter. Users need to change the type of one or more items into identical types and then merge the item to remove the duplicates. This is a time-consuming process, but it would make sure that the data are properly cleaned. In this study, the highlighted documents were compared against other available tags, such as year, type, etc., and eliminated accordingly. The duplicated function does not delete documents where author names are in a different order or where long names are used. These documents need to be removed manually. A total of 327 documents were removed.
Save the cleaned data in xlsx format.
3. Results and Discussion
3.1. Descriptive Statistics
A total of 5304 articles (including books, journals and conference papers) were used for bibliometric analysis. These documents were collected from 2365 different sources published between 2012 and 2022 (July 2022). The total number of authors is 14,488, according to the statistics provided by Biblioshiny [41]. An overview of the data used for bibliometric analysis can be found in Table 2.
Table 2.
Overview of the final dataset used for bibliometric analysis.
| Description | Results |
|---|---|
| Timespan | 2012:2022 (July 2022) |
| Sources (Journals, Books, etc.) | 2365 |
| Documents | 5304 |
| Annual Growth Rate % | 40.92 |
| Document Average Age | 2.2 |
| Average citations per doc | 6.57 |
| Keywords Plus (ID) | 7796 |
| Author’s Keywords (DE) | 9527 |
| Authors | 14,404 |
| Authors of single-authored docs | 381 |
| Single-authored docs | 439 |
| Co-Authors per Doc | 4.06 |
| International co-authorships % | 14.4 |
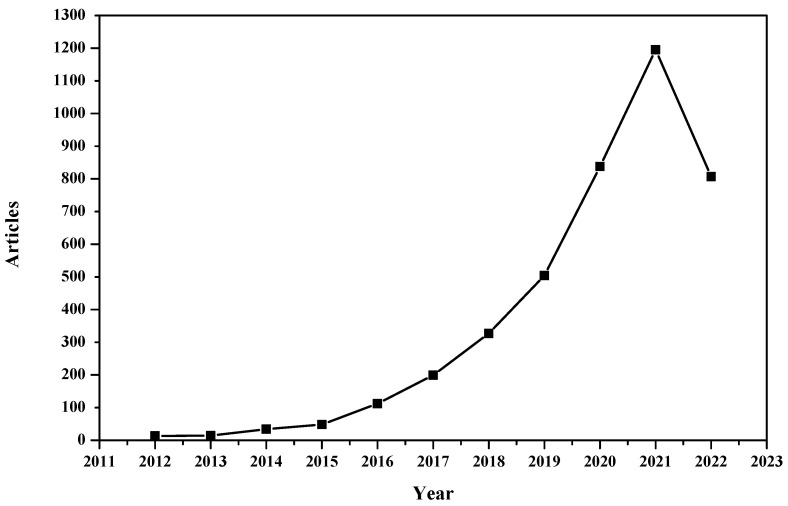
The annual scientific production of articles can be found in Figure 1 and Table 3. The figure shows the compound annual growth rate that shows the geometric progression ratio over a time span. It can be observed that IoMT research is growing exponentially. It is essential to mention that the number of articles for 2022 is until July 2022 (data retrieval time).
Figure 1.
Annual Scientific Production.
Table 3.
Average Citation Per Year, TC: total citations.
| Year | No of Articles | Mean TC per Art | Mean TC per Year | Citable Years |
|---|---|---|---|---|
| 2012 | 13 | 0.00 | 0.00 | 10 |
| 2013 | 14 | 0.21 | 0.02 | 9 |
| 2014 | 34 | 0.53 | 0.07 | 8 |
| 2015 | 48 | 2.25 | 0.32 | 7 |
| 2016 | 112 | 3.43 | 0.57 | 6 |
| 2017 | 199 | 4.78 | 0.96 | 5 |
| 2018 | 327 | 24.80 | 6.20 | 4 |
| 2019 | 504 | 11.53 | 3.84 | 3 |
| 2020 | 838 | 14.80 | 7.40 | 2 |
| 2021 | 1195 | 0.38 | 0.38 | 1 |
| 2022 (July) | 807 | 0.00 | NA | 0 |
The following table shows the annual production of articles, mean total citations per article, mean total citations per year and citation years.
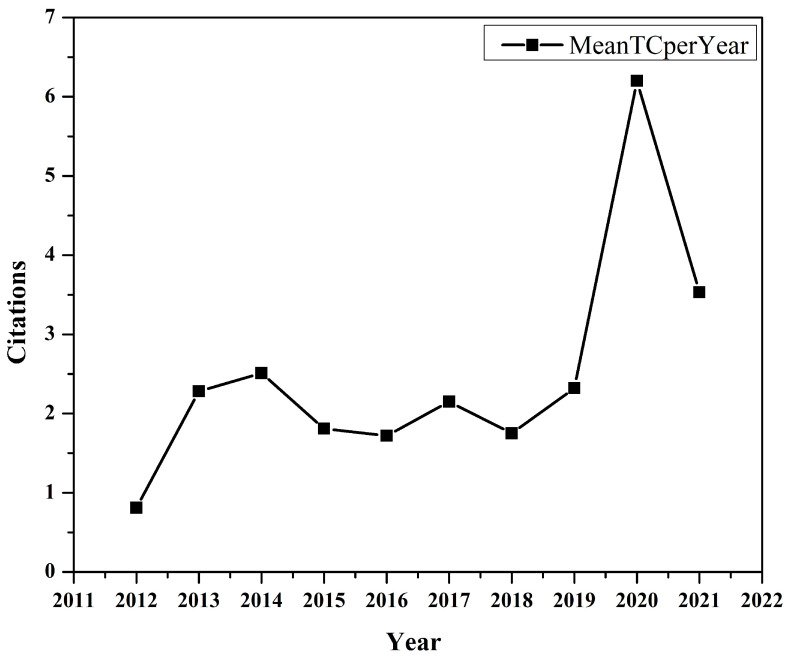
The citation graph shown in Figure 2 indicates each year’s average paper citation in the dataset. In our collection, one or more articles published in 2020 got the highest number of citations per year. The graph shows that average citations were slightly higher in 2013 and 2014 compared to 1015-1018. A significant increase in the number of citations can be seen in 2020 and 2021, which shows that IoMT is an emerging topic for research.
Figure 2.
Average Citation Per Year.
3.2. Most Relevant Sources
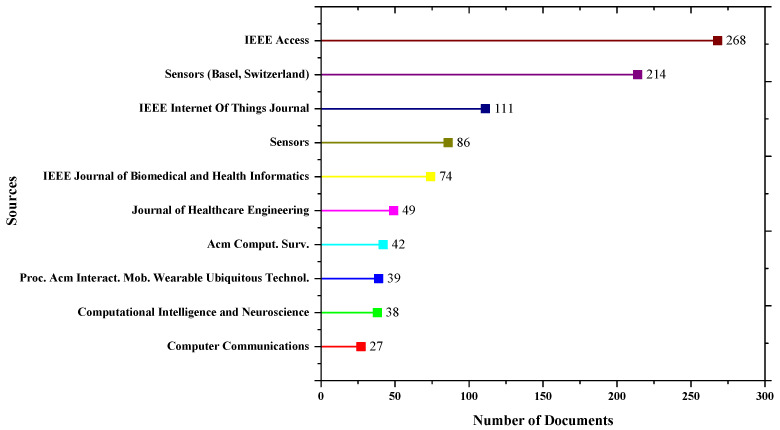
A source is a journal, conference, proceeding or book published in one or more sources in the bibliographic collection. A total of 2365 sources published research related to IoMT from 2012 to July 2022. More sources are due to GS data as GS search contains data from all sources, including presentations, white papers, etc. This also indicates that many sources are publishing IoMT-related research articles. The top 10 sources publishing IoMT research are shown in Figure 3 and Table 4. The figure shows the number of documents published in each source. The open access IEEE journal IEEE access has published 268 documents, followed by the Sensors journal.
Figure 3.
The Top 10 Most Relevant Sources publishing IoMT articles.
Table 4.
Top 10 Journals with h, g and m index as well as total citation counts based on all seven databases.
| Element | h_index | g_index | m_index | TC |
|---|---|---|---|---|
| IEEE Access | 29 | 47 | 4.143 | 2778 |
| IEEE Internet Of Things Journal | 22 | 37 | 3.667 | 1480 |
| Future Generation Computer Systems | 17 | 25 | 3.4 | 634 |
| Computer Communications | 11 | 20 | 2.75 | 431 |
| Sensors | 11 | 20 | 1.833 | 508 |
| Sensors (Switzerland) | 10 | 14 | 1.111 | 367 |
| Electronics | 8 | 15 | 2.667 | 245 |
| IEEE Sensors Journal | 8 | 19 | 0.727 | 465 |
| IEEE Transaction on Consumer Electronics | 8 | 10 | 1.6 | 181 |
| IEEE Journal of Biomedical and Health Informatics | 7 | 13 - | 1.167 | 170 |
Table 4 shows the h, g and m indexes for the top ten sources The Hirsch index (h-index) is the number of published articles by an author or journal (in this case), each of which has been cited at least h times in other articles. Let f be the function that assigns each publication i its citation count, and let f be sorted in decreasing order. The h-index is therefore expressed as [42]:
| (1) |
The g-index, on the other hand, is an improvement to the h-index that measures the global citation performance of a set of articles. The set of articles is ranked in decreasing order of received citations. The g-index shows the most significant number that the top g articles received at least g citations.
| (2) |
The m-index is the ratio of h and n and can be calculated as:
| (3) |
where n is the number of years since the first publication of an author or a journal.
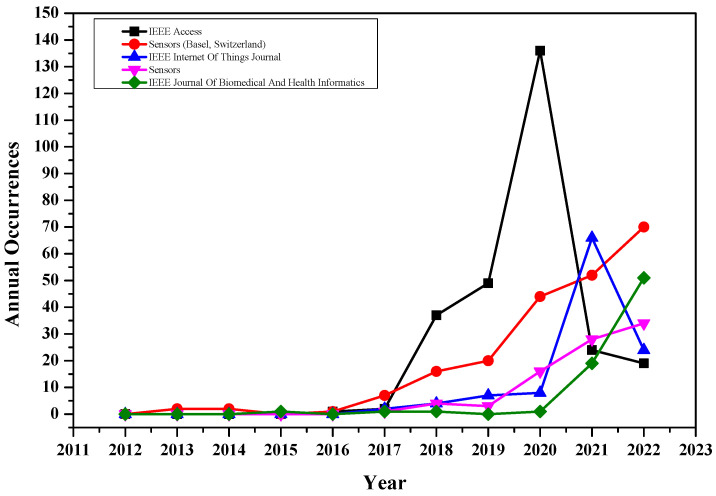
Table 4 also shows the total citations for each source. Articles published in IEEE access are the most cited, followed by the IEEE Internet of Things journal. The data for total publications show that Sensors (MDPI) has been published more than twice compared to the IEEE Internet of Things journal. However, the citation for IEEE Internet of Things journal is significantly higher than Sensor’s journal. Contrarily, open-access journals are publishing more articles compared to subscription-based journals. The annual publication occurrences for the top five journals can be found in Figure 4. The IEEE access has published more articles in the past five years, followed by the Sensors (MDPI) Journal.
Figure 4.
The number of publications per year.
3.3. Influential Authors, Their Affiliations and Countries
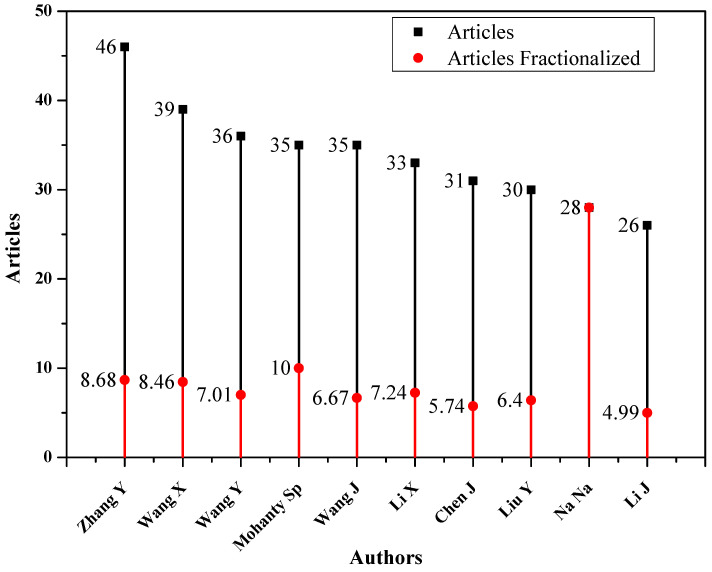
Knowing about the relevant groups and top authors is of utmost importance, especially for early career researchers. There are many ways to follow the relevant authors and get updates on their new research output. The GS provides email notifications of new articles for all the following authors. Another way is to follow the authors on various social platforms, such as ResearchGate or LinkedIn. The most relevant and influential authors regarding IoMT research can be found in Figure 5. The figure shows the total articles (denoted by black lines) and fractionalised articles (indicated by red lines).
Figure 5.
Most relevant and influential authors for IoMT research.
The fractional authorship quantifies an author’s contributions to a published set of articles, assuming all co-authors contributed to each document equally. The fractional frequency is calculated as
| (4) |
where denotes a set of articles co-authored by an author j, and h is the document included in .
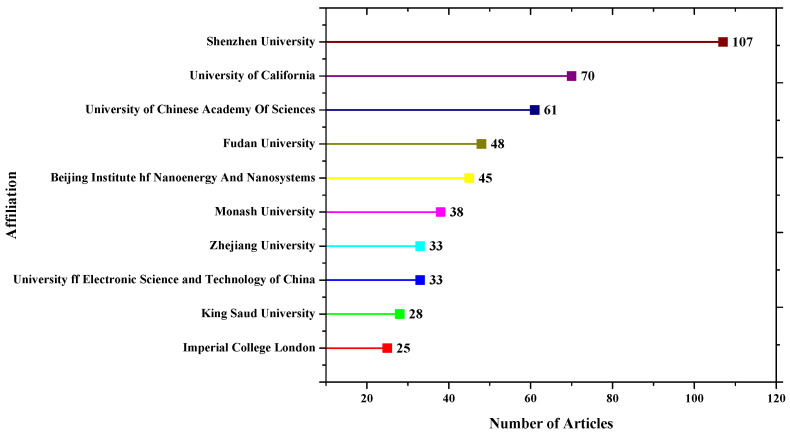
In terms of most relevant affiliations based on the corresponding authors of articles, Shenzhen University has the most articles, followed by King Saud University, as shown in Figure 6.
Figure 6.
Most relevant affiliation.
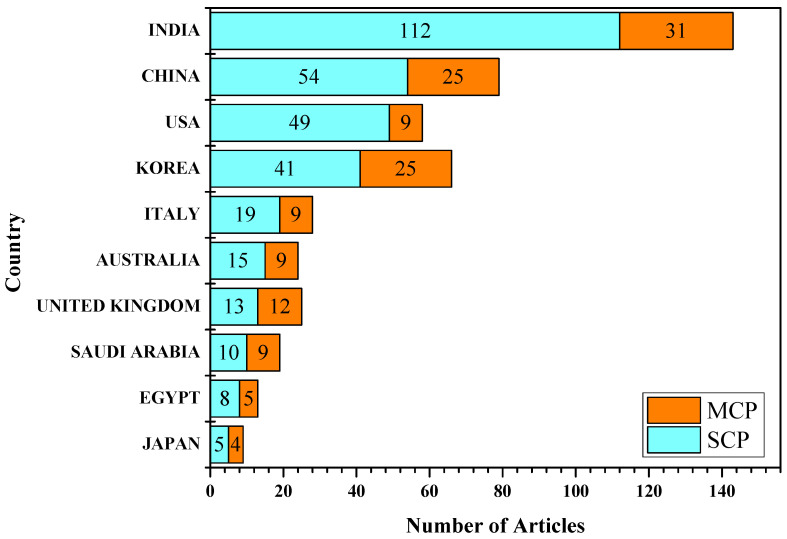
The number of publications where each article is assigned to a specific country based on the affiliation of the accompanying author is shown in Figure 7. In this instance, the overall number of articles correlates to the frequency per country. In addition, this analysis determines the fraction of publications in which at least one author is affiliated with a country other than that of the corresponding author. The index is known as Multiple Country Publications (MCP).
Figure 7.
Number of articles based on Corresponding author, MCP: Multiple Countries Publications, SCP: Single Country Publications.
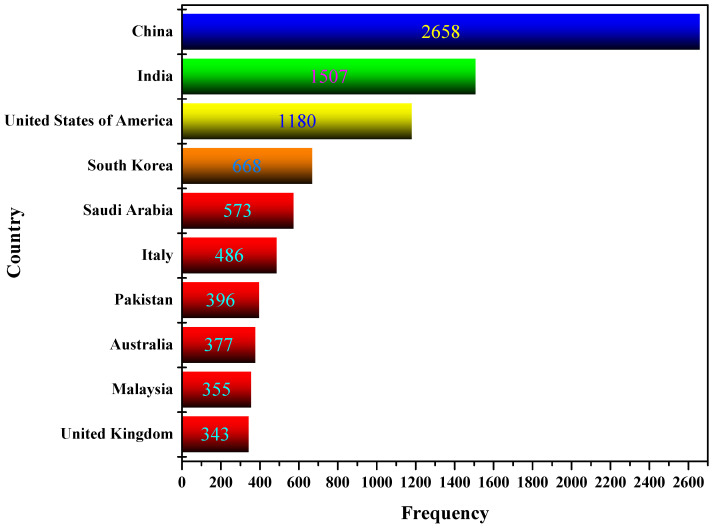
Country Scientific Production quantifies the author’s appearances by country affiliations. This means that if an article contains three authors from the United States, Spain, and Italy, each country’s counter will increase by one. Therefore, each article will be counted as many times as there are authors (in the example above, three times). Consequently, the sum of the production indicator surpasses the total number of articles included in the dataset used for this study. As shown in Figure 8, China has produced more articles, followed by India and the USA.
Figure 8.
Scientific production by country.
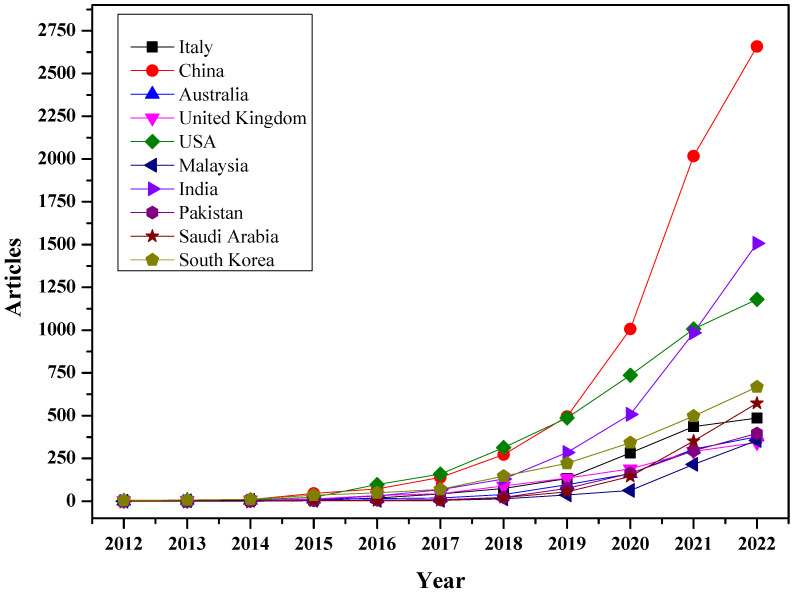
There is a direct relationship between total scientific production and countries’ production over time. Figure 9 shows the production of the top ten countries over time. It can be observed that the average production of countries was below 100 until 2016. A significant increase can be seen after 2017, especially in China, India, and the USA.
Figure 9.
Production of top ten countries over time.
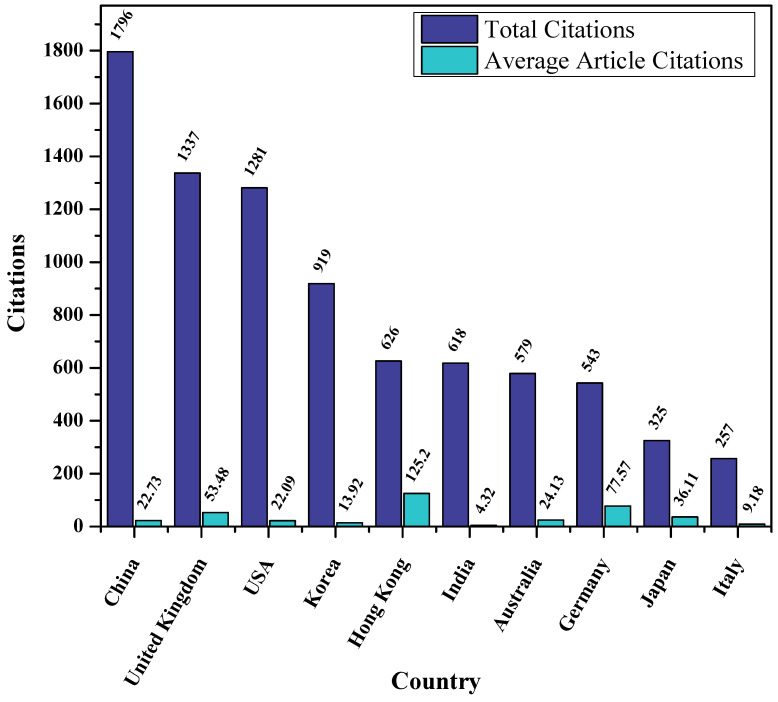
Furthermore, a citation is used to describe the quality of the publication. As shown in Figure 10, China is the most cited country, with 1796 and 22.73 total and average citations, respectively. It is interesting to see that the United Kingdom follow China with 1337 and 53.48 total and average citations, though having fewer articles than all other top ten countries.
Figure 10.
Total and Average articles citations of different countries.
3.4. Keywords Analysis
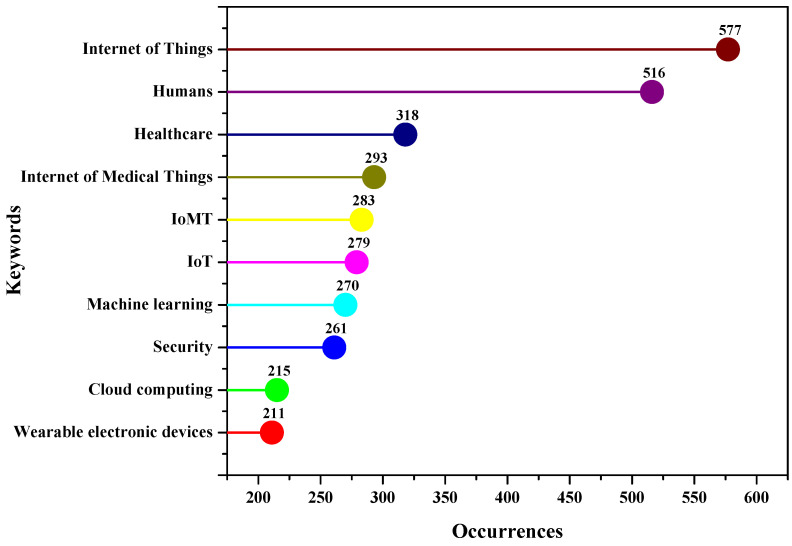
Keywords, often known as search terms, are the words entered into the database’s search box to retrieve relevant documents. They represent the central ideas of any research topic and are the daily terms used to describe it. It may be difficult to locate the required documents without the proper keywords. Author keywords comprise a list of terms that authors believe best represent their research. The top 10 keywords used in the documents included in the dataset used for this study are shown in Figure 11. It can be noted that “internet of things” is a widely used term as it is the base for IoMT research. This is followed by the keywords “human” and “healthcare”. The terms “internet of medical things” and “IoMT” have been used 293 and 283 times, respectively. These results are also crucial because they represent the search terms used to build up the search string for document retrieval for this study. Author keywords are an effective tool for investigating the knowledge structure of any scientific field.
Figure 11.
Most frequently used keywords in the dataset used for analysis.
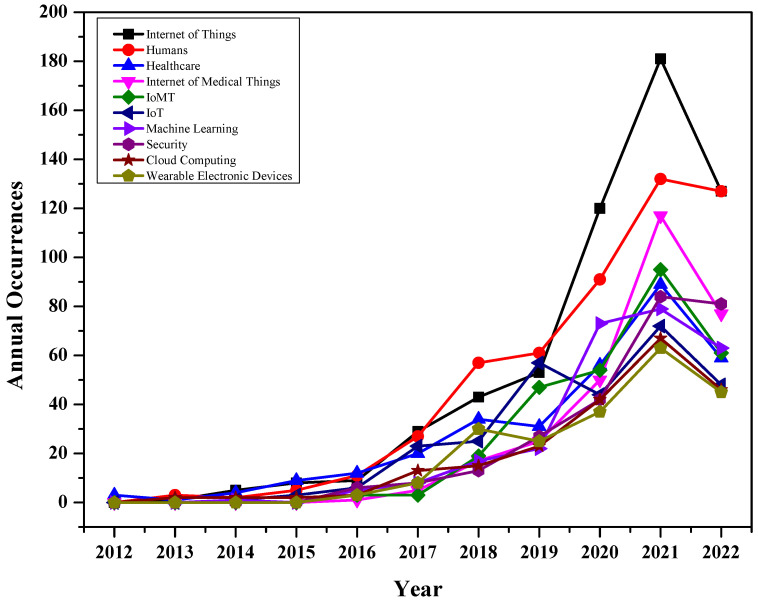
The annual occurrence of keywords reflects the importance of any given topic over time. Figure 12 shows the trending keywords between 2012 and July 2022. As discussed, the term “Internet of Things” is widely used as the base for IoMT research. The figure indicates that all these terms were used less than 20 times from 2012 to 2016. There has been significant growth for all these terms after 2016. The terms “internet of medical things” and “IoMT” have grown exponentially in the last three years, indicating their importance. There are several factors and trends that caused the growth of IoMT market. These include the technological advancement in the healthcare sector in recent years. The growing partnership between university and healthcare sectors, as well as end-users, leads to the adaption of IoMT-based products. The significant growth in the past two years is due to COVID-19, which has had a positive impact on IoMT demand across all regions [43].
Figure 12.
Annual Occurrences of author’s keywords.
3.5. Knowledge Synthesis
For various reasons, drawing a big picture of scientific knowledge has always been desirable. Science mapping attempts to find representations of intellectual connections within the dynamically changing scientific knowledge system [44]. In simple words, science mapping aims to find scientific research’s structural and dynamic aspects using knowledge structure.
Science mapping allows users to investigate scientific knowledge from a statistical point of view.
3.5.1. Conceptual Structure
The conceptual structure aims to target the main themes and trends. The co-occurrence network is created based on the Walktrap algorithm [45], and association is used as the normalisation method shown in Figure 13. The words that appear together in a document are related to a network. The conceptual structure is used to understand different topics of a research field and the associated issues. It also highlights the evolution of study over time. The Co-occurrence network in Figure 13 shows the evolution of the IoMT research. Each network node represents a keyword or study topic, and its size is proportional to its degree. It can be seen that there were a few keywords centred around “humans” with “algorithms”, “wearable electronic devices”, “wireless technology”, and “delivery of healthcare”. The second cluster is based on the Internet of Things, including “machine learning” and “deep learning”, “blockchain” and “cloud computing”, and “security” and “privacy” issues. Notably, “Internet of Things” is of key importance in this cluster due to its role as a network connector.
Figure 13.
Co-occurrence Network.
The third network merges the previous two and focuses on the Internet of Things for medical or healthcare. This network is more complex and dense, with a greater number of nodes and links, which suggests the diversity and increase of research topics. The six largest nodes are “healthcare”, “medical services”, “IoT”, “IoMT”, and “security”. The fact that the degree of “security” is in between the “healthcare” and “internet of medical things” indicates that security is a major issue with IoMT and is therefore receiving more recognition from scholars.
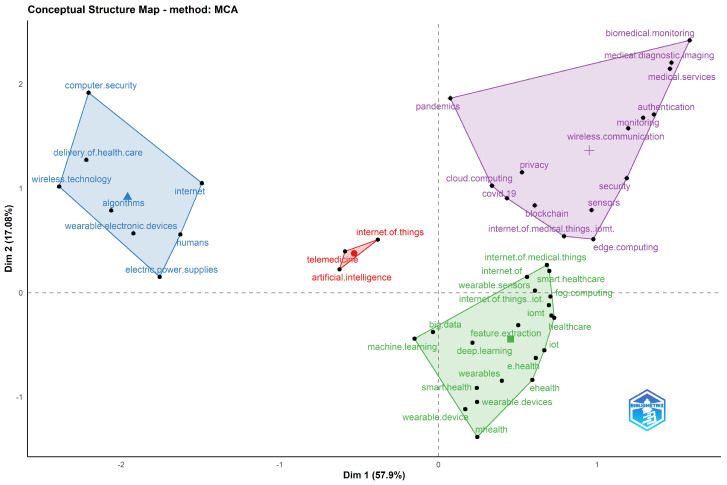
To understand the subfields of a research area, factorial analysis is used. This is a data reduction technique, and different dimensional reduction techniques could be used, such as corresponding analysis, multiple corresponding analysis (MCA), and multidimensional scaling. The keywords are divided into four distinct areas highlighted in various colours. The proximity between words corresponds to the shared substance. These shared substances are created based on the keywords that are close or distant from each other. Keywords are close to each other only if many documents treat them together and vice versa. The factorial analysis based on MCA can be found in Figure 14. Each colour represents a cluster of words for a specific topic or subfield.
Figure 14.
Factorial Analysis using the Biblioshiny package. Clusters are identified by hierarchical clustering.
The factorial analysis identifies four dominating macro clusters in the chosen research subject. The first cluster (top left) consists of paper targeting algorithms, wireless technology, and the delivery of healthcare and wearable electronics devices. The second cluster (centre) brings together the internet of things, telemedicine and artificial intelligence. Cluster three (top right) and cluster four (bottom right) are the most dominant clusters and are linked together. Cluster three represents their search themes of remote monitoring of patients and privacy and security issues. The fourth cluster targets the use of wearable and smart health devices and the use of the machine and deep learning techniques for feature extraction.
3.5.2. Social Structure
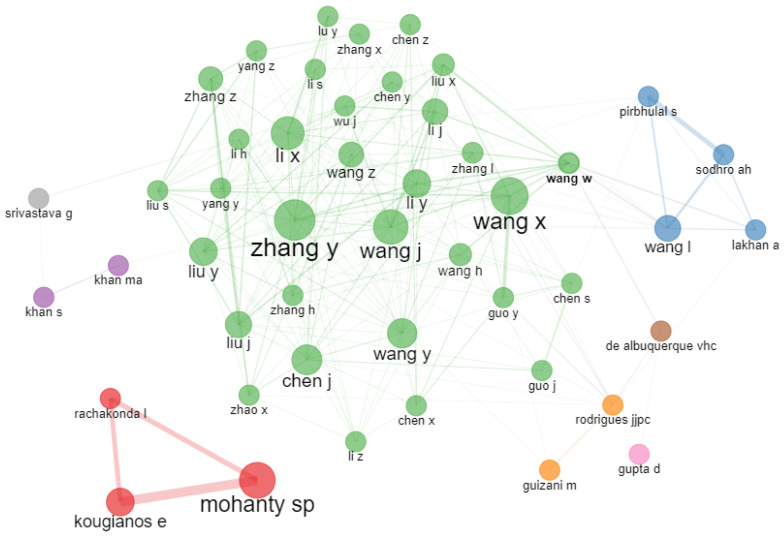
The social structure shows the relationship between different research entities, including authors or institutions. The most common form of social structure is the co-authorship network [46]. It is used to discover a regular and influential group of authors and relevant institutions in any research field. The co-authorship network for IoMT-related research is depicted in Figure 15.
Figure 15.
Co-authorship network using the bibliometric R package.
The figure shows the clusters of authors that collaborate for the possibility of discovering new knowledge. Only a single big cluster can be seen in the network, which indicates that collaborations need to be increased to combine many types of knowledge and abilities to solve complicated health problems using IoMT.
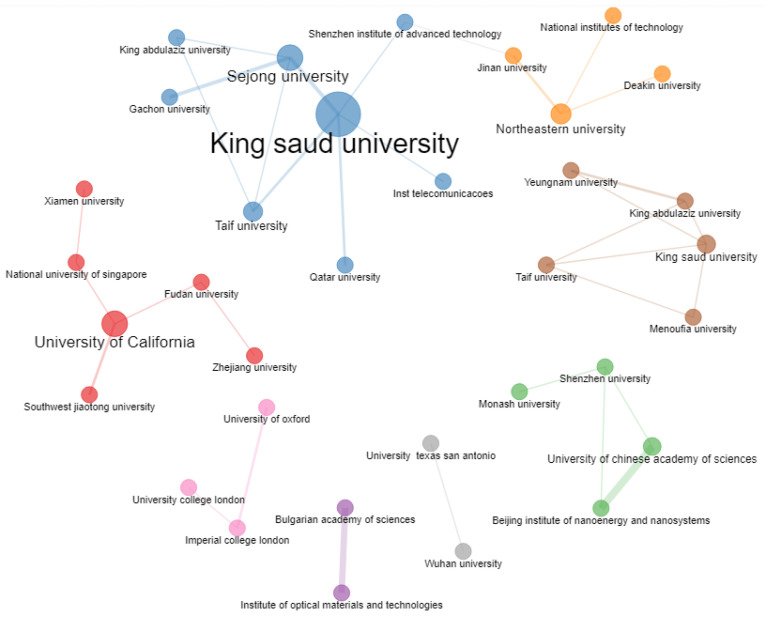
Research collaboration is an essential aspect of any research field nowadays. Figure 16 shows a collaboration network of different universities. There are eight different clusters in the network based on a minimum of two collaborating universities. The network shows that the research collaboration is limited to countries located in a specific region. It can also be seen that most of the China universities are collaborating throughout the world. The size of the bubble in the network shows the extent of collaboration. For example, Kind Saud University of Saudi Arabia collaborates with five other universities.
Figure 16.
Collaboration network of different universities for IoMT research.
Based on the scientific collaboration among different institutions, it can be observed that collaboration within the same country/region is relatively high compared to those from different institutions and countries/regions.
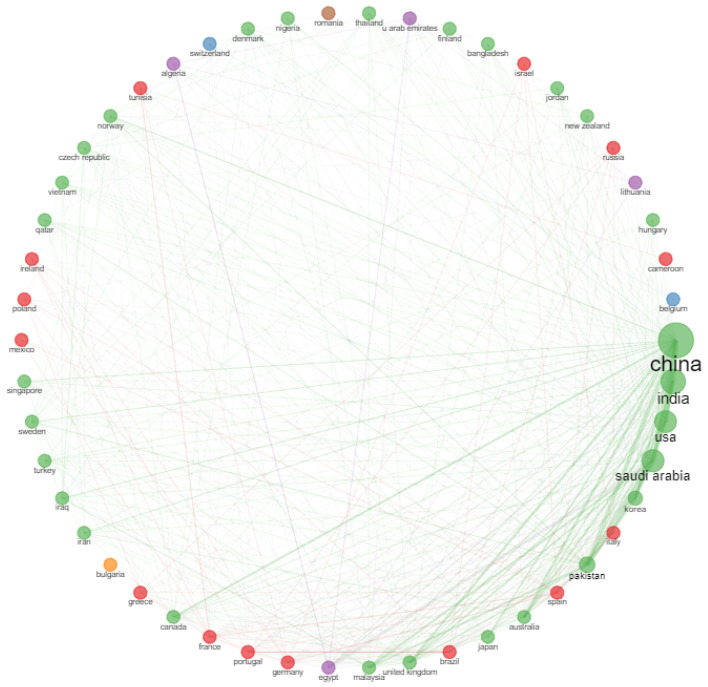
The collaboration network for different countries given in Figure 17 shows that China is the leading country in collaboration for IoMT research. This is followed by India, Saudi Arabia and the USA.
Figure 17.
Collaboration network of different countries for IoMT research.
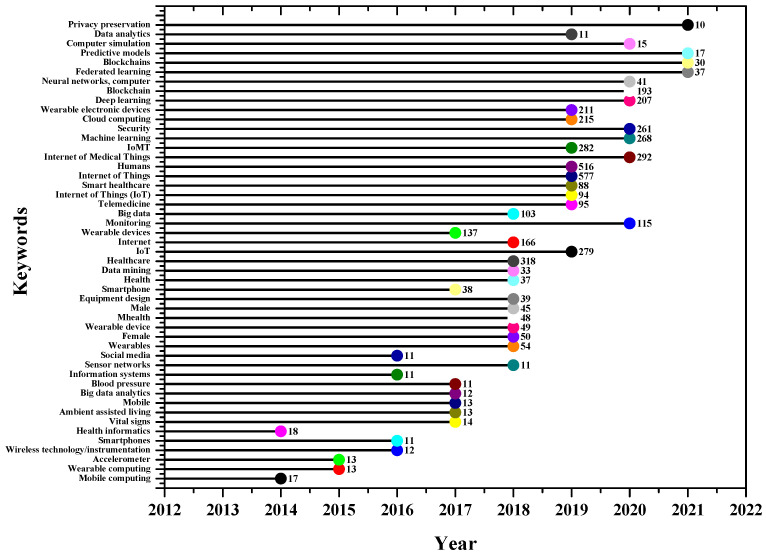
The bibliometric analysis depicted research trends of IoMT-related research: (1) the growth rate of IoMT-related publications has grown rapidly over the past few years, and the rate has shown a trend of continuous growth; (2) high and middle-income countries are the main force of healthcare–related IoT research; (3) the majority of IoMT research was focused on activity recognition, monitoring, wearable devices, self-tracking, and mobile health; (4) data analytics, privacy, AI and blockchain, cloud, and edge computing are some of the recent trends in the IoMT related research as shown in Figure 18. For trending topics, the keyword count per year criteria is used. A minimum value of 10 was used to retrieve the documents where specific keywords were used.
Figure 18.
The trending topics; Minimum count was set to 10 each year.
The figure shows that privacy preservation, data analysis, blockchain, federated learning, and neural networks are trending topics in 2021 and 2022. This is not surprising, as the data obtained from the IoMT need to be processed using different machine learning and deep learning techniques. The keyword “privacy preservation” indicates the fact that privacy issues are currently being investigated together with the use of blockchain and cloud computing. The figure also indicates that IoMT became a hot topic of research in 2019 and 2020.
IoMT research is expanding rapidly, and possible applications have been demonstrated in various home health and patient-centred care settings. However, there are currently only a few instances where such strategies have been successfully implemented. Future IoMT-related research should focus on bridging the gap between healthcare-related IoMT research and clinical applications.
4. Open Research Areas
4.1. IoT for the Personalised Needs of the People
Although various IoMT devices are being developed, ranging from health monitoring and tracking, these IoMT devices and systems need to be tailored to the personalised needs of the individual. For example, IoMT-based tracking and monitoring systems for care homes should consider old age people [47]. These people do not prefer wearable devices; instead, unobtrusive devices must be used to get all the essential data.
4.2. Involvement of Real Users in the Development Process
A crucial factor that needs to be considered for any system design and development is the involvement of end users at the earliest stage of the project. The requirements must be collected from the end-users of the system. Furthermore, these users must be involved in the development throughout the project life cycle. Their feedback needs to be accommodated to enhance the user experience.
4.3. Cost-Effective Solutions Especially for the Less Developed Countries
Most studies do not consider the cost associated with these IoMT projects. For real-world and commercial IoMT projects, the components, implementation, and maintenance costs must be considered, especially for less developed countries. Moreover, research in this area is expected to increase in the coming years. Therefore, there is a need for enhanced collaboration between developed and developing countries.
4.4. The Need for Case Studies
Conceptualisations dominate most of the highly referenced and co-cited works reviewed in this study. A few applications of IoMT contain case studies, which would provide a more comprehensive understanding of this technology. Therefore, future research should also focus on case studies to better understand how IoMT originates, how it is used, and the benefits and problems associated with it.
4.5. Security and Privacy Issues
Compared to the Internet of Things, the IoMT project required more security, privacy, and interoperability [31]. The security dimension encompasses confidentiality, access control, data protection, and encryption concerns. These topics must be further explored with application-specific issues [48]. The privacy of health data is an important area of research due to its impact on the success of IoMT adoption. Failure to protect data confidentiality and integrity and manage risks associated with unauthorised access may result in the inability to realise the benefits of IoMT [49].
5. Limitations of the Study
For this study, the authors tried their best to search comprehensively for all the material related to the topic under discussion. However, this study still has many limitations.
Relevant studies are only searched for the period 2012–2022.
Although seven major databases are used for searching relevant studies, there are still many un-indexed journals and publications from such journals might have been missed.
No search string can be 100% perfect; therefore, false positive and false negative results are always possible.
Only English language papers are considered for the study, which may have biased results towards English-speaking countries to some extent.
6. Conclusions
This paper presents an integrated methodology to perform bibliometric analysis. The proposed methodology is discussed step by step. The method integrates data from seven major databases using different tools to avoid manual work. Furthermore, the proposed methodology could be used to conduct all-inclusive bibliometric studies on any topic. The proposed methodology is evaluated by performing a bibliometric analysis of the Internet of Medical Things. The bibliometric analysis provides a detailed review of IoMT-related research for the last ten years. This paper also highlights the open research area in the IoMT research that needs further investigation. This study’s findings and recommendations for further research will benefit academics, policymakers, and healthcare practitioners who seek to collaborate in these fields in the future.
The proposed methodology does not require any coding skills. The user does not have to be an expert in R Studio usage beyond the Bibliometrix package required for bibliometric analyses. Additionally, it does not involve the use of shareware software, making it potentially accessible to all academics, including those from developing countries. The proposed methodology is, however, susceptible to human error, as is the case with every manual step of the proposed method. However, the potential advantages of being user-friendly and having the ability to analyse seven major databases outweigh this limitation. A major concern that needs further investigation is how to handle citation metadata when integrating datasets from multiple sources. These databases, such as Scopus and WoS, are closed systems that only count citations from publications within the same database. The number of citations for the same record may vary depending on the data source. This paper considered papers with the highest number of citations while eliminating duplicates. It is further recommended that researchers use the cross-validation procedure to determine the provenance of a database.
Acknowledgments
The authors would like to acknowledge the European Regional Development Fund (ERDF) and the Welsh Government for funding this study. Our gratitude to all members of the Centre of Excellence in Mobile and Emerging Technologies (CEMET), the University of South Wales, for their contribution in various capacities in this study.
Abbreviations
The following abbreviations are used in this manuscript:
| IoMT | Internet of Medical Things |
| IoT | Internet of Things |
| WoS | Web of Science |
| IoHT | Internet of Health Things |
| AU | Author |
| TI | Title |
| PY | Publication Year |
| TC | Total Citations |
| GS | Google Scholar |
| MCP | Multiple Country Publications |
| SCP | Single Country Publications |
| MCA | Multiple Corresponding Analysis |
Appendix A. Advanced Google Scholar Search
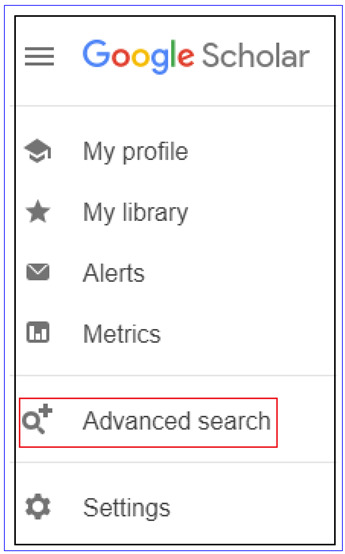
To access the advanced search option on Google Scholar, click on the three-line icon in the upper left corner of the search page.
Click on Advanced search.
From the Advanced search pop-up box, use “in the title of the article” to limit the search to the document title only.
Appendix B. Integrating Data from Multiple Sources Using R
library (RefManageR)
> scopus = convert2df(file. choose(), dbsource = “scopus”, format = “bibtex”)
> wos = convert2df(file. choose(), dbsource = “wos”, format = “bibtex”)
> pubmed = convert2df(file. choose(), dbsource = “pubmed”, format = “txt”)
> Coverteddata = as.data.frame(mergedSources)
For IEEE > IEEE = convert2df(file.choose(), dbsource = “wos”, format = “bibtex”)
Science Direct: > ScienceDirect = convert2df(file.choose(), dbsource = “wos”, format = “bibtex”)
> > mergedSources = mergeDbSources(ACM, IEEE, pubmed, ScienceDirect
,scopus, wos, remove.duplicated = TRUE)
> writexlsx(Coverteddata, ”Path..”)
Appendix C. Integrating Data from Multiple Sources Using Excel
Open a new document
Click on data and then Get data, and then “Launch Power Query Editor”.
On the top right, click on ‘New Source’-> file ->Excel Workbook and Open the first file.
Import all the remaining files similarly.
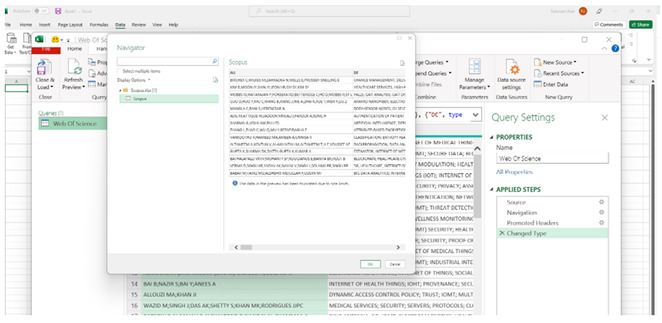
After inserting all the files, select anyone and then click Append Queries -> Append Queries as new, and the following window will appear.
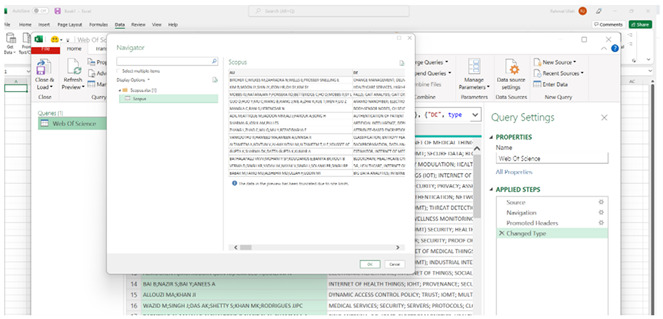
In the new window, select “Three or more tables and add all the sheets to the “Tables to append” window (Hold ctrl to select more than one sheet while adding) and click OK.
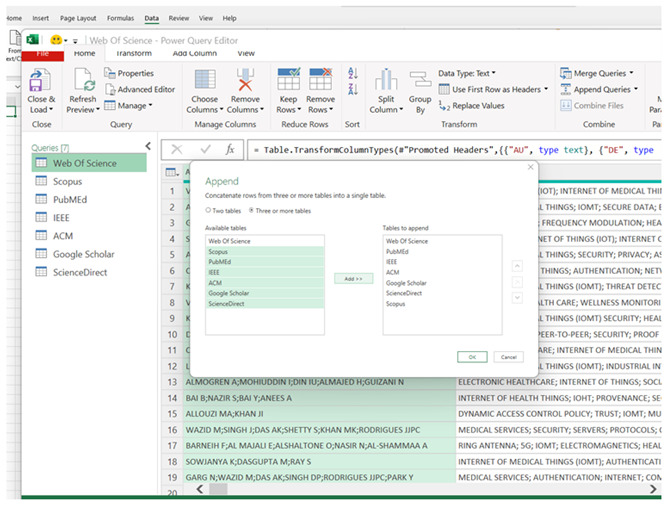
This will append all the sheets together and give them a name such as “Append”. Click on Close and Load, which will load the data from all sheets to a new sheet.
Save the data in .xlsx format.
Author Contributions
Conceptualization, R.U. and I.A.; methodology, R.U. and I.A.; software, R.U.; validation, R.U., I.A. and M.G.G.; formal analysis, R.U.; data curation, R.U.; writing—original draft preparation, R.U. and I.A.; writing—review and editing, R.U., I.A. and M.G.G.; visualization, R.U. and I.A.; supervision, M.G.G.; project administration, M.G.G. All authors have read and agreed to the published version of the manuscript.
Institutional Review Board Statement
Not applicable.
Informed Consent Statement
Not applicable.
Data Availability Statement
The data presented in this study are available on request from the corresponding author.
Conflicts of Interest
The authors declare no conflict of interest.
Funding Statement
This research was funded by the European Regional Development Fund (ERDF) and the Welsh Government.
Footnotes
Disclaimer/Publisher’s Note: The statements, opinions and data contained in all publications are solely those of the individual author(s) and contributor(s) and not of MDPI and/or the editor(s). MDPI and/or the editor(s) disclaim responsibility for any injury to people or property resulting from any ideas, methods, instructions or products referred to in the content.
References
- 1.Genet N., Boerma W.G., Kringos D.S., Bouman A., Francke A.L., Fagerström C., Melchiorre M.G., Greco C., Devillé W. Home care in Europe: A systematic literature review. BMC Health Serv. Res. 2011;11:207. doi: 10.1186/1472-6963-11-207. [DOI] [PMC free article] [PubMed] [Google Scholar]
- 2.Jayaweera M., Perera H., Gunawardana B., Manatunge J. Transmission of COVID-19 virus by droplets and aerosols: A critical review on the unresolved dichotomy. Environ. Res. 2020;188:109819. doi: 10.1016/j.envres.2020.109819. [DOI] [PMC free article] [PubMed] [Google Scholar]
- 3.Seshadri D.R., Davies E.V., Harlow E.R., Hsu J.J., Knighton S.C., Walker T.A., Voos J.E., Drummond C.K. Wearable sensors for COVID-19: A call to action to harness our digital infrastructure for remote patient monitoring and virtual assessments. Front. Digit. Health. 2020;2:8. doi: 10.3389/fdgth.2020.00008. [DOI] [PMC free article] [PubMed] [Google Scholar]
- 4.Wang J., Lim M.K., Wang C., Tseng M.L. The evolution of the Internet of Things (IoT) over the past 20 years. Comput. Ind. Eng. 2021;155:107174. doi: 10.1016/j.cie.2021.107174. [DOI] [Google Scholar]
- 5.Ashfaq Z., Rafay A., Mumtaz R., Zaidi S.M.H., Saleem H., Zaidi S.A.R., Mumtaz S., Haque A. A review of enabling technologies for internet of medical things (IOMT) ecosystem. Ain Shams Eng. J. 2022;13:101660. doi: 10.1016/j.asej.2021.101660. [DOI] [Google Scholar]
- 6.Gupta D., Bhatia M., Kumar A. Resolving data overload and latency issues in multivariate time-series IoMT data for mental health monitoring. IEEE Sens. J. 2021;21:25421–25428. doi: 10.1109/JSEN.2021.3095853. [DOI] [Google Scholar]
- 7.BAMIDIS P.D. Internet of things in health trends through bibliometrics and text mining. Inform. Health Connect. Citiz.-Led Wellness Popul. Health. 2017;235:73. [PubMed] [Google Scholar]
- 8.Choi W., Kim J., Lee S., Park E. Smart home and internet of things: A bibliometric study. J. Clean. Prod. 2021;301:126908. doi: 10.1016/j.jclepro.2021.126908. [DOI] [Google Scholar]
- 9.Ali R.R.M., Ahmi A., Sudin S. Journal of Physics: Conference Series, Proceedings of the 2nd Joint International Conference on Emerging Computing Technology and Sports (JICETS) 2019, Bandung, Indonesia, 25–27 November 2019. Volume 1529. IOP Publishing; Bristol, UK: 2020. Examining the trend of the research on the internet of things (IoT): A bibliometric analysis of the journal articles as indexed in the Scopus database; p. 022075. [Google Scholar]
- 10.Sadoughi F., Behmanesh A., Sayfouri N. Internet of things in medicine: A systematic mapping study. J. Biomed. Inform. 2020;103:103383. doi: 10.1016/j.jbi.2020.103383. [DOI] [PubMed] [Google Scholar]
- 11.Aagja J., Shome S., Chandra A. A Bibliometric Analysis of Digital Health & Mobile Health Related Global Research Publications. Hosp. Top. 2022:1–7. doi: 10.1080/00185868.2022.2060155. [DOI] [PubMed] [Google Scholar]
- 12.Moral-Muñoz J.A., Herrera-Viedma E., Santisteban-Espejo A., Cobo M.J. Software tools for conducting bibliometric analysis in science: An up-to-date review. Prof. Inf. 2020;29:1–20. doi: 10.3145/epi.2020.ene.03. [DOI] [Google Scholar]
- 13.Yu J., Yu J., Li S., Wang A., Wang Y. Bibliometric analysis on gene editing using Bibliometrix an R Package; Proceedings of the CIBDA 2022, 3rd International Conference on Computer Information and Big Data Applications, VDE; Wuhan, China. 25–27 March 2022; pp. 1–6. [Google Scholar]
- 14.Shamsuddin S.N., Ismail N., Roslan N.F. A bibliometric analysis of insurance literacy using bibliometrix an R package. AIP Conf. Proc. 2022;2472:050023. [Google Scholar]
- 15.Wang J., Zhang S. Cross-Cultural Learning: A Visualized Bibliometric Analysis Based on Bibliometrix from 2002 to 2021. Mob. Inf. Syst. 2022;2022:7478223. doi: 10.1155/2022/7478223. [DOI] [Google Scholar]
- 16.Ejaz H., Zeeshan H.M., Ahmad F., Bukhari S.N.A., Anwar N., Alanazi A., Sadiq A., Junaid K., Atif M., Abosalif K.O.A., et al. Bibliometric Analysis of Publications on the Omicron Variant from 2020 to 2022 in the Scopus Database Using R and VOSviewer. Int. J. Environ. Res. Public Health. 2022;19:12407. doi: 10.3390/ijerph191912407. [DOI] [PMC free article] [PubMed] [Google Scholar]
- 17.Ranjbari M., Esfandabadi Z.S., Shevchenko T., Chassagnon-Haned N., Peng W., Tabatabaei M., Aghbashlo M. Mapping healthcare waste management research: Past evolution, current challenges, and future perspectives towards a circular economy transition. J. Hazard. Mater. 2022;422:126724. doi: 10.1016/j.jhazmat.2021.126724. [DOI] [PubMed] [Google Scholar]
- 18.Al Husaeni D.F., Nandiyanto A.B.D. Bibliometric using Vosviewer with Publish or Perish (using google scholar data): From step-by-step processing for users to the practical examples in the analysis of digital learning articles in pre and post Covid-19 pandemic. ASEAN J. Sci. Eng. 2022;2:19–46. doi: 10.17509/ajse.v2i1.37368. [DOI] [Google Scholar]
- 19.Jusoh M., Muttalib M., Krishnan K., Katimon A. IOP Conference Series: Earth and Environmental Science, Proceedings of the 3rd Asia Pacific Regional Conference on Food Security (ARCoFS 2021), Kelantan, Malaysia, 9 March 2021. Volume 756. IOP Publishing; Bristol, UK: 2021. An overview of the internet of things (IoT) and irrigation approach through bibliometric analysis; p. 012041. [Google Scholar]
- 20.Ahmi A., Elbardan H., Ali R.H.R.M. Bibliometric analysis of published literature on industry 4.0; Proceedings of the 2019 International Conference on Electronics, Information, and Communication (ICEIC); Auckland, New Zealand. 22–25 January 2019; pp. 1–6. [Google Scholar]
- 21.Shahidan N.H., Latiff A.S.A., Wahab S.A. Communications in Computer and Information Science, Proceedings of the International Conference on Society 5.0, Virtual Event, 22–24 June 2021. Springer; Berlin/Heidelberg, Germany: 2021. Moving Towards Society 5.0: A Bibliometric and Visualization Analysis; pp. 93–104. [Google Scholar]
- 22.Rejeb A., Simske S., Rejeb K., Treiblmaier H., Zailani S. Internet of Things research in supply chain management and logistics: A bibliometric analysis. Internet Things. 2020;12:100318. doi: 10.1016/j.iot.2020.100318. [DOI] [Google Scholar]
- 23.Fetscherin M., Heinrich D. Consumer brand relationships research: A bibliometric citation meta-analysis. J. Bus. Res. 2015;68:380–390. doi: 10.1016/j.jbusres.2014.06.010. [DOI] [Google Scholar]
- 24.Cullen J.G. Educating business students about sustainability: A bibliometric review of current trends and research needs. J. Bus. Ethics. 2017;145:429–439. doi: 10.1007/s10551-015-2838-3. [DOI] [Google Scholar]
- 25.Marvuglia A., Havinga L., Heidrich O., Fonseca J., Gaitani N., Reckien D. Advances and challenges in assessing urban sustainability: An advanced bibliometric review. Renew. Sustain. Energy Rev. 2020;124:109788. doi: 10.1016/j.rser.2020.109788. [DOI] [Google Scholar]
- 26.Asghar I., Egaji O.A., Griffiths M. An overview of the digital solutions for helping people with aphasia through bibliometric analysis. Eneurologicalsci. 2021;22:100311. doi: 10.1016/j.ensci.2021.100311. [DOI] [PMC free article] [PubMed] [Google Scholar]
- 27.Guo Y., Hao Z., Zhao S., Gong J., Yang F. Artificial intelligence in health care: Bibliometric analysis. J. Med. Internet Res. 2020;22:e18228. doi: 10.2196/18228. [DOI] [PMC free article] [PubMed] [Google Scholar]
- 28.Asghar I., Cang S., Yu H. Assistive technology for people with dementia: An overview and bibliometric study. Health Inf. Libr. J. 2017;34:5–19. doi: 10.1111/hir.12173. [DOI] [PubMed] [Google Scholar]
- 29.Fahimnia B., Sarkis J., Davarzani H. Green supply chain management: A review and bibliometric analysis. Int. J. Prod. Econ. 2015;162:101–114. doi: 10.1016/j.ijpe.2015.01.003. [DOI] [Google Scholar]
- 30.Guo Y.M., Huang Z.L., Guo J., Guo X.R., Li H., Liu M.Y., Ezzeddine S., Nkeli M.J. A bibliometric analysis and visualization of blockchain. Future Gener. Comput. Syst. 2021;116:316–332. doi: 10.1016/j.future.2020.10.023. [DOI] [Google Scholar]
- 31.Kamran M., Khan H.U., Nisar W., Farooq M., Rehman S.U. Blockchain and Internet of Things: A bibliometric study. Comput. Electr. Eng. 2020;81:106525. doi: 10.1016/j.compeleceng.2019.106525. [DOI] [Google Scholar]
- 32.Kumar R., Rani S., Awadh M.A. Exploring the Application Sphere of the Internet of Things in Industry 4.0: A Review, Bibliometric and Content Analysis. Sensors. 2022;22:4276. doi: 10.3390/s22114276. [DOI] [PMC free article] [PubMed] [Google Scholar]
- 33.Donthu N., Kumar S., Mukherjee D., Pandey N., Lim W.M. How to conduct a bibliometric analysis: An overview and guidelines. J. Bus. Res. 2021;133:285–296. doi: 10.1016/j.jbusres.2021.04.070. [DOI] [Google Scholar]
- 34.Echchakoui S. Why and how to merge Scopus and Web of Science during bibliometric analysis: The case of sales force literature from 1912 to 2019. J. Mark. Anal. 2020;8:165–184. doi: 10.1057/s41270-020-00081-9. [DOI] [Google Scholar]
- 35.Caputo A., Kargina M. A user-friendly method to merge Scopus and Web of Science data during bibliometric analysis. J. Mark. Anal. 2022;10:82–88. doi: 10.1057/s41270-021-00142-7. [DOI] [Google Scholar]
- 36.Wahyuni H., Vanany I., Ciptomulyono U. Food safety and halal food in the supply chain: Review and bibliometric analysis. J. Ind. Eng. Manag. 2019;12:373–391. doi: 10.3926/jiem.2803. [DOI] [Google Scholar]
- 37.Tutorial: Performing an Advanced Search-ScienceDirect Support Center. [(accessed on 14 December 2022)]. Available online: https://service.elsevier.com/app/answers/detail/a_id/25959/supporthub/sciencedirect/~/tutorial%3A-performing-an-advanced-search/
- 38.Advanced Search. [(accessed on 14 December 2022)]. Available online: https://ieeexplore.ieee.org/Xplorehelp/searching-ieee-xplore/advanced-search.
- 39.Publish or Perish. [(accessed on 15 November 2022)]. Available online: https://harzing.com/resources/publish-or-perish.
- 40.Aria M., Cuccurullo C. bibliometrix: An R-tool for comprehensive science mapping analysis. J. Inf. 2017;11:959–975. doi: 10.1016/j.joi.2017.08.007. [DOI] [Google Scholar]
- 41.Bibliometrix. Biblioshiny. [(accessed on 15 November 2022)]. Available online: https://www.bibliometrix.org/home/index.php/layout/biblioshiny.
- 42.Mazurek J. A modification to Hirsch index allowing comparisons across different scientific fields. arXiv. 20171703.05485 [Google Scholar]
- 43.Jenkins T. Wearable Medical Sensor Devices, Machine and Deep Learning Algorithms, and Internet of Things-based Healthcare Systems in COVID-19 Patient Screening, Diagnosis, Monitoring, and Treatment. Am. J. Med. Res. 2022;9:49–64. [Google Scholar]
- 44.Cobo M.J., López-Herrera A.G., Herrera-Viedma E., Herrera F. Science mapping software tools: Review, analysis, and cooperative study among tools. J. Am. Soc. Inf. Sci. Technol. 2011;62:1382–1402. doi: 10.1002/asi.21525. [DOI] [Google Scholar]
- 45.Pons P., Latapy M. Lecture Notes in Computer Science, Proceedings of the International Symposium on Computer and Information Sciences, Istanbul, Turkey, 26–28 October 2005. Springer; Berlin/Heidelberg, Germany: 2005. Computing communities in large networks using random walks; pp. 284–293. [Google Scholar]
- 46.Sampaio R.B., Fonseca M.V., Zicker F. Co-authorship network analysis in health research: Method and potential use. Health Res. Policy Syst. 2016;14:1–10. doi: 10.1186/s12961-016-0104-5. [DOI] [PMC free article] [PubMed] [Google Scholar]
- 47.Gillani N., Arslan T. Intelligent sensing technologies for the diagnosis, monitoring and therapy of alzheimer’s disease: A systematic review. Sensors. 2021;21:4249. doi: 10.3390/s21124249. [DOI] [PMC free article] [PubMed] [Google Scholar]
- 48.Radanliev P., De Roure D. Epistemological and bibliometric analysis of ethics and shared responsibility—Health policy and IoT systems. Sustainability. 2021;13:8355. doi: 10.3390/su13158355. [DOI] [Google Scholar]
- 49.Hassandoust F., Akhlaghpour S. Health Data Privacy: Research Fronts, Hot Topics and Future Directions. Stud. Health Technol. Inform. 2020;275:167–171. doi: 10.3233/SHTI200716. [DOI] [PubMed] [Google Scholar]
Associated Data
This section collects any data citations, data availability statements, or supplementary materials included in this article.
Data Availability Statement
The data presented in this study are available on request from the corresponding author.


