Abstract
KEGG (https://www.kegg.jp) is a manually curated database resource integrating various biological objects categorized into systems, genomic, chemical and health information. Each object (database entry) is identified by the KEGG identifier (kid), which generally takes the form of a prefix followed by a five-digit number, and can be retrieved by appending /entry/kid in the URL. The KEGG pathway map viewer, the Brite hierarchy viewer and the newly released KEGG genome browser can be launched by appending /pathway/kid, /brite/kid and /genome/kid, respectively, in the URL. Together with an improved annotation procedure for KO (KEGG Orthology) assignment, an increasing number of eukaryotic genomes have been included in KEGG for better representation of organisms in the taxonomic tree. Multiple taxonomy files are generated for classification of KEGG organisms and viruses, and the Brite hierarchy viewer is used for taxonomy mapping, a variant of Brite mapping in the new KEGG Mapper suite. The taxonomy mapping enables analysis of, for example, how functional links of genes in the pathway and physical links of genes on the chromosome are conserved among organism groups.
INTRODUCTION
The KEGG database (1) has been developed as a computer model of biological information systems represented in terms of molecular interaction and reaction networks. In contrast to artificial intelligence and machine learning models, the KEGG model is manually created using human intelligence and capturing knowledge reported in published literature. The KEGG model has the practical benefit of helping to uncover hidden features in large-scale biological data (2), such as cellular and organism-level functions hidden in genome and metagenome sequences. In addition, computerized knowledge embedded in the KEGG model provides the molecular basis for such higher-level functions. It is hoped that this latter aspect will further be improved to enable a better understanding of more fundamental problems, such as how molecular network systems were developed in the cell, coevolved with the genome and transmitted to extant species (3).
When the KEGG database was first released in December 1995, it contained only one complete genome of Haemophilus influenzae (4) and incomplete genomes of a few other species. It now contains over 8400 genomes covering a wide-range of taxonomic groups. Attempts are being made to link many of the KEGG data to taxonomic information using recently developed datasets and tools. Functional links of genes are already represented in KEGG pathway maps and associated pathway modules. Physical links of genes on the chromosome are now better analyzed with the newly developed KEGG genome browser. These links can then be examined with the Brite hierarchy viewer for taxonomic trees, which is a taxonomy browser in KEGG. This paper reports this and other developments in the last 2 years, which are also summarized in the Release notes at the KEGG website (https://www.kegg.jp/kegg/docs/relnote.html).
NEW DEVELOPMENTS IN KEGG
Overview
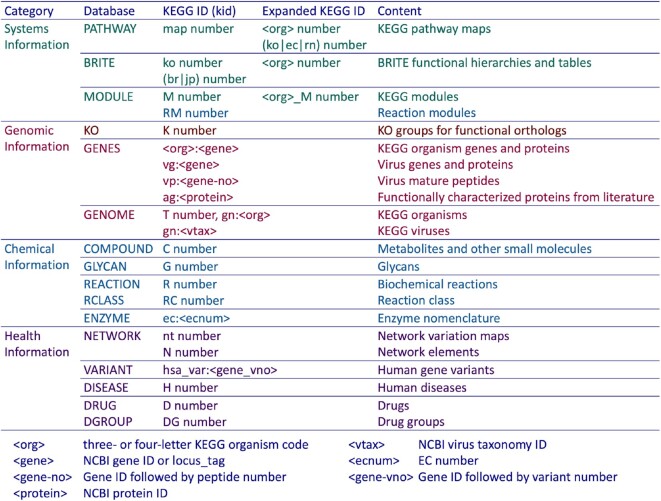
KEGG is an integrated database resource consisting of sixteen manually curated databases in four categories as shown in Figure 1. Because of its high integration KEGG may be viewed as a single resource containing various biological objects: molecular interaction/reaction/relation networks in the systems information category, genes and proteins of cellular organisms and viruses in the genomic information category, chemical compounds and reactions in the chemical information category and human diseases and drugs in the health information category. Each object is identified by the KEGG identifier (kid). The convention of kid naming is the following.
Figure 1.
KEGG is an integrated database containing various biological objects (contents) stored in sixteen databases in four categories. Each object (database entry) is identified by the KEGG identifier (kid) as defined here. Except for GENES and a few other databases, the KEGG identifier takes the form of a prefix followed by a five-digit number. Manually created reference pathway maps, reference Brite hierarchies and reference modules are computationally expanded to organism-specific ones by converting KO identifiers (K numbers) to GENES identifiers in individual organisms (see text).
The basic form of kid is the combination of the database name and the entry name in the form of ‘database:entry’.
The basic form needs to be used for GENES and a few other databases, but for the majority of databases kid can be specified without the database name, for the entry name takes the form of a database-dependent prefix followed by a five-digit number.
The five-digit numbers are uniquely assigned in each database, except for PATHWAY and BRITE where the numbers are uniquely assigned among these two databases.
Each KEGG organism (cellular organism) is given a three- or four-letter KEGG organism code <org>, such as hsa for Homo sapiens.
For PATHWAY, BRITE and MODULE databases, manually created reference entries are computationally expanded to organism-specific entries by changing the prefix, such as from map00010 to hsa00010 for the glycolysis pathway map.
The last point is an important aspect of organizing systems and genomic information in KEGG, which is based on the concept of functional orthologs and implemented as the KEGG Orthology (KO) system. This also makes KEGG a generic resource that can be applied to any organism. KEGG pathway maps, Brite hierarchies and KEGG modules, which represent molecular interaction, reaction and relation networks, are manually created with KOs as network nodes. Thus, KOs are functional orthologs in the context of molecular networks with varying degrees of sequence similarity. Each KO (K number) entry is first defined from experimentally characterized genes and proteins in specific organisms. It is then expanded through the KEGG annotation procedure to find additional membership of this KO entry from the GENES database. This enables the expansion from a manually drawn reference pathway map to many computationally generated organism-specific pathway maps by converting K numbers to gene identifiers in individual KEGG organisms. As of September 2022, K numbers are assigned to about 53% of over 40 million genes in cellular organisms, but only about 3% of 600 thousand genes in viruses.
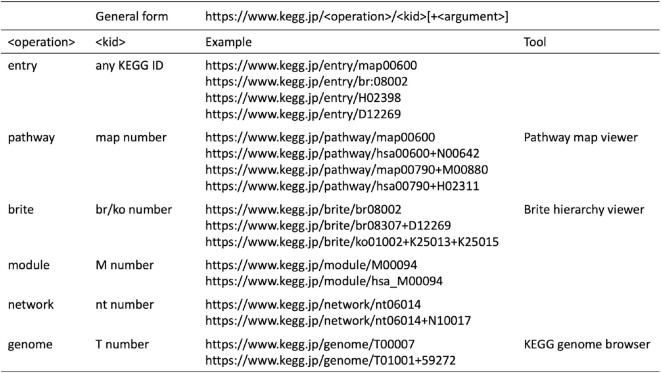
Figure 2 shows a collection of simple URLs, called KEGG weblinks, which is recommended for retrieving KEGG data at the KEGG website and the GenomeNet mirror site. The first form can be used to retrieve any entry of the KEGG databases in the flat-file format. The others are specialized forms for the PATHWAY, BRITE, MODULE, NETWORK and GENOME databases. The three tools, the pathway map viewer, the Brite hierarchy viewer, and the newly introduced KEGG genome browser, not only retrieve the data, but also allow many operations to be performed on the client side as described below.
Figure 2.
Simple URLs, called KEGG weblinks, to retrieve and analyze KEGG objects (database entries). The entry operation retrieves any object specified by the KEGG identifier in the flat-file format. The pathway, brite, module or network operation retrieves a molecular network object specified by the KEGG identifier with optional highlighting of network nodes given in the argument. The genome operation retrieves the genome map of a given organism with optional specification of a gene location. The pathway, brite and genome operations actually launch specialized tools enabling further analysis. In the URL form, www.kegg.jp may be replaced by www.genome.jp for accessing the GenomeNet mirror site.
Genes, genome and taxonomy
The GENES database and associated GENOME database contain three types of datasets: genes and genomes of cellular organisms, genes and genomes of viruses, and individual proteins whose functions are experimentally characterized. Genomes of cellular organisms are identified by the three- or four-letter KEGG organism code <org> or by the T number identifier (Figure 1). Sequence data are taken from RefSeq (5,6) or GenBank (7) and genes are given identifiers of <org>:<gene>, where <gene> is NCBI Gene ID or Locus_tag. The genome annotation of K number assignment relies on the SSDB database generated by SSEARCH computation of sequence similarity scores and best hit relations for all genome pairs in the GENES database. Because this is a time-consuming computation, a BLAST-based procedure has been introduced for tentative K number assignment of new genomes, enabling a number of large eukaryotic genomes to be included in KEGG.
The virus gene (vg) dataset contains all viruses in RefSeq releases and each gene is identified by vg:<gene>, where <gene> is NCBI Gene ID. Viruses are now distinguished by NCBI Taxonomy IDs, which are included in the GENOME database as the vtax entry. In addition, functionally important mature peptides cleaved from polyproteins or other gene products are manually collected in the newly introduced viral peptide (vp) dataset. They are often used to define KOs.
The addendum gene (ag) dataset is a manually created, publication-based collection of functionally characterized proteins with sequence data mostly taken from GenBank. Each entry is identified by ag:<protein>, where <protein> is mostly NCBI Protein ID. This collection has been instrumental in expanding the contents of KO entries, enabling the inclusion of any individual proteins that are sequenced and functionally characterized by experiments.
The KEGG database uses the NCBI taxonomy (8) for classification of cellular organisms and viruses (9). There are three variants of taxonomy trees, which are all represented by Brite hierarchy files. First, br08601 is a simple tree created by manually defining the order of organisms and organism groups, such as placing Homo sapiens at the top of Primates and Primates at the top of Mammals. Second, br08610 for KEGG organisms and addendum genes is computationally generated using all nodes in the abbreviated lineage of the NCBI taxonomy. For viruses br08620 is computationally generated using all nodes in the full lineage of the NCBI taxonomy, together with the traditional Baltimore classification at the top level (1). Third, br08611 for KEGG organisms and br08621 for viruses are also computationally generated with fixed levels of taxonomic ranks: phylum, class, order, family, genus and species in br08611 and realm, kingdom, phylum, class, order, family, genus and species in br08621. The third files are now used as the default in KEGG.
Pathway, module and network
The PATHWAY database is a collection of manually created KEGG pathway maps representing molecular wiring diagrams of biological systems. They contain accumulated knowledge of cellular and organism-level functions represented in terms of molecular interaction and reaction networks and are categorized into metabolism, genetic information processing, environmental information processing, cellular processes, organismal systems and human diseases. Each pathway map can be examined with the specialized pathway map viewer (1), which integrates conserved modules of metabolic pathways in the MODULE database and human disease-related network elements in the NETWORK database. The side panel of the viewer allows client-side operations like displaying such associated modules and network elements, as well as searching and coloring map objects in a similar way as the KEGG Mapper Search and Color tools. The KEGG Mapper version 5 was released in July 2021 with a simplified architecture consisting of four tools: Reconstruct, Search, Color and Join (2).
The NETWORK database is a collection of network elements, each defined as a sequential (1D) connection of molecules in signaling and metabolic networks. Related network elements are organized in network variation maps, showing aligned sets of reference network elements and variant (perturbed) network elements caused by human gene variants, viruses and other pathogens and environmental factors. Drug–target relationships are also included in the variation map when human gene variants are involved as drug targets or markers. In the pathway map viewer, certain network elements are dynamically added to the pathway maps, such as in map00600, map00230 and map00220.
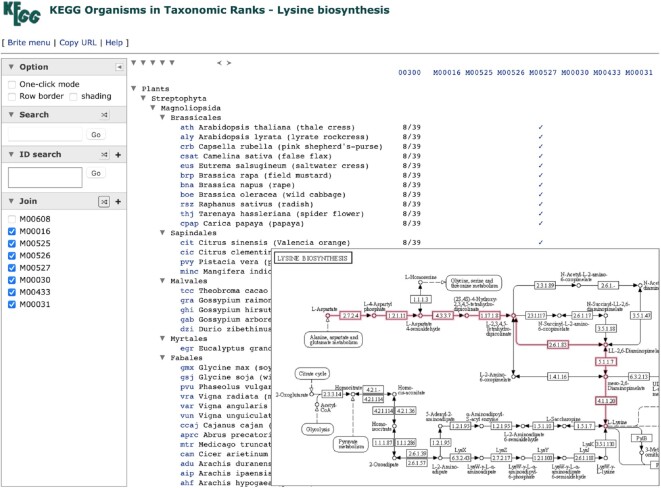
The Organism menu in the pathway map viewer is linked to taxonomy mapping using the Brite hierarchy viewer for the taxonomy file br08611 (KEGG organisms in taxonomic ranks). This presents a taxonomy-based global view of organisms and organism groups in which the pathway and associated modules are present. An example is shown in Figure 3 for the pathway map, map00300 for lysine biosynthesis, which contains multiple routes to lysine as represented by multiple modules. The taxonomy file is shown here together with the ratio of how many genes could be mapped to map00300 and the presence of complete modules that result from this mapping, thus revealing which functionally linked gene sets are found in which organisms and organism groups.
Figure 3.
The KEGG taxonomy browser, implemented as the Brite hierarchy viewer for taxonomy files, is now linked from the Organism menu of each KEGG pathway map. This example is linked from the lysine biosynthesis pathway map00300, included here by highlighting the plant-specific module M00527, and provides a taxonomy-based global view of organisms and organism groups in which the pathway and associated modules are present.
Brite hierarchy, table and binary relation
The Brite hierarchy viewer released in January 2021 comes with a side panel for client-side operations (2), including those similar to the KEGG Mapper Search and Join tools. The join operation allows binary relation files to be joined to the hierarchical tree file. Figure 3 was in fact a result of joining the taxonomy tree and binary relations. The result can then be examined with tree manipulation features of the Brite hierarchy viewer, called pruning and zooming. Pruning is for displaying only those branches that contain matching results of search or join operations. Zooming is available in selected Brite files, currently only those taxonomy files with fixed levels of taxonomic ranks, enabling to change the depth of the lowest level. In Figure 3, less-than and greater-than signs shown at the top of the main panel can be used to zoom out and zoom in, respectively. In order to display an appropriate number of related organisms, the bottom level of the tree may be adjusted to family or class in eukaryotes and to species or genus in prokaryotes.
The join operation capability of the Brite hierarchy viewer has significantly simplified the overall collection of the BRITE database, because precomputed and joined Brite files are no longer necessary. In addition to the hierarchy files and associated binary relation files, the BRITE database contains a small number of html table files. The table files do not allow expansion from K numbers to individual gene identifiers, and have been used mostly to represent drug and disease data.
KEGG Genome Browser
KEGG Genome Browser released in January 2022 is a new tool for viewing and analyzing chromosomal locations of genes. It is available for the genomes with the NCBI assembly level of ‘Complete genome’ and ‘Chromosome’ (10) covering about half of eukaryotic genomes and almost all prokaryotic genomes in KEGG. Its main purpose is genome comparisons, especially to identify conserved gene orders, or conserved synteny, among KEGG organisms and to display them by aligning corresponding locations in multiple genomes. Taxonomy mapping is also available for analyzing functional and evolutionary implications of conserved synteny.
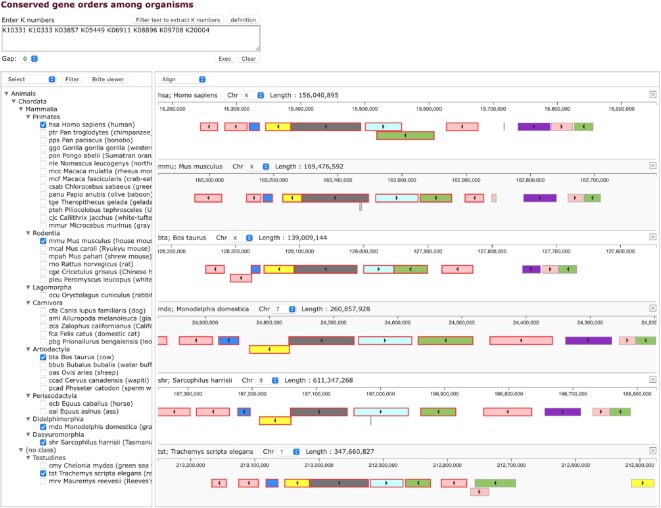
Genome alignment is usually done by aligning genome sequences. In KEGG the genome is considered as a sequence of genes annotated with K numbers and the genome alignment is done by aligning sequences of matching K numbers. This approach significantly simplifies the problem of gene order alignment. Figure 4 shows an example of using a KEGG synteny tool. A region of eight genes containing human ACE2 (K09708), which is represented by the green box at the top, is searched as a sequence of eight K numbers against all KEGG organisms. The result of matching organisms is shown in the taxonomy tree. By selecting organisms in the tree, corresponding genome regions can be displayed. Syntenic regions are found, in this case, not only in mammals but also in turtles.
Figure 4.
The KEGG genome browser is used to display syntenic regions in multiple genomes. Here, a region of eight genes represented as a sequence of eight K numbers is searched against all KEGG organisms. The result of matching organisms is shown in the taxonomy tree, from which selected genomes are displayed by aligning syntenic regions. Color coding is based on the functional category in KEGG.
Future plan for viral perturbations
Although the NETWORK database is currently limited to disease-related perturbations of molecular networks in human cells, the concept and methodology can be applied to other subject areas. One extension is to focus on viral perturbations in a more general way. Some data for the interactions of viral entry proteins and human or animal cell receptors have been collected and organized in Brite table files, irrespective of whether molecular networks inside the host cell are known or not. As part of our efforts to accumulate more knowledge about viral proteins, we will remove the restriction of ‘disease-related’ and organize viral perturbations in Brite table files, binary relation files and dynamically added network elements in pathway maps.
DATA AVAILABILITY
KEGG is a self-sustaining database. Without any substantial public funding, it is based mainly on the ‘community funding’ model, whereby the KEGG user community contributes financially to the development and maintenance of the database. KEGG is updated daily and made available at the KEGG website (https://www.kegg.jp/). The content is mirrored to the GenomeNet website (https://www.genome.jp/kegg/) one day later. Major updates of database contents and web services are announced every three months with the release number.
ACKNOWLEDGEMENTS
Computational resources were provided by the Bioinformatics Center, Institute for Chemical Research, Kyoto University.
Notes
Present address: Yoko Sato, Pathway Solutions Inc., 2-16-3 Higashi-Shinbashi, Minato-ku, Tokyo 105-0021, Japan.
Contributor Information
Minoru Kanehisa, Institute for Chemical Research, Kyoto University, Uji, Kyoto 611-0011, Japan.
Miho Furumichi, Institute for Chemical Research, Kyoto University, Uji, Kyoto 611-0011, Japan.
Yoko Sato, Digital Lab Division, Fujitsu Limited, Saiwai-ku, Kawasaki, Kanagawa 212-0014, Japan.
Masayuki Kawashima, Network Support Co. Ltd., Hakata-ku, Fukuoka 812-0011, Japan.
Mari Ishiguro-Watanabe, Human Genome Center, Institute of Medical Science, University of Tokyo, Minato-ku, Tokyo 108-8639, Japan.
FUNDING
NBDC Program of the Japan Science and Technology Agency (in part). Funding for open access charge: NBDC Program of the Japan Science and Technology Agency.
Conflict of interest statement. None declared.
REFERENCES
- 1. Kanehisa M., Furumichi M., Sato Y., Ishiguro-Watanabe M., Tanabe M.. KEGG: integrating viruses and cellular organisms. Nucleic Acids Res. 2021; 49:D545–D551. [DOI] [PMC free article] [PubMed] [Google Scholar]
- 2. Kanehisa M., Sato Y., Kawashima M.. KEGG mapping tools for uncovering hidden features in biological data. Protein Sci. 2022; 31:47–53. [DOI] [PMC free article] [PubMed] [Google Scholar]
- 3. Kanehisa M. Toward understanding the origin and evolution of cellular organisms. Protein Sci. 2019; 28:1947–1951. [DOI] [PMC free article] [PubMed] [Google Scholar]
- 4. Fleischmann R.D., Adams M.D., White O., Clayton R.A., Kirkness E.F., Kerlavage A.R., Bult C.J., Tomb J.F., Dougherty B.A., Merrick J.M.et al.. Whole-genome random sequencing and assembly of haemophilus influenzae rd. Science. 1995; 269:496–512. [DOI] [PubMed] [Google Scholar]
- 5. Sayers E.W., Beck J., Bolton E.E., Bourexis D., Brister J.R., Canese K., Comeau D.C., Funk K., Kim S., Klimke W.et al.. Database resources of the national center for biotechnology information. Nucleic Acids Res. 2022; 50:D20–D26. [DOI] [PMC free article] [PubMed] [Google Scholar]
- 6. O’Leary N.A., Wright M.W., Brister J.R., Ciufo S., Haddad D., McVeigh R., Rajput B., Robbertse B., Smith-White B., Ako-Adjei D.et al.. Reference sequence (RefSeq) database at NCBI: current status, taxonomic expansion, and functional annotation. Nucleic Acids Res. 2016; 44:D733–D745. [DOI] [PMC free article] [PubMed] [Google Scholar]
- 7. Sayers E.W., Cavanaugh M., Clark K., Pruitt K.D., Schoch C.L., Sherry S.T., Karsch-Mizrachi I.. GenBank. Nucleic Acids Res. 2022; 50:D161–D164. [DOI] [PMC free article] [PubMed] [Google Scholar]
- 8. Federhen S. The NCBI taxonomy database. Nucleic Acids Res. 2012; 40:D136–D143. [DOI] [PMC free article] [PubMed] [Google Scholar]
- 9. Lefkowitz E.J., Dempsey D.M., Hendrickson R.C., Orton R.J., Siddell S.G., Smith D.B.. Virus taxonomy: the database of the international committee on taxonomy of viruses (ICTV). Nucleic Acids Res. 2018; 46:D708–D717. [DOI] [PMC free article] [PubMed] [Google Scholar]
- 10. Kitts P.A., Church D.M., Thibaud-Nissen F., Choi J., Hem V., Sapojnikov V., Smith R.G., Tatusova T., Xiang C., Zherikov A.et al.. Assembly: a resource for assembled genomes at NCBI. Nucleic Acids Res. 2016; 44:D73–D80. [DOI] [PMC free article] [PubMed] [Google Scholar]
Associated Data
This section collects any data citations, data availability statements, or supplementary materials included in this article.
Data Availability Statement
KEGG is a self-sustaining database. Without any substantial public funding, it is based mainly on the ‘community funding’ model, whereby the KEGG user community contributes financially to the development and maintenance of the database. KEGG is updated daily and made available at the KEGG website (https://www.kegg.jp/). The content is mirrored to the GenomeNet website (https://www.genome.jp/kegg/) one day later. Major updates of database contents and web services are announced every three months with the release number.


