Abstract
The Integrated Microbial Genomes & Microbiomes system (IMG/M: https://img.jgi.doe.gov/m/) at the Department of Energy (DOE) Joint Genome Institute (JGI) continues to provide support for users to perform comparative analysis of isolate and single cell genomes, metagenomes, and metatranscriptomes. In addition to datasets produced by the JGI, IMG v.7 also includes datasets imported from public sources such as NCBI Genbank, SRA, and the DOE National Microbiome Data Collaborative (NMDC), or submitted by external users. In the past couple years, we have continued our effort to help the user community by improving the annotation pipeline, upgrading the contents with new reference database versions, and adding new analysis functionalities such as advanced scaffold search, Average Nucleotide Identity (ANI) for high-quality metagenome bins, new cassette search, improved gene neighborhood display, and improvements to metatranscriptome data display and analysis. We also extended the collaboration and integration efforts with other DOE-funded projects such as NMDC and DOE Biology Knowledgebase (KBase).
INTRODUCTION
The Integrated Microbial Genomes & Microbiomes (IMG/M: https://img.jgi.doe.gov/m/) is a public data resource that includes isolate and single cell genomes (archaea, bacteria, eukarya, plasmids, viruses), metagenomes and metatranscriptomes. In addition to datasets sequenced at the DOE’s Joint Genome Institute (JGI), IMG also includes public datasets downloaded from GenBank (1) and the Sequence Read Archive (SRA) (2), and datasets submitted by external users through the IMG submission system (https://img.jgi.doe.gov/submit/). Each dataset is associated with a large number of curated metadata information from the Genomes OnLine Database (GOLD) (3).
Starting with an input FASTA sequence file, IMG performs gene calling and functional annotation as described previously (4,5). A recently released new feature allows the submission of genomes in the General Feature Format (GFF3) (http://gmod.org/wiki/GFF3) to bypass the IMG gene calling step. Since the IMG native pipeline can only reliably predict prokaryotic genes, this new feature is particularly useful for eukaryotes and viruses.
Another important enhancement in IMG is the addition of the computationally predicted GTDB-Tk (6) taxonomic information to isolate genomes, enabling the users to view and to compare the default NCBI taxonomy to GTDB’s genome sequence-based assignment.
Most of the software packages and reference databases used in IMG v.7 remain the same as in v.6 (4), including CRT (7) for CRISPR element detection, tRNAscan-SE 2.0.8 (8) for tRNAs prediction, Rfam covariance models and Infernal tools (9–11) for RNA features prediction, and Prodigal v2.6.3 (12) and GeneMarkS-2 v1.14_1.25 (13) for CDS (protein-coding sequence) prediction. Functional annotation of CDSs is performed using a thread-optimized hmmsearch from the HMMER v3.1b2 (14,15) package based on the following databases:
updated 2014 version of COGs (16)
version 15.0 of TIGRFAM (17)
version 1.75 of SUPERFAMILY (18)
version 01_06_2016 of SMART (19)
version 4.2.0 of CATH-FunFam (20)
SignalP v4.1 (21) and TMHMM 2.0c (22) (for the prediction of signal peptides and transmembrane regions)
Two reference database sources have been updated in IMG v.7. We now use a new version of Pfam v34.0 (23) released in March 2021, and a new version of KEGG v98.0 (24) released in April 2021. MetaCyc v24.5 (25) pathways are recomputed using the new Enzyme Commission (EC) derived from KO terms. Our plan is to update reference databases every year subject to resource availability. As part of this reference database update process, Pfam, KO and EC annotations for all isolate genomes in IMG have been refreshed. Due to resource limitations, we were unable to re-annotate all existing metagenomes in IMG with the updated reference databases. From the microbiome detail page, the version of the IMG annotation pipeline used to process this metagenome is reported under ‘IMG Release/Pipeline Version.’ Annotation pipeline change log can be found in the Help section (https://img.jgi.doe.gov/help.html).
Even though the gene calling and annotation methods of the IMG pipeline remain largely the same (with additional automated genetic code detection improvements), we have modified the implementation method to use the Workflow Description Language (WDL) (https://openwdl.org/). This allows us to provide an open version of the pipeline available through NMDC (https://microbiomedata.org/) that can run on different platforms and computational resources. As part of our efforts to scale up and improve throughput for the metagenome annotation process, several hundreds of metagenomes have been annotated using the WDL-version of the pipeline on Amazon Web Service (AWS) (https://aws.amazon.com/) over the past several months, highlighting cloud-based services as a possible avenue for running large-scale annotation of metagenomes using the IMG pipeline.
IMG currently has around 8000 active users per month based on the IP addresses. There are >24 000 registered users who can access additional password-protected features of IMG such as private genome submissions and private workspace datasets. Based on the user registration information, many academic institutions used IMG for research or teaching purposes.
DATA CONTENT
Genomes, Metagenomes and Metatranscriptomes
As of August 2022, IMG v.7 includes 451 million genes from genomes (24% growth since August 2020) and a total of 75.11 billion genes from metagenomes and metatranscriptomes (16% growth since August 2020). Table 1 shows the current IMG content, as compared with its content in August 2020.
Table 1.
IMG dataset content comparison (unit: dataset)
| Total (8/2022) | Public (8/2022) | Total (8/2020) | Public (8/2020) | |
|---|---|---|---|---|
| Archaea | 3190 | 2258 | 3011 | 1967 |
| Bacteria | 116 439 | 99 477 | 99 004 | 83 768 |
| Eukaryota | 1069 | 724 | 746 | 710 |
| Virus | 17 315 | 15 802 | 9804 | 8392 |
| Plasmid | 1208 | 1188 | 1208 | 1188 |
| Metagenome | 34 196 | 29 932 | 26 488 | 21 813 |
| Metatranscriptome | 8499 | 7372 | 6371 | 6174 |
| Cell enrichment | 2948 | 2430 | 2357 | 2110 |
| Single Particle sort | 8153 | 6608 | 5806 | 5378 |
| Metagenome bin | 197 851 | 176 089 | 85 565 | 83 287 |
External users continued submitting their datasets to IMG for annotation and analysis, with submissions of 4349 genomes and 1891 metagenomes over the past two years. In addition, we continued importing reference genomes and metagenomes from NCBI Genbank and SRA, respectively. These datasets are publicly available to all IMG users for comparative analysis. JGI recently updated its Data Policy as described on the JGI website (https://jgi.doe.gov/user-program-info/pmo-overview/policies/). While this new policy states that sequencing data is now subject to a one-year embargo, some public JGI datasets have legacy use restrictions, as indicated under ‘JGI Data Utilization Status’ on the dataset overview page. Data users are required to verify any use restrictions and contact the listed PI(s) if/as needed.
DATA ANALYSIS
Several new features have been added to the User Interface (UI) (https://img.jgi.doe.gov/m/) to expand the IMG comparative analysis capabilities and to improve user experience. We describe the new improvements of the IMG UI below.
An updated scaffold search and list display with configuration
In IMG v.5 (26) and IMG v.6 (4), respectively, we revamped and improved the genome and gene search capabilities. In IMG v.7 we have made similar improvements to scaffold search. The new Scaffold Search under Find Genomes menu provides two search modes: Quick Search allows querying of scaffolds in IMG using scaffold IDs, scaffold external accessions, genome IDs or scaffold names. This search mode includes metagenome scaffold IDs, which may not be globally unique. Advanced Search Builder provides the capability to construct more complicated queries combining conditions on scaffold lineage, scaffold statistics (length, GC content) and functional content, similar to the existing genome and gene advanced search features. The default search results in IMG include a few mandatory fields, such as IMG-specific identifiers, as well as fields included in the query conditions. Similar to the genome and gene search results, scaffold search result lists are configurable and can include additional user-specified fields. Currently four categories are available to choose from: Scaffold Taxonomy, Function IDs, Function Names, and Scaffold Statistics.
Scaffold search results can be saved to the Scaffold Analysis Cart. Seven categories of scaffold metadata types are there for selection in the cart:
IDs and Names – Scaffold ID (*), Scaffold Name, IMG Genome/Taxon ID (*), Genome Name (*)
Scaffold Information – Scaffold Topology (linear or circular), NCBI Molecular Type (chromosome, plasmid, etc.)
Scaffold Statistics – Scaffold Gene Count (*), Scaffold Nucleotide Length (*), Scaffold GC Content, Scaffold Read Depth
Scaffold Lineage – Lineage, Lineage Percentage
Bin Information – In Bins
Viral Information – Perc VPFs (Viral Protein Families), Viral Cluster, Viral Sequences
Additional Metadata – Ecosystem, Ecosystem Category, Ecosystem Type, Ecosystem Subtype, Specific Ecosystem, Habitat, Host Name
Default display fields are marked with (*) in the above list. Selected scaffolds with additional user-specified fields can be exported as tab-delimited text files.
Average Nucleotide Identity for high-quality bins
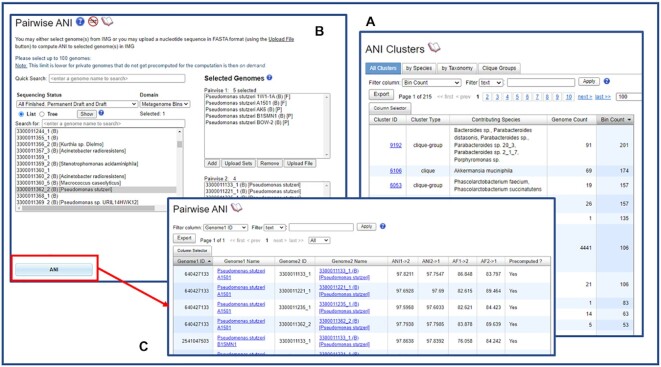
In addition to isolate genomes, IMG now also calculates Average Nucleotide Identity (ANI) (27) to and between high-quality metagenome bins. Briefly, to compute the ANI we use the MiSI method (27). In this method, for each genome pair, the CDS are compared to one another using the LAST sequence similarity search tool. Next, from the results, bi-directional best hits (BBHs) are identified as pairwise bidirectional best hits of genes having 70% or more identity and at least 70% coverage of the shorter gene. These BBHs are then used to compute the Average Nucleotide Identity (ANI) and the Alignment Fraction (AF). ANI Clusters in the Compare Genomes ANI menu item now lists both genome count and bin count (Figure 1A). Users can click on a cluster ID to view the genomes and bins belonging to this ANI cluster. They can also save the genomes to Genome Analysis Cart or Workspace Genome Set. Metagenome bins can be saved as Workspace Scaffold Sets.
Figure 1.
IMG now also assigns Average Nucleotide Identity (ANI) to high-quality metagenome bins. (A) ANI Cluster list shows both genome count and bin count. (B) Users can select both genomes and high-quality metagenome bins to perform pairwise ANI analysis. (C) The screen shows some Pairwise ANI analysis results.
Pairwise ANI in Compare Genomes ANI allows pairwise analysis of both genomes and high-quality metagenome bins (Figure 1B). Figure 1C shows some pairwise ANI comparison results. In the login version of IMG/MER (https://img.jgi.doe.gov/mer/) a ‘submit computation’ option exists for users to compare large amounts of data in the background to avoid UI timeouts.
This newly expanded ANI feature allows users to compare high-quality metagenome bins to similar metagenome bins, single-amplified genomes (SAGs), and isolate genomes without the need to submit bins as metagenome-assembled genomes (MAGs) into IMG.
Cassette Search and Cassette Workspace
We have extended gene search capabilities in IMG by introducing an improved version of the ClusterScout tool from IMG/ABC (28), allowing users to select genes based on their conserved chromosomal neighborhood and find ‘guilt-by-association’ connections between protein families. Similar to ClusterScout, a user can specify a set of ‘hooks’ - i.e. protein families expected to be found in close proximity to each other on the chromosome, within conserved chromosomal neighborhoods termed ‘cassettes.’ Unlike ClusterScout, which only works with Pfams as ‘hooks,’ Cassette Search allows users to select COG, Pfam, TIGRfam, KO terms or enzymes and to specify that some protein families must be associated with the same gene (e.g. Pfams corresponding to the N- and C-terminal domains of the same protein). Since Cassette Search is time consuming, this function is only provided in IMG/MER (log-in required) which allows submission of a background computation job. Users will then receive an email notification when their job completes.
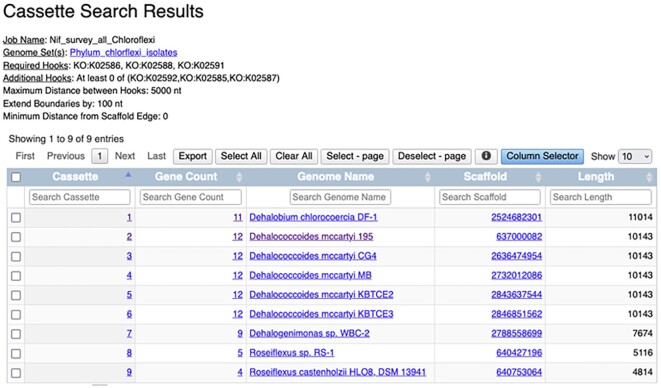
We will illustrate the use of the cassette search tool by surveying the genomes of Chloroflexi for the presence of a nitrogenase operon (Figure 2). Nitrogen fixation is an important but energetically expensive process (16 ATP consumed per N2 molecule reduced to NH4+) catalyzed by a multi-subunit enzyme called nitrogenase. Nitrogenase (nif) genes show limited and uneven distribution across prokaryotic genomes (29). Somewhat unexpectedly, a full nitrogenase operon (nifHIDKENB) was observed in the genome of Dehalococcoides mccartyi 195, the first sequenced member of the phylum Chloroflexi (30), an anaerobic dehalorespirer growing in oligotrophic contaminated sites with limited means of energy production. Strain 195 has been experimentally shown to fix N2 to sustain growth (31); however, due to high energy demand of nitrogen fixation, this is accompanied by decreased cell density and dechlorination activity (with implications for in situ bioremediation using such microbes).
Figure 2.
New Cassette Search is an extension and improvement of the ClusterScout in IMG/ABC. Users can use any COG, Pfam, TIGRfam, KO terms or enzymes as ‘hooks,’ and can specify whether certain functions must be on the same genes. This example shows the use of the cassette search tool by surveying the genomes of Chloroflexi for the presence of a nitrogenase operon.
KO terms used as hooks to retrieve nitrogenase operons in Chloroflexi include:
(Required) KO:K02586 – nitrogenase molybdenum-iron protein alpha chain (nifD)
(Required) KO:K02588 – nitrogenase iron protein (nifH)
(Required) KO:K02591 – nitrogenase molybdenum-iron protein beta chain (nifK)
(Optional) KO:K02585 – nitrogen fixation protein (nifB)
(Optional) KO:K02587 – nitrogenase molybdenum-cofactor synthesis protein (nifE)
(Optional) KO:K02592 – nitrogenase molybdenum-iron protein (nifN)
The distance between ‘hooks’ is set to 5000 nt, which allows for the presence of additional genes between them. Boundary extension (set to 100) may be increased to show the regions up- and downstream of the requested hooks allowing the user to identify any additional protein families potentially associated with nitrogenase operons. The minimum distance from scaffold edge is set to ‘0,’ so that operons close to the scaffold/contig edge of scaffold in possibly highly fragmented draft genome assemblies are not overlooked. The query is run on a set of 133 public isolate genomes of Chloroflexi, which were previously saved as a Workspace Genome set. The user is notified by email when the search result is ready.
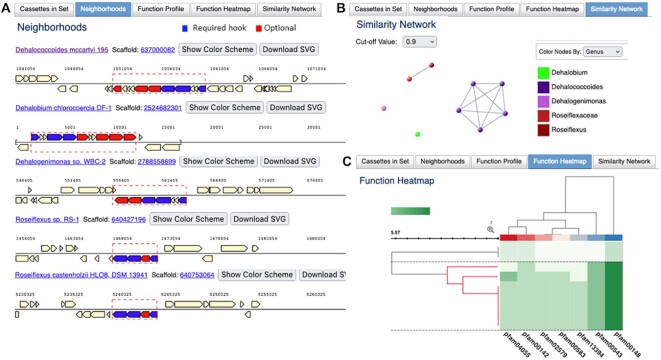
The query retrieves nine cassettes from nine genomes, which include several species of Dehalococcoides, Dehalobium and Dehalogenimonas, but also two Roseiflexus species, which are quite distant from dehalorespirers and belong to a different class. In order to handle the results of Cassette Search, IMG Workspace has been extended to support the new ‘cassette sets,’ whereby each cassette represents a region on a contig or scaffold, delineated by the presence of ‘hooks’ within specified distance (in bp) from each other. A user can select a number of cassettes from the Cassette Search and save them to a named Workspace Cassette set. From a Workspace Cassette set, a subset of cassettes can be selected to perform four types of analysis. The Function Profile tab displays the counts of different types of protein families found in the cassettes (COG, Pfam, TIGRfam, EC, KO). This option allows users to find which protein families are most commonly associated with their ‘hooks’ of interest. Neighborhoods tab provides a graphical display of gene neighborhoods for all selected cassettes with multiple coloring options (highlighting the ‘hook’ proteins only or color-coding genes by different protein families). A visual inspection of neighborhoods confirms all 9 genomes have a minimal Nif gene set, but the number of optional hooks is clearly different (Figure 3A). While two Roseiflexus spp. have just the minimal set, dehalorespiring species have an extended version of Nif operon with 6 or more Nif genes including regulators. The differences in protein content between Nif cassettes can be visualized using the Similarity Network tab with Jaccard index cutoff of 0.9 where the 5 D. mccartyi cassettes form a distinct cluster from two Roseiflexus cassettes, with Dehalogenimonas and Dehalobium appearing as singletons (Figure 3B). The Function Heatmap tab, which provides an alternative way of visualizing the differences in protein content, also shows that Roseiflexus cassettes are distinct from those found in dehalorespiring species (Figure 3C). The data is hierarchically clustered using InCHlib Javascript library (32) with the Jaccard distance based on Pfam composition of the cassettes and Ward linkage options. Hovering the mouse above rows, columns, and cells displays the details of Pfams, cassettes (including taxonomy) and the counts, respectively. It is also interesting to note that out of 30 D. mccartyi strains in the Chloroflexi genome set, only these five highly similar strains (based on ANI) encode a Nif cassette, suggesting recent horizontal gene transfer in the last common ancestor of this lineage. With this result, one may conclude that N2 fixation is not widespread among dehalorespiring taxa. Many other IMG tools and features can be used to explore other correlations or the potential origin of this operon in these strains.
Figure 3.
Cassette Search results can be saved as Workspace Cassette Sets. Workspace provides additional functions to analyze cassettes. (A) Genome neighborhood of cassette search results show required hooks (colored blue) and optional additional hooks (colored red). The specific boundaries of the requested cassettes as specified are outlined. Single cassette for D. mccartyi str 195 is shown (four other identical cassettes from the other strains are omitted for ease of display). (B) Similarity network graph to summarize the data showing 5 D. mccartyi cassettes forming a distinct group (purple) and separated from the two 4-gene Roseiflexus cassettes and singletons. Nodes can be recolored by taxon level (phylum to species). (C) Function heatmap can be used to visualize the Pfam content of cassettes. Cells are colored with hues of green based on the number of copies of the selected Pfam in the cassette (darker signifies a higher copy number). Rows are individual cassettes while columns are Pfams that occur in all cassettes and define the core functions of the cassette. Metadata cells are hidden in the current display but hovering over these metadata cells provides row and column details. The cassettes from the 7 dehalorespiring members cluster together (branches colored in red) based on their Pfam profiles.
Improved gene neighborhood display
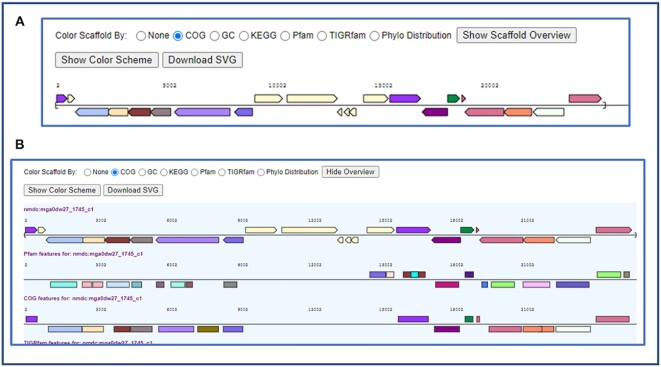
Gene neighborhood display has always been a popular feature of the IMG UI. It provides a graphical overview of the functional content of contigs and scaffolds by color-coding the genes according to their COG, Pfam, etc. (Figure 4A). Two major limitations of the existing viewer are that: (i) only one functional distribution is shown at a time, and (ii) the distribution of Pfams along the length of a single gene reflecting its domain composition is not shown.
Figure 4.
Improved gene neighborhood display. (A) Original gene neighborhood display shows only a single function category. (B) The new scaffold overview shows multiple functional categories and the exact location of each function.
The new gene neighborhood display overcomes these limitations by now providing a viewer that displays all protein family classifications at once and shows the exact positions of the protein family hits on the genes. For example, by clicking the ‘Show Scaffold Overview’ button, the Pfam, COG, TIGRfam, KO and EC distributions are displayed in a single viewer (Figure 4B). Moreover, when a gene has multiple Pfam hits, the exact location of each Pfam hit is shown. In addition, a new ‘Download SVG’ button allows the download of the gene neighborhood graph in publication quality SVG (Scalable Vector Graphics) format. This new display also provides expanded features for the representation of expression data, as described below.
Improvements to metatranscriptome data display and analysis
IMG has improved both the quality and the display of metatranscriptome data over the past two years. Important RNASeq library details are now shown in the list of all RNA experiments. As the default JGI protocol creates stranded RNASeq libraries, the majority of reads (>85%) in a metatranscriptome dataset are expected to map to the sense strand. However, some libraries are generated using a non-stranded protocol; such samples can be distinguished by signifying ‘non-stranded’ in the ‘Quality’ field. On the other hand, some stranded samples end up having high levels of antisense strand coverage due to DNA contamination and/or amplification artifacts; such samples are labeled ‘LQ’ for ‘low quality.’
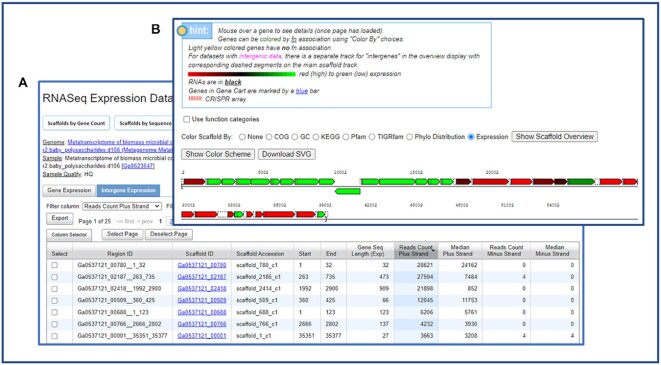
In addition to the sense-strand expression data for coding sequences (defined as the strand on which the coding sequence is predicted), metatranscriptome datasets now include antisense-strand expression information for coding sequences and Intergenic Region Expression data (Figure 5A). These new features allow users to find the coding sequences with unusual expression patterns, such as high levels of expression on antisense strand, which may be indicative of the presence of antisense regulatory RNAs or, alternatively, caused by various artifacts, such as DNA contamination and erroneous gene prediction. Several filters based on gene lengths and expression values can help users focus their analysis on specific genes and contigs of interest, and links to scaffold distributions by the number of genes and scaffold length allow users to view a graphical summary of gene expression for scaffolds of interest in the context of their functional annotation. The Intergene Expression data tab lists the intergenic regions and their expression values on the forward and reverse strand, with strand direction corresponding to that of the scaffold/contig. Sorting and filtering the data table allows users to identify intergenic regions with specific expression patterns and by clicking on the scaffold ID link, users can compare the intergenic region expression to the neighboring genes in the new gene neighborhood display (Figure 5B). The neighborhood can be downloaded using the same ‘Download SVG’ button as described above.
Figure 5.
Metatranscriptome data in IMG now includes both Gene Expression and Intergene Expression. (A) The Intergene Expression tab includes expression data on both forward and reverse strands. (B) Users can view intergenic expression data in the new gene neighborhood viewer.
COLLABORATION EFFORTS
As proposed in the previous IMG paper (4), we extended our collaborative efforts with two other DOE funded projects: the DOE Biology Knowledgebase (KBase) (33) and the National Microbiome Data Collaborative (NMDC) (34). In the IMG UI, the two new submenu items KBase and NMDC under Collaborations describe these collaborative efforts. The main goal of the collaboration is to share software and datasets to leverage the resources available across all these systems. Additional capabilities have been added to the IMG UI as the results of the collaborations.
KBase collaboration
IMG used to include InterPro (35) and Gene Ontology (GO) (36) annotations through its isolate genome annotation pipeline. These two functions were removed due to resource limitation caused by the lengthened annotation cycle time. As InterPro and GO annotations provide valuable information for the research, however, users have been requesting them.
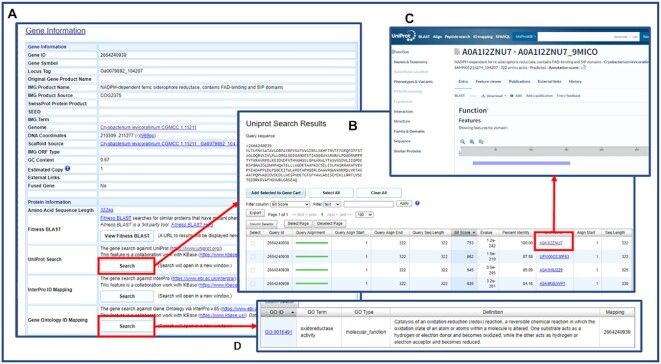
IMG collaborated with the KBase team to develop a new UniProt (37) Search function, which allows the identification of sequencing similarity via LAST (38) against a UniRef90 reference database (released in February 2020) (39). From a gene details page (Figure 6A), clicking on the Search button next to UniProt Search leads to the UniRef90 hits with specified e-value and number of hits. Following the corresponding UniProt links on the UniProt search result (Figure 6B), allows accessing more detailed information from the UniProt website (https://www.uniprot.org/) (Figure 6C). InterPro and Gene Ontology hits (Figure 6D) are also accessible from the same gene detail page.
Figure 6.
IMG gene detail page shows additional functions co-developed by JGI and KBase. (A) UniProt Search, InterPro ID Mapping and Gene Ontology ID Mapping are 3 new functions. (B) Uniprot Search results show top UniRef90 hits of this gene. (C) Users can follow the UniProt links to find more information from the UniProt website. (D) Gene Ontology (GO) mapping result shows the GO ID(s) associated with this gene.
InterPro and Gene Ontology search functions are part of an ID mapping service co-developed by JGI and KBase. The ID mapping service creates gene mappings in the NCBI NR (non-redundant) database, UniRef100 (39), IMG NR database and KBase NR database. Identical sequences (those having 100% identical sequences) are bidirectionally mapped to one another using UniRef100 as the canonical sequences. UniRef100 ID is then mapped to InterPro (using protein2ipr.dat file) and Gene Ontology (using interpro2go file), respectively. This allows us to derive InterPro and GO ontology of an IMG gene.
NMDC collaboration
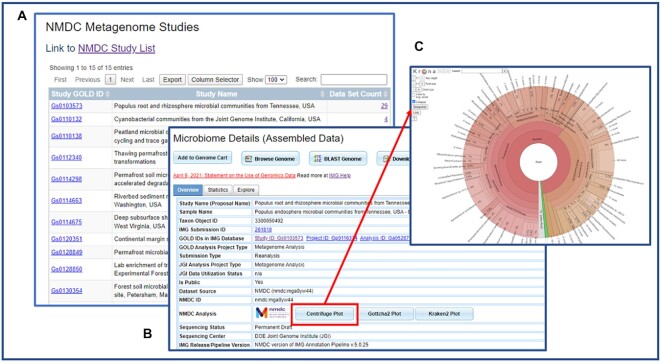
IMG shares its metagenome gene calling and annotation pipeline code with NMDC. Since metagenome datasets in IMG and NMDC are annotated using the same annotation pipeline, it's possible to share datasets with each other. From the IMG UI NMDC Collaboration page, all the metagenome datasets with corresponding data in NMDC are available (Figure 7A).
Figure 7.
IMG UI shows NMDC studies and datasets. (A) The NMDC Metagenome Studies list shows all GOLD studies that have NMDC data. (B) The metagenome detail page shows NMDC ID and provides links to NMDC read-based analysis plots. (C) NMDC read-based analysis Centrifuge Plot shows the inferred taxonomic distribution within this metagenome.
For all NMDC datasets in IMG, there is a new NMDC ID field in the genome detail page (Figure 7B). Users can also view NMDC read-based taxonomic composition analysis in a Krona display (40) (Figure 7C). There are three different types of analysis: Centrifuge (41), Gottcha2 (42) and Kraken2 (43), and the interactive Krona diagram allows a user to easily navigate between and compare the results of these different analyses for a given metagenome.
CONCLUDING REMARKS AND FUTURE PLANS
IMG’s main mission remains the support of JGI users, as well as the broader user community focused on microbiome data science. To achieve this goal, we continuously grow and enrich the IMG database contents, and improve the user experiences through additional new features in the IMG UI. In order to support data growth, we re-implement and improve the IMG annotation pipeline using WDL, allowing us to use computational resources outside of NERSC (https://www.nersc.gov/). We also collaborate with NMDC so IMG can import public metagenomic datasets annotated by NMDC and provide them to the users for comparative analysis. A next step of NMDC collaboration is to share metatranscriptomic datasets. Since IMG can currently only process metatranscriptomic data generated by the JGI, this will provide the infrastructure to expand the external metatranscriptomic data collection in IMG.
Original IMG analysis tools were limited to genomes and metagenomes. With the recent introduction of metagenome bins, there is an increasing desire for functionalities allowing the analysis of metagenome bins with genomes. We are currently systematically expanding all previously existing analysis tools to be inclusive of metagenome bins. The Pairwise ANI analysis described in this paper is one such example. Since IMG has many analysis tools, this will be an ongoing process. We have increased our collaboration effort with KBase, adding more analysis functions to the IMG UI, and will continue this effort in the foreseeable future.
The complexity of the IMG system continues to increase not only in terms of data size and types, but also in terms of the available analysis tools and overall functionalities. It is thus critical for us to both keep the system user-friendly and train scientists in the most efficient use of IMG. Many users have participated in IMG workshops and webinars in order to learn to use the system for their research needs. We will continue to provide hands-on IMG training workshops at the JGI, as well as in other locations, upon user request.
Contributor Information
I-Min A Chen, Department of Energy Joint Genome Institute, Lawrence Berkeley National Laboratory, 1 Cyclotron Road, Berkeley, CA 94720, USA.
Ken Chu, Department of Energy Joint Genome Institute, Lawrence Berkeley National Laboratory, 1 Cyclotron Road, Berkeley, CA 94720, USA.
Krishnaveni Palaniappan, Department of Energy Joint Genome Institute, Lawrence Berkeley National Laboratory, 1 Cyclotron Road, Berkeley, CA 94720, USA.
Anna Ratner, Department of Energy Joint Genome Institute, Lawrence Berkeley National Laboratory, 1 Cyclotron Road, Berkeley, CA 94720, USA.
Jinghua Huang, Department of Energy Joint Genome Institute, Lawrence Berkeley National Laboratory, 1 Cyclotron Road, Berkeley, CA 94720, USA.
Marcel Huntemann, Department of Energy Joint Genome Institute, Lawrence Berkeley National Laboratory, 1 Cyclotron Road, Berkeley, CA 94720, USA.
Patrick Hajek, Department of Energy Joint Genome Institute, Lawrence Berkeley National Laboratory, 1 Cyclotron Road, Berkeley, CA 94720, USA.
Stephan J Ritter, Department of Energy Joint Genome Institute, Lawrence Berkeley National Laboratory, 1 Cyclotron Road, Berkeley, CA 94720, USA.
Cody Webb, Department of Energy Joint Genome Institute, Lawrence Berkeley National Laboratory, 1 Cyclotron Road, Berkeley, CA 94720, USA.
Dongying Wu, Department of Energy Joint Genome Institute, Lawrence Berkeley National Laboratory, 1 Cyclotron Road, Berkeley, CA 94720, USA.
Neha J Varghese, Department of Energy Joint Genome Institute, Lawrence Berkeley National Laboratory, 1 Cyclotron Road, Berkeley, CA 94720, USA.
T B K Reddy, Department of Energy Joint Genome Institute, Lawrence Berkeley National Laboratory, 1 Cyclotron Road, Berkeley, CA 94720, USA.
Supratim Mukherjee, Department of Energy Joint Genome Institute, Lawrence Berkeley National Laboratory, 1 Cyclotron Road, Berkeley, CA 94720, USA.
Galina Ovchinnikova, Department of Energy Joint Genome Institute, Lawrence Berkeley National Laboratory, 1 Cyclotron Road, Berkeley, CA 94720, USA.
Matt Nolan, Department of Energy Joint Genome Institute, Lawrence Berkeley National Laboratory, 1 Cyclotron Road, Berkeley, CA 94720, USA.
Rekha Seshadri, Department of Energy Joint Genome Institute, Lawrence Berkeley National Laboratory, 1 Cyclotron Road, Berkeley, CA 94720, USA.
Simon Roux, Department of Energy Joint Genome Institute, Lawrence Berkeley National Laboratory, 1 Cyclotron Road, Berkeley, CA 94720, USA.
Axel Visel, Department of Energy Joint Genome Institute, Lawrence Berkeley National Laboratory, 1 Cyclotron Road, Berkeley, CA 94720, USA.
Tanja Woyke, Department of Energy Joint Genome Institute, Lawrence Berkeley National Laboratory, 1 Cyclotron Road, Berkeley, CA 94720, USA.
Emiley A Eloe-Fadrosh, Department of Energy Joint Genome Institute, Lawrence Berkeley National Laboratory, 1 Cyclotron Road, Berkeley, CA 94720, USA.
Nikos C Kyrpides, Department of Energy Joint Genome Institute, Lawrence Berkeley National Laboratory, 1 Cyclotron Road, Berkeley, CA 94720, USA.
Natalia N Ivanova, Department of Energy Joint Genome Institute, Lawrence Berkeley National Laboratory, 1 Cyclotron Road, Berkeley, CA 94720, USA.
FUNDING
U.S. Department of Energy Joint Genome Institute (https://ror.org/04xm1d337), a DOE Office of Science User Facility, is supported by the Office of Science of the U.S. Department of Energy [DE-AC02-05CH11231]; National Energy Research Scientific Computing Center, which is supported by the Office of Science of the U.S. Department of Energy. Funding for open access charge: Office of Science of the U.S. Department of Energy [DE-AC02-05CH11231].
Conflict of interest statement. None declared.
REFERENCES
- 1. Benson D.A., Cavanaugh M., Clark K., Karsch-Mizrachi I., Ostell J., Pruitt K.D., Sayers E.W.. GenBank. Nucleic Acids Res. 2018; 46:D41–D47. [DOI] [PMC free article] [PubMed] [Google Scholar]
- 2. Leinonen R., Sugawara H., Shumway M.. The sequence read archive. Nucleic Acids Res. 2011; 39:D19–D21. [DOI] [PMC free article] [PubMed] [Google Scholar]
- 3. Mukherjee S., Stamatis D., Bertsch J., Ovchinnikova G., Sundaramurthi J.C., Lee J., Kandimalla M., Chen I.A., Kyrpides N.C., Reddy T.B.K.. Genomes online database (GOLD) v.8: overview and updates. Nucleic Acids Res. 2020; 49:D723–D733. [DOI] [PMC free article] [PubMed] [Google Scholar]
- 4. Chen I.A., Chu K., Palaniappan K., Ratner A., Huang J., Huntemann M., Hajek P., Ritter S., Varghese N., Seshadri R.et al.. The IMG/M data management and analysis system v.6.0: new tools and advanced capabilities. Nucleic Acids Res. 2020; 49:D751–D763. [DOI] [PMC free article] [PubMed] [Google Scholar]
- 5. Clum A., Huntemann M., Foster B., Foster B., Roux R., Hajek P., Varghese N., Mukherjee S., T.B.K. Reddy T.B.K., Daum C.et al.. The DOE-JGI metagenome workflow. mSystem. 2021; 6:e00804-20. [DOI] [PMC free article] [PubMed] [Google Scholar]
- 6. Chaumeil P.A., Mussig A.J., Hugenholtz P., Parks D.H.. GTDB-Tk: a tool kit to classify genomes with the genome taxonomy database. Bioinformatics. 2020; 36:1925–1927. [DOI] [PMC free article] [PubMed] [Google Scholar]
- 7. Bland C., Ramsey T.L., Sabree F., Lowe M., Brown K., Kyrpides N.C., Hugenholtz P.. CRISPR recognition tool (CRT): a tool for automatic detection of clustered regularly interspaced palindromic repeats. BMC Bioinf. 2007; 8:209. [DOI] [PMC free article] [PubMed] [Google Scholar]
- 8. Chan P.P., Lin B., Lowe T.M.. tRNAscan-SE 2.0: improved detection and functional classification of transfer RNA genes. Nucleic Acids Res. 2021; 49:9077–9096. [DOI] [PMC free article] [PubMed] [Google Scholar]
- 9. Nawrocki E.P., Eddy S.R.. Infernal 1.1: 100-fold faster RNA homology searches. Bioinformatics. 2013; 29:2933–2935. [DOI] [PMC free article] [PubMed] [Google Scholar]
- 10. Griffiths-Jones S., Moxon S., Marshall M., Khanna A., Eddy S.R., Bateman A.. Rfam: annotating non-coding RNAs in complete genomes. Nucleic Acids Res. 2015; 33:D121–D4. [DOI] [PMC free article] [PubMed] [Google Scholar]
- 11. Nawrocki E.P., Kolbe D.L., Eddy S.R.. Infernal 1.0: inference of RNA alignments. Bioinformatics. 2009; 25:1335–1337. [DOI] [PMC free article] [PubMed] [Google Scholar]
- 12. Hyatt D., Chen G.L., Locascio P.F., Land M.L., Larimer F.W., Hauser L.J.. Prodigal: prokaryotic gene recognition and translation initiation site identification. BMC Bioinf. 2010; 11:119. [DOI] [PMC free article] [PubMed] [Google Scholar]
- 13. Lomsadze A, Gemayel K, Tang S, Borodovsky M.. Modeling leaderless transcription and atypical genes results in more accurate gene prediction in prokaryotes. 2018; 28:1079–1089. [DOI] [PMC free article] [PubMed] [Google Scholar]
- 14. Potter S.C., Luciani A., Eddy S.R., Park Y., Lopez R., Finn R.D.. HMMER web server: 2018 update. Nucleic Acids Res. 2018; 46:W200–W204. [DOI] [PMC free article] [PubMed] [Google Scholar]
- 15. Arndt W. Modifying HMMER3 to run efficiently on the cori supercomputer using OpenMP tasking. IEEE International Parallel and Distributed Processing Symposium Workshops (IPDPSW). 2018; 239–246. [Google Scholar]
- 16. Galperin M.Y., Wolf Y.I., Makarova K.S., Alvarez R.V., Landsman D., Koonin E.V.. COG database update: focus on microbial diversity, model organisms, and widespread pathogens. Nucleic Acids Res. 2021; 49:D274–D281. [DOI] [PMC free article] [PubMed] [Google Scholar]
- 17. Haft D.H., Selengut J.D., Richter R.A., Harkins D., Basu M.K., Bec k.E.. TIGRFAMs and genome properties in 2013. Nucleic Acids Res. 2013; 41:D387–D395. [DOI] [PMC free article] [PubMed] [Google Scholar]
- 18. Pandurangan A.O., Stahlhacke J., Oates M.E., Smithers B., Gough J.. The SUPERFAMILY 2.0 database: a significant proteome update and a new webserver. Nucleic Acids Res. 2019; 47:D490–D494. [DOI] [PMC free article] [PubMed] [Google Scholar]
- 19. Letunic I., Bork P.. 20 years of the SMART protein domain annotation resource. Nucleic Acids Res. 2018; 46:D493–D496. [DOI] [PMC free article] [PubMed] [Google Scholar]
- 20. Sillitoe I., Dawson N., Lewis T.E., Das S., Lees J.G., Ashford P., Tolulope A., Scholes H.M., Senatorov I., Bujan A.et al.. CATH: expanding the horizons of structure-based functional annotations for genome sequences. Nucleic Acids Res. 2019; 47:D280–D284. [DOI] [PMC free article] [PubMed] [Google Scholar]
- 21. Petersen T.N., Brunak S., von Heijne G., Nielsen H.. SignalP 4.0: discriminating signal peptides from transmembrane regions. Nat. Methods. 2011; 8:785–786. [DOI] [PubMed] [Google Scholar]
- 22. Moller S., Croning M.D.R., Apweiler R.. Evaluation of methods for the prediction of membrane spanning regions. Bioinformatics. 2001; 17:646–653. [DOI] [PubMed] [Google Scholar]
- 23. Mistry J., Chuguransky S., Williams L., Qureshi M., Salazar G.A., Sonnhammer E.L.L., Tosatto S.C.E., Paladin L., Raj S., Richardson L.J.et al.. Pfam: the protein families database in 2021. Nucleic Acids Res. 2021; 49:D412–D419. [DOI] [PMC free article] [PubMed] [Google Scholar]
- 24. Kanehisa M., Furumichi M., Sato Y., Ishiguro-Watanabe M., Tanabe M.. KEGG: integrating viruses and cellular organisms. Nucleic Acids Res. 2021; 49:D545–D551. [DOI] [PMC free article] [PubMed] [Google Scholar]
- 25. Caspi R., Billington R., Keseler I.M., Kothari A., Krummenacker M, Midford P.E., Ong W.K., Paley S., Subhraveti P., Karp P.D.. The metacyc database of metabolic pathways and enzymes - a 2019 update. Nucleic Acids Res. 2019; 48:D445–D453. [DOI] [PMC free article] [PubMed] [Google Scholar]
- 26. Chen I.A., Chu K., Palaniappan K., Pillay M., Ratner A., Huang J., Huntemann M., Varghese N., White J.R., Seshadri R.et al.. IMG/M v.5.0: an integrated data management and comparative analysis system for microbial genomes and metagenomes. Nucleic Acids Res. 2019; 47:D666–D677. [DOI] [PMC free article] [PubMed] [Google Scholar]
- 27. Varghese N.J., Mukherjee S., Ivanova N., Konstantinidis K.T., Mavrommatis K., Kyrpides N.C., Pati A.. Microbial species delineation using whole genome sequences. Nucleic Acids Res. 2015; 43:6761–6771. [DOI] [PMC free article] [PubMed] [Google Scholar]
- 28. Hadjithomas M., Chen I.A., Chu K., Huang J., Ratner A., Palaniappan K., Andersen E., Markowitz V., Kyrpides N.C., Ivanova N.N.. IMG-ABC: new features for bacterial secondary metabolism analysis and targeted biosynthetic gene cluster discovery in thousands of microbial genomes. Nucleic Acids Res. 2016; 45:D560–D565. [DOI] [PMC free article] [PubMed] [Google Scholar]
- 29. Pi H.-W., Lin J.-J., Chen C.-A., Wang P.-H., Chiang Y.-R., Huang C.-C., Young C.-C., Li W.-H.. Origin and evolution of nitrogen fixation in prokaryotes. Mol. Biol. Evol. 2022; 39:msac181. [DOI] [PMC free article] [PubMed] [Google Scholar]
- 30. Seshadri R., Adrian L., Fouts D.E., Eisen J.A., Phillippy A.M., Methe B.A., Ward N.L., Nelson W.C., Deboy R.T., Khouri H.M.et al.. Genome sequence of the PCE-Dechlorinating bacterium dehalococcoides ethenogene. Science. 2005; 307:105–108. [DOI] [PubMed] [Google Scholar]
- 31. Lee P.K.H., He J., Zinder S.H., Alvarez-Cohen L.. Evidence for nitrogen fixation by “Dehalococcoides ethenogenes” strain 195. Appl. Environ. Microbiol. 2009; 75:7551–7555. [DOI] [PMC free article] [PubMed] [Google Scholar]
- 32. Škuta C., Bartůněk P., Svozil D.. InCHlib – interactive cluster heatmap for web applications. J. Cheminformatics. 2014; 6:44. [DOI] [PMC free article] [PubMed] [Google Scholar]
- 33. Arkin A.P., Cottingham R.W., Henry C.S., Harris N.L., Stevens R.L., Maslov S., Dehal P., Ware D., Perez F., Canon S.et al.. KBase: the united states department of energy systems biology knowledgebase. Nat. Biotechnol. 2018; 36:566. [DOI] [PMC free article] [PubMed] [Google Scholar]
- 34. Eloe-Fadrosh E.A., Ahmed F., Anubhav, Babinski M., Baumes J., Borkum M., Bramer L., Canon S., Christianson D.S., Corilo Y.E., Davenport K.W.et al.. The national microbiome data collective data portal: an integrated multi-omics microbiome data resource. Nucleic Acids Res. 2022; 60:D828–D836. [Google Scholar]
- 35. Blum M., Chang H.Y., Chuguransky S., Grego T., Kandasaamy S., Mitchell A., Nuka G., Paysan-Lafosse T., Qureshi M., Raj S.et al.. The interpro protein families and domains database: 20 years on. Nucleic Acids Res. 2021; 49:D344–D354. [DOI] [PMC free article] [PubMed] [Google Scholar]
- 36. The Gene Ontology Consortium The gene ontology resource: enriching a GOld mine. Nucleic Acids Res. 2021; 49:D325–D334. [DOI] [PMC free article] [PubMed] [Google Scholar]
- 37. The UniProt Consortium UniProt: the universal protein knowledgebase in 2021. Nucleic Acids Res. 2021; 49:D480–D489. [DOI] [PMC free article] [PubMed] [Google Scholar]
- 38. Kielbasa S.M., Wan R., Sato K., Horton P., Frith M.C.. Adaptive seeds tame genomic sequence comparison. Genome Res. 2011; 21:487–493. [DOI] [PMC free article] [PubMed] [Google Scholar]
- 39. Suzek B.E., Wang Y., Huang H., McGarvey P.B., Wu C.H.UniProt Consortium . UniRef clusters: a comprehensive and scalable alternative for improving sequence similarity searches. Bioinformatics. 2015; 31:926–932. [DOI] [PMC free article] [PubMed] [Google Scholar]
- 40. Ondov B.D., Bergman N.H., Phillippy A.M.. Interactive metagenomic visualization in a web browser. BMC Bioinf. 2011; 12:385. [DOI] [PMC free article] [PubMed] [Google Scholar]
- 41. Kim D., Song L., Breitwieser F.P., Salzburg S.L.. Centrifuge: rapid and sensitive classification of metagenomic sequences. Genome Research. 2016; 26:1721–1729. [DOI] [PMC free article] [PubMed] [Google Scholar]
- 42. Freitas T.A.K., Li P.-E., Scholz M.B., Chain P.S.G.. Accurate read-based metagenome characterization using a hierarchical suite of unique signatures. Nucleic Acids Res. 2015; 43:e69. [DOI] [PMC free article] [PubMed] [Google Scholar]
- 43. Wood D.E., Lu J., Langmead B.. Improved metagenomic analysis with kraken 2. Genome Biol. 2019; 20:257. [DOI] [PMC free article] [PubMed] [Google Scholar]


