Abstract
Background
Preclinical animal as well as small exploratory ex vivo and in vivo human studies have suggested that bowel wall shear wave speed (SWS) measurements may be a noninvasive biomarker of intestinal damage.
Objective
To evaluate the relationships between bowel wall stiffness, measured using ultrasound shear wave elastography (SWE), and intestinal fibrosis and smooth muscle hypertrophy as determined by 1) histology and 2) second harmonic imaging microscopy (SHIM) in surgically resected ileal strictures from pediatric Crohn disease patients.
Materials and methods
Nineteen pediatric Crohn disease patients with symptomatic ileal strictures underwent research ultrasound examinations before surgical resection between December 2017 and September 2020. Two-dimensional SWE was performed through the area of most severe stenosis, with measurements obtained from the bowel wall at the 9:00, 12:00 and 3:00 o’clock locations with 0%, 10% and 20% abdominal strain. Overall right lower quadrant stiffness also was documented. Median bowel wall and overall right lower quadrant SWS measurements were correlated with bowel wall histological scores of inflammation, fibrosis and smooth muscle proliferation as well as SHIM collagen signal.
Results
Diagnostic ultrasound SWE imaging was obtained from 18 participants. The median age was 16.8 years. There were negative correlations between histological mucosal active inflammation and both bowel wall SWS with 10% abdominal strain (r=−0.50, P=0.04) and overall right lower quadrant SWS with 20% abdominal strain (r=−0.69, P=0.002). There were positive correlations between histological muscularis propria inner layer smooth muscle hypertrophy and both median bowel wall SWS with 10% abdominal strain (r=0.72, P=0.002) and overall right lower quadrant SWS with 20% abdominal strain (r=0.71, P=0.002). There were no associations between ultrasound stiffness metrics and bowel wall SHIM collagen measurements.
Conclusion
Bowel wall and overall right lower quadrant ultrasound stiffness measurements correlate with mucosal active inflammation and muscularis propria smooth muscle hypertrophy in pediatric stricturing ileal Crohn disease, but not with intestinal fibrosis.
Keywords: Children, Crohn disease, Fibrosis, Shear wave elastography, Stricture, Ultrasound
Introduction
Crohn disease is a typically progressive autoimmune disease of the gastrointestinal tract associated with active and chronic inflammation of the bowel wall, most commonly affecting the terminal ileum and colon. Over time, repeated episodes of intestinal injury lead to aberrant healing, including the deposition of fibrosis and abnormal smooth muscle proliferation (commonly referred to as smooth muscle hypertrophy and/or hyperplasia) [1]. In some patients, this combination of intestinal inflammation, fibrosis and smooth muscle expansion can lead to luminal narrowing and varying degrees of intestinal blockage, stricturing disease or fibrostenosis [2]. This complication of Crohn disease is a common source of morbidity and hospitalization, increased health care costs and potentially decreased quality of life [3, 4].
Strictures that are predominantly inflammatory in composition, containing little or no fibrosis and/or smooth muscle hypertrophy, may respond to medical management. Conversely, strictures that contain substantial fibrosis and/or smooth muscle hypertrophy may require nonmedical management, such as endoscopic dilation, surgical stricturoplasty or surgical resection. Noninvasive imaging methods that could detect and measure bowel wall fibrosis and smooth muscle hypertrophy are an unmet need [2].
The purpose of our study was to evaluate the relationships between bowel wall and overall right lower quadrant stiffness, as measured by ultrasound two-dimensional (2-D) shear wave elastography (SWE), and bowel wall fibrosis and smooth muscle hypertrophy as determined by correlative 1) histological scoring, and 2) second harmonic imaging microscopy (SHIM) in symptomatic ileal strictures from pediatric Crohn disease patients undergoing ileocectomy procedures. Our hypothesis was that increasing amounts of bowel wall fibrosis and/or smooth muscle hypertrophy would be associated with increasing bowel wall and overall right lower quadrant SWS measurements.
Furthermore, to exploit the known nonlinear elastic properties of human tissues, bowel wall and overall right lower quadrant SWS measurements were acquired with increasing amounts of transducer preload (axial abdominal strain) [5]. We hypothesized that bowel segments with greater amounts of fibrosis and/or smooth muscle hypertrophy would stiffen to a greater extent than predominantly inflammatory strictures with increasing abdominal strain, thus resulting in stronger correlations between preloaded SWS measurements and our histologic and SHIM reference standards.
Materials and methods
This prospective, cross-sectional, single-center (Cincinnati Children’s Hospital Medical Center) investigation was approved by our institutional review board and Health Insurance Portability and Accountability Act (HIPAA) compliant. Written informed consent was obtained for all participants, and informed assent was obtained from participants between 10 and 17 years of age.
Participants
Pediatric patients with known Crohn disease who were scheduled for surgical resection of a symptomatic (e.g., persistent abdominal pain, gastrointestinal tract obstructive symptoms) ileal stricture were identified using institutional gastroenterology, surgery and radiology electronic health records between December 2017 and September 2020. Exclusion criteria included the following: an inability to tolerate ultrasound imaging (e.g., due to an abdominal wall wound or severe abdominal pain), suspected or known pregnancy, previous ileal resection or endoscopic dilation, and body mass index (BMI) ≥35 kg/m2. Patients defined as morbidly obese were intentionally excluded from this investigation due to a high likelihood of ultrasound shear wave elastography technical failure related to inability to generate and/or track shear waves within the abdomen.
Ultrasound imaging
Research ultrasound imaging of the strictured ileal segment was performed by one of two dedicated pediatric ultrasound technologists (20 and 30 years of clinical experience, respectively, including bowel ultrasound), under the direct supervision of the study radiologist (J.R.D., with 13 years of post-fellowship experience and 10 years of ultrasound elastography experience). The supervising radiologist, a board-certified pediatric radiologist, was present in person for all research ultrasound examinations. All ultrasound examinations were performed within three months before surgery, with the majority performed within a day. Patients were fasting (nil per os) for a minimum of 2 hours before imaging.
Using an Acuson S3000 ultrasound system (Siemens Medical Solutions, Malvern, PA) and 9L4 linear transducer, gray-scale imaging of the strictured ileal segment was performed, focused on the area of greatest luminal narrowing and wall thickening (i.e. the most severe area of stricturing) [2]. Maximum bowel wall thickness was measured. Two-dimensional (2-D) SWE was then performed in the same location using standardized 3×3-cm elastograms, with increasing increments of transducer graded compression (0%, 10% and 20% abdominal strain). Abdominal strain was determined by measuring the distance between the skin surface and anterior surface of the right psoas muscle or posterior serosal surface of the ileum. Single round subcentimeter (fixed in diameter and unable to be adjusted in size) regions of interest (ROIs) were placed in the bowel wall at the 9:00, 12:00 and 3:00 o’clock locations, and median SWS was calculated for each level of abdominal strain (Fig. 1). An overall estimate of right lower quadrant stiffness (the median SWS of the entire elastogram) also was documented for each level of abdominal strain for the entire 3×3-cm elastogram. Quality maps were subjectively assessed in real time to ensure high-quality shear wave generation and tracking (Fig. 1).
Fig. 1.
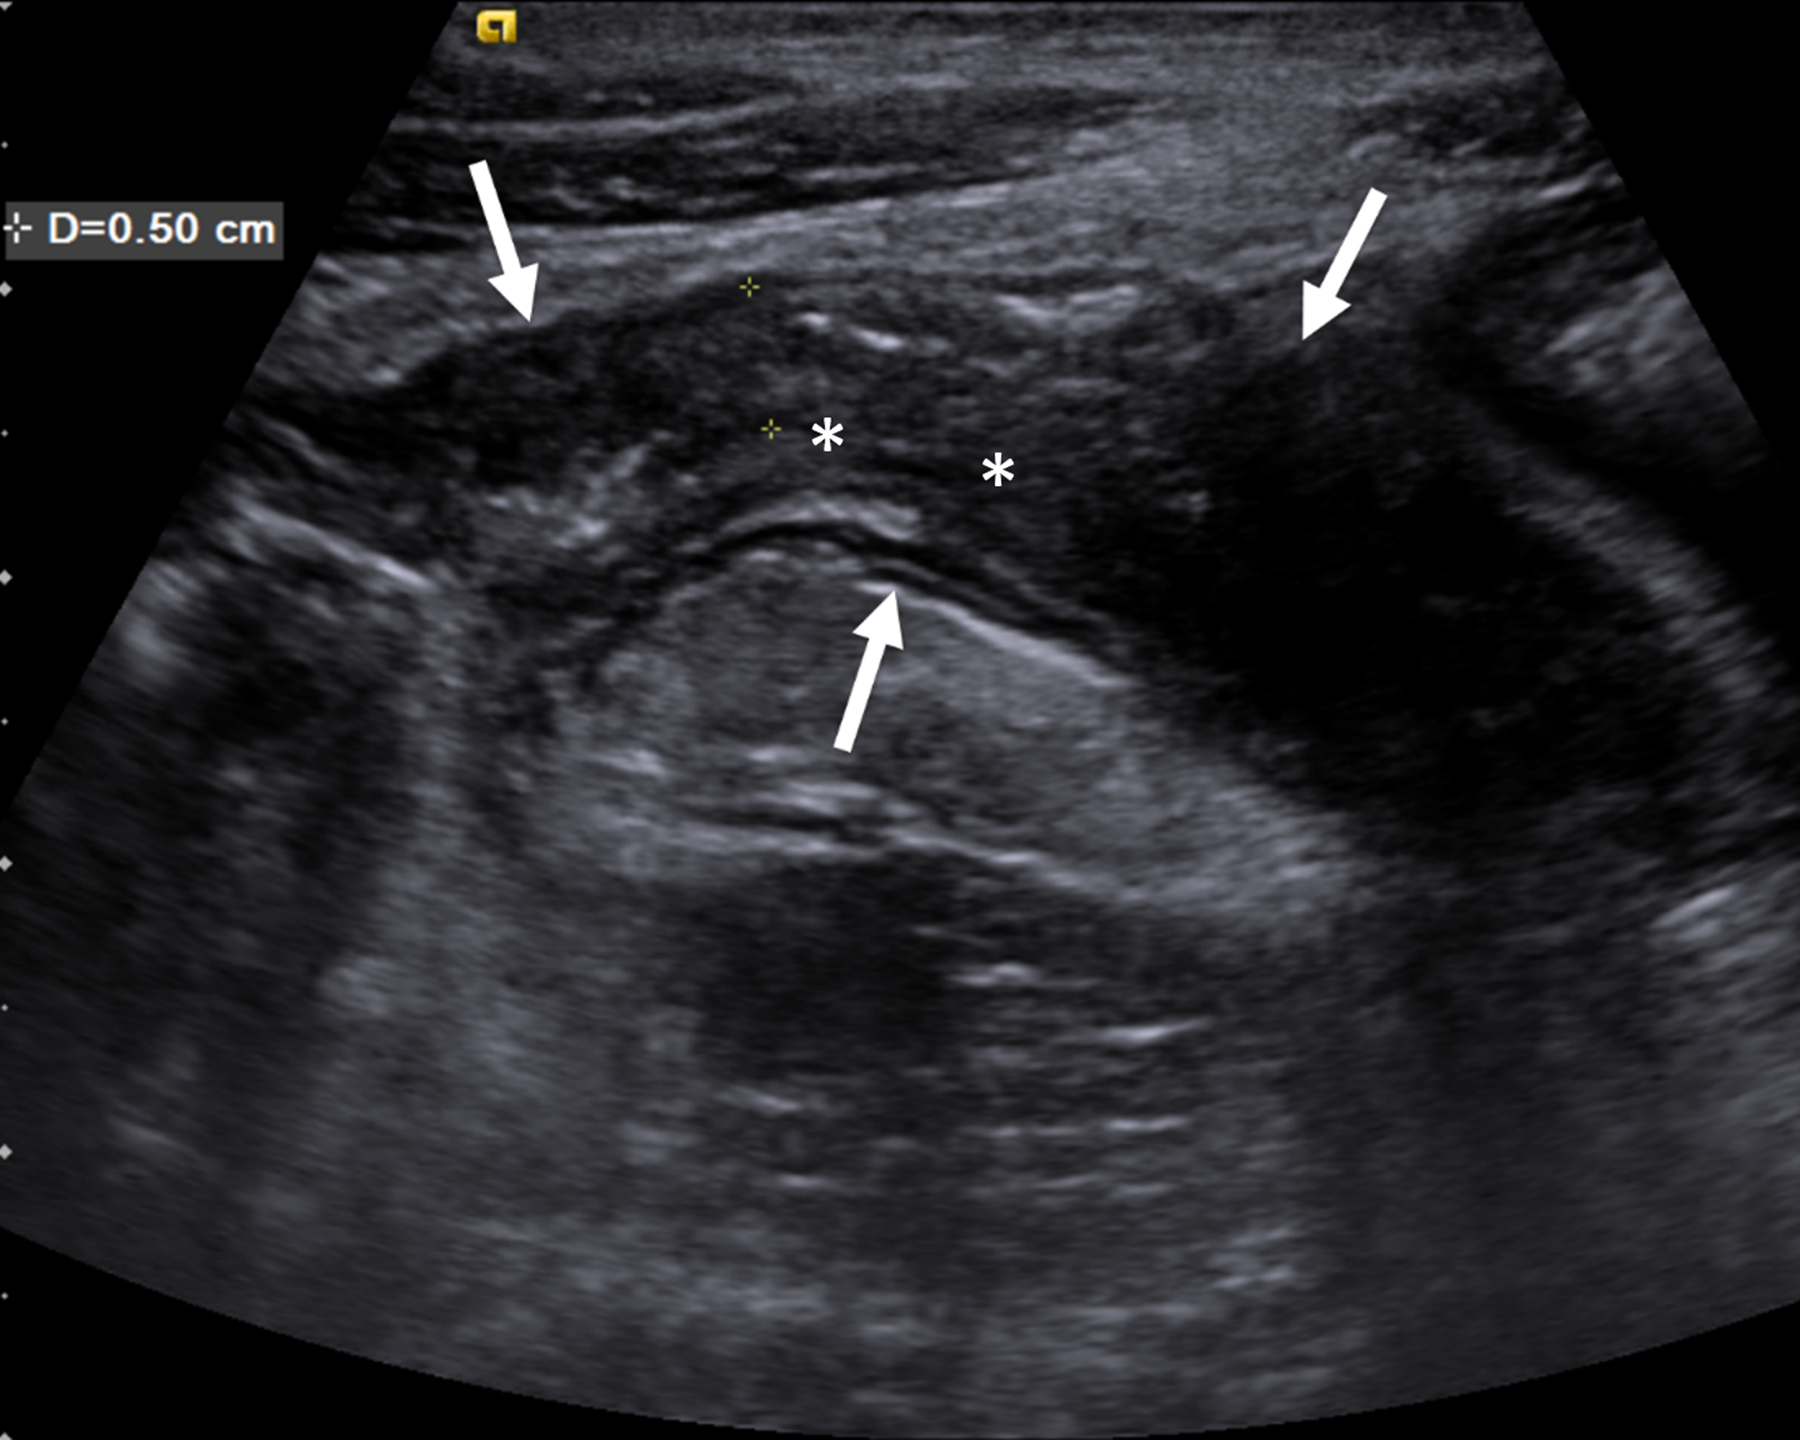
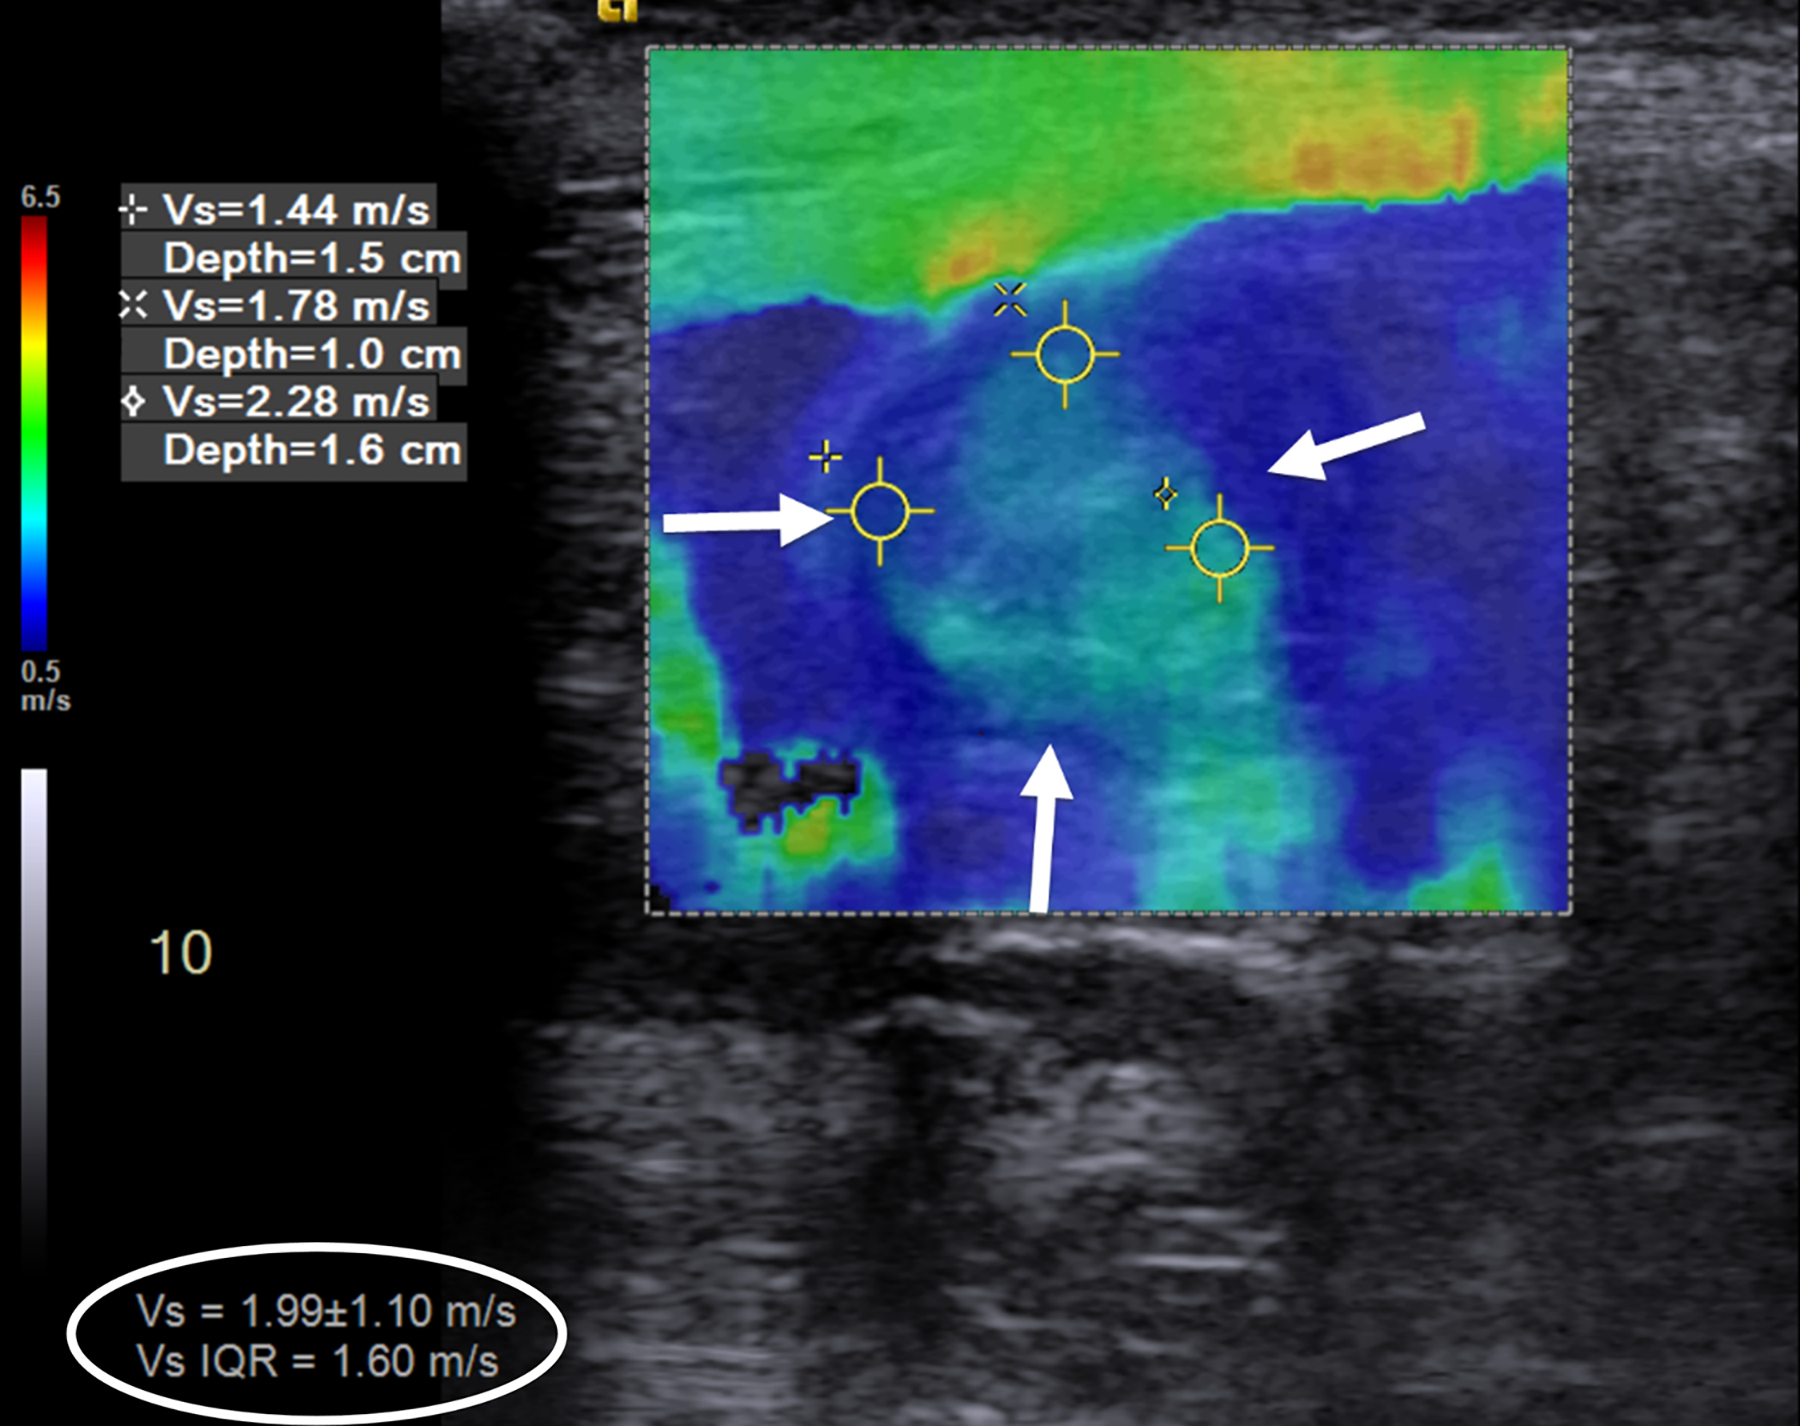
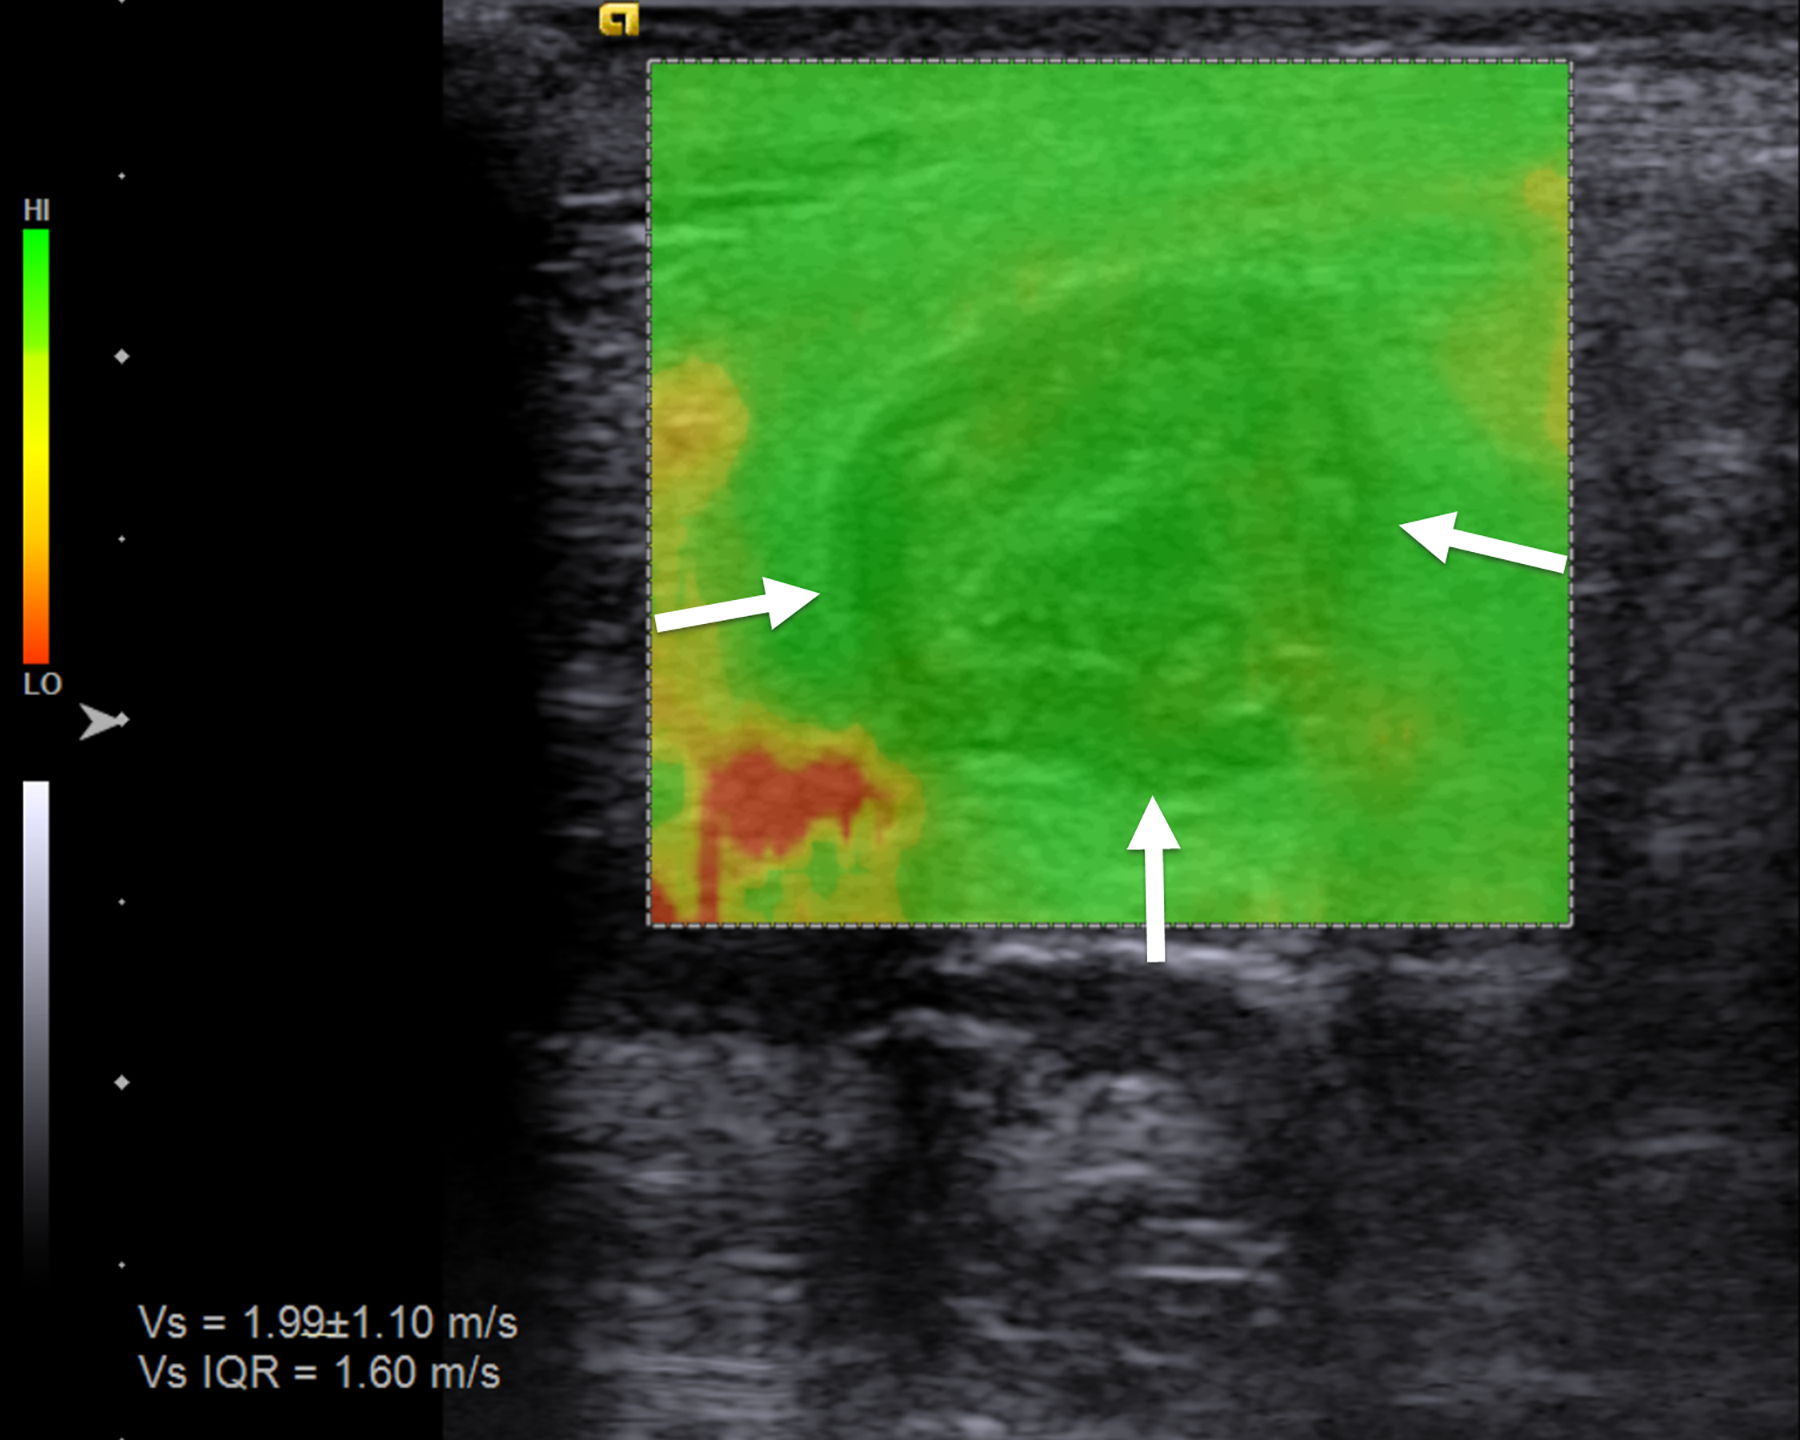
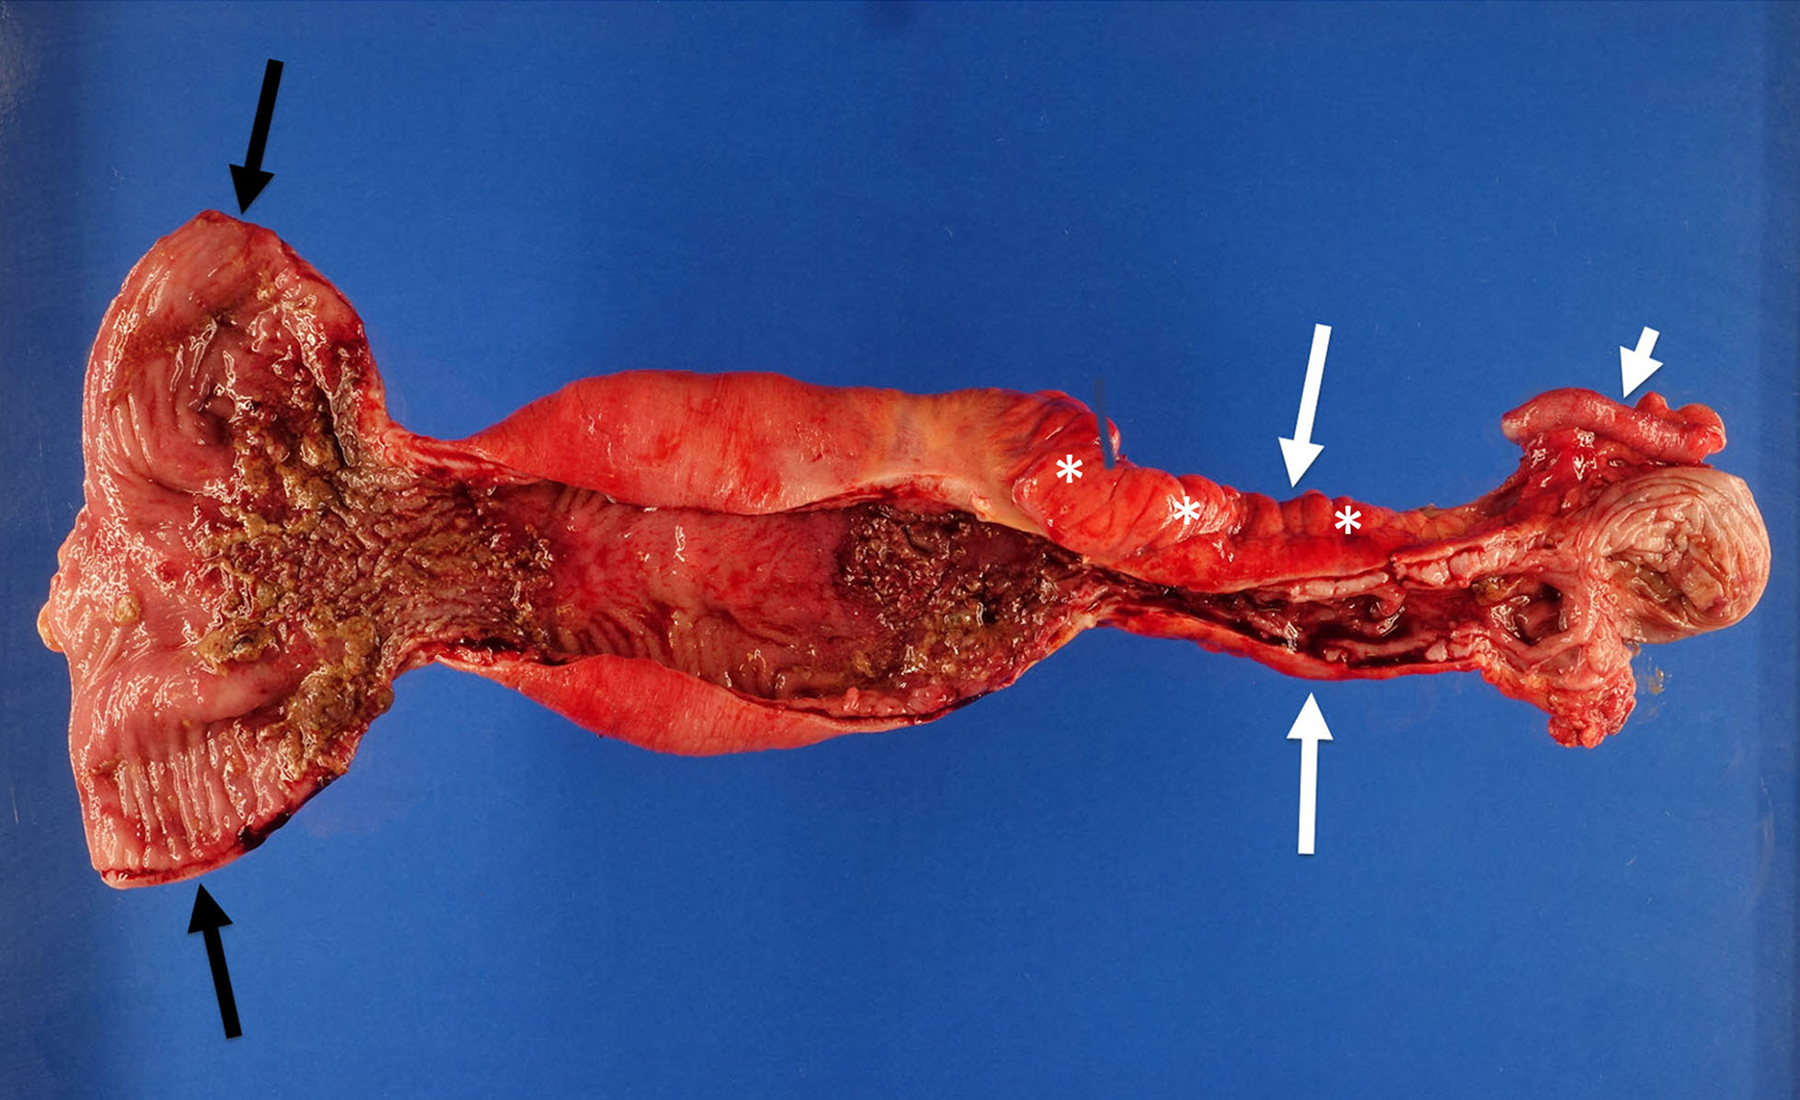
An 18-year-old man with stricturing Crohn disease affecting the terminal ileum. a A longitudinal gray-scale ultrasound image of the terminal ileum (arrows) shows wall thickening and mural heterogeneity, with loss of expected layering. The lumen is narrowed due to a stricture, completely effaced at the level of the asterisks. b A transverse two-dimensional ultrasound shear wave elastography image of the terminal ileum through the mid stricture (arrows) with 10% abdominal strain shows heterogeneous bowel wall stiffening, ranging from 1.44 to 2.28 m/s based on regions of interest placed at the 9:00, 12:00 and 3:00 o’clock locations (yellow symbols). Overall right lower quadrant median shear wave speed within the elastogram is 1.99 m/s (measurement in white oval). c A correlative elastogram quality map confirms that measurements in the bowel wall (arrows) are of “high” quality with regard to shear wave tracking and shear wave speed measurements (based on green color). d A gross pathology image of the resected bowel shows a stricture of the terminal ileum with luminal narrowing (long white arrows) and fat wrapping (so-called creeping fat, asterisks). The uninvolved proximal margin (black arrows) and appendix (short white arrow) are visible
Histopathology and SHIM
Full-thickness (transmural) dedicated research tissue specimens were obtained from the freshly resected strictured small bowel from the location of ultrasound imaging before placement in formalin. These specimens were acquired promptly following surgical resection. The resected bowel was visually inspected and correlated directly with research imaging to ensure ultrasound-pathology correlation. A dedicated research tissue specimen also was obtained from the surgical margin of each resected ileal segment. After routine tissue processing, representative stricture and surgical margin slides were stained using hematoxylin and eosin as well as Masson trichrome for histological scoring purposes.
Representative slides were reviewed by a fellowship-trained pathologist with expertise in inflammatory bowel disease (M.H.C., with 34 years of post-fellowship experience), blinded to ultrasound and SHIM data. Specifically, the three individual layers of the bowel wall (mucosa, submucosa and muscularis propria [including separate assessments of the inner (circular) and outer (longitudinal) layers of the muscularis propria]) were scored for histological active and chronic inflammation, fibrosis and smooth muscle hypertrophy, as described by Chen et al. [1]. For each bowel wall layer, four unique 100x microscopic fields were scored using a Likert scale approach based on the severity of histological abnormalities, and the mean scores were obtained for each the various evaluated histological findings. Total scores for active inflammation, chronic inflammation, fibrosis and smooth muscle hypertrophy in each of the bowel wall layers mentioned above were then calculated by summing the scores of relevant histological findings. Individual bowel wall layer scores (i.e. from the mucosa, submucosa, muscularis propria inner layer and muscularis propria outer layer) were then summed to establish entire bowel wall histological scores of active inflammation, chronic inflammation, fibrosis and smooth muscle hypertrophy. The ratio of entire bowel wall histological smooth muscle hypertrophy-to-inflammation was calculated.
A 5-μm thick, formalin-fixed, paraffin-embedded unstained slide from each stricture was assessed using SHIM to measure the amount of collagen within the entire (full thickness) bowel wall as well as the relative amounts of collagen within each individual bowel wall layer (Fig. 2) [6]. The collagen signal emanating from the muscularis propria was assessed individually for the inner (circular) and outer (longitudinal) layers. SHIM signal, which is based on the generation of second harmonic light compared to incident light (800 nm wavelength) using a laser light source, is proportional to the amount of collagen (primarily fibrillary collagen type I) within a tissue specimen [7]. SHIM images were acquired at 4x magnification using a Nikon A1R multiphoton upright confocal microscope (Nikon Instruments Inc., Melville, NY), while two-photon excited fluorescence (TPEF) microscopy was used to visualize other cell structures. SHIM images were color-coded in red, while TPEF images were color-coded in green. NIS-Elements imaging software (Nikon Instruments Inc., Melville, NY) was used to measure bowel wall collagen signal (arbitrary units) and further define specific areas of interest (i.e. the mucosa, submucosa, and inner and outer layers of the muscularis propria). A single operator (E.B., with two years’ experience performing SHIM analyses), blinded to ultrasound SWE measurements and histological scoring, measured collagen as a ratio of the total area (μm2) of collagen signal divided by the total area (μm2) imaged for the entire bowel wall as well as by individual histological layer (i.e. relative collagen expression). The average thickness of each bowel wall layer was also recorded (again, in μm).
Fig. 2.
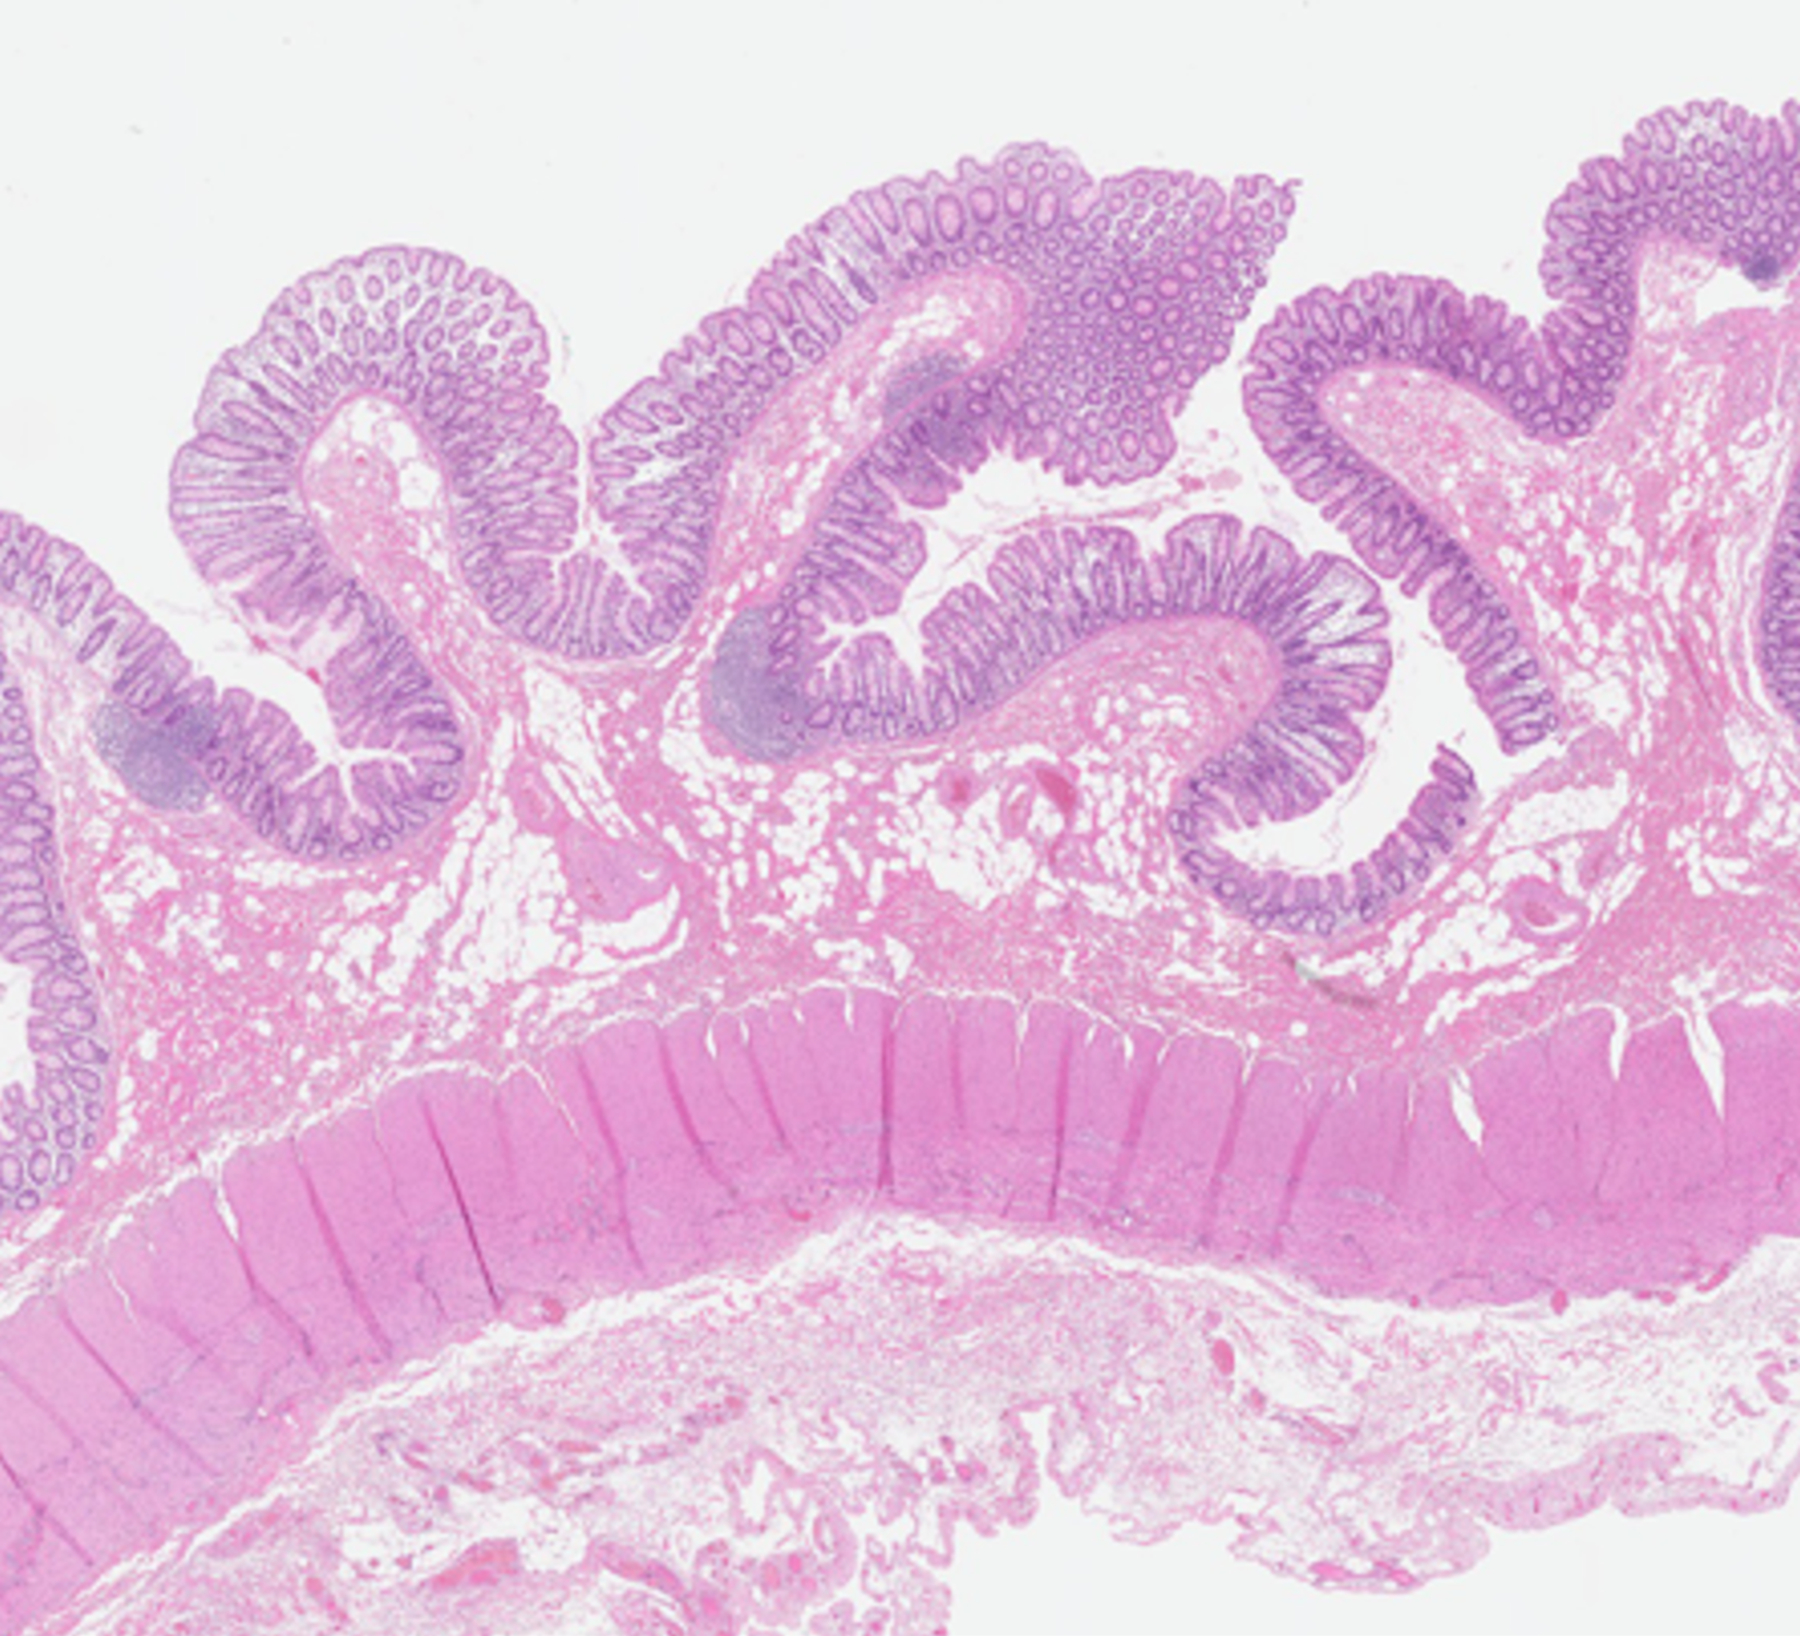
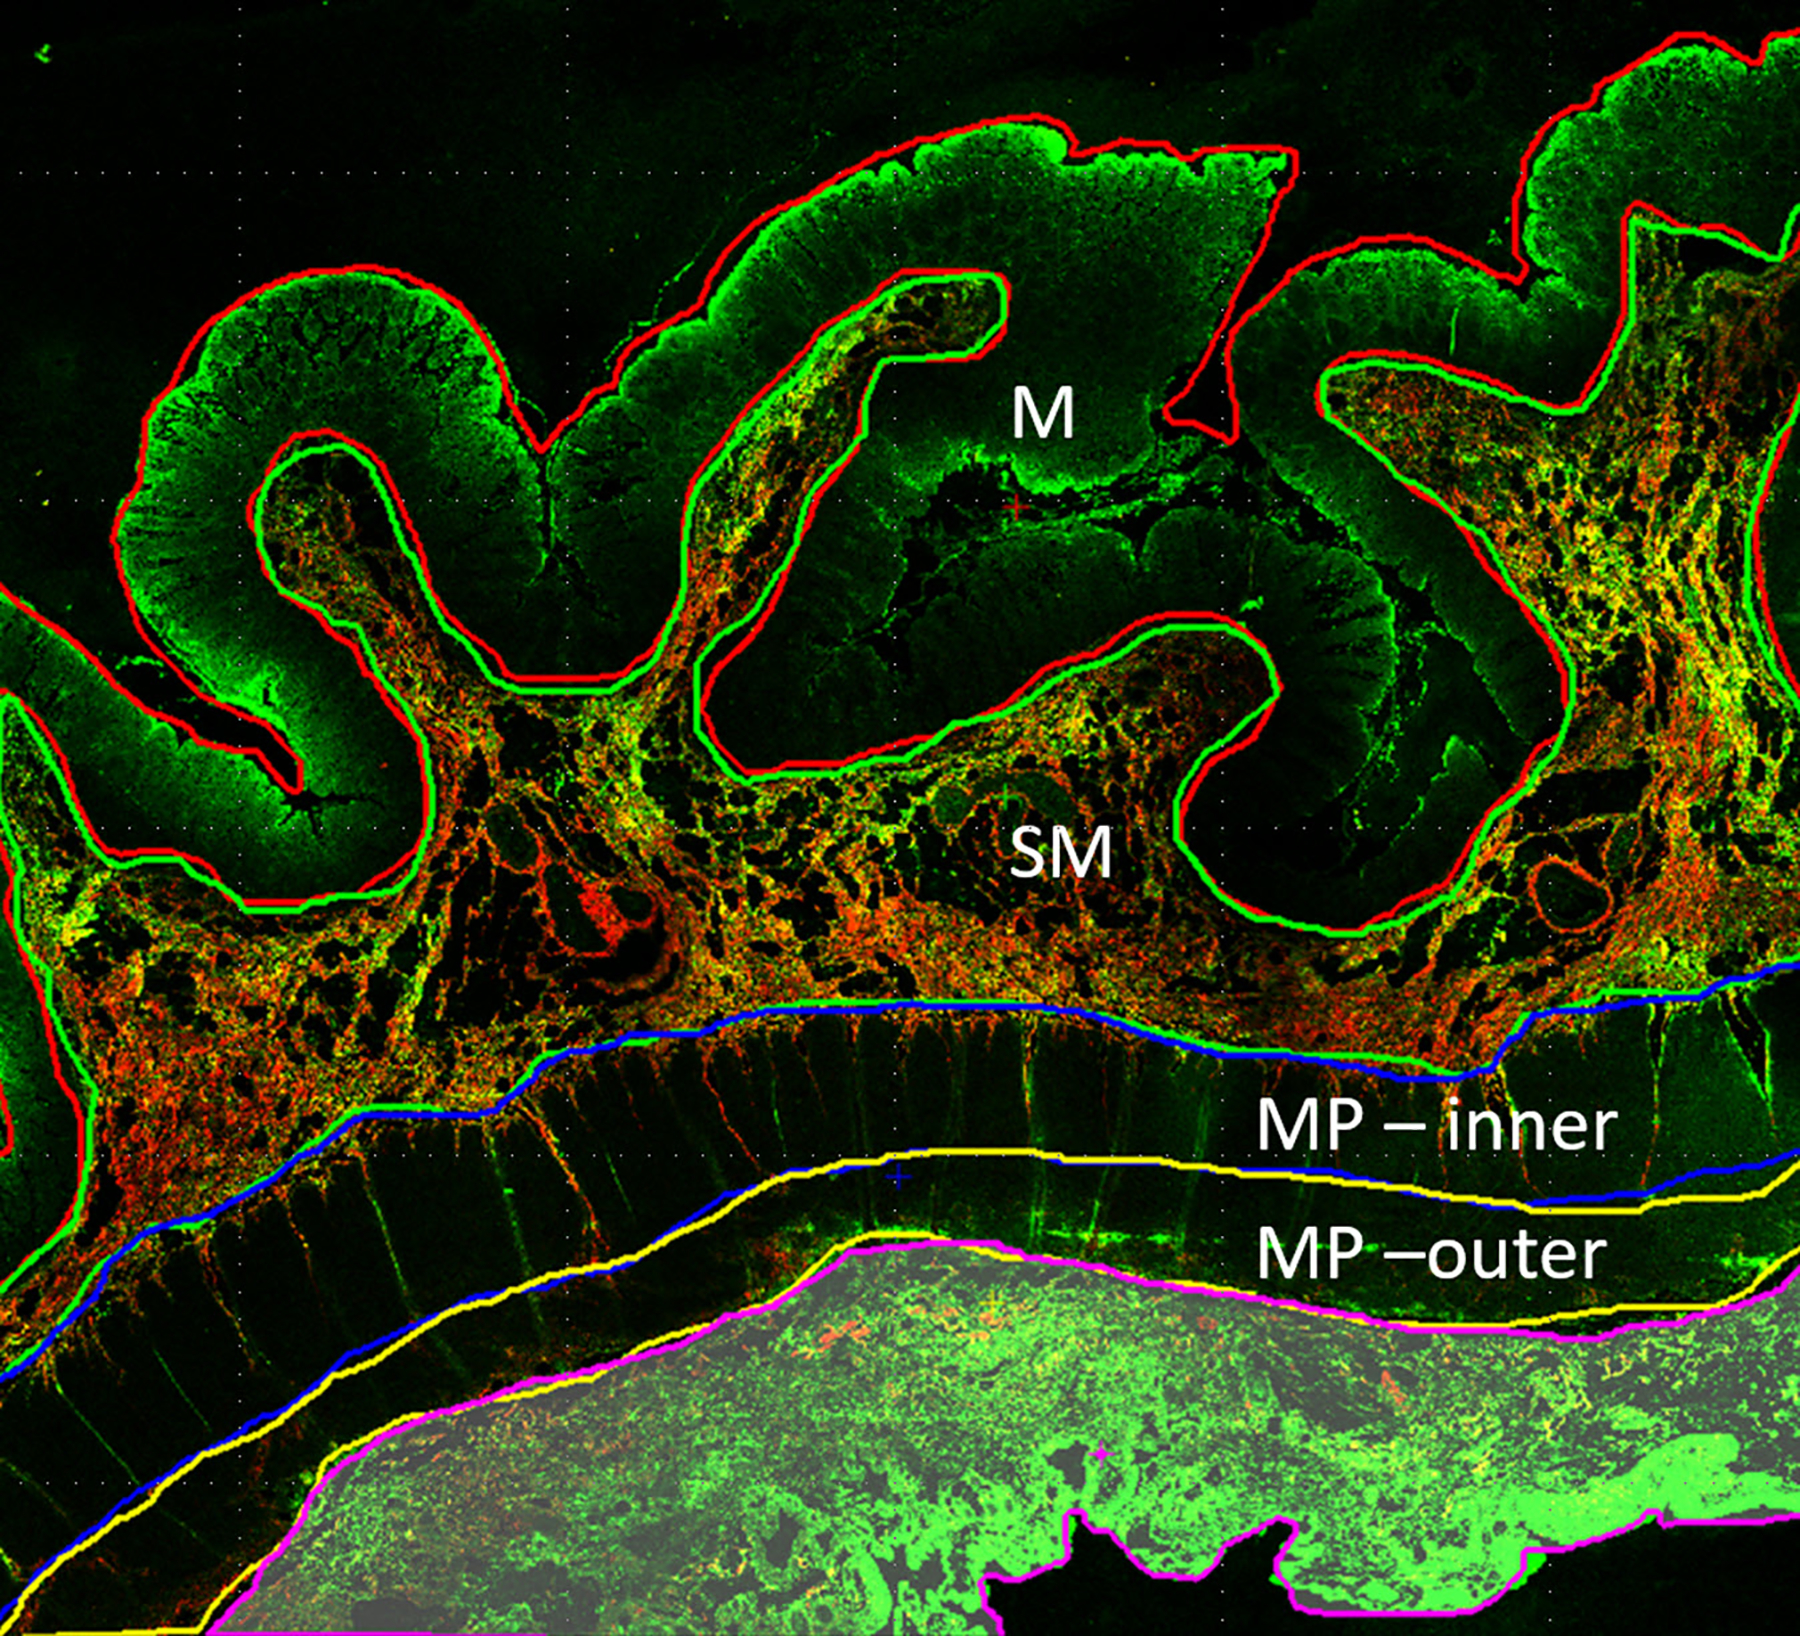
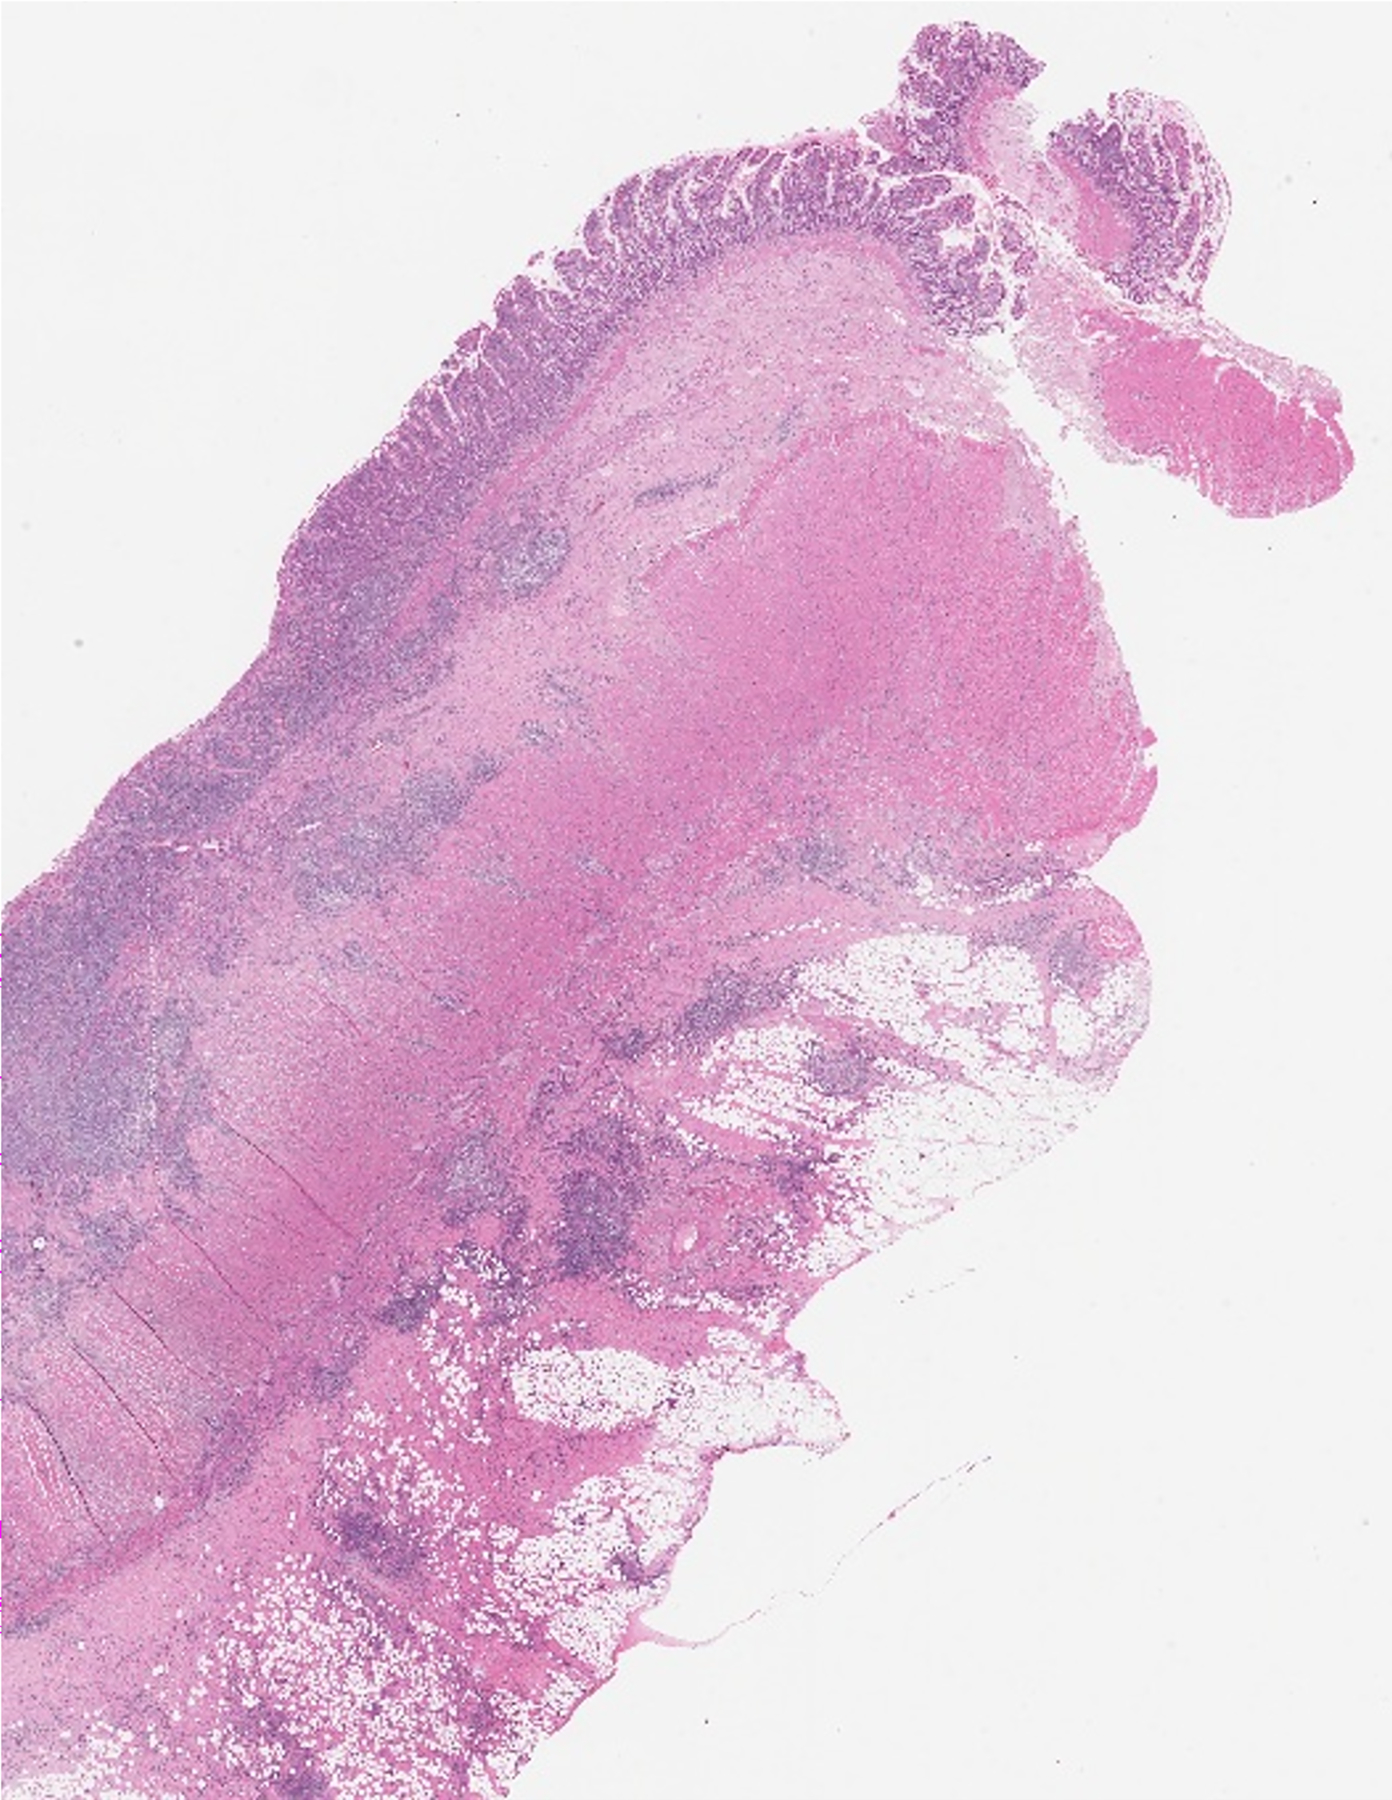
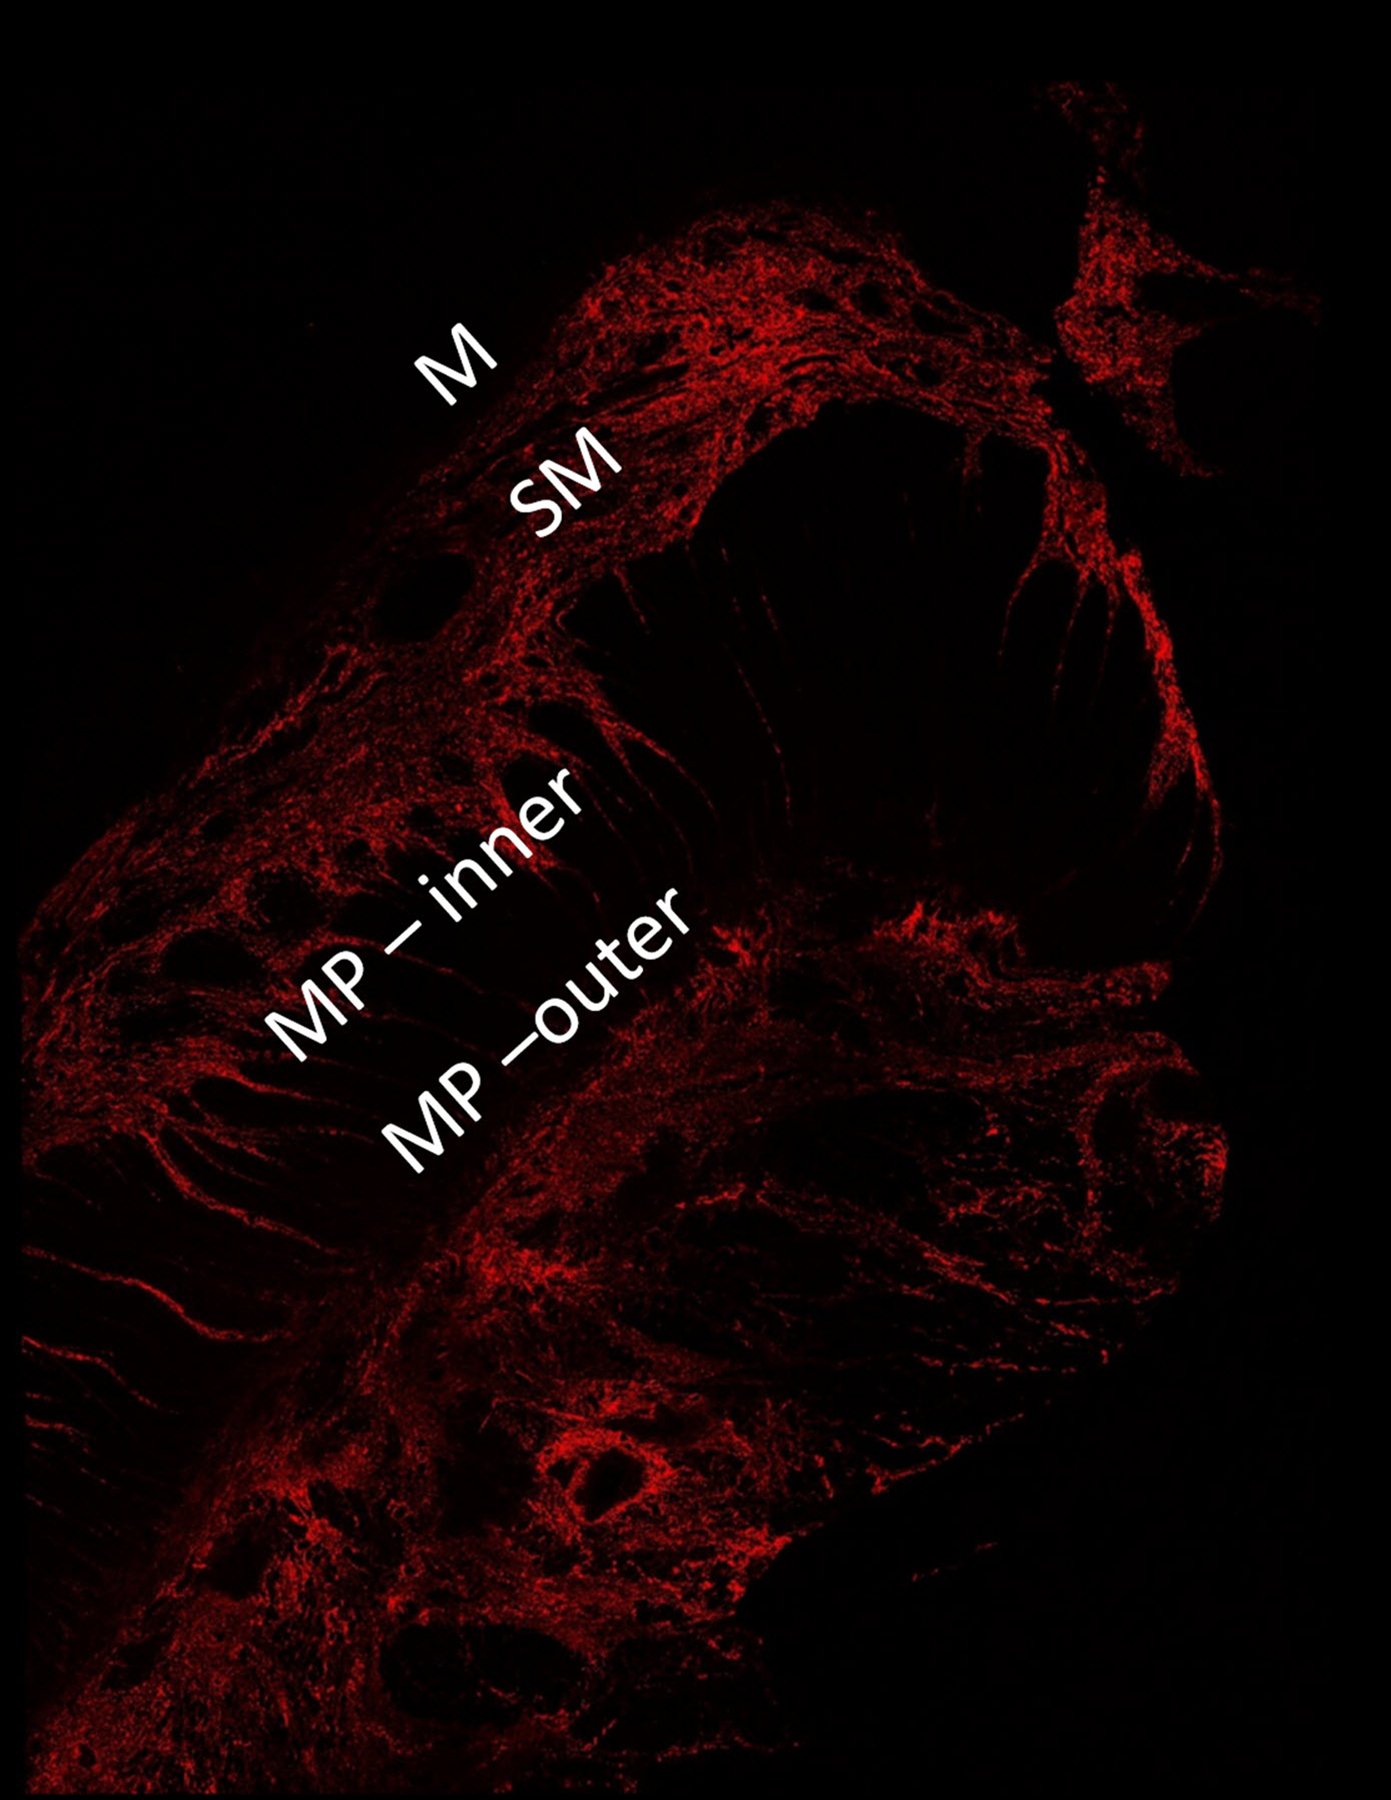
A 16-year-old girl with stricturing Crohn disease affecting the terminal ileum. Hematoxylin and eosin stained transmural bowel wall histological specimens from the (a) unaffected small bowel surgical resection margin and (c) mid stricture, respectively. The unaffected margin appears normal, while the stricture shows abundant lymphoid tissue in the mucosa, submucosa and serosa as well as thickening of the muscularis propria. Confocal microscopy images from the (b) surgical margin and (d) stricture. Second harmonic imaging microscopy collagen signal is color-coded in red, while the non-collagen signal is color-coded in green. Colored lines separating the various layers of the bowel wall in figure part (b) were manually drawn using NIS-Elements imaging software (Nikon Instruments Inc., Melville, NY). Only collagen signal from the bowel wall is presented in figure part (d). M mucosa, SM submucosa, MP–inner muscularis propria, inner (circular) layer, MP – outer muscularis propria, outer (longitudinal) layer
Statistical analysis
Continuous data were summarized as medians and interquartile ranges, while categorical data were summarized as counts and percentages. Mean bowel wall and overall right lower quadrant SWS also were calculated for each level of abdominal strain. The Mann-Whitney U test was used to compare continuous variables between groups. Spearman rank-order correlation was used to assess the relationships between bowel wall and overall right lower quadrant SWS measurements and 1) bowel wall histological scores and 2) bowel wall collagen as measured by SHIM. These associations were assessed for the entire bowel wall as well as by individual bowel wall layer based on a priori study design.
A P-value <0.05 was considered significant for all statistical inference testing. P-value adjustment for multiple comparisons was not performed due to the exploratory nature of our study and the desire to avoid making a type II error. Statistical analyses were performed using MedCalc Statistical Software version 20.009 (MedCalc Software Ltd., Ostend, Belgium; https://www.medcalc.org; 2021). Based on expected correlation coefficients of 0.6, power of 80% (i.e. 20% type II error rate), and two-sided alpha of 0.05 (i.e. 5% type I error rate), a total of 19 participants were enrolled for our study.
Results
Participants
Nineteen patients underwent research ultrasound imaging and ileal stricture resection during the study period. However, ultrasound SWE was unable to be performed in a single participant due to a lack of bowel wall thickening; this participant was excluded from our analyses (Fig. 3). The median participant age was 16.8 years. The median time between research ultrasound imaging and surgery was 0.5 days. Additional participant characteristics are presented in Table 1.
Fig. 3.
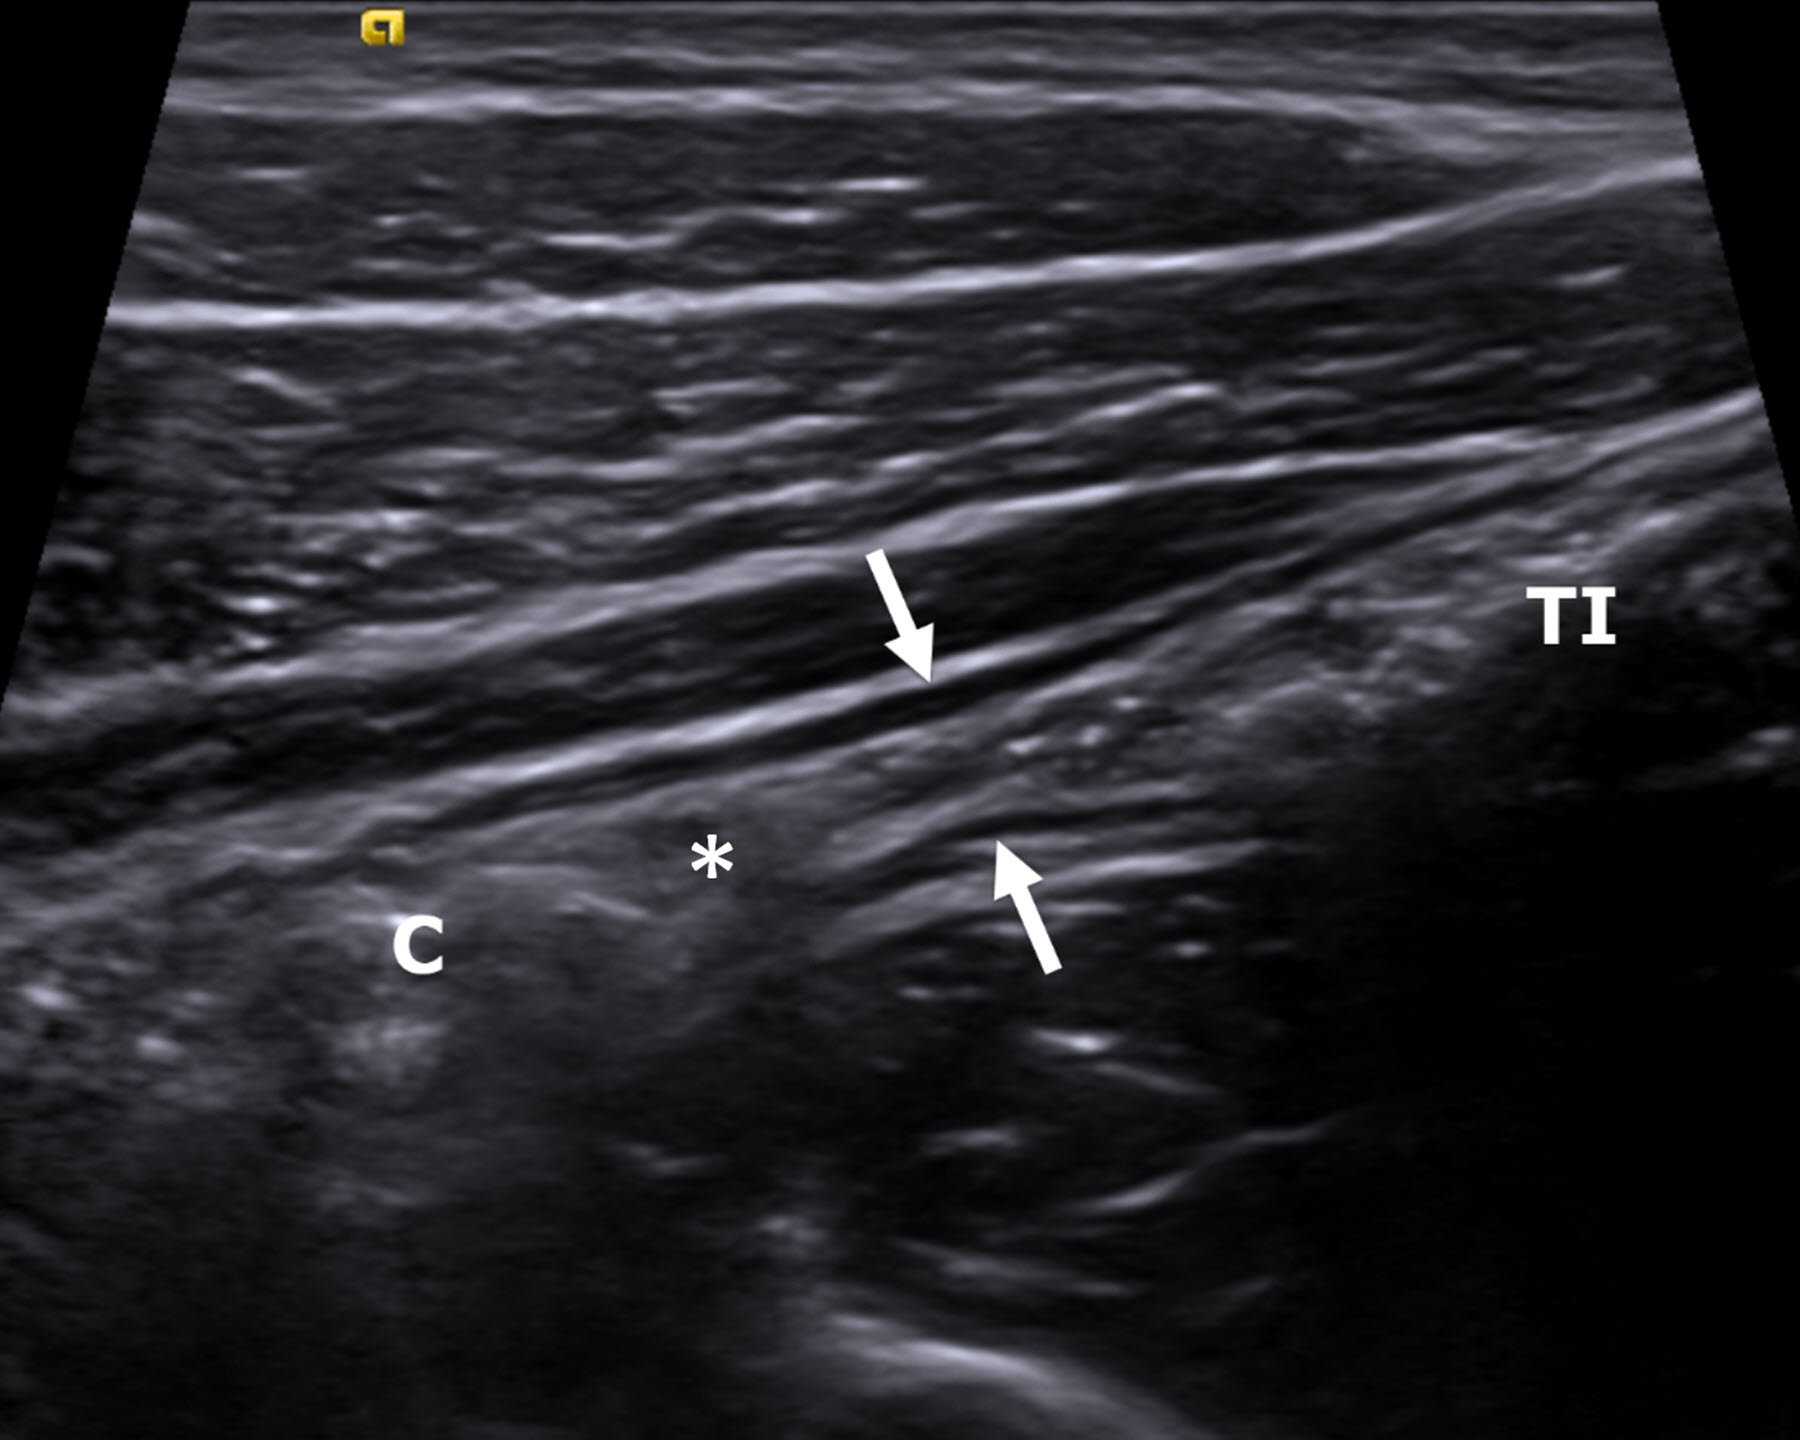
An 18-year-old man with Crohn disease and stricture based on the inability to pass an endoscope through the ileocecal valve. A longitudinal gray-scale ultrasound image of the terminal ileum (between arrows) shows luminal narrowing in the absence of bowel wall thickening. There is prominence of the upstream terminal ileum (TI) with intraluminal debris (small bowel feces). The ileocecal valve (*) and colon (C) are visible. Ultrasound shear wave elastography was not possible in this participant, as the bowel wall was too thin to reliably measure shear wave speed
Table 1.
Participant characteristics and ultrasound shear wave elastography summary measures (n=18)
| Median | Interquartile range | |
|---|---|---|
| Age (years) | 16.8 | 14.7–18.0 |
| Sex | ||
| Female (n, %) | 10 (55.6%) | – |
| Male (n, %) | 8 (44.4%) | – |
| Body mass index (kg/m2) | 20.6 | 16.4–22.6 |
| Time between diagnosis and surgery (days) | 578 | 156–1,762 |
| Time between research ultrasound examination and surgery (days) | 0.5 | 0–5.5 |
| Bowel wall shear wave speed (m/s) | ||
| 0% abdominal strain | 2.67 (2.47) | 1.76–2.93 |
| 10% abdominal strain | 2.44 (2.70) | 2.03–3.38 |
| 20% abdominal strain | 2.77 (2.93) | 2.16–3.67 |
| Overall right lower quadrant shear wave speed (m/s) | ||
| 0% abdominal strain | 2.46 (2.50) | 1.98–2.73 |
| 10% abdominal strain | 2.49 (2.62) | 2.13–2.98 |
| 20% abdominal strain | 2.58 (2.88) | 2.22–3.41 |
Medians and interquartile ranges are presented, unless otherwise indicated. Mean shear wave speed measurements are also provided in parentheses
Ultrasound shear wave elastography
Bowel wall median SWS was 2.67 m/s, 2.44 m/s and 2.77 m/s for 0%, 10% and 20% abdominal strain, respectively. Bowel wall mean SWS increased with each level of abdominal strain, increasing from 2.47 m/s for 0% abdominal strain to 2.93 m/s for 20% abdominal strain.
Overall right lower quadrant median SWS was 2.46 m/s, 2.49 m/s and 2.58 m/s for 0%, 10% and 20% abdominal strain, respectively. Overall right lower quadrant mean SWS also increased with each level of abdominal strain, increasing from 2.50 m/s for 0% abdominal strain to 2.88 m/s for 20% abdominal strain.
Histopathology and SHIM
Entire and individual layer bowel wall median histological scores for active inflammation, chronic inflammation, fibrosis and smooth muscle hypertrophy from the resected ileal strictures are presented in Table 2.
Table 2.
Median histological active and chronic inflammation, fibrosis and smooth muscle hypertrophy scores using semiquantitative scoring system described by Chen et al. [1], including by individual bowel wall histological layer, from resected pediatric strictured ileal segments (n=18)
| Histological layer | Median | Interquartile range |
|---|---|---|
| Mucosa | ||
| Active inflammation (0–5) | 3.0 | 1.8–5.6 |
| Chronic inflammation (0–12) | 5.2 | 4.0–6.0 |
| Fibrosis (0–3) | 0 | 0–0.5 |
| Smooth muscle hypertrophy (0–3) | 1.7 | 0.5–2.4 |
| Submucosa | ||
| Active inflammation (0–9) | 0 | 0–0.6 |
| Chronic inflammation (0–9) | 4.3 | 3.2–5.0 |
| Fibrosis (0–3) | 1.3 | 0.2–2.0 |
| Smooth muscle hypertrophy (0–3) | 1.5 | 0.5–2.3 |
| Muscularis propria | ||
| Active inflammation (0–9) | 0 | 0–0.3 |
| Chronic inflammation (0–9) | 1.8 | 0.6–3.0 |
| Fibrosis (0–3) | 0 | 0–0.8 |
| Smooth muscle hypertrophy – inner (circular) layer (0–3) | 1.0 | 0.5–2.0 |
| Smooth muscle hypertrophy – outer (longitudinal) layer (0–3) | 0.5 | 0–1.9 |
| Entire bowel wall* | ||
| Active inflammation (0–33) | 3.0 | 2.2–6.4 |
| Chronic inflammation (0–30) | 10.4 | 9.2–12.1 |
| Fibrosis (0–9) | 2.1 | 0.4–2.8 |
| Smooth muscle hypertrophy (0–12) | 4.9 | 3.5–5.8 |
Median of summed scores of individual bowel wall histologic layers for each participant
Entire and individual layer bowel wall median SHIM collagen expression measurements from the resected ileal strictures and margin tissue specimens are presented in Table 3. There were significant differences in collagen measurements between the two specimen locations (stricture versus surgical margin) for the entire bowel wall (P=0.007) and muscularis propria outer layer (P=0.002) (Fig. 4).
Table 3.
Bowel wall median second harmonic imaging microscopy (SHIM) collagen measurements, including by individual bowel wall histological layer, from resected pediatric strictured ileal segments and small bowel surgical margins (n=18)
| Histological layer | Median | Interquartile range | P-value* |
|---|---|---|---|
| Entire bowel wall, stricture* | 0.17 | 0.11–0.27 | 0.007 |
| Stricture – mucosa | 0.001 | 0.0002–0.008 | 0.57 |
| Stricture – submucosa | 0.29 | 0.09–0.32 | 0.08 |
| Stricture – muscularis propria, inner (circular) layer | 0.15 | 0.09–0.18 | 0.37 |
| Stricture – muscularis propria, outer (longitudinal) layer | 0.10 | 0.06–0.12 | 0.002 |
| Entire bowel wall, surgical margin* | 0.14 | 0.08–0.17 | |
| Margin – mucosa | 0.001 | 0.0004–0.003 | |
| Margin – submucosa | 0.30 | 0.19–0.35 | |
| Margin – muscularis propria, inner (circular) layer | 0.12 | 0.05–0.16 | |
| Margin – muscularis propria, outer (longitudinal) layer | 0.03 | 0.02–0.04 |
Stricture versus small bowel surgical margin SHIM collagen measurements (Mann-Whitney U test)
Measurements are dimensionless, as they represent the ratio of collagen signal area to total area (both in μm2)
Fig. 4.
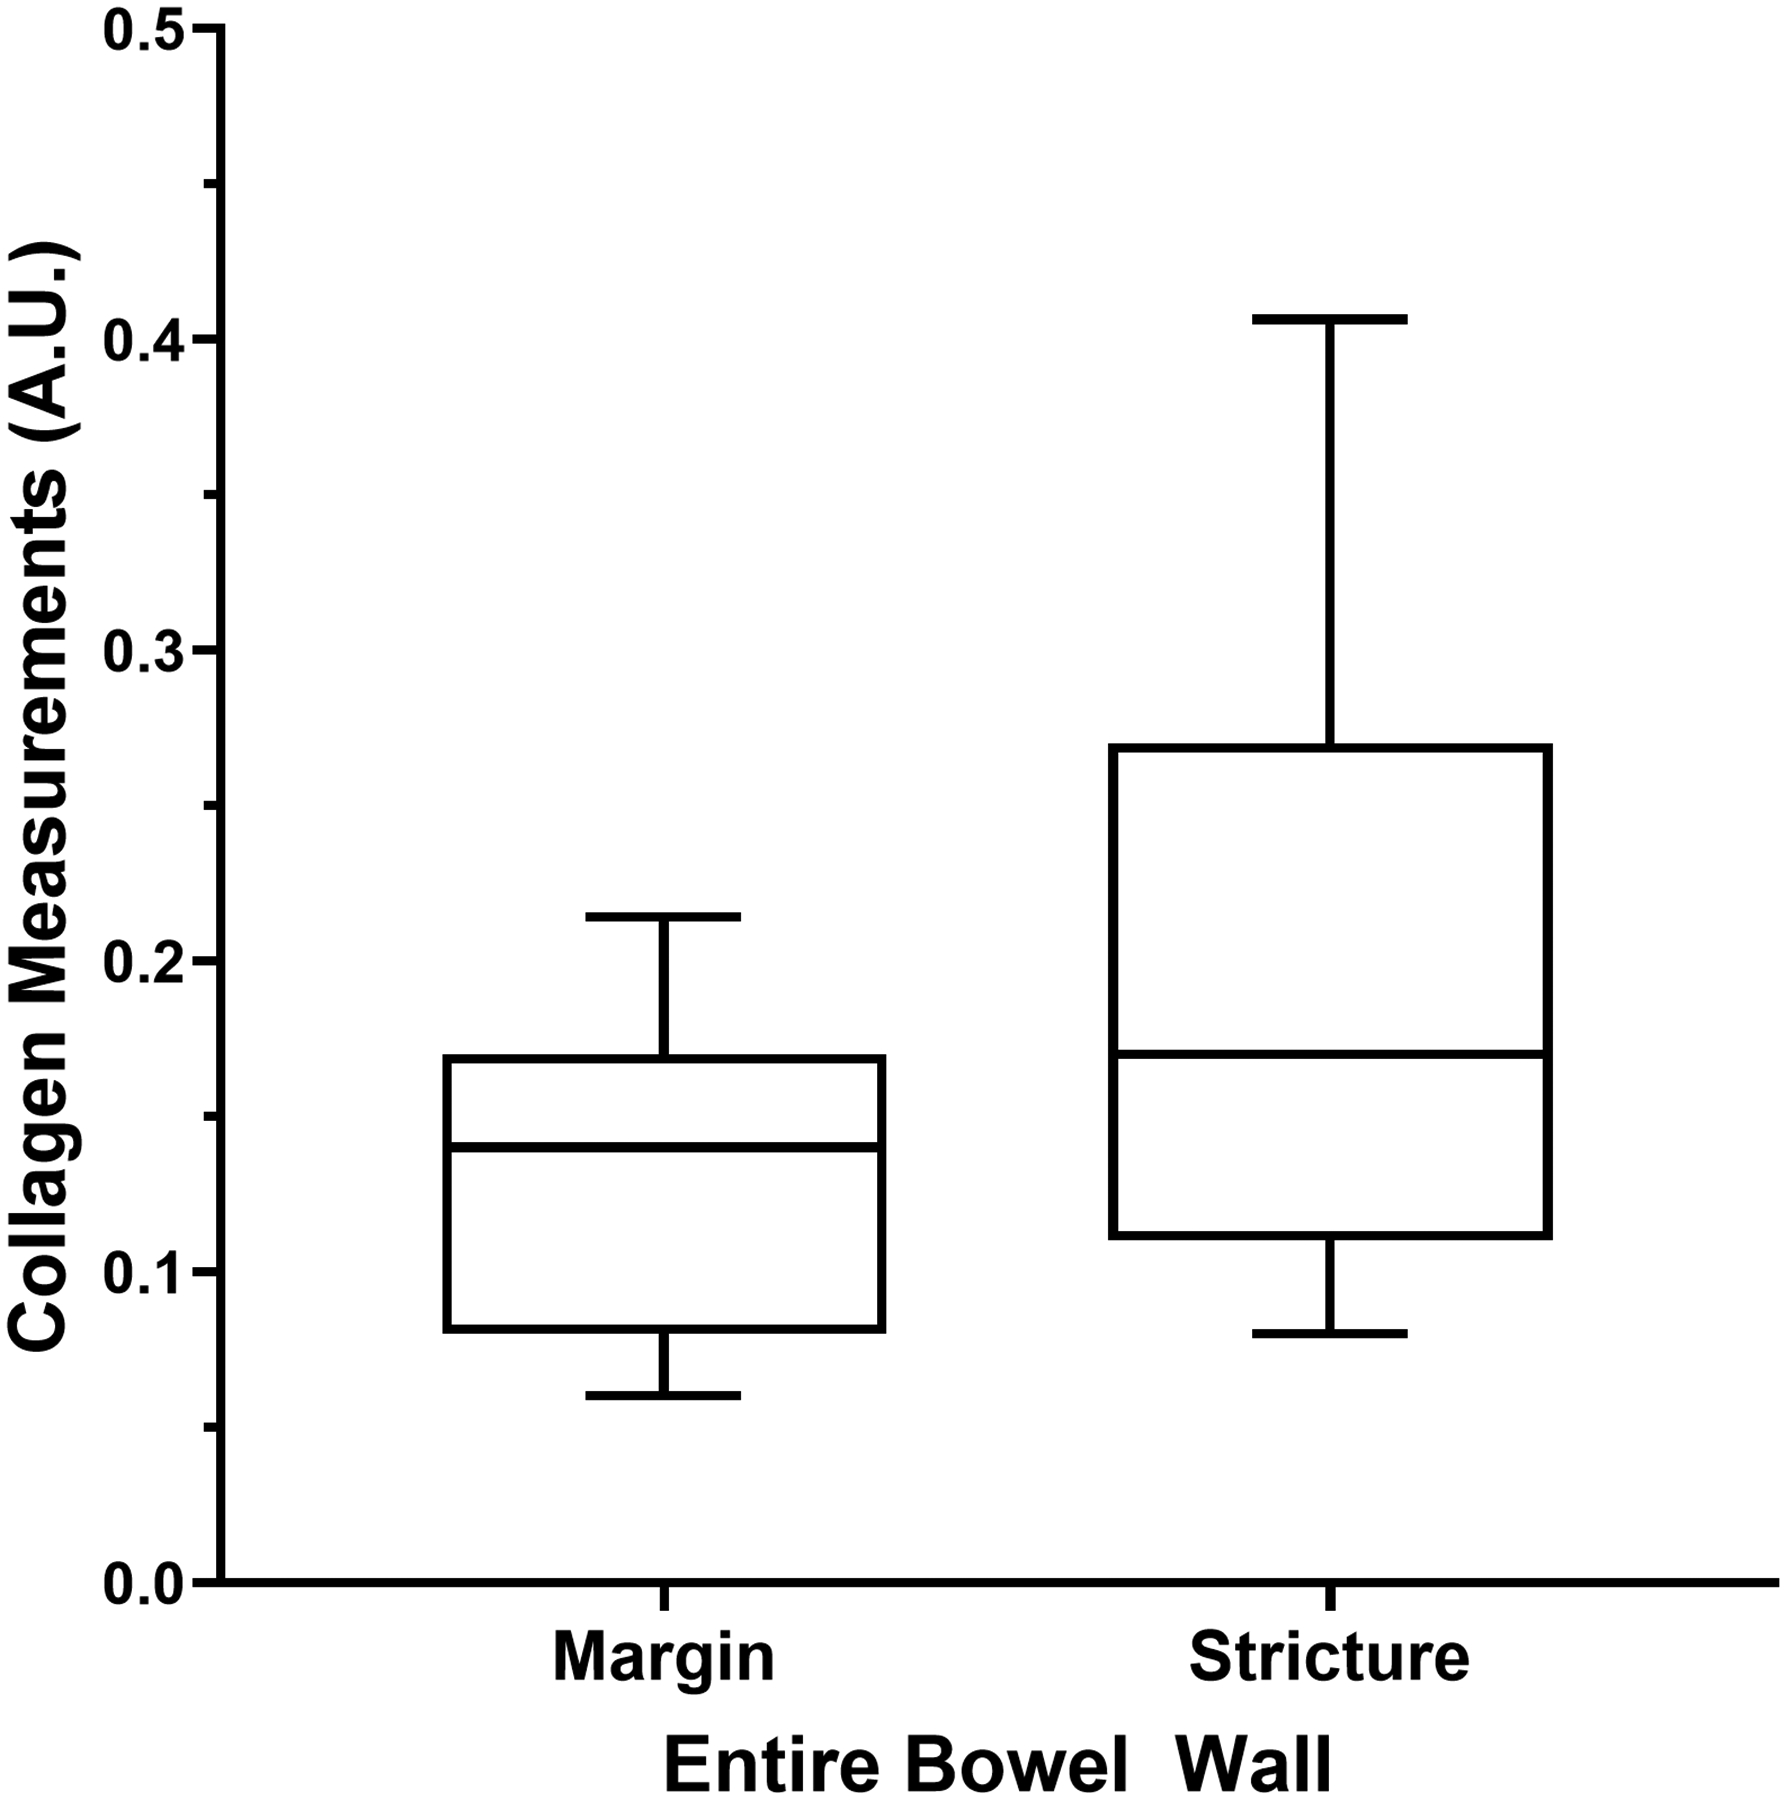
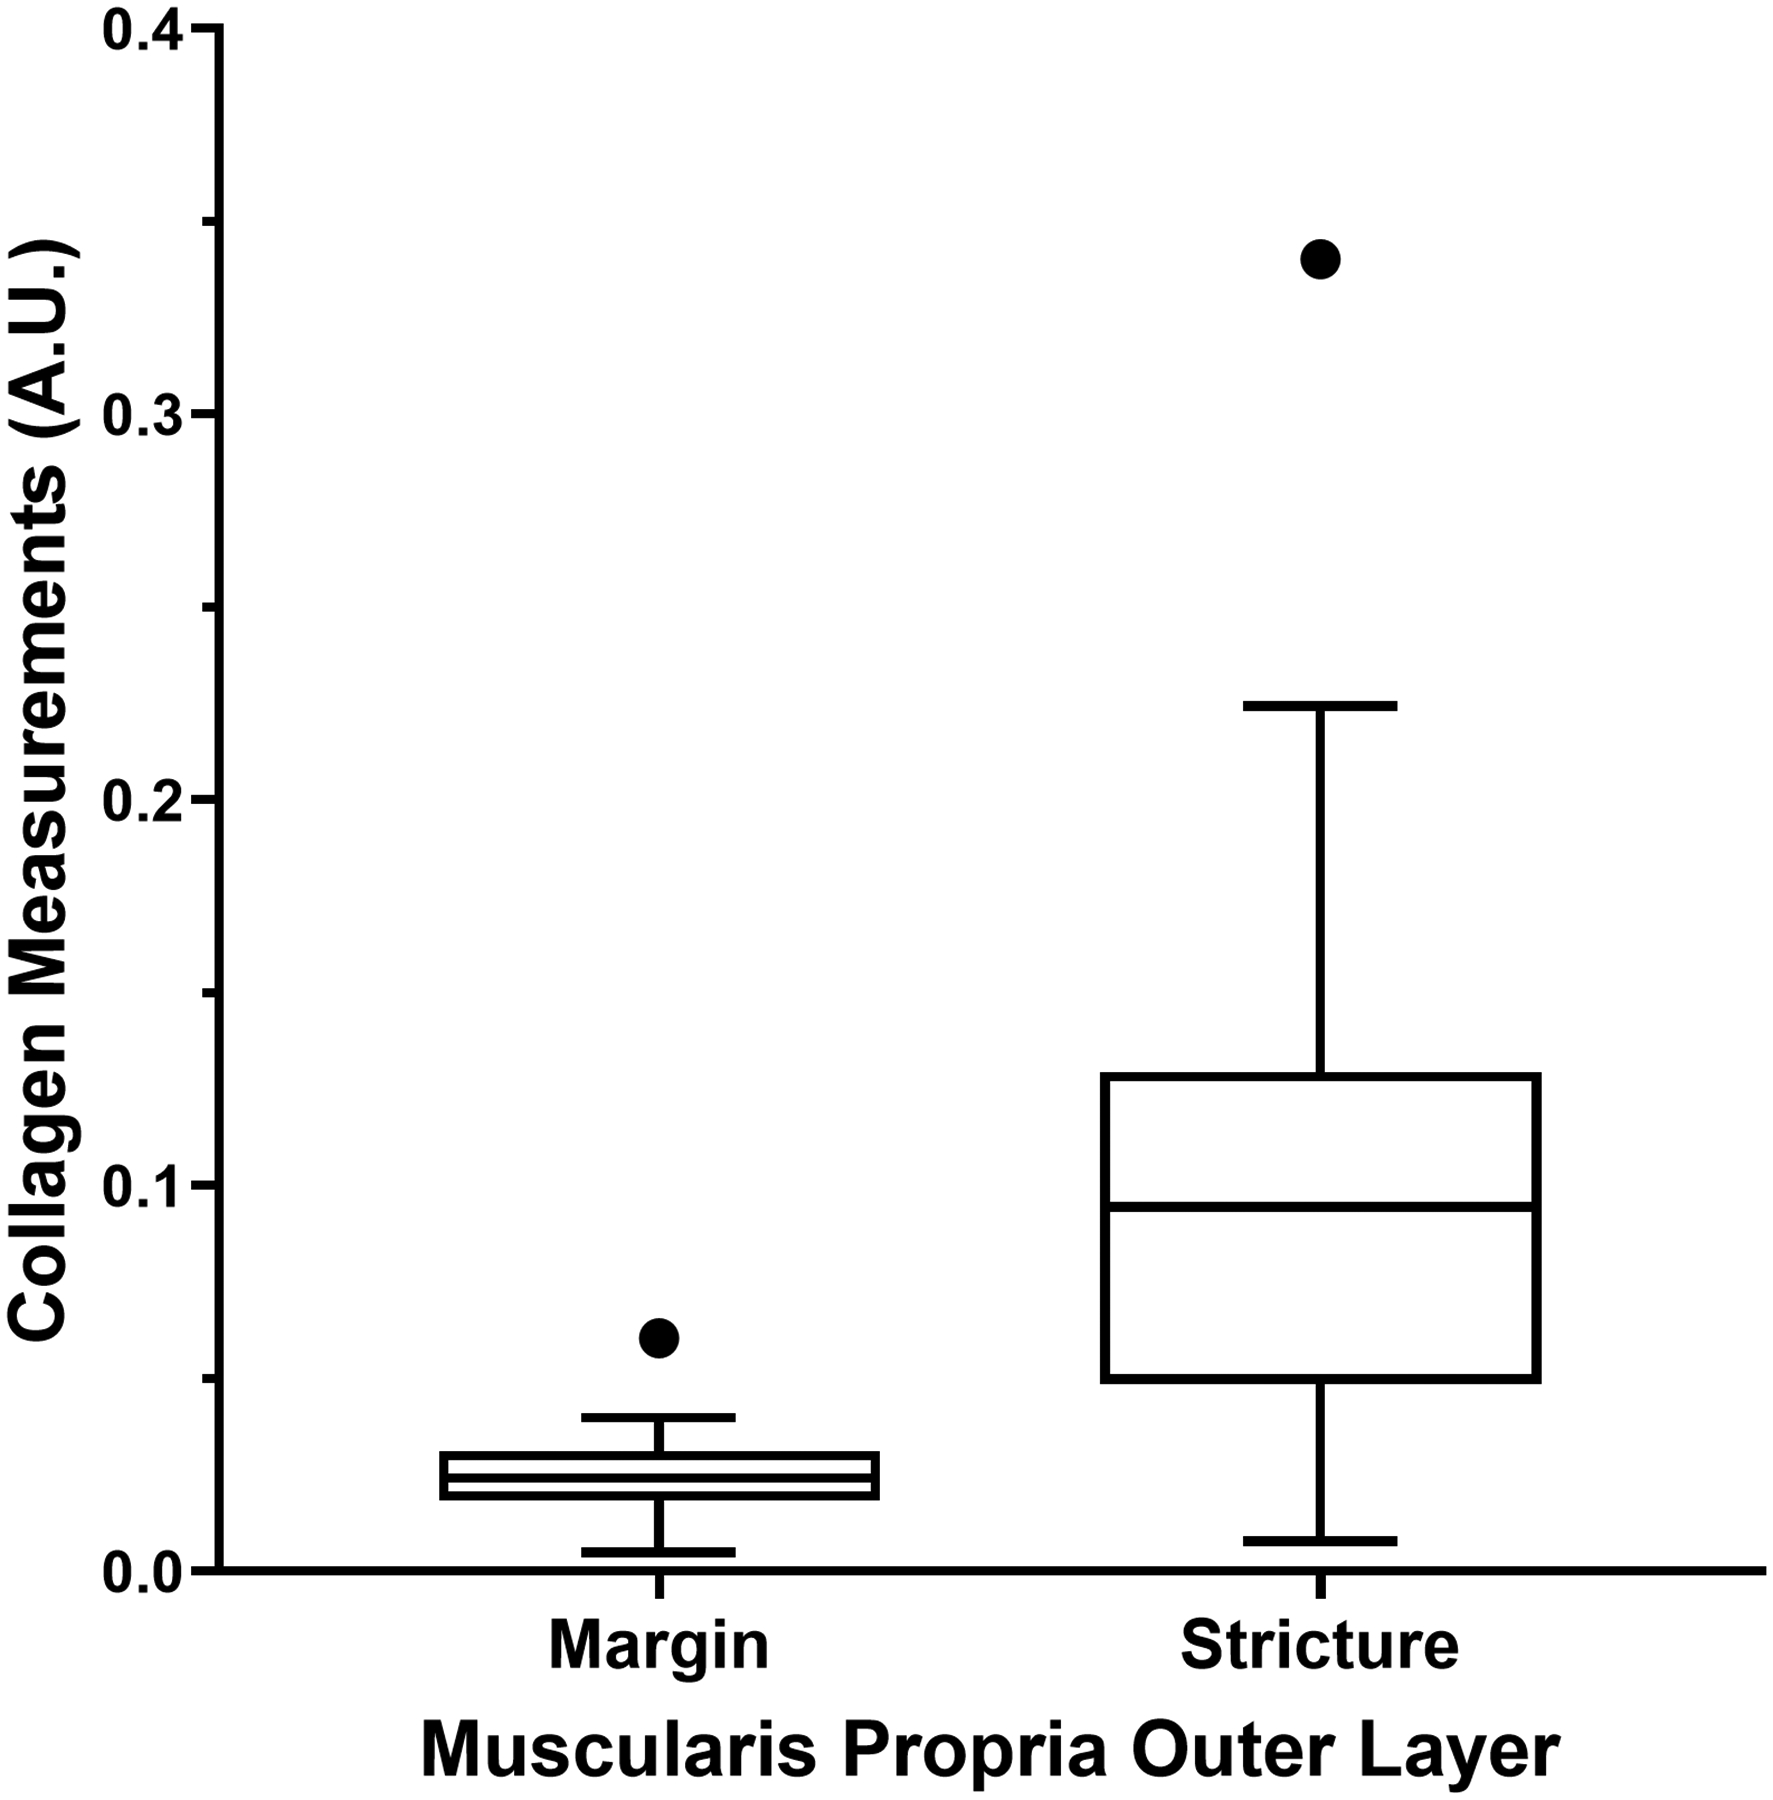
Tukey box plots show second harmonic imaging microscopy collagen signal in the bowel wall from resected pediatric strictured ileal and margin segments. a The entire bowel wall (P=0.007). b The muscularis propria outer layer (P=0.002)
Ultrasound shear wave elastography versus histopathology
Correlations between ultrasound SWE measurements and histopathology scores are presented in Table 4. There were significant negative correlations between histological mucosal active inflammation scores and multiple SWE metrics, including bowel wall stiffness with 10% abdominal strain (r=−0.50, P=0.04) and overall right lower quadrant stiffness with 20% abdominal strain (r=−0.69, P=0.0015). There were multiple significant positive correlations between histological muscularis mucosa inner layer smooth muscle hypertrophy scores and multiple SWE metrics, including bowel wall stiffness with 10% abdominal strain (r=0.72, P=0.002) and overall right lower quadrant stiffness with 20% abdominal strain (r=0.71, P=0.002) (Fig. 5).
Table 4.
Correlations between ultrasound shear wave elastography measurements and histopathology scores, including by bowel wall individual histological layer, from resected pediatric strictured ileal segments (n=18)
| Histological layer | Median BW SWS (0%) | Median BW SWS (10%) |
Median BW SWS (20%) | Median RLQ SWS (0%) |
Median RLQ SWS (10%) |
Median RLQ SWS (20%) |
|---|---|---|---|---|---|---|
| Mucosa | ||||||
| Active inflammation | −0.13 [−0.57, 0.38] (0.62) |
-0.50
[−0.79, −0.02] (0.04) |
−0.29 [−0.68, 0.22] (0.24) |
−0.39 [−0.73, 0.11] (0.11) |
-0.53
[−0.80, −0.07] (0.02) |
-0.69
[−0.88, −0.32] (0.0015) |
| Chronic inflammation | 0.15 [−0.36, 0.58] (0.56) |
0.17 [−0.33, 0.60] (0.49) |
−0.07 [−0.53, 0.42] (0.78) |
−0.01 [−0.49, 0.47] (0.95) |
0.01 [−0.47, 0.49] (0.95) |
−0.21 [−0.63, 0.29] (0.39) |
| Fibrosis | 0.41 [−0.10, 0.75] (0.10) |
0.47 [−0.03, 0.78] (0.06) |
0.48 [−0.02, 0.79] (0.053) |
0.15 [−0.37, 0.60] (0.55) |
0.27 [−0.26, 0.67] (0.29) |
0.19 [−0.33, 0.62] (0.46) |
| Smooth muscle hypertrophy | 0.24 [−0.29, 0.65] (0.36) |
−0.05 [−0.53, 0.45] (0.84) |
0.33 [−0.19, 0.71] (0.19) |
−0.09 [−0.56, 0.42] (0.73) |
0.18 [−0.35, 0.62] (0.50) |
0.11 [−0.40, 0.57] (0.67) |
| Submucosa | ||||||
| Active inflammation | −0.11 [−0.56, 0.39] (0.67) |
−0.35 [−0.71, 0.15] (0.16) |
−0.24 [−0.64, 0.27] (0.34) |
−0.34 [−0.70, 0.16] (0.17) |
−0.43 [0.7–6, 0.06] (0.07) |
−0.43 [−0.76, 0.05] (0.07) |
| Chronic inflammation | −0.32 [−0.70, 0.18] (0.19) |
−0.05 [−0.52, 0.44] (0.83) |
−0.11 [−0.56, 0.39] (0.67) |
−0.15 [−0.59, 0.35] (0.56) |
0.01 [−0.47, 0.49] (0.96) |
0.17 [−0.33, 0.60] (0.49) |
| Fibrosis | −0.14 [−0.58, 0.36] (0.58) |
0.17 [−0.34, 0.60] (0.50) |
0.16 [−0.35, 0.59] (0.54) |
0.04 [−0.45, 0.51] (0.88) |
0.13 [−0.37, 0.57] (0.60) |
0.37 [−0.14, 0.72] (0.13) |
| Smooth muscle hypertrophy | 0.20 [−0.31, 0.62] (0.44) |
0.11 [−0.39, 0.56] (0.67) |
0.09 [−0.40, 0.55] (0.71) |
−0.12 [−0.57,0.38] (0.62) |
−0.001 (−0.48, 0.48) (>0.99) |
−0.19 [−0.61, 0.32] (0.45) |
| Muscularis propria | ||||||
| Active inflammation | 0.17 [−0.33, 0.60] (0.49) |
0.06 [−0.43, 0.53] (0.80) |
0.14 [−0.36, 0.58] (0.57) |
0.007 [−0.47, 0.48] (0.98) |
−0.08 [−0.54, 0.41] (0.75) |
0.009 [−0.47, 0.49] (0.97) |
| Chronic inflammation | 0.13 [−0.37, 0.57] (0.60) |
0.007 [−0.47, 0.48] (0.98) |
0.10 [−0.39, 0.56] (0.68) |
0.03 [−0.45, 0.50] (0.90) |
−0.07 [−0.53, 0.42] (0.79) |
−0.14 [−0.58, 0.37] (0.59) |
| Fibrosis | −0.22 [−0.63, 0.29] (0.38) |
0.03 [−0.46, 0.50] (0.91) |
0.15 [−0.36, 0.58] (0.56) |
−0.03 [−0.50, 0.46] (0.91) |
0.06 [−0.43, 0.52] (0.81) |
0.30 [−0.21, 0.68] (0.23) |
| Smooth muscle hypertrophy, inner (circular) layer | 0.39 [−0.12, 0.74] (0.12) |
0.72
[0.36, 0.90] (0.002) |
0.63
[0.21, 0.86] (0.007) |
0.62
[0.19, 0.85] (0.009) |
0.66
[0.25, 0.87] (0.005) |
0.71
[0.32, 0.89] (0.002) |
| Smooth muscle hypertrophy, outer (longitudinal) layer | −0.44 [−0.77, 0.06] (0.07) |
0.15 [−0.37, 0.60] (0.56) |
−0.06 [−0.54, 0.44] (0.81) |
−0.20 [−0.63, 0.33] (0.45) |
−0.07 [−0.54, 0.44] (0.79) |
0.17 [−0.36, 0.61] (0.52) |
| Entire bowel wall | ||||||
| Active inflammation | −0.09 [−0.54, 0.41] (0.73) |
−0.42 [−0.75, 0.07] (0.08) |
−0.20 [−0.62, 0.31] (0.42) |
−0.38 [−0.73, 0.12] (0.12) |
-0.49
[−0.78, −0.01] (0.04) |
-0.60
[−0.84, −0.17] (0.009) |
| Chronic inflammation | −0.08 [−0.54, 0.41] (0.75) |
0.08 [−0.42, 0.54] (0.76) |
−0.16 [−0.59, 0.35] (0.53) |
−0.13 [−0.58, 0.37] (0.59) |
−0.11 [−0.56, 0.39] (0.68) |
−0.24 [−0.64, 0.27] (0.34) |
| Fibrosis | 0.06 [−0.43, 0.52] (0.81) |
0.38 [−0.12, 0.73] (0.12) |
0.39 [−0.11, 0.73] (0.11) |
0.08 [−0.42, 0.53] (0.77) |
0.28 [−0.23, 0.67] (0.26) |
0.43 [−0.06, 0.75] (0.08) |
| Smooth muscle hypertrophy | 0.19 [−0.32, 0.61] (0.45) |
0.35 [−0.16, 0.71] (0.16) |
0.47
[−0.006, 0.78] (0.047) |
−0.01 [−0.49, 0.47] (0.96) |
0.35 [−0.16, 0.71] (0.16) |
0.32 [−0.19, 0.69] (0.20) |
| Smooth muscle hypertrophy-to-inflammation | 0.01 [−0.47–0.49] (0.96) |
0.53
[0.07–0.81] (0.02) |
0.39 [−0.10–0.73] (0.11) |
0.20 [−0.31–0.62] (0.42) |
0.51
[0.047–0.80] (0.03) |
0.67
[0.28–0.87] (0.002) |
BW bowel wall, RLQ right lower quadrant, SWS shear wave speed
95% confidence intervals are in brackets, and P-values are in parentheses. The relationships between entire bowel wall histological smooth muscle hypertrophy-to-inflammation and shear wave elastography metrics are also presented. Significant correlations are in bold
Fig. 5.
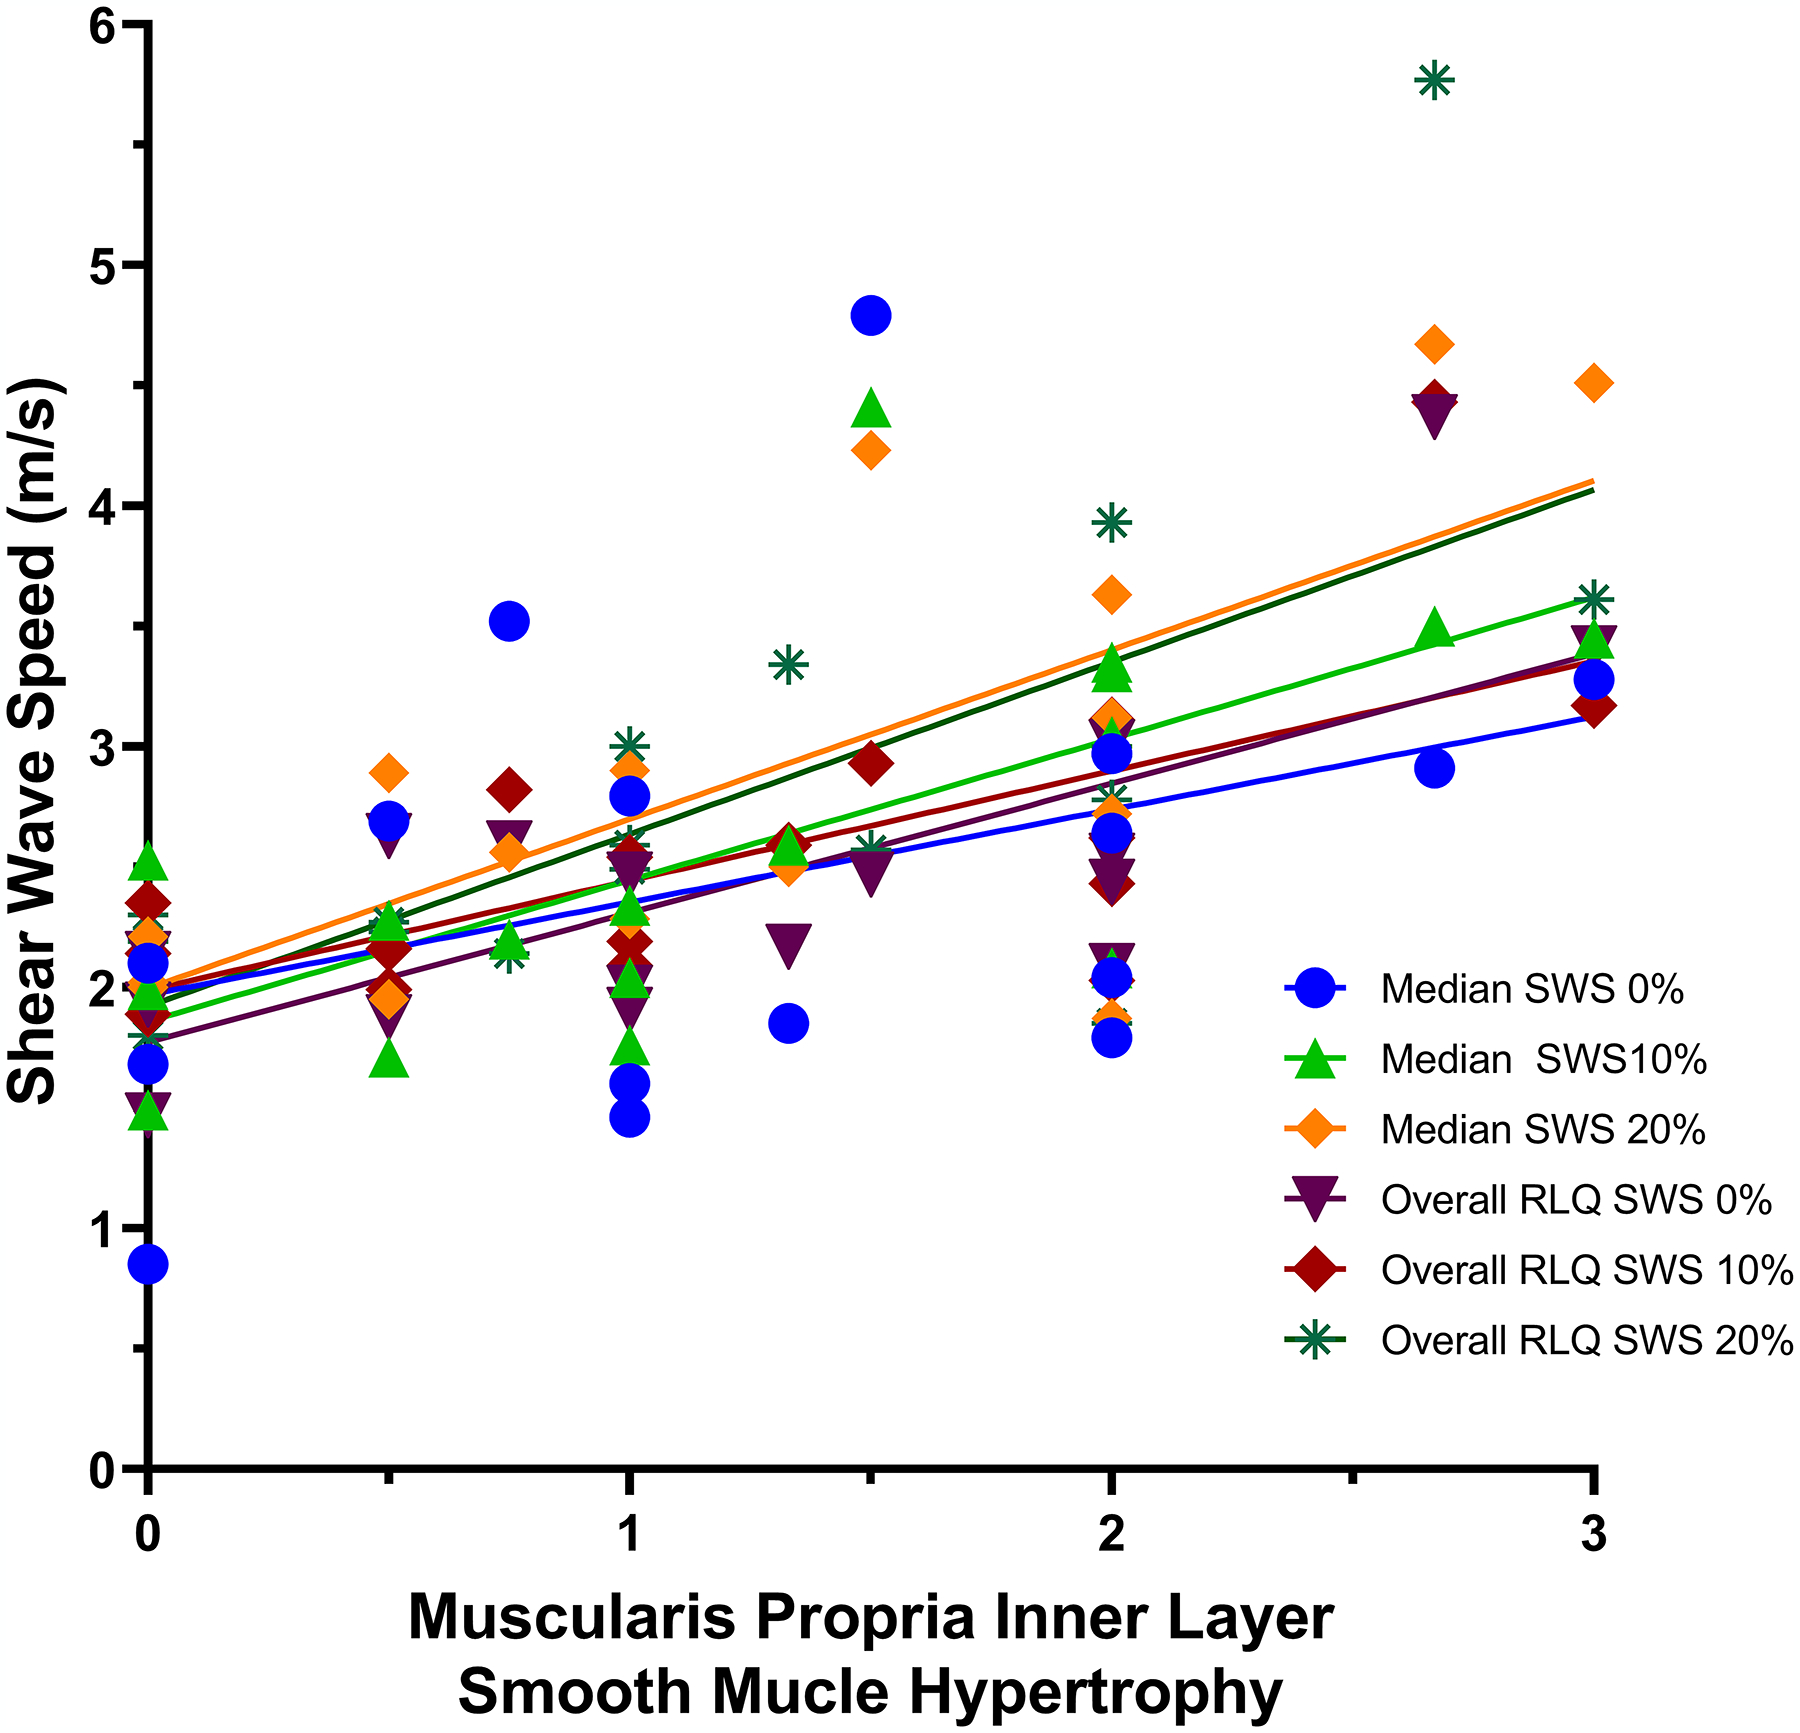
A scatter plot shows the relationships between muscularis propria inner layer smooth muscle hypertrophy histology scores and both median bowel wall and overall right lower quadrant (RLQ) shear wave speed (SWS) measurements with differing amounts of abdominal strain, as presented in Table 4 (n=18). Least square fit lines show that smooth muscle proliferation (x-axis, based on pathologist scoring) is associated with increasing bowel wall and overall right lower quadrant stiffness. Interestingly, the fit lines for bowel wall and overall right lower quadrant SWS measurements obtained using 20% abdominal strain are nearly identical, having the steepest slopes. This suggests that both of these particular methods provide similar levels of discrimination of differing amounts of bowel wall muscularis propria inner layer smooth muscle hypertrophy
There also were significant correlations between histological entire bowel wall active inflammation and smooth muscle hypertrophy scores and SWE metrics. For example, there was a significant negative correlation between entire bowel wall active inflammation and overall right lower quadrant stiffness with 20% abdominal strain (r=−0.60, P=0.009). There was a significant positive correlation between entire bowel wall smooth muscle hypertrophy and bowel wall stiffness with 20% abdominal strain (r=0.47, P=0.047). The ratio of entire bowel wall histological smooth muscle hypertrophy-to-inflammation was positively correlated with overall right lower quadrant stiffness with 20% abdominal strain (r=0.67, P=0.002).
There were no significant correlations between histological bowel wall fibrosis and any measure of bowel wall or overall right lower quadrant stiffness (all P-values >0.05).
Ultrasound shear wave elastography versus SHIM
Correlations between ultrasound SWE measurements and SHIM collagen measurements are presented in Table 5. There were no significant correlations between entire bowel wall, mucosal, submucosal or muscularis propria (inner or outer layers) collagen signal and any measure of bowel wall or overall right lower quadrant stiffness.
Table 5.
Correlations between ultrasound shear wave elastography measurements and second harmonic imaging microscopy (SHIM) collagen measurements, including by individual bowel wall histological layer, from resected pediatric strictured ileal segments (n=18)
| Histological layer | Median BW SWS (0%) | Median BW SWS (10%) |
Median BW SWS (20%) | Median RLQ SWS (0%) |
Median RLQ SWS (10%) |
Median RLQ SWS (20%) |
|---|---|---|---|---|---|---|
| Entire bowel wall | −0.44 [−0.76–0.05] (p=0.07) |
−0.10 [−0.55–0.40] (p=0.69) |
−0.25 [−0.65–0.26] (p=0.33) |
−0.18 [−0.60–0.33] (p=0.48) |
−0.01 [−0.49–0.47] (p=0.96) |
0.11 [−0.39–0.56] (p=0.66) |
| Mucosa | 0.13 [−0.37–0.58] (p=0.60) |
0.15 [−0.36–0.58] (p=0.56) |
0.22 [−0.29–0.63] (p=0.39) |
0.31 [−0.20–0.69] (p=0.21) |
0.44 [−0.05–0.76] (p=0.07) |
0.41 [−0.09–0.74] (p=0.09) |
| Submucosa | −0.05 [−0.52–0.44] (p=0.84) |
0.07 [−0.43–0.53] (p=0.79) |
−0.031 [−0.49–0.47] (p=0.96) |
0.15 [−0.36–0.58] (p=0.56) |
0.23 [−0.28–0.64] (p=0.35) |
0.26 [−0.25–0.66] (p=0.29) |
| Muscularis propria, inner layer | 0.31 [−0.22–0.69] (p=0.23) |
0.21 [−0.31–0.64] (p=0.41) |
0.25 [−0.27–0.66] (p=0.33) |
0.39 [−0.12–0.74] (p=0.12) |
0.43 [−0.08–0.76] (p=0.09) |
0.38 [−0.14–0.73] (p=0.14) |
| Muscularis propria, outer layer | 0.20 [−0.39–0.67] (p=0.50) |
0.28 [−0.31–0.71] (p=0.33) |
−0.002 [−0.54–0.54] (p>0.99) |
0.22 [−0.37–0.68] (p=0.45) |
0.34 [−0.25–0.75] (p=0.23) |
0.21 [−0.37–0.68] (p=0.47) |
95% confidence intervals are in brackets, and P-values are in parentheses
BW bowel wall, RLQ right lower quadrant, SWS shear wave speed
There were no significant relationships between bowel wall SWE measurements and mucosal, submucosal or muscularis propria outer layer thickness as measured by confocal microscopy (P-values >0.05). There were significant positive correlations between muscularis propria inner layer thickness and overall right lower quadrant stiffness, including with 0% (r=0.60 [95% confidence interval (CI): 0.15–0.84], P=0.01), and 20% (r=0.50 [95% CI: 0.01–0.80], P=0.04) abdominal strain; there was no significant association between muscularis propria inner layer thickness and overall right lower quadrant stiffness with 10% abdominal strain (r=0.47 [95% CI: −0.03–0.78], P=0.06).
Discussion
Our study has shown that both bowel wall and overall right lower quadrant SWS measurements are significantly associated with histological mucosal active inflammation and muscularis propria inner layer smooth muscle hypertrophy. This finding supports our a priori hypothesis that increasing smooth muscle hypertrophy is associated with increasing bowel wall and overall right lower quadrant stiffness as determined by ultrasound SWE. However, we demonstrated no significant associations between bowel wall fibrosis, either by histological scoring or SHIM, and any of our ultrasound SWE metrics. Furthermore, it is important to also note there were no significant associations between ultrasound stiffness measurements and patient age, time from diagnosis or maximum bowel wall thickness.
Our results are in mixed agreement with the small number of previous investigations that used ultrasound SWE to assess the bowel in preclinical animal models of Crohn disease as well as preliminary human studies. Dillman et al. [8] used ultrasound SWE to explore intestinal stiffness in the trinitrobenzene sulfonic acid (TNBS) rodent model that recapitulates the histological features of Crohn disease [8]. In that study, ultrasound SWS helped distinguish animals with active inflammation of the bowel wall from animals with bowel wall fibrosis. Furthermore, animals with active inflammation and fibrosis, respectively, both demonstrated linear increases in measured SWS with increasing abdominal strain, similar to our study, with their slopes differing from one another. Another study by Dillman et al. [9] performed ultrasound SWE on freshly resected bowel from patients with inflammatory bowel disease, showing that ex vivo stiffness measurements were higher in patients with greater amounts of histological fibrosis. Our current human in vivo study conflicts with these previous two studies, as we have failed to show any relationship between bowel wall fibrosis and ultrasound stiffness measurements, using both histological scoring and SHIM collagen signal as reference standards. It also is worth noting that neither of the two comparative studies above evaluated the association between bowel wall SWS and smooth muscle hypertrophy.
Lu et al. [10] prospectively assessed bowel wall stiffness using SWE in cohort of Crohn disease patients, a portion of whom went on to intestinal resections. In their study, similar to ours, smooth muscle hypertrophy was a more common histological feature of strictured bowel specimens than was fibrosis. Also, similar to our study, they observed a significant positive relationship between bowel wall SWS measurements and histological smooth muscle hypertrophy, but no significant relationship between ultrasound stiffness and histological fibrosis. Ding et al. [11] evaluated 25 patients with stricturing Crohn disease using ultrasound SWE and found a sensitivity of 75% and specificity of 100% for discriminating predominately inflammatory from primarily fibrotic bowel segments, although it is unknown how stiffness measurements in their study correlate with transmural fibrosis and smooth muscle hypertrophy at histology.
In the current study, we not only assessed bowel wall stiffness, but we also were able to measure the stiffness (median SWS of a 3×3-cm elastogram) of the overall right lower quadrant which included not only the strictured bowel but also surrounding tissues, including the adjacent mesentery. In particular, this evaluation would have included any abnormal mesenteric fibrofatty proliferation, so-called creeping fat or fat wrapping, which has been shown to occur in patients with more severe intestinal inflammation and stricturing behavior [12, 13]. This perienteric tissue also produces a variety of adipokines, cytokines and growth factors, and may actually be a driver of disease progression and predictor of outcomes. Interestingly, our study suggests that including this surrounding tissue, which is known to be quite firm upon palpation, results in similar or perhaps even stronger associations between SWS measurements and histological mucosal active inflammation and muscularis propria inner layer smooth muscle hypertrophy (and histological smooth muscle hypertrophy-to-active inflammation ratio). While further research is needed, being able to potentially measure the stiffness of a relatively large single ROI that includes the bowel, as opposed to having to carefully place ROIs in the bowel wall while avoiding the lumen and surrounding soft tissues, has the potential to speed up the ultrasound SWE evaluation as well as increase the robustness of measurements.
Our study has multiple additional findings of note. First, we have demonstrated that smooth muscle hypertrophy is very common histological feature of resected ileal Crohn disease strictures in children, and that it may be more common than fibrosis based on histological scoring (8 of 19 stricture specimens demonstrated minimal or no fibrosis with an entire bowel wall histological fibrosis score ≤1, whereas 18 of 19 stricture specimens demonstrated considerable smooth muscle hypertrophy with an entire bowel wall histological smooth muscle hypertrophy score ≥3), consistent with the findings of Chen et al. [1]. This raises the possibility that any future anti-fibrotic medications that do not address abnormal smooth muscle proliferation may be ineffective. Second, bowel wall muscularis propria outer layer collagen (i.e. fibrosis) as measured by SHIM was significantly higher in strictures than in matched margin specimens, but not in any other bowel wall layer. This suggests that bowel wall scarring (i.e. fibrosis) as occurs in Crohn disease strictures may uniquely affect the outer bowel wall. Third, we have shown that both bowel wall and overall right lower quadrant stiffness increase with increasing abdominal strain (transducer preload), confirming the nonlinear elastic nature of these tissues. Interestingly, the strongest correlations between ultrasound stiffness measurements and histological changes were noted at 10% and 20% abdominal strain. This suggests that nonlinear ultrasound elasticity imaging may provide the greatest discrimination between low and high intestinal inflammation and smooth muscle hypertrophy states. Finally, there was a significant positive correlation between muscularis propria inner layer thickness and overall right lower quadrant stiffness. Similar correlations were not seen with the thicknesses of other bowel wall layers, again indicating the muscularis propria inner layer smooth muscle expansion is likely an important driver of increased bowel wall stiffness.
Our study has limitations. First, our study is relatively small, with only 19 Crohn disease patients enrolled and 18 patients undergoing successful bowel wall ultrasound SWE. However, our study was prospective in design with no significant missing data. Second, we did not investigate the reproducibility between ultrasound systems or the repeatability between operators. These characteristics of ultrasound SWE should be assessed in future studies by using multiple ultrasound systems and enlisting multiple operators. Third, it is always difficult to ensure perfect imaging-pathology agreement with regard to sampling location, although our study design, which included real-time matching of ultrasound gray-scale imaging with fresh resection specimens, should have provided reasonable correlation. Finally, up to 3 months between research ultrasound imaging and surgery was allowed based on our study design, a time period when patients were still on treatment. While it is conceivable that histological changes in the bowel wall could have occurred during this time interval, the median time between SWE and surgery was only 0.5 days making such changes unlikely in most participants.
Conclusion
We have demonstrated significant associations between bowel wall and overall right lower quadrant ultrasound stiffness measurements by SWE and histological mucosal active inflammation and muscularis propria inner layer smooth muscle hypertrophy, but not with histological fibrosis. Furthermore, there were no significant associations between ultrasound stiffness metrics and bowel wall collagen by SHIM. Additional investigations are needed to determine how this imaging tool may directly impact patient management and outcomes as well as confirm if larger right lower quadrant ROIs that include both the bowel and mesenteric fat may be used instead of ROIs placed directly in the bowel wall, which require more meticulous placement.
Acknowledgment
This research study was awarded the 2021 Society for Pediatric Radiology’s John Caffey Award for Best Clinical Science Paper.
Conflicts of interest
This research was supported by the National Institutes of Health (grants R01DK109032 and P30DK078392) and Siemens Healthineers. Dr. Dillman has unrelated research support from Bracco Diagnostics. The other authors report no conflicts.
References
- 1.Chen W, Lu C, Hirota C et al. (2017) Prominent histological change in Crohn’s fibrostenosing bowel strictures: a semiquantitative analysis by using a novel histological grading scheme. J Crohns Colitis 11:92–104 [DOI] [PubMed] [Google Scholar]
- 2.Rieder F, Bettenworth D, Ma C et al. (2018) An expert consensus to standardise definitions, diagnosis and treatment targets for anti-fibrotic stricture therapies in Crohn’s disease. Aliment Pharmacol Ther 48:347–357 [DOI] [PMC free article] [PubMed] [Google Scholar]
- 3.Tsai L, Nguyen NH, Ma C et al. (2021) Systematic review and meta-analysis: risk of hospitalization in patients with ulcerative colitis and Crohn’s disease in population-based cohort studies. Dig Dis Sci 10.1007/s10620-021-07200-1. doi: 10.1007/s10620-021-07200-1. [DOI] [PMC free article] [PubMed] [Google Scholar]
- 4.Rao BB, Click BH, Koutroubakis IE et al. (2017) The cost of Crohn’s disease: varied health care expenditure patterns across distinct disease trajectories. Inflamm Bowel Dis 23:107–115 [DOI] [PMC free article] [PubMed] [Google Scholar]
- 5.Oberai AA, Gokhale NH, Goenezen S et al. (2009) Linear and nonlinear elasticity imaging of soft tissue in vivo: demonstration of feasibility. Phys Med Biol 54:1191–1207 [DOI] [PMC free article] [PubMed] [Google Scholar]
- 6.Strupler M, Pena A-M, Hernest M et al. (2007) Second harmonic imaging and scoring of collagen in fibrotic tissues. Opt Express 15:4054–4065 [DOI] [PubMed] [Google Scholar]
- 7.Campagnola PJ, Loew LM (2003) Second-harmonic imaging microscopy for visualizing biomolecular arrays in cells, tissues and organisms. Nat Biotechnol 21:1356–1360 [DOI] [PubMed] [Google Scholar]
- 8.Dillman JR, Stidham RW, Higgins PD et al. (2013) US elastography-derived shear wave velocity helps distinguish acutely inflamed from fibrotic bowel in a Crohn disease animal model. Radiology 267:757–766 [DOI] [PMC free article] [PubMed] [Google Scholar]
- 9.Dillman JR, Stidham RW, Higgins PDR et al. (2014) Ultrasound shear wave elastography helps discriminate low-grade from high-grade bowel wall fibrosis in ex vivo human intestinal specimens. J Ultrasound Med 33:2115–2123 [DOI] [PMC free article] [PubMed] [Google Scholar]
- 10.Lu C, Gui X, Chen W et al. (2017) Ultrasound shear wave elastography and contrast enhancement: effective biomarkers in Crohn’s disease strictures. Inflamm Bowel Dis. 23:421–430 [DOI] [PubMed] [Google Scholar]
- 11.Ding SS, Fang Y, Wan J et al. (2019) Usefulness of strain elastography, ARFI imaging, and point shear wave elastography for the assessment of Crohn disease strictures. J Ultrasound Med 38:2861–2870 [DOI] [PubMed] [Google Scholar]
- 12.Li X-H, Feng S-T, Cao Q-H et al. (2021) Degree of creeping fat assessed by computed tomography enterography is associated with intestinal fibrotic stricture in patients with Crohn’s disease: a potentially novel mesenteric creeping fat index. J Crohns Colitis 15:1161–1173 [DOI] [PMC free article] [PubMed] [Google Scholar]
- 13.Mao R, Kurada S, Gordon IO et al. (2019) The mesenteric fat and intestinal muscle interface: creeping fat influencing stricture formation in Crohn’s disease. Inflamm Bowel Dis 25:421–426 [DOI] [PubMed] [Google Scholar]


