

SUMMARY
3-methylcrotonyl-CoA carboxylase (MCC) is a biotin-dependent enzyme necessary for leucine catabolism in most organisms. While the crystal structure of recombinant bacterial MCC has been characterized, the structure and potential polymerization of native MCC remain elusive. Here, we discovered that native MCC from Leishmania tarentolae (LtMCC) forms filaments and determined its structure at 3.4 Å, 3.9 Å, and 7.3 Å resolution using cryoEM. α6β6 LtMCCs assemble in a twisted-stacks architecture, manifesting as supramolecular rods up to 400 nanometers. Filamentous LtMCCs bind biotin but are not covalently biotinylated and lack coenzyme A. Filaments elongate by stacking α6β6 LtMCCs onto the exterior α-trimer of the terminal LtMCC. This stacking immobilizes the biotin carboxylase domains, sequestering the enzyme in an inactive state within the mitochondrial matrix. Our results support a new model for LtMCC catalysis, termed the dual-swinging-domains model, and cast new light on the function of polymerization in the carboxylase superfamily and beyond.
Keywords: 3-methylcrotonyl-CoA, carboxylase, cryoEM, filament, leucine catabolism, biotin, mitochondria, Leishmania, atomic modeling, cryoID
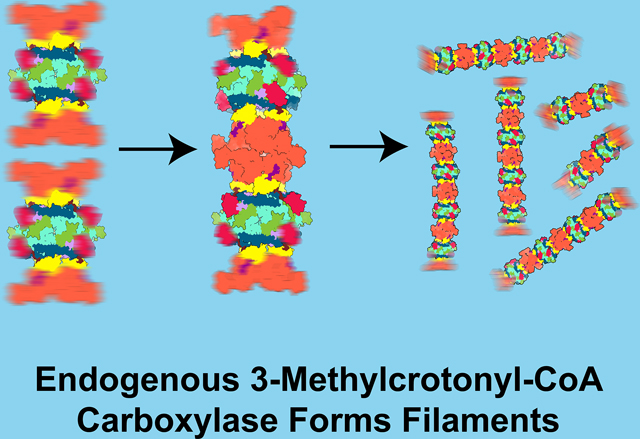
Graphical Abstract
eTOC Blurb
Hu et al. serendipitously discover that 3-methylcrotonyl-CoA carboxylase (MCC), an enzyme involved in leucine catabolism, forms filaments using cryogenic electron microscopy. Their work supports a new model of MCC catalysis and cast new light on the unusual structural and functional diversity of enzymatic polymerization.
INTRODUCTION
3-methylcrotonyl-CoA carboxylase (MCC) is a biotin-dependent enzyme necessary for the catabolism of leucine1–3, an essential branched-chain amino acid involved in regulating cellular metabolism4,5, protein synthesis4,5, and anabolic signaling6,7. MCC belongs to a superfamily of biotin-dependent carboxylases with different substrate preferences, such as acetyl-CoA carboxylase (ACC), geranyl-CoA carboxylase (GCC), propionyl-CoA carboxylase8 (PCC), and pyruvate carboxylase (PC). In eukaryotes, MCC resides in the mitochondrial matrix9. Documented in many species10–12, MCC shares high cross-species sequence homology (Figure S1). In humans, upregulated MCC expression often correlates with various cancers4,13–16. On the other hand, MCC deficiency, one of the most common metabolic disorders in newborns17, may cause vomiting, seizures, and other neurological abnormalities18,19.
As part of the mitochondrial leucine degradation pathway, MCC catalyzes the conversion of 3-methylcrotonyl-CoA to 3-methylglutaconyl-CoA11. Upon covalent biotinylation of the apoenzyme, MCC accelerates two successive reactions: biotin carboxylation and carboxyl group transfer20,21. First, biotin is carboxylated at an α-subunit active site with bicarbonate as the carbon dioxide donor upon concomitant ATP hydrolysis9,20,21. Next, the carboxylated biotin is translocated to the corresponding β-subunit active site, where the carboxyl group is transferred from biotin to 3-methylcrotonyl-CoA9,20,21.
The atomic structure of bacterial MCC has been solved by X-ray crystallography using recombinant Pseudomonas aeruginosa MCC (PaMCCrec) expressed in Escherichia coli with His-tags to the β-subunits22. PaMCCrec subunits oligomerize into a dodecameric complex with a core of six β-subunits sandwiched by two α-trimers in an α6β6 architecture22. Whether MCCs may exist in other forms is unclear. Albeit, their supramolecular assembly was conjectured based on rod-shaped aggregations of Achromobacter IVS MCC observed by negative-stain electron microscopy23. Recent advances in cryogenic electron microscopy (cryoEM) have uncovered unexpected modes of enzyme polymerization and elucidated the regulatory roles of such architectural forms24–29. For example, high resolution cryoEM structures illuminated the regulatory functions of several filamentous forms of eukaryotic ACC30. In the absence of high-resolution structures of the native MCC enzyme, it remains unsettled whether native MCCs can similarly form supramolecular assemblies.
Here, we used a bottom-up structural proteomics cryoEM approach31,32 to identify and determine the 3.4 Å, 3.9 Å, and 7.3 Å resolution structures of native Leishmania tarentolae MCC (LtMCC) enriched from mitochondrial fraction by streptavidin affinity pulldown. We discovered that LtMCC filaments consist of stacks of LtMCC α6β6 dodecamers. The biotin carboxylase (BC) domains of adjacent α6β6 dodecamers bind with each other, inhibiting their mobility. In contrast, at the filament termini, the BC domain is flexible, while the linker between the biotin carboxyl carrier protein (BCCP) and the BC-CT mediating (BT) domain is rigid. These observations support a dual-swinging-domains model for LtMCC catalysis and suggest a regulatory role of LtMCC filamentation in the mitochondrial matrix.
RESULTS
Discovery and identification of LtMCC filaments from mitochondrial lysate While examining complexes enriched by sedimentation of mitochondrial lysate from parasitic protist L. tarentolae in 10%–30% glycerol gradient (Figure 1A) and affinity pulldown with streptavidin-coated magnetic beads, we serendipitously discovered filamentous structures (Figure 1B). We identified the constituents of these filamentous structures by following the workflow detailed in Figures 1B–1C, which is based on the cryoID bottom-up structural proteomics approach31. Using single-particle reconstruction, we obtained two differently centered cryoEM maps of the filament middle segments, one at 3.4 Å and another at 3.9 Å resolution (Figure 1B). Additionally, we processed the termini particles and found that the two termini have the same structure, which was resolved at 7.3 Å resolution (Figure 1B).
Figure 1. Discovery of filamentous 3-methylcrotonyl-CoA carboxylase from mitochondria of L. tarentolae.
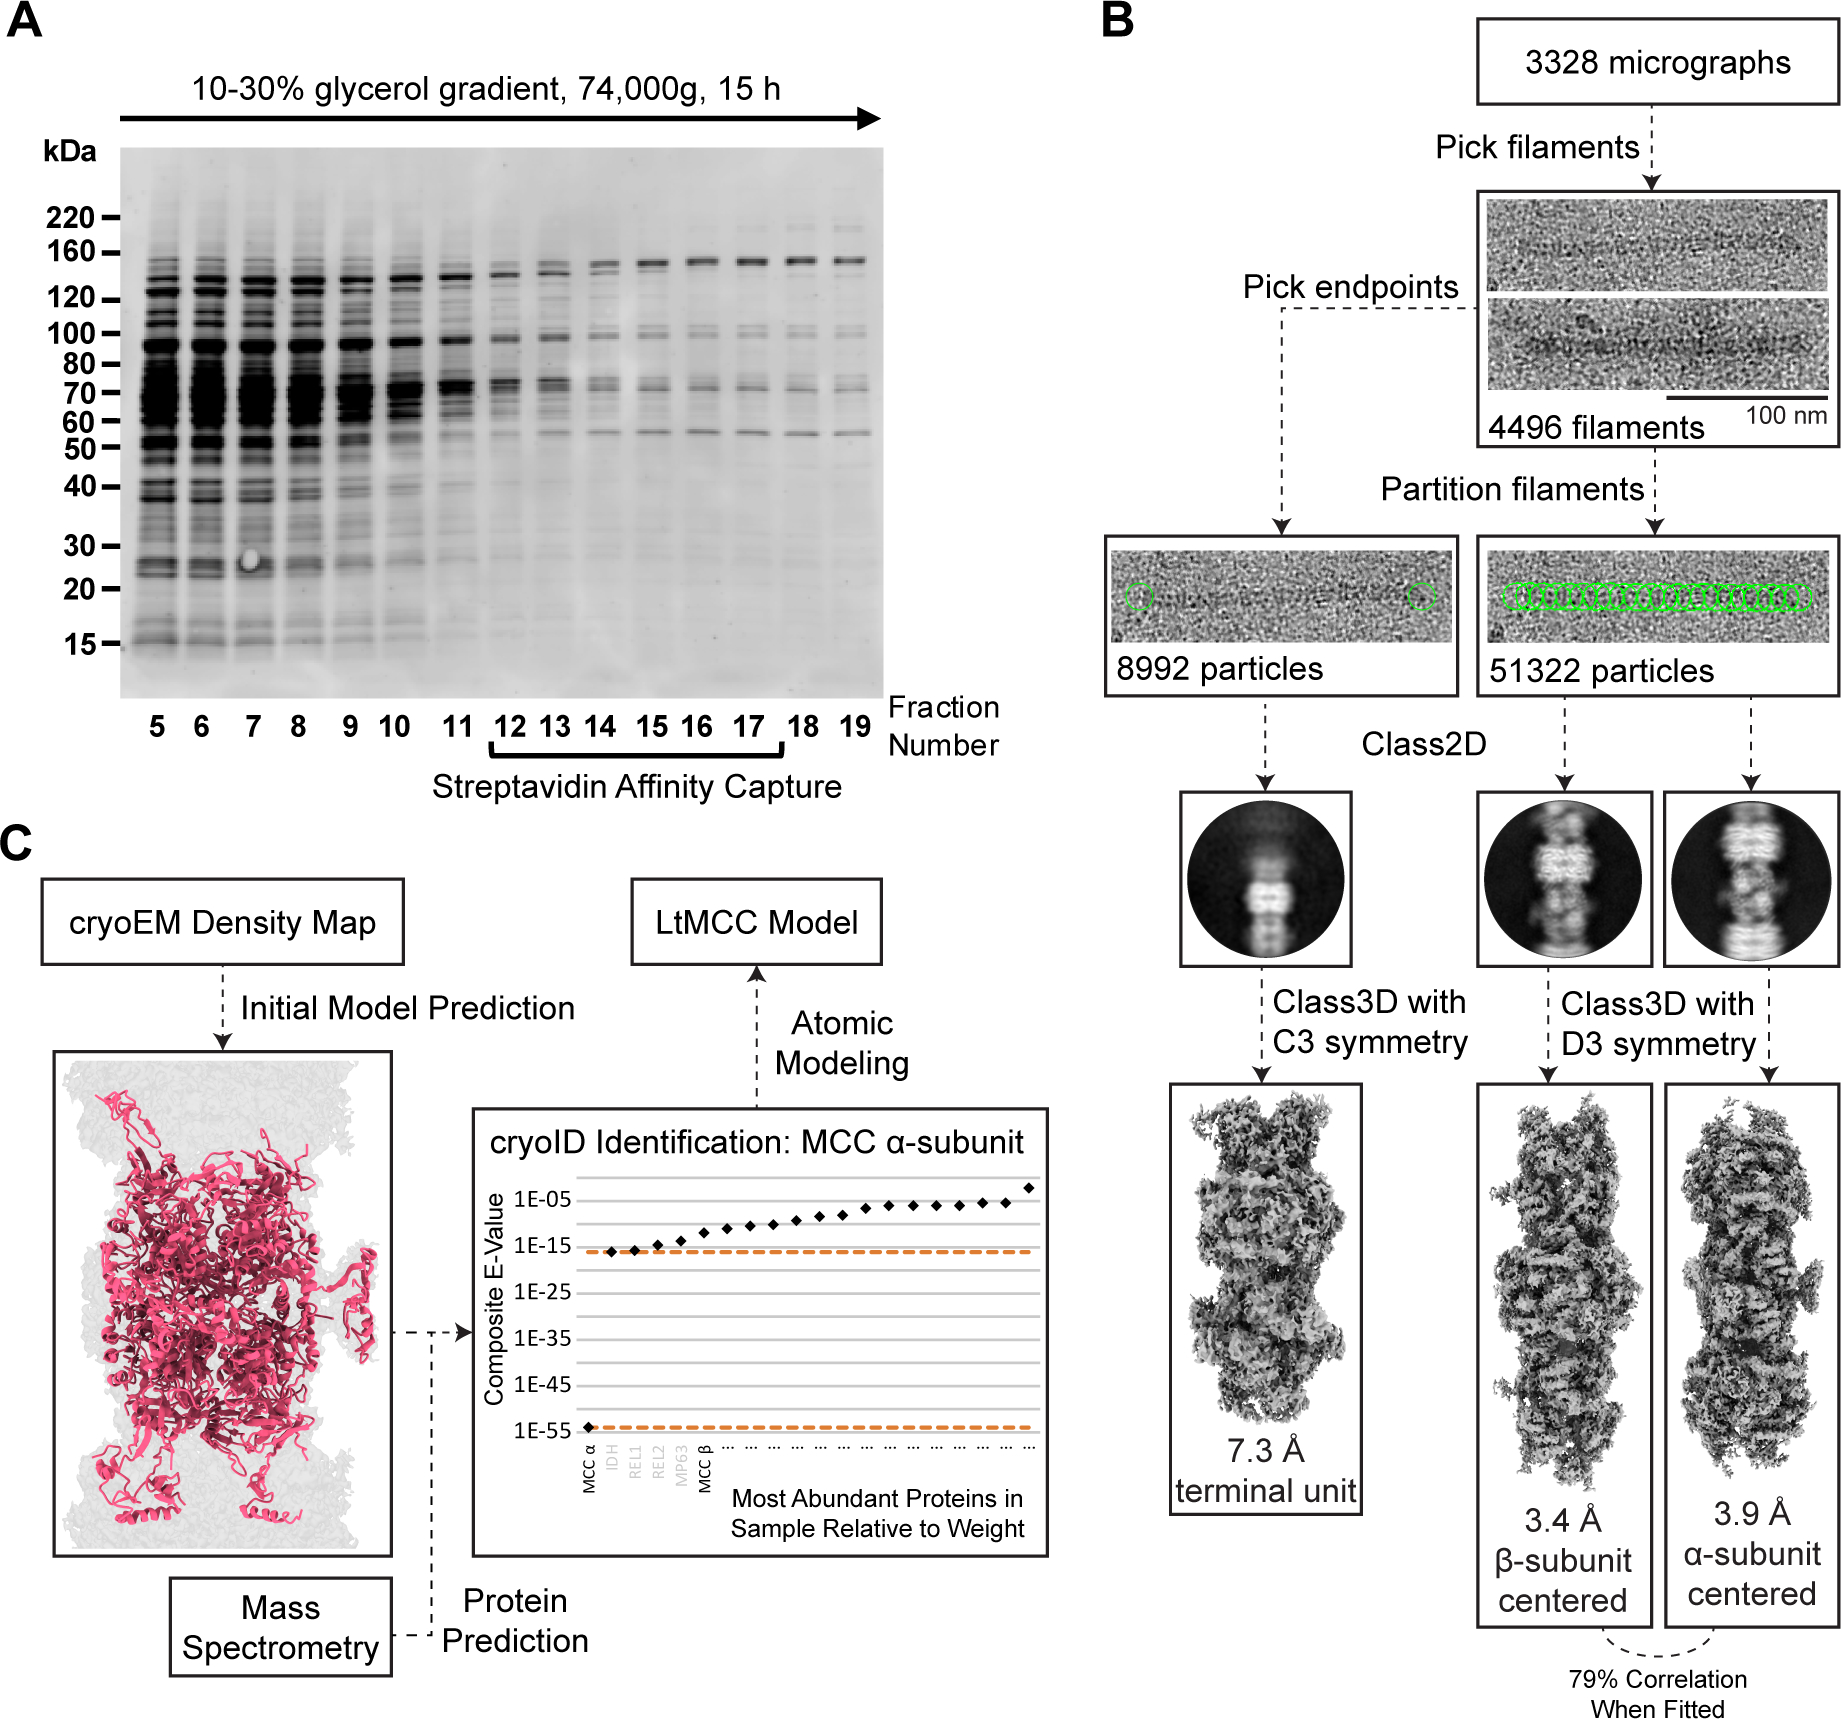
(A) Sodium dodecyl sulfate–polyacrylamide gel electrophoresis (SDS-PAGE) of the glycerol gradient fractions obtained from mitochondrial lysate. The gel was stained by Sypro Ruby.
(B) Workflow for cryoEM imaging and reconstruction. Filaments observed in cryoEM micrographs were visually identified, partitioned into segments of equal length, classified in 2D and 3D. Refinement of 3D reconstructions yielded an α-centered and β-centered cryoEM map. The filament ends were picked and reconstructed similarly, converging into a single map for both ends of the filament (i.e., the termini map).
(C) Workflow for protein identification and atomic modeling. From an input cryoEM map, DeepTracer32 generated an initial model with predicted amino acid sequence, which was input into cryoID31 together with mass spectrometry data. CryoID predicted that the filaments contained LtMCC. Finally, de novo atomic modeling of LtMCC was performed in Coot59 using an AlphaFold predicted model as a reference34,35.
To establish the protein identities of the cryoEM maps, we first obtained a partial model prediction from DeepTracer32 using the 3.9 Å map. The sequence of the output model from DeepTracer32 was then input into cryoID (Figure 1C). Searching for proteins detected by mass spectrometry (Table S1), cryoID identified LtMCC α-subunits as a filament component. Upon visual inspection, it was clear that the filaments also contain LtMCC β-subunits. Indeed, LtMCC α- and β-subunits produced the most peptide spectral counts of all proteins detected by mass spectrometry (Table S1). Furthermore, we ruled out GCCs as the filament components because GCCs are not found in eukaryotes33. We built the atomic model for the filament de novo, using an AlphaFold34,35 predicted model for the α-subunit and the β-subunit as references. We found that both the 3.4 Å and 3.9 Å maps contain the same subunits but center on the β- and α-subunits, respectively. After translating one map for half of an α6β6 stack along the filament and a slight rotation around the filament axis, the two maps match well with one another (cross-correlation coefficient of 0.74). The slightly better resolution of the map centered on the β-subunits is probably because the architecture of the β-subunits is more stable.
Structure of native eukaryotic LtMCC filaments
LtMCC filaments are predominantly straight (Figure 2A) although some are curved (Figure 2B), with a maximum observed curvature reaching 3.1 μm−1. The length distribution resembles a Poisson distribution (Figure 2C), similar to that of ACC filaments isolated from animal tissues and observed by negative stain electron microscopy36. Most filaments consist of four to six α6β6 dodecamers, or stacks (Figure 2C), with a mean length of 993 Å. With an architecture similar to that of PaMCCrec, each α6β6 stack in the LtMCC filament is characterized by an α6β6 cylindrical dodecamer exhibiting D3 symmetry (Figure 2D). Measuring to a height of 216 Å and width of 148 Å, the dodecamer is composed of a core of six β-subunits (β-core) sandwiched by two layers of trimeric α-subunits (Figure 2D, Video S1). Modeling the atomic structures of LtMCC α6β6 stacks into our cryoEM reconstruction reveals that the filament has a twisted-stacks architecture; that is, neighboring α6β6 stacks are related by a rotation of 23° and a translation of 216 Å (Figure 2D). In the filament, the active sites are exposed in both α- and β-subunits (indicated by stars in the middle panel of Figure 2D).
Figure 2. Structure of the filamentous LtMCC. See also Figures S2–4.
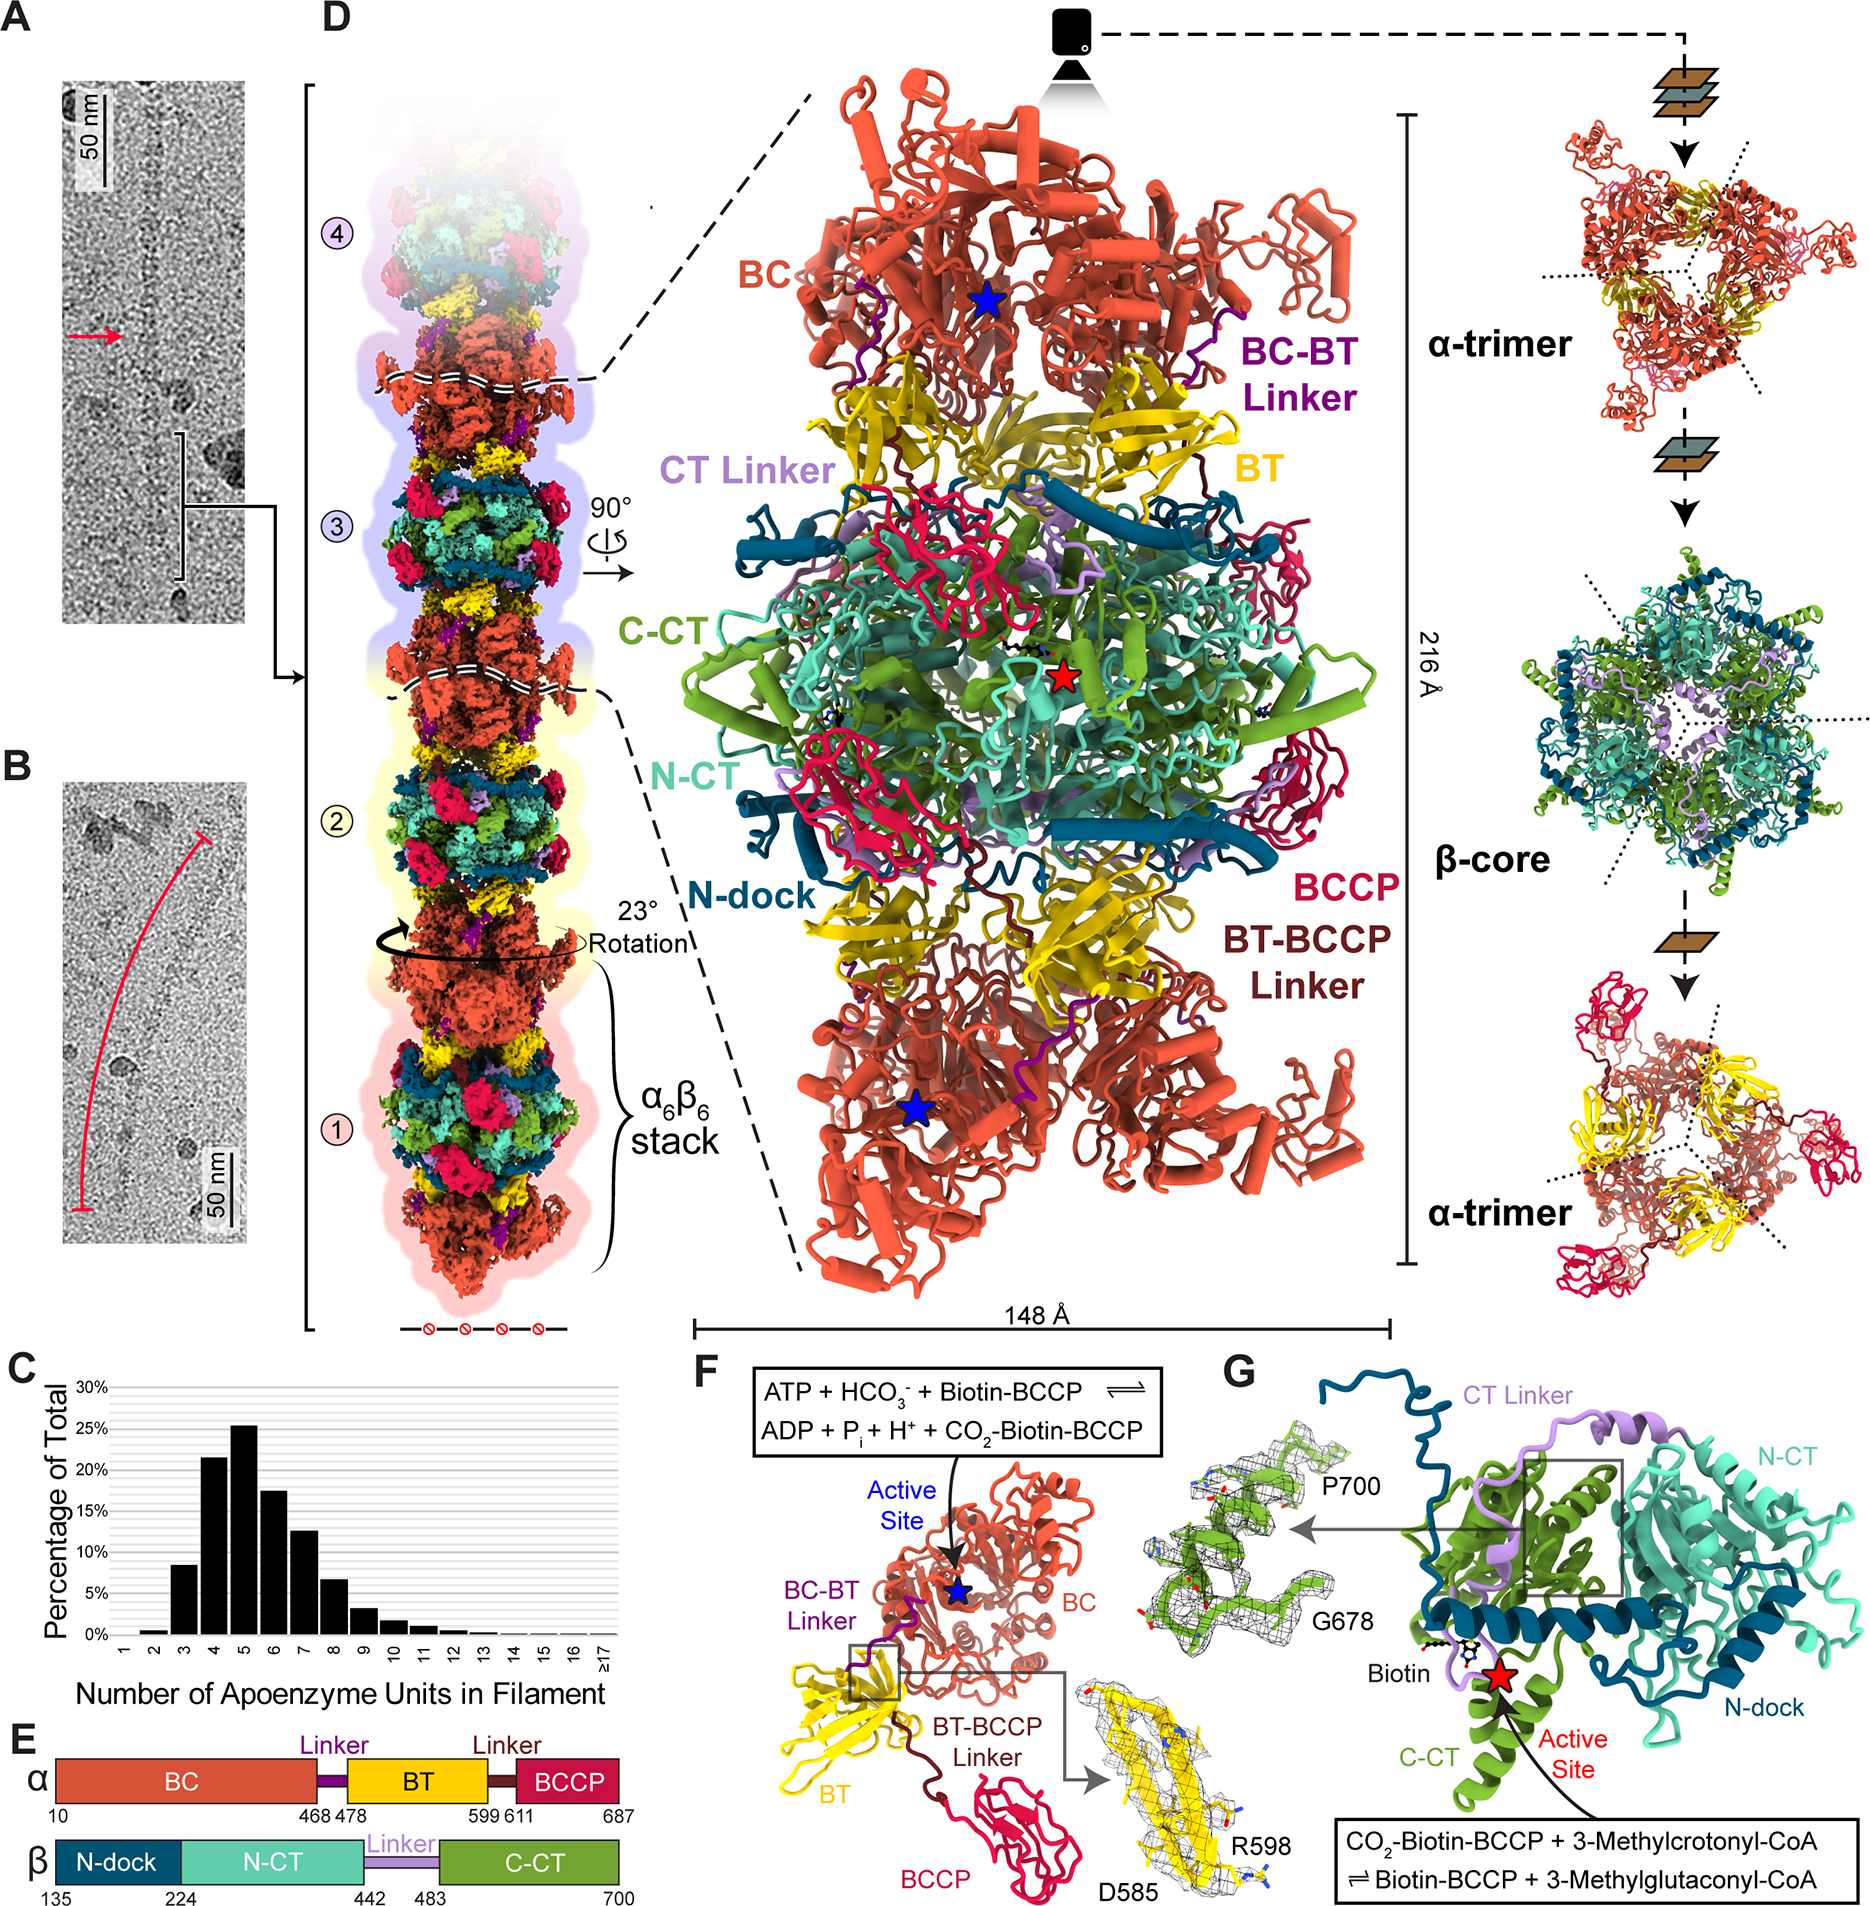
(A-C) CryoEM images of a straight (A) and curved (B) LtMCC filament, and distribution of filament lengths (C).
(D-E) CryoEM map and atomic models of the LtMCC filament. The composite cryoEM map of the filament (left column in D) is composed of three copies of the α-centered map, three copies of the β-centered map, and one copy of the termini map, with overlapping subunits. The atomic models (middle and right columns in D) of an α6β6 dodecamer and its trimeric stacks are shown in various views as ribbons, colored by domains according to the scheme in (E). The view directions are indicated by arrows, planes, and the camera. The dashed lines in the right column demarcate the boundaries between neighboring subunits (β-core is two-layered).
(F-G) Atomic model of an α-subunit (F) and a β-subunit (G) of LtMCC shown as ribbons colored by domains with active sites labeled. Insets: example cryoEM densities superimposed with the atomic model.
Each α-subunit contains the BC, BT, and BCCP domains, and two linkers: the BC-BT linker and the BT-BCCP linker, the latter of which was unmodeled in PaMCCrec (Figures 2E). A prominent feature of the BC domain is the presence of two large central β-sheets surrounded by α-helices. The active site of each α-subunit is located inside the central pocket of the BC domain (Figure 2F) and is responsible for carboxylating BCCP-bound biotin. In contrast to the BT domain of PaMCCrec, which contains a central α-helix accompanied by a seven-stranded antiparallel β-barrel22, the LtMCC BT domain features eight β-strands (Figure S2). When the dodecameric PaMCCrec and LtMCC are superimposed globally, the BC, BT, and BCCP domains in LtMCC are rotated with respect to those in PaMCCrec (Figure S3A–B). However, when individual domains are superimposed independently, they fit well with each other (Figure S3C–E), suggesting that the above observed structural differences between the LtMCC filament and PaMCCrec are likely due to filamentation, although we cannot rule out the possibility that these differences are genuine differences between different species.
Like in PaMCCrec, each LtMCC β-subunit possesses an N-carboxyltransferase (N-CT) domain and a C-carboxyltransferase (C-CT) domain. We have designated two new domains in LtMCC: the N-dock domain and CT-linker (Figure 2E), located before and after the N-CT domain, respectively. The N-dock domain was introduced to facilitate description of interactions between α- and β-subunits in the filament (see below). Designating the helix-loop-helix-loop fragment between the N-CT and C-CT domains as a separate domain (CT-linker) renders the N-CT and C-CT domains to have near-identical backbone folds (Figure S4), despite sharing only 19% sequence identity. Each of the six β-core active sites is wedged at the N-CT and C-CT interface between a top and a bottom β-subunit (Figures 2G, 3A) and is responsible for carboxylating 3-methylcrotonyl-CoA. Similar to that in PaMCCrec, each LtMCC β-core active site is roughly 80 Å away from its corresponding α-subunit active site.
Figure 3. Presence of non-covalently bound biotin and lack of CoA in the LtMCC filament. See also Figure S5.
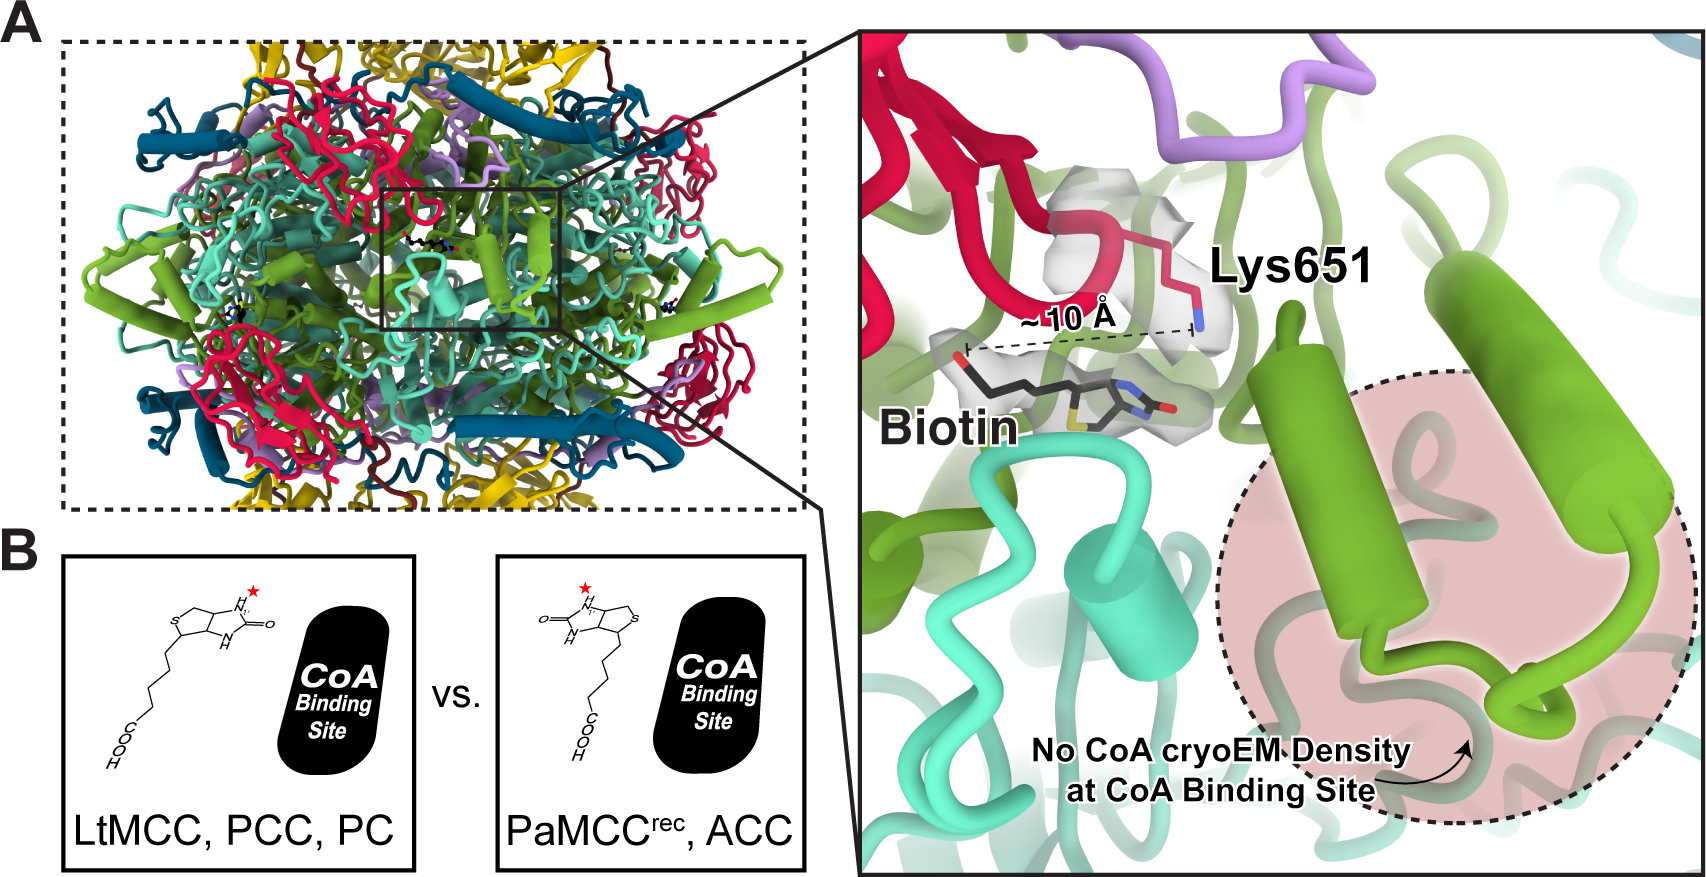
(A) Close-up view of the middle column of Figure 2D, showing the biotin-containing site surrounded by the CT linker (purple), the BCCP (red), N-CT (turquoise), and C-CT (green) domains. The conserved Lys651 (red) and the non-covalently bound biotin (black) are shown as sticks, superimposed with their cryoEM densities (semi-transparent gray). The distance between the carboxyl group of biotin and the ε-amino group of Lys651 is about 10 Å. Notably, the CoA binding site (pink circle region) lacks cryoEM density, indicating absence of CoA.
(B) Comparison of biotin and CoA orientations documented in various carboxylases22,41–44. The red star indicates the location of the N1′ atom of biotin.
LtMCC filaments bind biotin but lack coenzyme A
PaMCCrec was crystalized as both a holoenzyme (with bound CoA and covalently-linked biotin) and an apoenzyme (without CoA and biotin). By contrast, α6β6 stacks in the LtMCC filament contain non-covalently-bound biotin but lack CoA (Figures 3A, S5). For LtMCC to perform its two-step catalytic process, covalent biotinylation must occur first. Although biotin is observed at the expected β-core active sites, it is untethered to Lys651 in the highly conserved Ala-Met-Lys-Met sequence in the BCCP domain. Indeed, the carboxyl group of biotin is about 10 Å apart from the ε-amino group of Lys651 (Figure 3A), which is too far to form a prosthetic group21. The existence of non-biotinylated BCCP domains in LtMCC filaments suggests that the filamentous LtMCC is inactive. Similarly, inactive forms of PCC also bind biotin without forming a covalent adduct37,38.
The bicyclic ring system in biotin consists of an ureido ring and a thiophane ring39. Carboxylation requires the transfer of the carboxyl group attached to the N1′ atom of the biotin uredo ring to acyl-CoA40. Therefore, the orientation of the N1′ atom of biotin is important for carboxylation. In LtMCCs, the N1′ atom in the ureido ring of biotin is proximal to the CoA binding site, but not in PaMCCrec (Figure 3A). This is because the biotin bicyclic ring in LtMCC is approximately 180° rotated relative to that of PaMCCrec (Figure 3B). The spatial arrangement of LtMCC biotin is consistent with PCC biotin41,42 and PC biotin43 (Figure 3B). In contrast, the arrangement of PaMCCrec biotin is consistent with ACC biotin22,44 (Figure 3B). Therefore, biotin orientation is variable at the β-core active site for different carboxylases and carboxylases in different catalytic states.
α-subunits associate more with β-subunits than with intra-trimer α-subunits
Many interactions are observed between an α-subunit and the β-core, with 1,515 Å2 of buried surface area as calculated by ChimeraX45 and a binding affinity of −11.7 kcal mol−1 as calculated by PRODIGY46,47. Interactions between each α-subunit and the β-core are mainly mediated by a hook between the central α-helix and β1 strand of one BT domain that curls into a groove of a β-subunit (yellow segment from Asp494–Thr506 in Figure 4A). This groove is formed by the N-CT, C-CT, and N-dock domains (Figure S6). Due to its shorter sequence, the LtMCC hook contains only one hairpin in contrast to two hairpins in the PaMCCrec hook (Figure S2). In both structures, the hook is crucial for interactions with the β-subunit to reinforce inter-subunit associations22. The additional structures resolved in our cryoEM map also unveil previously unrecognized associations among domains of three neighboring subunits: the BT-BCCP linker of an α-subunit, N-dock domain of a β-subunit, and N-CT domain of another β-subunit (Figure 4B). Here, the BT-BCCP linker “docks” onto the crescent N-dock domain (Figure 4B).
Figure 4. Subunit interactions in the filamentous LtMCC. See also Figure S6.
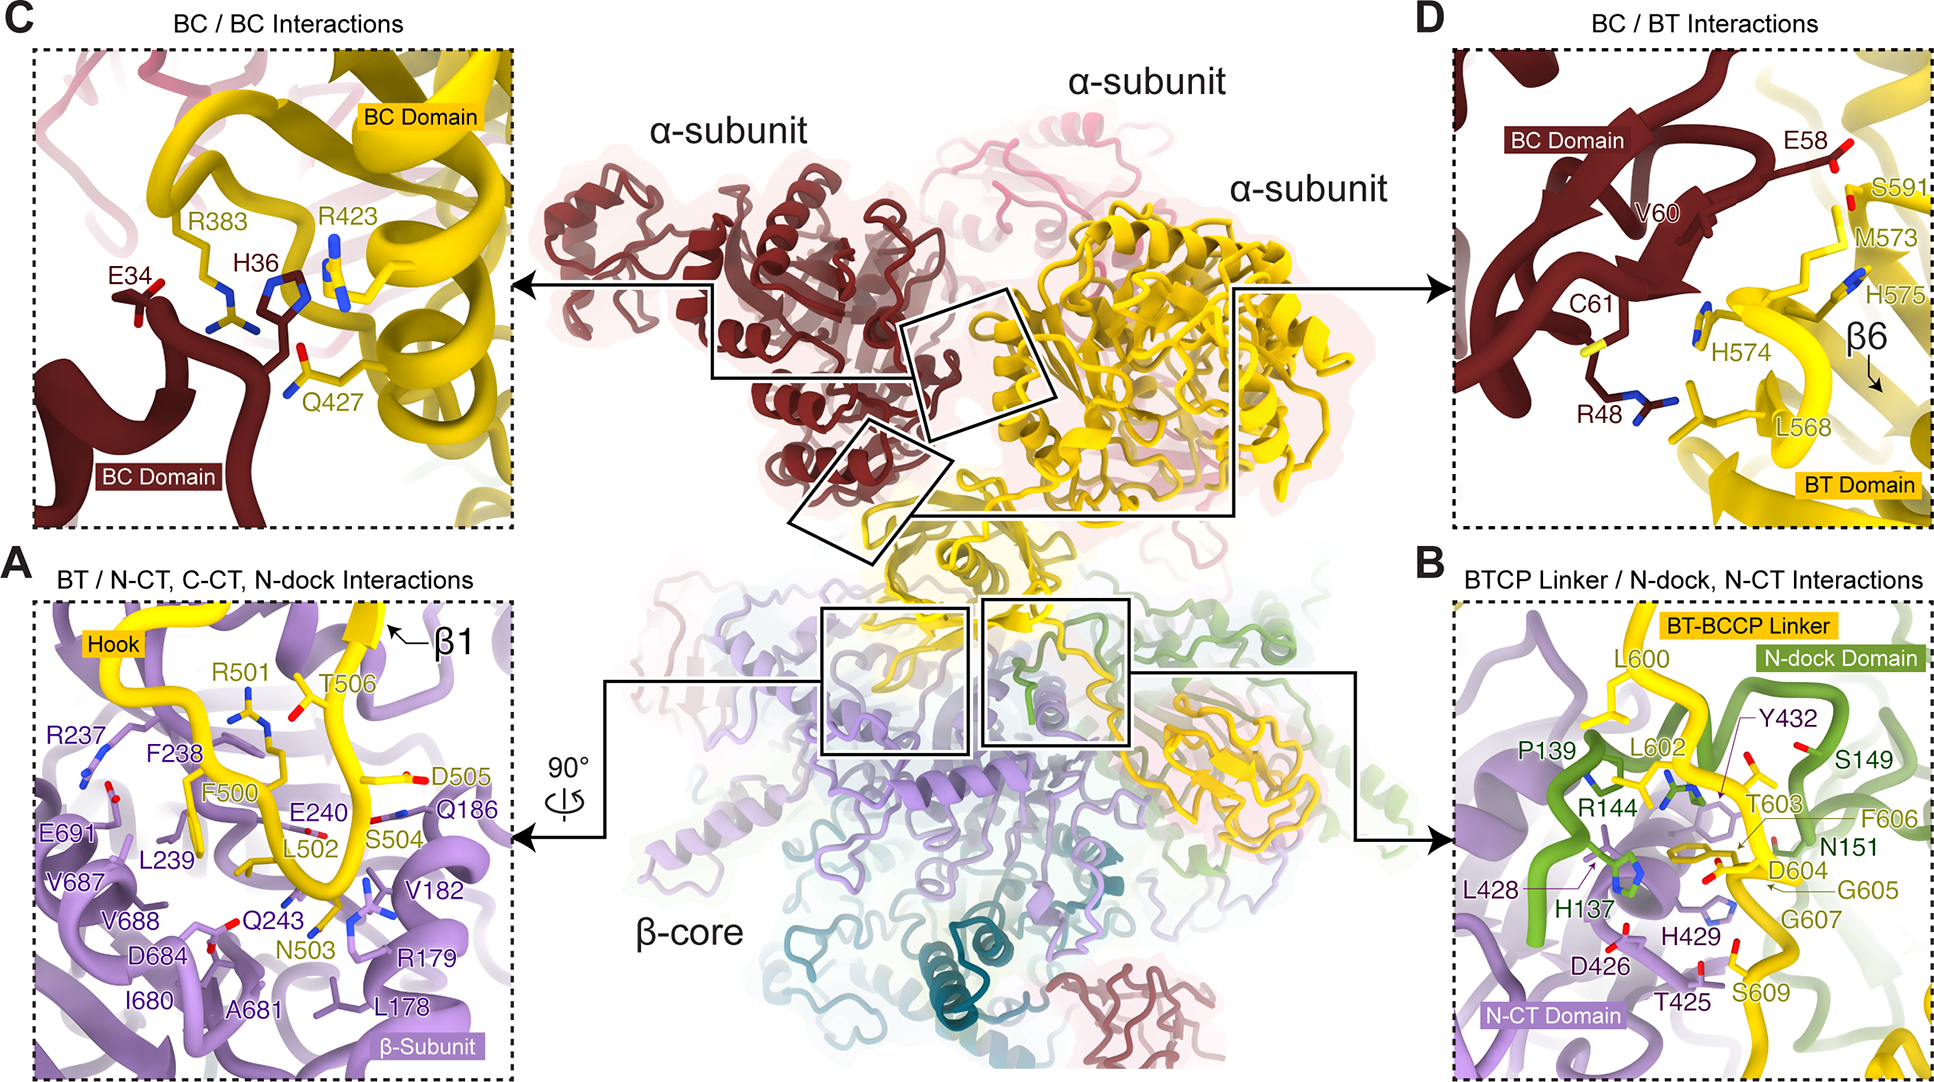
Interacting regions are boxed and examined in close-up views (A-D) with their interfacial residues labeled. Interactions between α- and β-subunits (A-B) are more extensive than interactions among α-subunits (C-D).
Fewer interactions are observed between intra-trimer α-subunits, contributing just 579 Å2 of buried surface area and a binding affinity of −6.1 kcal mol−1. Within an α-trimer, each α-subunit interacts with its neighboring α-subunits through the BC-BC and BC-BT interfaces. At the BC-BC interface, a loop from one BC domain (Glu34–His36) interacts with a loop (Phe379–Pro385) and a helix (Arg423–Gln427) from a neighboring BC domain (Figure 4C). At the BC-BT interface, strand β6 (Gly572–Ala581) from the β-barrel in the BT domain interacts with a short β-strand (Ala59–Cys61) in the BC domain through β-sheet augmentation48 (Figure 4D).
Structure of filament termini reveals mechanism of LtMCC polymerization
To investigate the mechanism of LtMCC polymerization, we reconstructed the filament termini at 7.3 Å resolution (Figure 5A). We found that both ends of the filament terminate at α-trimers, with partially resolved densities attributed to the BC domains (Figure 5A). When displayed at a high threshold, cryoEM densities for the BC, BCCP domain, and the BC-BT linker disappear, while density for the BT domain and BT-BCCP linker of the same α-subunit remain visible (Figure 5A). Therefore, the weaker densities of the BC and BCCP domains are due to their flexibility, rather than low occupancy of the α-subunit at the termini, which would make all domains of the α-subunit disappear. The flexibility of the BC and BCCP domains is further supported by limited intra-trimer α-subunit associations (Figures 4C–D). In contrast, the BT-BCCP linker is mostly rigid as it interacts extensively with the β-subunits (Figure 4B).
Figure 5. Filament formation stabilizes flexible BCCP and BT domains in LtMCC.
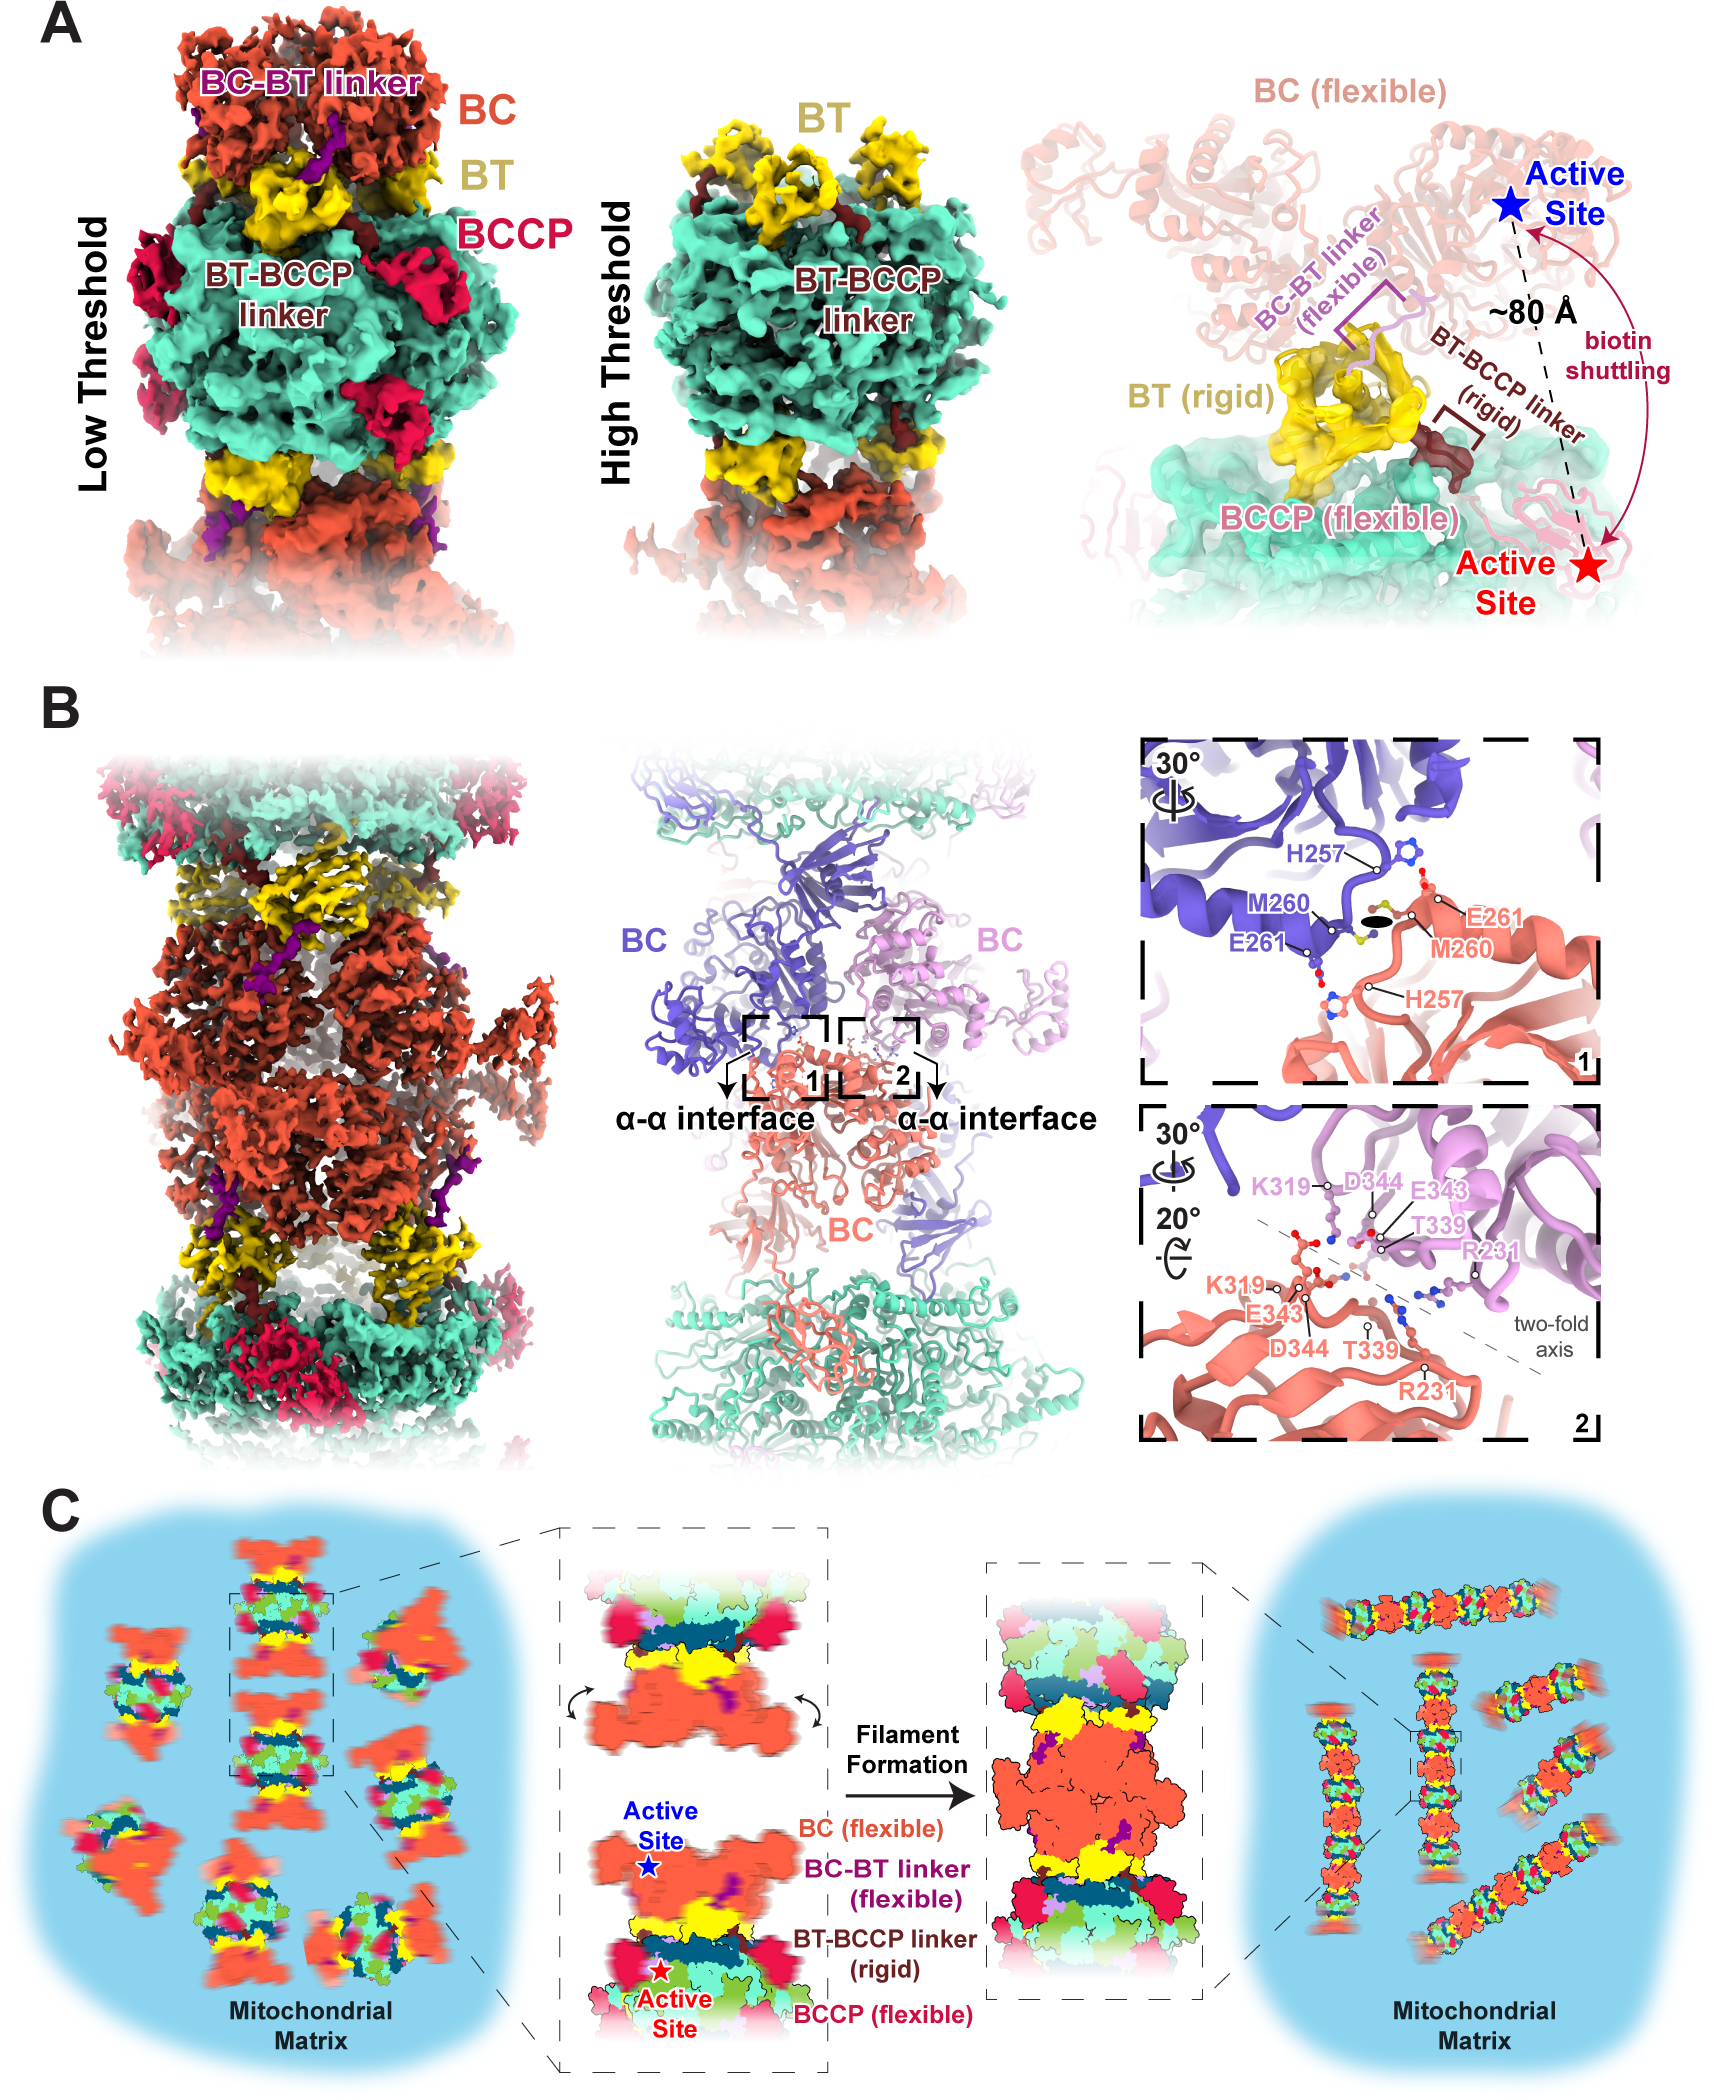
(A) Structure of the filament termini. The left and middle panels show the 7.3 Å cryoEM map of the filament termini at a low and high density threshold, respectively. The α-subunit is colored by domain according to the scheme in Figure 2E and the entire β-core is turquoise. Note, while visible at low threshold, the BCCP and BC domain densities disappear at high threshold. The right panel shows the atomic model of the filament terminus with the rigid and flexible domains in harder and softer shades, respectively.
(B) Structure of the α-α interface in the LtMCC filament. The cryoEM map (left panel) is colored as in (A) but the atomic models (middle panel) of the interfacing α-subunits are colored differently from each other to delineate individual α-subunits. Close-up views (right panel) of the two boxed areas in the middle panel show interfacing residues at the α-α interface. The ellipse in the top right panel denotes the local two-fold symmetry axis.
(C) Proposed model of filament formation and stabilization. Blurry domains indicate their flexibility.
Our observation that LtMCC filaments terminate at α-subunits suggests that the building block for the filament is an α6β6 stack. Filaments plausibly elongate one stack at a time, attaching through BC domains to form an α-α interface (Video S2), which is defined as the associations between two α-trimers from adjacent stacks (Figure 5B). The α-α interface has a total buried surface area of 1,689 Å2 and a binding affinity of −11.6 kcal mol−1. At the α-α interface, the BC domain of an α-subunit from the lower α-trimer interacts with the BC domains of two α-subunits from the upper α-trimer (Figure 5B). Interactions contributing to the α-α interface occur primarily between loops, along a local twofold axis (right panel of Figure 5B): the first site of interaction is between two loops (Leu338–Asp344), with its neighboring residues Lys319 and Arg231 also participating in α-α interactions; the second site of interaction occurs between two loops connected to two α-helices (His257–Glu261). These interactions at the α-α interface stabilize the BC domains between neighboring stacks in the LtMCC filament (Figure 5B).
DISCUSSION
This study reveals an important, yet previously unrecognized role of the BC domain in MCC catalysis. During catalysis, the BCCP domain must shuttle biotin between the CT active site (β-subunit) and the BC active site (α-subunit), located approximately 80 Å apart (Figure 5A). However, we observed that the BT-BCCP linker is fixed (Figure 5A). Therefore, the maximum distance that the BCCP domain can translocate by itself is about 60 Å, which is insufficient for the BCCP domain to reach the BC active site (right panel of Figure 5A). As such, for catalysis to occur, both the BCCP and active-site-containing BC domain must move so that BCCP-bound biotin can reach the BC active site. Indeed, at the filament termini, the BC domain is flexible, thus permitting BC domain movement. We term this the dual-swinging-domains model to highlight the difference from the original swinging-domain model9, in which only the BCCP domain swings. Beyond MCC, both the BCCP and BC domains have been documented to move in pyruvate carboxylase49,50. These observations suggest that carboxylase catalysis in general may involve a dual-swinging domains mechanism.
In LtMCC filaments, the α-α interface fixes the BC domain, thus preventing its swinging. According to our dual-swinging-domains model, immobilization of the BC domain inhibits catalysis. Granted, the BC domain and the BT-BCCP linker in LtMCC filaments may be more flexible in a cellular environment and cryoEM reconstructions did not capture flexible states. However, as biotin is not covalently bound to filamentous LtMCC, it must be inactive (Figure 3A).
Therefore, filamentation likely sequesters LtMCCs in a quiescent state in the mitochondrial matrix (Figure 5C), which may provide a capacity to reactivate the enzyme in response to environmental signals, such as an influx of nutrients, which may trigger covalent attachment of biotin to the BCCP domain through biotin protein ligase. Polymerization appears to be a readily deployable and economic mechanism for regulating the activity of abundant mitochondrial matrix enzymes in response to rapid changes in cellular metabolism requirements. Such capacity is particularly relevant for parasitic protists cycling between the amino acid-rich gut environment of insect vectors and the high glucose concentration in the bloodstream of their hosts.
Our inquiries into MCC polymerization further reflect the diversity of polymerization in the carboxylase superfamily. It is known that both isoforms of ACC, ACC1 and ACC2, form filaments30,36,51–55. Recently, high-resolution structures of filamentous ACC1 have been reported30. In contrast to LtMCC, ACC1 assembles into two filamentous forms: an active single-stranded and inactive double-stranded helical structure. Eukaryotic MCC and ACC filamentation exhibit different architectures and regulatory functions, supporting the distinct evolutionary lineages of these enzymes22. Nonetheless, filament formation may be a general way to regulate enzymatic activity in the carboxylase superfamily. We suspect that MCC filamentation is not unique to LtMCC, since the BC domain of LtMCC, which includes the α-α interface, generally shares a high (>50%) sequence identity with the BC domain from other organisms.
Evolutionarily, employing the same gene costs less than “inventing” a new gene for regulation. Polymerization is a remarkable example of such a cost-effective strategy. In the case of LtMCC, the stacking of active α6β6 dodecamers can inhibit biotin shuttling (Figure 5C), thus sequestering enzymes by polymerization. In other enzymes, polymerization can alter specificity56, decrease28, or increase activity57, and even introduce non-enzymatic functions such as conducting electrons between bacterial cells27 and regulating cell curvature58. Just like how complex life forms arose by the aggregation and polymerization of unicellular forms, the diverse functions arising from enzyme polymerization can be considered as a rudimentary form of evolution.
STAR★METHODS
RESOURCE AVAILABILITY
Lead contact
Further information and requests for resources and reagents should be directed to and will be fulfilled by the lead contact, Z. Hong Zhou (hong.zhou@ucla.edu).
Materials availability
This study did not generate new unique reagents.
Data and code availability
CryoEM maps of the α-subunit centered, β-subunit centered, and filament termini map have been deposited in the Electron Microscopy Data Bank under accession numbers EMD-28849, EMD-28846, and EMD-28847, respectively. The coordinates of LtMCC have been deposited in the Protein Data Bank under accession number 8F3D and 8F41. All aforementioned deposited data are publicly available as of the date of publication and accession numbers are also listed in the key resources table. This paper does not report original code. DOIs are listed in the key resources table. This paper analyzes existing, publicly available data. These accession numbers for the datasets are listed in the key resources table. Any additional information required to reanalyze the data reported in this paper is available from the lead contact upon request.
KEY RESOURCES TABLE.
| REAGENT or RESOURCE | SOURCE | IDENTIFIER |
|---|---|---|
| Chemicals, peptides, and recombinant proteins | ||
| Complete protease cocktail tablet | Roche | Sigma product no: 11836170001 |
| Deposited data | ||
| Crystal Structure of PaMCCrec apoenzyme | 22 | PDB: 3U9T |
| Crystal Structure of PaMCCrec holoenzyme | 22 | PDB: 3U9S |
| Crystal Structure of PCC D422-mutant β-subunit | 37 | PDB: 3IB9 |
| Crystal Structure of PCC wild-type β-subunit | 38 | PDB: 1XNY |
| CryoEM Structure of ACC–Citrate filament | 30 | PDB: 6G2D |
| CryoEM Structure of ACC–BRCT filament | 30 | PDB: 6G2I |
| Crystal structure of ACC holoenzyme | 44 | PDB: 5CSL |
| Crystal structure of PCC holoenzyme | 41 | PDB: 3N6R |
| CryoEM map of α-subunit centered LtMCC | This paper | EMDB: EMD-28849 |
| CryoEM map of β-subunit centered LtMCC | This paper | EMDB: EMD-28846 |
| CryoEM map of LtMCC termini | This paper | EMDB: EMD-28847 |
| CryoEM structure of the LtMCC filament centered on α-subunits | This paper | PDB: 8F41 |
| CryoEM structure of the LtMCC filament centered on β-subunits | This paper | PDB: 8F3D |
| Experimental models: Organisms/strains | ||
| L. tarentolae TATII/UC strain was isolated from Algerian gecko in 1939 and maintained in axenic culture in various laboratories. Parasite culture used in this study was received from Prof. Larry Simpson laboratory at UCLA in 2004 and transfected with pX based plasmid expressing RNA editing ligase 1 (KREL1). | 75 | N/A |
| Software and algorithms | ||
| MotionCorr2 | 65 | https://emcore.ucsf.edu/ucsf-software |
| Gctf | 66 | https://www2.mrc-lmb.cam.ac.uk/research/locally-developed-software/zhang-software/#gctf |
| RELION 3.1 | 68 | https://www3.mrc-lmb.cam.ac.uk/relion/index.php/Main_Page |
| ChimeraX | 45 | https://www.cgl.ucsf.edu/chimerax/ |
| Coot | 59 | https://www2.mrc-lmb.cam.ac.uk/personal/pemsley/coot/ |
| Phenix | 72 | https://phenix-online.org/ |
| DeepTracer | 32 | https://deeptracer.uw.edu/ |
| cryoID | 31 | https://github.com/EICN-UCLA/cryoID |
| ESPript 3 | 74 | https://espript.ibcp.fr/ESPript/ESPript/ |
| AlphaFold | 34,35 | https://github.com/sokrypton/ColabFold |
| IMOD | 67 | https://bio3d.colorado.edu/imod/ |
| SerialEM 3.8 | 64 | https://bio3d.colorado.edu/SerialEM/ |
| ExPASy Translate | 76 | https://web.expasy.org/translate/ |
| Clustal Omega | 73 | https://www.ebi.ac.uk/Tools/msa/clustalo/ |
| PRODIGY | 46,47 | https://wenmr.science.uu.nl/prodigy/ |
| ResMap | 77 | http://resmap.sourceforge.net/ |
| Other | ||
| MagStrep XT beads | IBA Lifesciences | 2-4090-002 |
| Zeba™ Spin Desalting Columns | Thermo Fisher Scientific | Catalog number: 89882 |
EXPERIMENTAL MODEL AND SUBJECT DETAILS
L. tarentolae cells were grown at 27°C in brain heart infusion media supplemented with 5 mg/L of hemin and harvested during late-exponential growth phase at ~2×10⁸ cell/ml. The cells are from L. tarentolae TATII/UC strain.
METHOD DETAILS
Preparation of mitochondrial lysate
Mitochondrial fraction was enriched by hypotonic cell lysis and sequential separation of membrane-containing fraction on RenoCal76 density gradients60. Mitochondrial pellets (0.5–0.8 g wet weight) were lysed in 1 ml of pH 7.3, 50 mM HEPES, 150 mM KCl, 2 mM EDTA, 1% NP40, and 50 μl of 20x Complete protease cocktail by sonication at 24W for 15 seconds and centrifuged at 30,000 RPM in an SW55 rotor for 15 minutes. The supernatant was recovered and separated on a continuous 10–30% gradient glycerol in pH 7.3, with 20 mM HEPES, 100 mM KCl, and 1 mM EDTA and prepared in SW28/32 Setton clear tubes for 15 hours at 72,000 g. Glycerol gradient fractions of 1.5 ml were collected from the top and those corresponding to 20S-40S region were combined.
Purification of LtMCC by streptavidin affinity pulldown
Glycerol gradient fractions were supplemented octylglucoside to 2 mM and incubated on Strep-Tactin®XT magnetic beads in a Binding Buffer (50 mM Tris-HCl, pH 8.0, 100 mM KCl, 1 mM EDTA, 2 mM OG) for 1 hour at 4°C on a nutating mixer. Beads were washed with 5 ml of Binding Buffer twice. For elution, the beads were incubated in 0.2 ml of Elution Buffer (20 mM Tris-HCl, pH 8.0, 100 mM KCl, 1 mM EDTA, 2 mM OG, 100 mM biotin) at 4°C for 10 minutes. The 130 μl of purified material was exchanged into Sample Buffer (20 mM Tris-HCl, pH 7.5, 60 mM KCl, 5 mM MgCl2, 1 mM DTT, 5 mM OG) using Zeba™ Spin Desalting Columns, 7K MWCO (0.5 ml). The sample was then centrifuged at 21,000g for 10 minutes and the supernatant was stored on ice before grid preparation.
Protein identification by LC-MS/MS
Affinity-purified complexes were sequentially digested with LysC peptidase and trypsin. LC-MS/MS was carried out by nanoflow reversed phase liquid chromatography (RPLC) using an UltiMate 3000 RSLC (Thermo Fisher Scientific) coupled on-line to an Orbitrap Fusion Lumos mass spectrometer (Thermo Fisher Scientific). A cycle of full FT scan mass spectrum (m/z 375–1500, resolution of 60,000 at m/z 400) was followed by MS/MS spectra acquired in the linear ion trap for 3 seconds at top speed with normalized collision energy (HCD, 30%). Following data extraction to MGF format using MSConvert from ProteoWizard61, resultant peak lists for each LC-MS/MS experiment were submitted to Protein Prospector (UCSF) for database searching62. Each project was searched against a normal form concatenated with the random form of the L. tarentolae Parrot Tar II from TriTrypDB63. The mass accuracy for parent ions and fragment ions were set as ± 10 ppm and 0.6 Da, respectively. Trypsin was set as the enzyme, with a maximum of two missed cleavages allowed. Cysteine carbamidomethylation was set as a fixed modification, and protein N-terminal acetylation, methionine oxidation, and N-terminal conversion of glutamine to pyroglutamic acid were selected as variable modifications.
CryoEM sample preparation
Lacey carbon cryoEM grids with a 2 nm continuous carbon film (Ted Pella) were first glow discharged for 45 seconds with a target current of 15 mA, using PELCO easiGlowTM. Then a 2.5 μL sample was applied to the grids. After waiting for 5 seconds, the grids were blotted for 4 seconds with blot force 0, at 100% humidity and 4°C temperature; after blotting, the grids were plunge-frozen into liquid ethane using an FEI Mark IV Vitrobot (Thermo Fisher Scientific). The grids were stored in a liquid nitrogen dewar before imaging.
CryoEM image acquisition
The cryoEM grids were loaded and imaged using a Titan Krios (Thermo Fisher Scientific) operated at 300 kV, with a Gatan K3 camera and a Gatan Imaging Filter Quantum LS. Movies were recorded with SerialEM64 by electron counting in super-resolution mode at a pixel size of 0.55 Å/pixel. The exposure time was 2 seconds and fractionated to 40 frames. The defocus range was between −1.5 to −2.5 μm. The total dosage was approximately 40 electrons/Å2. A total of 3,328 movies were collected.
CryoEM image processing
The movies were processed with MotionCor265, leading to dose-weighted and drift-corrected electron micrographs with a calibrated pixel size of 1.1 Å. We discarded the first frame due to severe drift of this frame. The defocus of the micrographs was determined by Gctf66. Using IMOD67, the micrographs were binned by a factor of 10 to make a stack for particle picking. After directly observing filaments on the micrographs, we manually picked the start and end of each filament using the 3dmod command in IMOD67. A total of 4,496 filaments were picked. To derive the constituents of the filaments, we coded a Python script to subdivide the filaments into equally spaced segments of 87 Å. The coordinates were then converted through a Bash script to RELION format. A total of 51,322 particles were extracted in total through RELION 3.1, with a box size of 384.
After extraction, we performed reference-free 2D class averaging on the particles with RELION 3.168. We chose the best classes and proceeded to 3D classification. We made an initial 3D model from the best 3D class averages through RELION 3.1. The 3D classification was done with D3 symmetry and yielded α- and β-centered 3D class averages. After removing duplicates, the α- and β-centered classes contained 7,582 and 13,250 particles, respectively. We did 3D refinement for the α- and β-centered map independently with D3 symmetry using RELION 3D refinement. We then performed CTF refinement for both maps independently using RELION 3.1. We used CTF refinement68 to improve the accuracy of the defocus for each particle and to correct beam tilt for the dataset. After performing CTF refinement, we performed 3D refinement for both maps again, independently. At the end of all processing, based on RELION’s gold-standard Fourier shell correlation (FSC) at the 0.143 criterion69, we obtained α- and β-centered maps at 3.9 and 3.4 Å resolution, respectively (Figure S7). The resolution towards the center of the map is better than the edge of the map (Figure S7).
For the filament termini map, we used RELION 3.1 to extract the previously picked filament start-and-end points at a box size of 384 pixels. We calculated the in-plane rotation angle using the direction of vectors from the start to end of the filament. We used a Python code to include the in-plane rotation angle information in the RELION star file for the particles. We performed 2D classification for these particles without local search around the precalculated in-plane rotation angle. To generate an initial 3D model, we used the IMOD clip function67 to change the center of the β-centered map. The best particles were selected for 3D reconstruction with C3 symmetry. We performed 3D classification and removed bad particles. During 3D classification, we set the “limit_tilt” parameter to 85 to keep side-view particles. We proceeded to 3D refinement with 3,380 particles. We obtained a final reconstruction with C3 symmetry at 7.3 Å resolution based on the gold-standard Fourier shell correlation at the 0.143 criterion69.
Sequence determination
The amino acid sequence for the LtMCC α-subunit was obtained from gene LtaP31.3620 from TriTrypDB63. The amino acid sequence for the LtMCC β-subunit was obtained by analyzing the genome sequencing data of L. tarentolae Parrot Tar II70, since the putative, shotgun LtMCC β-subunit sequence on the NCBI protein database was notably shorter than MCCs from other organisms, deviating from the high sequence homogeneity observed across MCC sequences. A frameshift occurs near the middle of the sequence, likely caused by a sequencing error. The frameshift is not present in the previous genome sequencing data of L. tarentolae Parrot Tar II71. Since MCC plays an essential role in the catabolism of leucine across many species, it is unlikely that MCC exhibits a highly different sequence in L. tarentolae.
Atomic modeling and model refinement
An initial AlphaFold34 model prediction was generated from ColabFold35 using the LtMCC α-subunit and β-subunit sequences. Atomic model building was conducted de novo in regions of low sequence conservation. First, an individual α-subunit and β-subunit were modeled into the cryoEM map in Coot59 and then real-space refined in Phenix72. The α-subunit was modeled using the α-subunit centered map, and the β-subunit was modeled using the β-subunit centered map. Biotin was modeled de novo into its observed density. Then, the subunits were duplicated according to D3 symmetry and fitted into a composite cryoEM map where α-centered maps were fitted with β-centered maps as illustrated in Figure 2D. This singular atomic model, which was built using both the α- and β-centered maps, was refined iteratively using Phenix72 and Coot59. In Coot, the atomic model was checked for rotamer outliers and Ramachandran outliers. All outliers were eliminated through the “Real Space Refine Zone” tool in Coot, with the α-subunit refined against the α-subunit centered map, and the β-subunit refined against the β-subunit centered map. Then, the model, along with the α-subunit and β-subunit centered maps, were submitted to Phenix for automatic real space refinement using the “phenix.real_space_refine” tool. This process was performed iteratively to reduce rotamer outliers, geometric outliers, Ramachandran outliers, and clashscore. Note, we did not use the filament termini map for de novo atomic model building or refinement because its resolution was too low.
Model analysis
Buried surface area and map cross-correlation coefficient were calculated in ChimeraX45. Binding affinity calculations were done using the PRODIGY web server46,47. Sequence alignments and similarity calculations were performed using Clustal Omega73 from the EMBL-EBI web server and visualized with ESPript 374.
QUANTIFICATION AND STATISTICAL ANALYSIS
Filament lengths from micrographs were calculated by the IMOD model2point function67. The lengths were then counted and compiled together in a spreadsheet for histogram analysis (see Figure 2C).
Supplementary Material
Table S1. Mass spectrometry data with LtMCC subunits colored in red, related to Figure 1.
Video S1. Ribbon diagram of an α6β6 dodecamer of the filamentous LtMCC, showing the α-trimer and β-core layers, related to Figure 2D.
Video S2. LtMCC filamentation stabilizes the BC domain, related to Figure 5.
Table 1.
CryoEM map statistics.
| α-subunit centered map | β-subunit centered map | Filament termini map | |
|---|---|---|---|
|
| |||
| Data collection and processing | |||
| Magnification | 81,000 | 81,000 | 81,000 |
| Voltage (kV) | 300 | 300 | 300 |
| Electron exposure (e−/Å2) | 40 | 40 | 40 |
| Defocus range (μm) | −1.5 to −2.5 | −1.5 to −2.5 | −1.5 to −2.5 |
| Pixel size (Å) | 1.1 | 1.1 | 1.1 |
| Symmetry imposed | D3 | D3 | C3 |
| Initial particle images (no.) | 51,322 | 51,322 | 8,992 |
| Final particle images (no.) | 7,582 | 13,250 | 3,380 |
| Map resolution (Å) | 3.9 | 3.4 | 7.3 |
| FSC threshold | 0.143 | 0.143 | 0.143 |
| Estimated resolution range (Å) | 3–5 | 3–5 | 6–8 |
| Map sharpening B factor (Å2) | −112 | −85 | −153 |
Table 2.
LtMCC model statistics.
| Model refinement | ||
|---|---|---|
|
| ||
| Model composition | PDB: 8F3D | PDB: 8F41 |
| Non-hydrogen atoms | 57846 | 57846 |
| Protein residues | 7464 | 7464 |
| Ligands | BTI: 6 | BTI: 6 |
| Mean isotropic B factor (Å2) | ||
| Protein | 70.80 | 70.80 |
| Ligand | 150.43 | 150.43 |
| R.M.S. deviations | ||
| Bond lengths (Å) | 0.006 | 0.005 |
| Bond angles (°) | 1.094 | 1.089 |
| Validation | ||
| MolProbity score | 2.36 | 2.34 |
| Clashscore | 21.50 | 20.46 |
| Rotamer outliers (%) | 0.39 | 0.39 |
| Ramachandran statistics | ||
| Outliers (%) | 0.00 | 0.00 |
| Allowed (%) | 9.34 | 9.35 |
| Favored (%) | 90.66 | 90.65 |
|
| ||
| Model-to-map fit, CC (mask) | ||
| α-subunit centered map | N/A | 0.55 |
| β-subunit centered map | 0.66 | N/A |
Highlights.
Native 3-methylcrotonyl-CoA carboxylase from Leishmania tarentolae forms filaments
The structure of filamentous LtMCC was resolved up to 3.4 Å resolution
Filamentation sequesters LtMCC in an inactive state
A new model of LtMCC catalysis, termed the dual-swinging-domains model, is proposed
Acknowledgments
Our research was supported in part by grants from the U.S. National Institutes of Health (R01GM071940 to Z.H.Z., R01AI101057 to R.A., and R01GM074830 to L.H.). J.J.H. acknowledges support from STROBE NSF Science & Technology Center Grant DMR-1548924, as well as the Stone, Irving & Jean Award and the Rose Gilbert, in Memory of Maggie Gilbert Award granted by the UCLA Honors Programs. We acknowledge the use of resources at the Electron Imaging Center for Nanomachines of UCLA supported by U.S. NIH (S10RR23057 and S10OD018111) and U.S. NSF (DMR-1548924 and DBI-133813). We thank James Zhen for his advice in manuscript writing. We thank Shiqing Liao and Samuel Liu for their help with selecting curved filaments.
Footnotes
Declaration of interests
The authors declare no competing interests.
Inclusion and diversity
One or more of the authors of this paper self-identifies as a gender minority in their field of research. While citing references scientifically relevant for this work, we also actively worked to promote gender balance in our reference list. We avoided “helicopter science” practices by including the participating local contributors from the region where we conducted the research as authors on the paper. We support inclusive, diverse, and equitable conduct of research.
Publisher's Disclaimer: This is a PDF file of an unedited manuscript that has been accepted for publication. As a service to our customers we are providing this early version of the manuscript. The manuscript will undergo copyediting, typesetting, and review of the resulting proof before it is published in its final form. Please note that during the production process errors may be discovered which could affect the content, and all legal disclaimers that apply to the journal pertain.
REFERENCES
- 1.Anderson MD, Che P, Song J, Nikolau BJ, and Wurtele ES (1998). 3-Methylcrotonyl-Coenzyme A Carboxylase Is a Component of the Mitochondrial Leucine Catabolic Pathway in Plants. Plant Physiology 118, 1127–1138. 10.1104/pp.118.4.1127. [DOI] [PMC free article] [PubMed] [Google Scholar]
- 2.Knappe J, Schlegel HG, and Lynen F (1961). [On the biochemical function of biotin. I. The participation of beta-methyl-crotonyl-carboxylase in the formation of beta-hydroxy-beta-methyl-glutaryl-CoA from beta-hydroxy-isovaleryl-CoA]. Biochem Z 335, 101–122. [PubMed] [Google Scholar]
- 3.Nikolau BJ, Ohlrogge JB, and Wurtele ES (2003). Plant biotin-containing carboxylases. Archives of Biochemistry and Biophysics 414, 211–222. 10.1016/S0003-9861(03)00156-5. [DOI] [PubMed] [Google Scholar]
- 4.Gondáš E, Kráľová Trančíková A, Baranovičová E, Šofranko J, Hatok J, Kowtharapu BS, Galanda T, Dobrota D, Kubatka P, Busselberg D, et al. (2022). Expression of 3-Methylcrotonyl-CoA Carboxylase in Brain Tumors and Capability to Catabolize Leucine by Human Neural Cancer Cells. Cancers 14, 585. 10.3390/cancers14030585. [DOI] [PMC free article] [PubMed] [Google Scholar]
- 5.Yang J, Chi Y, Burkhardt BR, Guan Y, and Wolf BA (2010). Leucine metabolism in regulation of insulin secretion from pancreatic beta cells: Nutrition Reviews©, Vol. 68, No. 5. Nutrition Reviews 68, 270–279. 10.1111/j.1753-4887.2010.00282.x. [DOI] [PMC free article] [PubMed] [Google Scholar]
- 6.Gran P, and Cameron-Smith D (2011). The actions of exogenous leucine on mTOR signalling and amino acid transporters in human myotubes. BMC Physiol 11, 10. 10.1186/1472-6793-11-10. [DOI] [PMC free article] [PubMed] [Google Scholar]
- 7.Paulussen KJM, McKenna CF, Beals JW, Wilund KR, Salvador AF, and Burd NA (2021). Anabolic Resistance of Muscle Protein Turnover Comes in Various Shapes and Sizes. Front. Nutr. 8, 615849. 10.3389/fnut.2021.615849. [DOI] [PMC free article] [PubMed] [Google Scholar]
- 8.Lee JKJ, Liu Y-T, Hu JJ, Aphasizheva I, Aphasizhev R, and Zhou ZH (2022). CryoEM Reveals Oligomeric Isomers of a Multienzyme Complex and Assembly Mechanics (Biophysics) 10.1101/2022.11.18.517149. [DOI] [PMC free article] [PubMed] [Google Scholar]
- 9.Tong L (2013). Structure and function of biotin-dependent carboxylases. Cell Mol Life Sci 70, 863–891. 10.1007/s00018-012-1096-0. [DOI] [PMC free article] [PubMed] [Google Scholar]
- 10.Diez TA, Wurtele ES, and Nikolau BJ (1994). Purification and Characterization of 3-Methylcrotonyl-Coenzyme-A Carboxylase from Leaves of Zea mays. Archives of Biochemistry and Biophysics 310, 64–75. 10.1006/abbi.1994.1141. [DOI] [PubMed] [Google Scholar]
- 11.Gallardo ME, Desviat LR, Rodríguez JM, Esparza-Gordillo J, Pérez-Cerdá C, Pérez B, Rodríguez-Pombo P, Criado O, Sanz R, Morton DH, et al. (2001). The Molecular Basis of 3-Methylcrotonylglycinuria, a Disorder of Leucine Catabolism. The American Journal of Human Genetics 68, 334–346. 10.1086/318202. [DOI] [PMC free article] [PubMed] [Google Scholar]
- 12.Höschle B, Gnau V, and Jendrossek D 2005 (2005). Methylcrotonyl-CoA and geranyl-CoA carboxylases are involved in leucine/isovalerate utilization (Liu) and acyclic terpene utilization (Atu), and are encoded by liuB/liuD and atuC/atuF, in Pseudomonas aeruginosa. Microbiology 151, 3649–3656. 10.1099/mic.0.28260-0. [DOI] [PubMed] [Google Scholar]
- 13.Chen Y-Y, Zhang X-N, Xu C-Z, Zhou D-H, Chen J, Liu Z-X, sun Y, Huang W, and Qu L-S (2021). MCCC2 promotes HCC development by supporting leucine oncogenic function. Cancer Cell Int 21, 22. 10.1186/s12935-020-01722-w. [DOI] [PMC free article] [PubMed] [Google Scholar]
- 14.Dai W, Feng H, and Lee D (2020). MCCC2 overexpression predicts poorer prognosis and promotes cell proliferation in colorectal cancer. Experimental and Molecular Pathology 115, 104428. 10.1016/j.yexmp.2020.104428. [DOI] [PubMed] [Google Scholar]
- 15.He J, Mao Y, Huang W, Li M, Zhang H, Qing Y, Lu S, Xiao H, and Li K (2020). Methylcrotonoyl-CoA Carboxylase 2 Promotes Proliferation, Migration and Invasion and Inhibits Apoptosis of Prostate Cancer Cells Through Regulating GLUD1-P38 MAPK Signaling Pathway. OTT Volume 13, 7317–7327. 10.2147/OTT.S249906. [DOI] [PMC free article] [PubMed] [Google Scholar]
- 16.Liu Y, Yuan Z, and Song C (2019). Methylcrotonoyl-CoA carboxylase 2 overexpression predicts an unfavorable prognosis and promotes cell proliferation in breast cancer. Biomark Med 13, 427–436. 10.2217/bmm-2018-0475. [DOI] [PubMed] [Google Scholar]
- 17.Lee SH, and Hong YH (2014). Asymptomatic maternal 3-methylcrotonylglycinuria detected by her unaffected baby’s neonatal screening test. Korean J Pediatr 57, 329. 10.3345/kjp.2014.57.7.329. [DOI] [PMC free article] [PubMed] [Google Scholar]
- 18.Grünert SC, Stucki M, Morscher RJ, Suormala T, Bürer C, Burda P, Christensen E, Ficicioglu C, Herwig J, Kölker S, et al. (2012). 3-methylcrotonyl-CoA carboxylase deficiency: Clinical, biochemical, enzymatic and molecular studies in 88 individuals. Orphanet J Rare Dis 7, 31. 10.1186/1750-1172-7-31. [DOI] [PMC free article] [PubMed] [Google Scholar]
- 19.Kim Y-M, Seo GH, Kim G-H, Yoo H-W, and Lee BH (2017). Novel heterozygous MCCC1 mutations identified in a patient with 3-methylcrotonyl-coenzyme A carboxylase deficiency. J Genet Med 14, 23–26. 10.5734/JGM.2017.14.1.23. [DOI] [Google Scholar]
- 20.Lynen F, Knappe J, Lorch E, Juetting G, Ringelmann E, and Lachance JP (1961). [On the biochemical function of biotin. II. Purification and mode of action of beta-methyl-crotonyl-carboxylase]. Biochem Z 335, 123–167. [PubMed] [Google Scholar]
- 21.Moss J, and Lane MD (1971). The Biotin-Dependent Enzymes. In Advances in Enzymology and Related Areas of Molecular Biology (John Wiley & Sons, Ltd; ), pp. 321–442. 10.1002/9780470122808.ch7. [DOI] [PubMed] [Google Scholar]
- 22.Huang CS, Ge P, Zhou ZH, and Tong L (2012). An unanticipated architecture of the 750-kDa α6β6 holoenzyme of 3-methylcrotonyl-CoA carboxylase. Nature 481, 219–223. 10.1038/nature10691. [DOI] [PMC free article] [PubMed] [Google Scholar]
- 23.Apitz-Castro R, Rehn K, and Lynen F (1970). β-Methylcrotonyl-CoA-Carboxylase. European Journal of Biochemistry 16, 71–79. 10.1111/j.1432-1033.1970.tb01055.x. [DOI] [PubMed] [Google Scholar]
- 24.Lynch EM, Hicks DR, Shepherd M, Endrizzi JA, Maker A, Hansen JM, Barry RM, Gitai Z, Baldwin EP, and Kollman JM (2017). Human CTP synthase filament structure reveals the active enzyme conformation. Nat Struct Mol Biol 24, 507–514. 10.1038/nsmb.3407. [DOI] [PMC free article] [PubMed] [Google Scholar]
- 25.Mattei S, Ban A, Picenoni A, Leibundgut M, Glockshuber R, and Boehringer D (2020). Structure of native glycolipoprotein filaments in honeybee royal jelly. Nat Commun 11, 6267. 10.1038/s41467-020-20135-x. [DOI] [PMC free article] [PubMed] [Google Scholar]
- 26.Park CK, and Horton NC (2019). Structures, functions, and mechanisms of filament forming enzymes: a renaissance of enzyme filamentation. Biophys Rev 11, 927–994. 10.1007/s12551-019-00602-6. [DOI] [PMC free article] [PubMed] [Google Scholar]
- 27.Wang F, Gu Y, O’Brien JP, Yi SM, Yalcin SE, Srikanth V, Shen C, Vu D, Ing NL, Hochbaum AI, et al. (2019). Structure of Microbial Nanowires Reveals Stacked Hemes that Transport Electrons over Micrometers. Cell 177, 361–369.e10. 10.1016/j.cell.2019.03.029. [DOI] [PMC free article] [PubMed] [Google Scholar]
- 28.Webb BA, Dosey AM, Wittmann T, Kollman JM, and Barber DL (2017). The glycolytic enzyme phosphofructokinase-1 assembles into filaments. J Cell Biol 216, 2305–2313. 10.1083/jcb.201701084. [DOI] [PMC free article] [PubMed] [Google Scholar]
- 29.Kerviel A, Ge P, Lai M, Jih J, Boyce M, Zhang X, Zhou ZH, and Roy P (2019). Atomic structure of the translation regulatory protein NS1 of bluetongue virus. Nat Microbiol 4, 837–845. 10.1038/s41564-019-0369-x. [DOI] [PMC free article] [PubMed] [Google Scholar]
- 30.Hunkeler M, Hagmann A, Stuttfeld E, Chami M, Guri Y, Stahlberg H, and Maier T (2018). Structural basis for regulation of human acetyl-CoA carboxylase. Nature 558, 470–474. 10.1038/s41586-018-0201-4. [DOI] [PubMed] [Google Scholar]
- 31.Ho C-M, Li X, Lai M, Terwilliger TC, Beck JR, Wohlschlegel J, Goldberg DE, Fitzpatrick AWP, and Zhou ZH (2020). Bottom-up structural proteomics: cryoEM of protein complexes enriched from the cellular milieu. Nat Methods 17, 79–85. 10.1038/s41592-019-0637-y. [DOI] [PMC free article] [PubMed] [Google Scholar]
- 32.Pfab J, Phan NM, and Si D (2021). DeepTracer for fast de novo cryo-EM protein structure modeling and special studies on CoV-related complexes. Proceedings of the National Academy of Sciences 118, e2017525118. 10.1073/pnas.2017525118. [DOI] [PMC free article] [PubMed] [Google Scholar]
- 33.Waldrop GL, Holden HM, and Maurice M St. (2012). The enzymes of biotin dependent CO 2 metabolism: What structures reveal about their reaction mechanisms: Biotin Dependent Enzymes. Protein Science 21, 1597–1619. 10.1002/pro.2156. [DOI] [PMC free article] [PubMed] [Google Scholar]
- 34.Jumper J, Evans R, Pritzel A, Green T, Figurnov M, Ronneberger O, Tunyasuvunakool K, Bates R, Žídek A, Potapenko A, et al. (2021). Highly accurate protein structure prediction with AlphaFold. Nature 596, 583–589. 10.1038/s41586-021-03819-2. [DOI] [PMC free article] [PubMed] [Google Scholar]
- 35.Mirdita M, Schütze K, Moriwaki Y, Heo L, Ovchinnikov S, and Steinegger M (2022). ColabFold: making protein folding accessible to all. Nat Methods 19, 679–682. 10.1038/s41592-022-01488-1. [DOI] [PMC free article] [PubMed] [Google Scholar]
- 36.Kleinschmidt AK, Moss J, and Lane DM (1969). Acetyl coenzyme A carboxylase: filamentous nature of the animal enzymes. Science 166, 1276–1278. 10.1126/science.166.3910.1276. [DOI] [PubMed] [Google Scholar]
- 37.Arabolaza A, Shillito ME, Lin T-W, Diacovich L, Melgar M, Pham H, Amick D, Gramajo H, and Tsai S-C (2010). Crystal structures and mutational analyses of acyl-CoA carboxylase beta subunit of Streptomyces coelicolor. Biochemistry 49, 7367–7376. 10.1021/bi1005305. [DOI] [PMC free article] [PubMed] [Google Scholar]
- 38.Diacovich L, Mitchell DL, Pham H, Gago G, Melgar MM, Khosla C, Gramajo H, and Tsai S-C (2004). Crystal structure of the beta-subunit of acyl-CoA carboxylase: structure-based engineering of substrate specificity. Biochemistry 43, 14027–14036. 10.1021/bi049065v. [DOI] [PubMed] [Google Scholar]
- 39.Hu Z, and Cronan JE (2020). The primary step of biotin synthesis in mycobacteria. Proceedings of the National Academy of Sciences 117, 23794–23801. 10.1073/pnas.2010189117. [DOI] [PMC free article] [PubMed] [Google Scholar]
- 40.Knowles JR (1989). The Mechanism of Biotin-Dependent Enzymes. Annual Review of Biochemistry 58, 195–221. 10.1146/annurev.bi.58.070189.001211. [DOI] [PubMed] [Google Scholar]
- 41.Huang CS, Sadre-Bazzaz K, Shen Y, Deng B, Zhou ZH, and Tong L (2010). Crystal structure of the α6β6 holoenzyme of propionyl-coenzyme A carboxylase. Nature 466, 1001–1005. 10.1038/nature09302. [DOI] [PMC free article] [PubMed] [Google Scholar]
- 42.Scheffen M, Marchal DG, Beneyton T, Schuller SK, Klose M, Diehl C, Lehmann J, Pfister P, Carrillo M, He H, et al. (2021). A new-to-nature carboxylation module to improve natural and synthetic CO2 fixation. Nat Catal 4, 105–115. 10.1038/s41929-020-00557-y. [DOI] [Google Scholar]
- 43.Fry DC, Fox T, Lane MD, and Mildvan AS (1985). NMR studies of the exchange of the amide protons of d-biotin and its derivatives. Ann N Y Acad Sci 447, 140–151. 10.1111/j.1749-6632.1985.tb18434.x. [DOI] [PubMed] [Google Scholar]
- 44.Wei J, and Tong L (2015). Crystal structure of the 500-kDa yeast acetyl-CoA carboxylase holoenzyme dimer. Nature 526, 723–727. 10.1038/nature15375. [DOI] [PMC free article] [PubMed] [Google Scholar]
- 45.Goddard TD, Huang CC, Meng EC, Pettersen EF, Couch GS, Morris JH, and Ferrin TE (2018). UCSF ChimeraX: Meeting modern challenges in visualization and analysis. Protein Sci 27, 14–25. 10.1002/pro.3235. [DOI] [PMC free article] [PubMed] [Google Scholar]
- 46.Vangone A, and Bonvin AM (2015). Contacts-based prediction of binding affinity in protein–protein complexes. eLife 4, e07454. 10.7554/eLife.07454. [DOI] [PMC free article] [PubMed] [Google Scholar]
- 47.Xue LC, Rodrigues JP, Kastritis PL, Bonvin AM, and Vangone A (2016). PRODIGY: a web server for predicting the binding affinity of protein–protein complexes. Bioinformatics 32, 3676–3678. 10.1093/bioinformatics/btw514. [DOI] [PubMed] [Google Scholar]
- 48.Harrison SC (1996). Peptide–Surface Association: The Case of PDZ and PTB Domains. Cell 86, 341–343. 10.1016/S0092-8674(00)80105-1. [DOI] [PubMed] [Google Scholar]
- 49.Maurice M St., Reinhardt L, Surinya KH, Attwood PV, Wallace JC, Cleland WW, and Rayment I (2007). Domain Architecture of Pyruvate Carboxylase, a Biotin-Dependent Multifunctional Enzyme. Science 317, 1076–1079. 10.1126/science.1144504. [DOI] [PubMed] [Google Scholar]
- 50.Xiang S, and Tong L (2008). Crystal structures of human and Staphylococcus aureus pyruvate carboxylase and molecular insights into the carboxyltransfer reaction. Nat Struct Mol Biol 15, 295–302. 10.1038/nsmb.1393. [DOI] [PubMed] [Google Scholar]
- 51.Beaty NB, and Lane MD (1983). Kinetics of activation of acetyl-CoA carboxylase by citrate. Relationship to the rate of polymerization of the enzyme. Journal of Biological Chemistry 258, 13043–13050. 10.1016/S0021-9258(17)44077-4. [DOI] [PubMed] [Google Scholar]
- 52.Kim C-W, Moon Y-A, Park SW, Cheng D, Kwon HJ, and Horton JD (2010). Induced polymerization of mammalian acetyl-CoA carboxylase by MIG12 provides a tertiary level of regulation of fatty acid synthesis. Proceedings of the National Academy of Sciences 107, 9626–9631. 10.1073/pnas.1001292107. [DOI] [PMC free article] [PubMed] [Google Scholar]
- 53.Meredith MJ, and Lane MD (1978). Acetyl-CoA carboxylase. Evidence for polymeric filament to protomer transition in the intact avian liver cell. Journal of Biological Chemistry 253, 3381–3383. 10.1016/S0021-9258(17)34809-3. [DOI] [PubMed] [Google Scholar]
- 54.Park S, Hwang I-W, Makishima Y, Perales-Clemente E, Kato T, Niederländer NJ, Park EY, and Terzic A (2013). Spot14/Mig12 heterocomplex sequesters polymerization and restrains catalytic function of human acetyl-CoA carboxylase 2. Journal of Molecular Recognition 26, 679–688. 10.1002/jmr.2313. [DOI] [PMC free article] [PubMed] [Google Scholar]
- 55.Wei J, and Tong L (2018). How Does Polymerization Regulate Human Acetyl-CoA Carboxylase 1? Biochemistry 57, 5495–5496. 10.1021/acs.biochem.8b00881. [DOI] [PubMed] [Google Scholar]
- 56.Kim S-Y, Kim Y-W, Hegerl R, Cyrklaff M, and Kim I-S (2005). Novel type of enzyme multimerization enhances substrate affinity of oat β-glucosidase. Journal of Structural Biology 150, 1–10. 10.1016/j.jsb.2004.07.007. [DOI] [PubMed] [Google Scholar]
- 57.Polley S, Lyumkis D, and Horton NC (2019). Mechanism of Filamentation-Induced Allosteric Activation of the SgrAI Endonuclease. Structure 27, 1497–1507.e3. 10.1016/j.str.2019.08.001. [DOI] [PMC free article] [PubMed] [Google Scholar]
- 58.Ingerson-Mahar M, Briegel A, Werner JN, Jensen GJ, and Gitai Z (2010). The metabolic enzyme CTP synthase forms cytoskeletal filaments. Nat Cell Biol 12, 739–746. 10.1038/ncb2087. [DOI] [PMC free article] [PubMed] [Google Scholar]
- 59.Emsley P, Lohkamp B, Scott WG, and Cowtan K (2010). Features and development of Coot. Acta Crystallogr D Biol Crystallogr 66, 486–501. 10.1107/S0907444910007493. [DOI] [PMC free article] [PubMed] [Google Scholar]
- 60.Pelletier M, Read LK, and Aphasizhev R (2007). Isolation of RNA Binding Proteins Involved in Insertion/Deletion Editing. In Methods in Enzymology (Elsevier; ), pp. 75–105. 10.1016/S0076-6879(07)24004-2. [DOI] [PubMed] [Google Scholar]
- 61.Chambers MC, Maclean B, Burke R, Amodei D, Ruderman DL, Neumann S, Gatto L, Fischer B, Pratt B, Egertson J, et al. (2012). A cross-platform toolkit for mass spectrometry and proteomics. Nat Biotechnol 30, 918–920. 10.1038/nbt.2377. [DOI] [PMC free article] [PubMed] [Google Scholar]
- 62.Fang L, Kaake RM, Patel VR, Yang Y, Baldi P, and Huang L (2012). Mapping the Protein Interaction Network of the Human COP9 Signalosome Complex Using a Label-free QTAX Strategy. Molecular & Cellular Proteomics 11, 138–147. 10.1074/mcp.M111.016352. [DOI] [PMC free article] [PubMed] [Google Scholar]
- 63.Amos B, Aurrecoechea C, Barba M, Barreto A, Basenko EY, Bażant W, Belnap R, Blevins AS, Böhme U, Brestelli J, et al. (2022). VEuPathDB: the eukaryotic pathogen, vector and host bioinformatics resource center. Nucleic Acids Research 50, D898–D911. 10.1093/nar/gkab929. [DOI] [PMC free article] [PubMed] [Google Scholar]
- 64.Mastronarde DN (2005). Automated electron microscope tomography using robust prediction of specimen movements. Journal of Structural Biology 152, 36–51. 10.1016/j.jsb.2005.07.007. [DOI] [PubMed] [Google Scholar]
- 65.Zheng SQ, Palovcak E, Armache J-P, Verba KA, Cheng Y, and Agard DA (2017). MotionCor2: anisotropic correction of beam-induced motion for improved cryo-electron microscopy. Nat Methods 14, 331–332. 10.1038/nmeth.4193. [DOI] [PMC free article] [PubMed] [Google Scholar]
- 66.Zhang K (2016). Gctf: Real-time CTF determination and correction. J Struct Biol 193, 1–12. 10.1016/j.jsb.2015.11.003. [DOI] [PMC free article] [PubMed] [Google Scholar]
- 67.Kremer JR, Mastronarde DN, and McIntosh JR (1996). Computer Visualization of Three-Dimensional Image Data Using IMOD. Journal of Structural Biology 116, 71–76. 10.1006/jsbi.1996.0013. [DOI] [PubMed] [Google Scholar]
- 68.Zivanov J, Nakane T, Forsberg BO, Kimanius D, Hagen WJ, Lindahl E, and Scheres SH (2018). New tools for automated high-resolution cryo-EM structure determination in RELION-3. eLife 7, e42166. 10.7554/eLife.42166. [DOI] [PMC free article] [PubMed] [Google Scholar]
- 69.Rosenthal PB, and Henderson R (2003). Optimal Determination of Particle Orientation, Absolute Hand, and Contrast Loss in Single-particle Electron Cryomicroscopy. Journal of Molecular Biology 333, 721–745. 10.1016/j.jmb.2003.07.013. [DOI] [PubMed] [Google Scholar]
- 70.Goto Y, Kuroki A, Suzuki K, and Yamagishi J (2020). Draft Genome Sequence of Leishmania tarentolae Parrot Tar II, Obtained by Single-Molecule Real-Time Sequencing. Microbiology Resource Announcements 9, e00050–20. 10.1128/MRA.00050-20. [DOI] [PMC free article] [PubMed] [Google Scholar]
- 71.Raymond F, Boisvert S, Roy G, Ritt J-F, Légaré D, Isnard A, Stanke M, Olivier M, Tremblay MJ, Papadopoulou B, et al. (2012). Genome sequencing of the lizard parasite Leishmania tarentolae reveals loss of genes associated to the intracellular stage of human pathogenic species. Nucleic Acids Research 40, 1131–1147. 10.1093/nar/gkr834. [DOI] [PMC free article] [PubMed] [Google Scholar]
- 72.Liebschner D, Afonine PV, Baker ML, Bunkóczi G, Chen VB, Croll TI, Hintze B, Hung L-W, Jain S, McCoy AJ, et al. (2019). Macromolecular structure determination using X-rays, neutrons and electrons: recent developments in Phenix. Acta Cryst D 75, 861–877. 10.1107/S2059798319011471. [DOI] [PMC free article] [PubMed] [Google Scholar]
- 73.Sievers F, and Higgins DG (2018). Clustal Omega for making accurate alignments of many protein sequences. Protein Sci 27, 135–145. 10.1002/pro.3290. [DOI] [PMC free article] [PubMed] [Google Scholar]
- 74.Robert X, and Gouet P (2014). Deciphering key features in protein structures with the new ENDscript server. Nucleic Acids Research 42, W320–W324. 10.1093/nar/gku316. [DOI] [PMC free article] [PubMed] [Google Scholar]
- 75.Parrot L (1949). Sur quelques souches de Leishmania. Archives de I’lnstitut Pasteur d’Algerie 1949, 106–109. [Google Scholar]
- 76.Gasteiger E, Gattiker A, Hoogland C, Ivanyi I, Appel RD, and Bairoch A (2003). ExPASy: The proteomics server for in-depth protein knowledge and analysis. Nucleic Acids Res 31, 3784–3788. 10.1093/nar/gkg563. [DOI] [PMC free article] [PubMed] [Google Scholar]
- 77.Kucukelbir A, Sigworth FJ, and Tagare HD (2014). Quantifying the local resolution of cryo-EM density maps. Nat Methods 11, 63–65. 10.1038/nmeth.2727. [DOI] [PMC free article] [PubMed] [Google Scholar]
Associated Data
This section collects any data citations, data availability statements, or supplementary materials included in this article.
Supplementary Materials
Table S1. Mass spectrometry data with LtMCC subunits colored in red, related to Figure 1.
Video S1. Ribbon diagram of an α6β6 dodecamer of the filamentous LtMCC, showing the α-trimer and β-core layers, related to Figure 2D.
Video S2. LtMCC filamentation stabilizes the BC domain, related to Figure 5.
Data Availability Statement
CryoEM maps of the α-subunit centered, β-subunit centered, and filament termini map have been deposited in the Electron Microscopy Data Bank under accession numbers EMD-28849, EMD-28846, and EMD-28847, respectively. The coordinates of LtMCC have been deposited in the Protein Data Bank under accession number 8F3D and 8F41. All aforementioned deposited data are publicly available as of the date of publication and accession numbers are also listed in the key resources table. This paper does not report original code. DOIs are listed in the key resources table. This paper analyzes existing, publicly available data. These accession numbers for the datasets are listed in the key resources table. Any additional information required to reanalyze the data reported in this paper is available from the lead contact upon request.
KEY RESOURCES TABLE.
| REAGENT or RESOURCE | SOURCE | IDENTIFIER |
|---|---|---|
| Chemicals, peptides, and recombinant proteins | ||
| Complete protease cocktail tablet | Roche | Sigma product no: 11836170001 |
| Deposited data | ||
| Crystal Structure of PaMCCrec apoenzyme | 22 | PDB: 3U9T |
| Crystal Structure of PaMCCrec holoenzyme | 22 | PDB: 3U9S |
| Crystal Structure of PCC D422-mutant β-subunit | 37 | PDB: 3IB9 |
| Crystal Structure of PCC wild-type β-subunit | 38 | PDB: 1XNY |
| CryoEM Structure of ACC–Citrate filament | 30 | PDB: 6G2D |
| CryoEM Structure of ACC–BRCT filament | 30 | PDB: 6G2I |
| Crystal structure of ACC holoenzyme | 44 | PDB: 5CSL |
| Crystal structure of PCC holoenzyme | 41 | PDB: 3N6R |
| CryoEM map of α-subunit centered LtMCC | This paper | EMDB: EMD-28849 |
| CryoEM map of β-subunit centered LtMCC | This paper | EMDB: EMD-28846 |
| CryoEM map of LtMCC termini | This paper | EMDB: EMD-28847 |
| CryoEM structure of the LtMCC filament centered on α-subunits | This paper | PDB: 8F41 |
| CryoEM structure of the LtMCC filament centered on β-subunits | This paper | PDB: 8F3D |
| Experimental models: Organisms/strains | ||
| L. tarentolae TATII/UC strain was isolated from Algerian gecko in 1939 and maintained in axenic culture in various laboratories. Parasite culture used in this study was received from Prof. Larry Simpson laboratory at UCLA in 2004 and transfected with pX based plasmid expressing RNA editing ligase 1 (KREL1). | 75 | N/A |
| Software and algorithms | ||
| MotionCorr2 | 65 | https://emcore.ucsf.edu/ucsf-software |
| Gctf | 66 | https://www2.mrc-lmb.cam.ac.uk/research/locally-developed-software/zhang-software/#gctf |
| RELION 3.1 | 68 | https://www3.mrc-lmb.cam.ac.uk/relion/index.php/Main_Page |
| ChimeraX | 45 | https://www.cgl.ucsf.edu/chimerax/ |
| Coot | 59 | https://www2.mrc-lmb.cam.ac.uk/personal/pemsley/coot/ |
| Phenix | 72 | https://phenix-online.org/ |
| DeepTracer | 32 | https://deeptracer.uw.edu/ |
| cryoID | 31 | https://github.com/EICN-UCLA/cryoID |
| ESPript 3 | 74 | https://espript.ibcp.fr/ESPript/ESPript/ |
| AlphaFold | 34,35 | https://github.com/sokrypton/ColabFold |
| IMOD | 67 | https://bio3d.colorado.edu/imod/ |
| SerialEM 3.8 | 64 | https://bio3d.colorado.edu/SerialEM/ |
| ExPASy Translate | 76 | https://web.expasy.org/translate/ |
| Clustal Omega | 73 | https://www.ebi.ac.uk/Tools/msa/clustalo/ |
| PRODIGY | 46,47 | https://wenmr.science.uu.nl/prodigy/ |
| ResMap | 77 | http://resmap.sourceforge.net/ |
| Other | ||
| MagStrep XT beads | IBA Lifesciences | 2-4090-002 |
| Zeba™ Spin Desalting Columns | Thermo Fisher Scientific | Catalog number: 89882 |