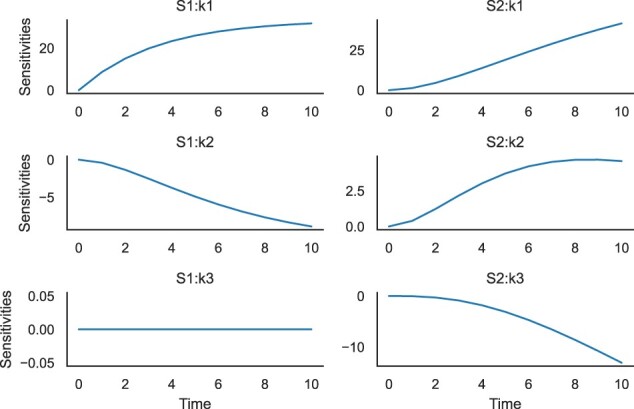
Fig. 1.

Time-dependent sensitivities for a simple linear chain model: X0 -> S1; k1*S1; S1 -> S2; k2*S2; S2 ->; k3*S2; k1 = 0.1; k2 = 0.3; k3 = 0.14; Xo = 10. Here, all possible combinations of the species (S1 and S2) and parameters (k1, k2 and k3) are shown. However, the interface allows us to be more selective if needed. The plots were generated by helper functions in libRoadRunner
