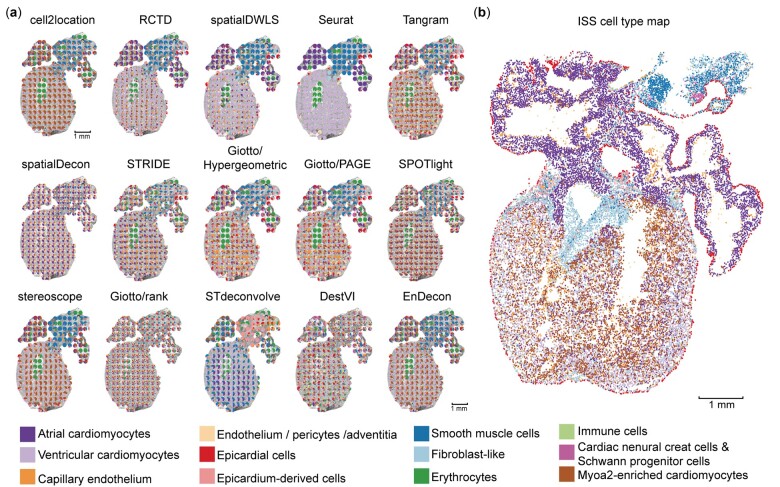
Fig. 4.
Application of different deconvolution methods on the human developing heart dataset. (a) The spatial distributions of cell type proportion predicted by 15 deconvolution methods in sample 4 at 6.5 PCW. Each pie represents the cell type proportions in each spot in the ST slide, and colors represent different cell types. (b) The spatial cell type map generated by integrating ISS and scRNA-seq data in the original study

