

Abstract
Background
Blood plasma is commonly used for biomarker research of extracellular vesicles (EVs). Removing all cells prior to analysis of EVs is essential.
Objectives
We therefore studied the efficacy of the most commonly used centrifugation protocol to prepare cell‐free plasma.
Methods
Plasma was prepared according to the double centrifugation protocol of the International Society on Thrombosis and Haemostasis (ISTH) in three independent studies. The concentrations of platelets, platelet‐derived EVs, and erythrocyte‐derived EVs were measured by calibrated flow cytometry.
Results
The mean platelet concentration ranged from 5.1 × 10⁵/ml to 2.8 × 10⁷/ml and differed 55‐fold between studies. Thus, the ISTH centrifugation protocol does not remove all platelets and results in variation between studies. As the concentration of platelet‐derived EVs and platelets correlates linearly (R 2 = .56), and the volume fraction of EVs and platelets in plasma are similar, the presence of platelets affects downstream analysis. To remove platelets a 0.8‐μm polycarbonate filter was used to lower the platelet concentration 146‐fold (p = .0013), without affecting the concentration of platelet‐derived and erythrocyte‐derived EVs (p = .982, p = .742).
Conclusions
To improve the quality of EV research, we recommend (1) measuring and reporting the platelet concentration in plasma used for EV research, or (2) removing platelets by centrifugation followed by filtration.
Keywords: biorepositories, blood plasma, extracellular vesicles, platelets, quality control, standardization
Essentials.
Blood plasma prepared by centrifugation contains platelets.
Platelets can be removed by filtration.
Filtration does not affect the concentration of extracellular vesicles.
Plasma filtration will improve the quality of extracellular vesicle research.
1. INTRODUCTION
Characterization of extracellular vesicles (EVs) in human body fluids opens the door for EV‐based biomarker research. Blood plasma is the most commonly studied body fluid for EV research. 1 In clinical studies, blood is commonly collected to prepare plasma. In turn, plasma is frozen and stored in aliquots until analysis. For EV research, plasma preparation requires removal of all cells, because a freeze–thaw cycle destroys remaining cells, thereby generating cell fragments interfering with characterization of EVs. 2 , 3 Moreover, commonly used procedures to isolate EVs, such as (ultra) centrifugation, density gradient centrifugation, and size‐exclusion chromatography, 4 , 5 are unable to separate platelets and cell fragments from EVs. 6 Consequently, cells and cell fragments will co‐isolate with EVs, thereby hampering downstream analysis and interpretation of results. 7 , 8
The removal of platelets without concurrent removal of EVs is a challenge, because blood plasma has a high viscosity (1.41 ± 0.09 mPa s at 37°C 9 ) compared to, for example, water (0.69 mPa s at 37°C 10 ), and because the density contrast particularly among EVs (1.032–1.280 g/ml), platelets (1.062–1.110 g/ml), 11 , 12 and plasma (1.025–1.060 g/ml ) is low (~1.04 13 , 14 ). When using size‐exclusion chromatography both EVs and platelets end up in the void volume. 4 , 5 Currently laboratories remove platelets with low‐speed centrifugation (<5000 g), which does not efficiently remove platelets, because even after double centrifugation platelets are still present. 15 The use of high‐speed centrifugation, however, is not an option as it results in removal of EVs. 16
In 2012, the problem of platelet removal was recognized by Lacroix et al., 17 who developed a protocol in which whole blood is centrifuged for 15 min at 2500 g. After centrifugation, plasma is collected. The collected plasma is centrifuged a second time for 15 min at 2500 g, to remove remaining cells. This protocol was published by the International Society on Thrombosis and Haemostasis (ISTH) and is informally referred to as the “ISTH protocol.” The ISTH protocol is the most commonly applied protocol to prepare plasma for EV research and was adopted by the American Heart Association as the methodological guidelines to study EVs. 18
In daily practice, however, many and often slightly different centrifugation protocols are used to remove cells, in particular platelets. 19 For instance, protocols differ regarding the number of centrifugation steps (e.g., single and double centrifugation), the use of a brake, and the volume of collected supernatant. The efficacy of these protocols to remove platelets differs but is not precisely known, 15 because the concentration of remaining platelets is not routinely measured.
The goal of this article is to study the efficacy of the ISTH protocol to prepare cell‐free plasma for EV research. This article shows that there are substantial differences in the platelet concentration in three independent studies performed by different laboratories, which all used the ISTH protocol to prepare plasma. 17 Moreover, there is a linear correlation between the concentration of EVs and the concentration of platelets in plasma, suggesting that platelets are indeed a confounder for downstream experiments, including ‐omics techniques. To effectively remove platelets without affecting the concentration of plasma EVs, a fast, cost‐effective, and reproducible filtration step is introduced.
2. MATERIALS AND METHODS
2.1. Blood collection and preparation of blood plasma
2.1.1. Study A: AFFECT EV study (Warsaw, Poland)
The Antiplatelet Therapy Effect on Extracellular Vesicles (AFFECT EV) study was approved by the local ethical committee of the Medical University of Warsaw (KB/112/2016) and registered in the ClinicalTrials database (NCT02931045). 20 Venous blood was collected from 21 healthy individuals and from 60 patients after first acute myocardial infarction. Blood was collected in 10‐ml plastic tubes containing 0.109 mol/L trisodium citrate (S‐Monovette; Sarstedt) via antecubital vein puncture using a 19‐gauge needle, without a tourniquet. The first 2 ml of blood were discarded. Blood was collected from 21 healthy individuals, and 60 patients at three different time points. Together, a total of 181 samples were analyzed, because 20 samples were omitted during the flow cytometry measurements based on quality control. The total number of subjects can be found in Table 1.
TABLE 1.
Platelet concentration in platelet‐free plasma
| Study | Collected samples | Platelet removal protocol | Plasma platelet counting | Platelet counting method | Analyzed samples | Platelet concentration (ml−1) |
|---|---|---|---|---|---|---|
| A: AFFECT Study (Warsaw, Poland) | Healthy individuals (n = 21) and myocardial infarction (n = 60 × 3 time points) | [17] | Frozen–thawed plasma | Flow cytometer | 181 | 2.8 × 10⁷ ± 1.3 × 10⁷ |
| B: Healthy donor study (Ghent, Belgium) | Healthy individuals (n = 10 × 4 blood tubes types) | [17] | Fresh and frozen–thawed plasma |
Routine hematology analyzer Flow cytometer |
40 | 9.4 × 10⁵ ± 7.3 × 10⁵ |
| C: EV reference range study healthy subjects (Amsterdam, Netherlands) | Healthy individuals (n = 224) | [17] | Fresh plasma | Flow cytometer | 221 | 5.1 × 10⁵ ± 7.0 × 10⁵ |
Note: Overview of three independent studies aimed to measure extracellular vesicles, in which the ISTH protocol was used to prepare plasma. Platelet concentration reported as mean ± standard deviation.
Abbreviations: EV, extracellular vesicles; ISTH, International Society on Thrombosis and Haemostasis.
2.1.2. Study B: Healthy donor study (Ghent, Belgium)
The study was approved by the ethical committee of Ghent University Hospital (EC/2015/0260) and performed according to the guidelines and regulations of the Declaration of Helsinki. Venous blood was collected from 10 healthy overnight fasting donors, which did not use any medication or suffer from any acute or chronic disease at the time of venipuncture. A 21‐gauge needle was used for venipuncture after applying a light tourniquet. The first few milliliters of blood were discarded. Blood from the 10 healthy donors was collected in four collection tubes containing different anticoagulants and/or preservatives: citrate (Vacuette sodium citrate 3.2%, volume 9 ml, Greiner Bio‐One B.V.), anticoagulant citrate dextrose solution A (ACD‐A; Vacutainer ACD Solution A, volume 8.5 ml, BD), ethylenediaminetetraacetic acid (EDTA; Vacutainer K2EDTA, volume 10 ml, BD), and EDTA separator (Vacuette K2EDTA with separator, volume 8 ml, Greiner Bio‐One B.V.). The drawing sequence of collection tubes was randomized.
2.1.3. Study C: EV reference range study (Amsterdam, Netherlands)
Collection of blood was performed according to the guidelines of the medical ethical committee of the Amsterdam Medical Centre, University of Amsterdam (W19_271#19.421). Blood was collected from 224 healthy individuals. All donors denied having a disease or using drugs and/or medication. Venous blood was collected using a 21‐gauge needle, and the first 2 ml of blood was discarded. One tube of EDTA blood (6 ml) was collected from each donor. A total of 224 samples was collected, of which three samples were omitted due to quality control checks. The total number of subjects can be found in Table 1.
2.2. Centrifugation protocol
In all three studies, plasma was prepared according to the ISTH protocol. 17 In study A, study C, and in the filter experiments, a Rotina 380R centrifuge was used, whereas in study B an Eppendorf 5810 R centrifuge was used. Blood was centrifuged for 15 min at 2500 g and 20°C. Then supernatant was collected and centrifuged for 15 min at 2500 g and 20°C. In study A and B, plasma was collected and stored at −80°C until analysis. In study C and in the filter experiments, the residual platelet concentration was determined in fresh plasma. For details, please see the MIFlowCyt and MIFlowCyt‐EV documents added to the Appendices S1–S4. Throughout this article, we use the term “plasma” for plasma that was prepared by the ISTH protocol, that is, plasma that is commonly referred to as “platelet‐free plasma” in the literature.
2.3. Removal of platelets with polycarbonate filters
To remove platelets from plasma without affecting the concentration of plasma EVs, we tested a track‐etched polycarbonate membrane filter with a pore diameter of 0.8 μm and a filter diameter of 25 mm (Isopore™, Merck Millipore). Blood was collected according to the protocol of study C, and plasma was prepared according to the ISTH protocol. A volume of 1 ml undiluted plasma was filtered manually with a flow rate of ~450 μl/s. Details can be found in the MIFlowCyt documents added to the Appendix S3. The concentrations of platelets and EVs were measured by flow cytometry before and after filtration.
2.4. Flow cytometry measurements of platelets
The concentration of platelets was measured by flow cytometry. A calibrated Apogee A60‐Micro (Apogee Flow Systems) was used in studies A, B, and C, whereas a FACSCanto II (BD Biosciences) was used for the filter experiments. Generally, platelets were immuno‐stained with anti‐human CD61‐APC and then measured by flow cytometry. Flow cytometry experiments were reported in accordance with MIFlowCyt. Details can be found in the MIFlowCyt documents added to the Appendices S1–S3.
2.5. Flow cytometry measurements of extracellular vesicles
In study A and the filter experiments, the concentration of EVs was measured on a calibrated A60‐Micro. Platelet‐derived EVs in plasma were immuno‐stained with anti‐human CD61‐APC, and erythrocyte‐derived EVs were immuno‐stained with anti‐human CD235a‐PE. Flow cytometry experiments were reported in accordance with MIFlowCyt‐EV. Details can be found in the MIFlowCyt‐EV documents added to the Appendices S1 and S4.
2.6. Software and statistics
Flow cytometry data were processed using FlowJo (v 10.7.1, FlowJo) and custom‐build software (MATLAB R2020b). Statistical analyses were performed using Prism 8.0 (GraphPad) and OriginPro 2017 (OriginLab). Data were log transformed and we applied the Student's t‐test to test for statistical differences in platelet concentrations. A p‐value <.05 was considered significant.
3. RESULTS
The concentration of platelets was measured in plasma samples that were prepared in three independent studies. A brief overview of these studies is provided in Table 1. In these studies, the plasma was prepared according to the current ISTH protocol. 17 , 18 Figure 1A shows that (1) all plasma samples contain detectable levels of platelets after double centrifugation; (2) the concentration of platelets ranges between 6.0 × 10⁴ to 1.0 × 10⁸/ml, that is, the concentration of platelets differs 1680‐fold between prepared plasma samples; and (3) the mean platelet concentrations differ 55‐fold between the studies.
FIGURE 1.
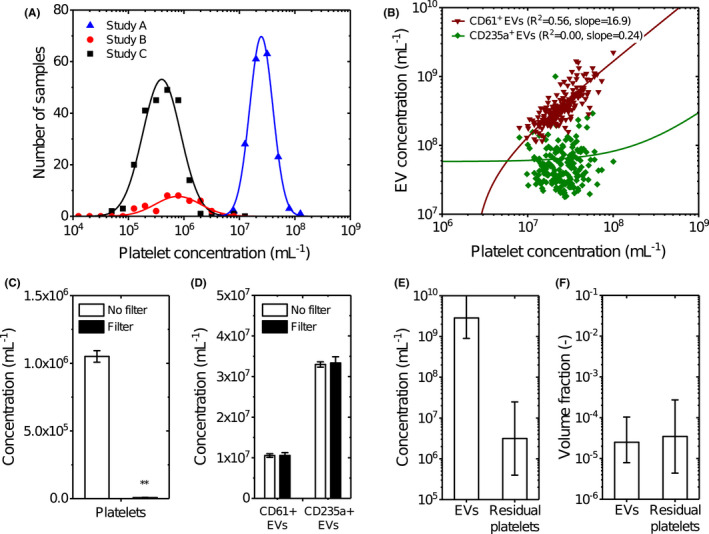
(A) Distribution of the platelet concentration in blood plasma from three independent studies measured by flow cytometry. Although all samples were double centrifuged at 2500 g for 15 min at 20°C using the fastest acceleration and lowest deceleration setting, 17 each study resulted in different distributions of the platelet concentration. In study A, blood was collected from healthy volunteers (n = 21) and patients with myocardial infarction (n = 160) and anticoagulated with citrate, and platelets were measured after a freeze–thaw cycle in plasma. In study B, blood was collected from healthy volunteers and anticoagulated with citrate (n = 10), spray‐dried K2‐EDTA (n = 10), gel plug K2‐EDTA (n = 10), and ACD‐A (n = 10), and platelets were measured after a freeze–thaw cycle in plasma. In study C, blood was collected from healthy volunteers (n = 221) and anticoagulated with EDTA, and platelets were measured in fresh plasma. Data were log transformed, binned using a bin size of 0.2, and transformed back to a linear scale. Data (symbols) have been fitted in logarithmic space with a Gaussian function (lines), resulting in fit parameters μ = 7.39, σ = 0.21, and A = 36.50 for study A; μ = 5.89, σ = 0.41, and A = 7.87 for study B; and μ = 5.60, σ = 0.34, and A = 45.45 for study C. (B) Concentration of CD61+ (triangles) and CD235a + (squares) extracellular vesicles (EVs) versus the platelet concentration in plasma of donors from study A measured by flow cytometry. Data have been fitted in with a linear function (lines), resulting in a slope of 16.9 and an intercept of −3.9 × 10⁷ for CD61+ EVs and a slope of 0.24 and an intercept of 5.8 × 10⁷ for CD235a + EVs. CD61+ EVs show a strong (R 2 = .56) and CD235a + EVs show no correlation (R 2 = .00) with the platelet concentration. Due to the log–log data representation and linear functions with an offset, the fits appear non‐linear. (C) Concentration of platelets in plasma (n = 3) after double centrifugation (open) and after double centrifugation followed by filtration with a polycarbonate filter with pore diameters of 0.8 μm (filled) measured by flow cytometry. Data are presented as the mean ± standard deviation. Double centrifugation followed by filtration with a polycarbonate filter is 146‐fold more effective in removing platelets compared to only double centrifugation (p = .0013, **). (D) Concentration of platelet‐derived (CD61+) EVs, and erythrocyte‐derived CD235a + EVs in plasma (n = 3) after double centrifugation (open) and after double centrifugation followed by filtration with a polycarbonate filter with pore diameters of 0.8 μm (filled) measured by flow cytometry. Data are presented as the mean ± standard deviation. EVs exceeding the side scatter threshold (≥10 nm2), with a diameter >200 nm, that were positively labeled with a platelet marker (CD61) and an erythrocyte marker (CD235a) were included. Double centrifugation followed by filtration with a polycarbonate does not affect the concentration of CD61+ EVs (p = .982) and CD235a + EVs (p = .742) compared to only double centrifugation. (E, F) Estimated guess of the total concentration and volume fraction of EVs and platelets in plasma. Although EVs outnumber the platelets probably with three orders of magnitude, their volume fractions in plasma are comparable. The estimated guess of the total EV concentration in plasma is based on consensus within the EV flow cytometry working group. The error bars of the platelet concentrations represent the mean concentrations of study A and C measured in panel A. Calculations of the volume fractions are explained in the Section 2.
The question is whether the presence of platelets in plasma after double centrifugation hampers the measurements of EVs. Figure 1B shows the concentration of platelet‐derived EVs and erythrocyte‐derived EVs versus the concentration of platelets in plasma of study A after a single freeze–thaw cycle. A linear function was fitted to the data using a least‐squares fitting procedure, confirming a linear relationship between the concentration of platelet‐derived EVs and the concentration of platelets (R 2 = .56). The slope of the fit reveals that for every platelet present in plasma before freezing, 17 additional platelet‐derived EVs were measured within the detection range of our flow cytometer. This observation is unique for platelets and platelet‐derived EVs, because the concentration of erythrocyte‐derived EVs does not correlate with the concentration of platelets. Thus, the presence of platelets present in plasma introduces a bias when measuring the concentration of platelet‐derived EVs in plasma after a freeze–thaw cycle.
The next question is whether platelets can be removed from plasma without affecting the EV concentration. As polycarbonate filters have well‐defined pore sizes, we hypothesized that a polycarbonate filter with pore diameters of 0.8 μm would enable the removal of platelets without affecting the concentration of EVs <0.8 μm. Figure 1C shows the measured concentration of platelets in plasma after double centrifugation followed by filtration using a 0.8‐μm polycarbonate filter. Double centrifugation followed by filtration resulted in a 146‐fold lower platelet concentration compared to double centrifugation without filtration (p = .0013).
Figure 1D shows that the measured concentrations of platelet‐derived EVs and erythrocyte‐derived EVs are unaffected by filtration within the detection range of our flow cytometer. After double centrifugation and filtration, the concentration of platelet‐derived EVs decreases by 0.24% (p = .982) compared to double centrifuged samples. The concentration of erythrocyte‐derived EVs decreased 0.99% (p = .742). Thus, double centrifugation followed by filtration does not affect the concentration of endogenous platelet‐ and erythrocyte‐derived EVs compared to double centrifugation alone. Conclusively, double centrifugation combined with a 0.8 μm polycarbonate filter effectively removes platelets without affecting the concentration of plasma EVs.
4. DISCUSSION
Here, we show that in three independent studies, using the commonly applied ISTH protocol 17 , 18 to prepare plasma, plasma still contains platelets. At first sight, the presence of “a few” platelets in plasma seems negligible, especially because EVs outnumber the platelets >1000‐fold. However, for every platelet still present in plasma, 17 additional platelet‐derived Evs were measured within the detection range of our flow cytometer. Together with the variation of the platelet concentration between laboratories and studies, the presence of platelets will induce variation in the measured concentration of platelet‐derived Evs in plasma.
Figure 1E shows an estimate of the total concentration of Evs in plasma based on literature values 21 , 22 , 23 , 24 and the range of platelet concentrations that we obtained in Figure 1A. 21 Evs outnumber platelets in plasma prepared with the ISTH protocol by at least three orders of magnitude. However, when taking into account the volume distribution of Evs and platelets, it turns out that Evs and platelets have a similar volume fraction in plasma, as shown in Figure 1F (Appendix S5). Thus, the presence of platelets may have practical consequences for most if not all types of downstream analysis. For example, the addition of detergent, which is a commonly applied procedure in bulk (‐omics) techniques, will lyse not only EVs but also platelets and platelet fragments, and thus contaminate the analysis of the biochemical composition of proteins, lipids, DNA, and RNA from EVs. Another example is the effect that residual cells may have on downstream analysis, such as EV‐associated miRNA. Also, all currently used isolation methods for plasma EVs including (ultra) centrifugation, density‐gradient centrifugation, and size‐exclusion chromatography are unable to separate EVs from platelets, resulting in contamination. 1
Platelets still present in plasma after double‐centrifugation can be effectively removed using a polycarbonate filter with pore diameters of 0.8 μm, and practically it is feasible to remove platelets without a detectable loss of EVs within the detection range of our flow cytometer. When using plasma biobanks for EV research, it is recommended to report the platelet concentration. 25 Reporting this platelet concentration is essential to interpret the measurement results, which are supposed to originate solely from plasma EVs. 8 Ideally, the platelet concentration should be measured by flow cytometry, because the concentration of platelets in plasma prepared with the ISTH protocol is below the detection limit of most routine hematology analyzers. In fact, a hematology analyzer was used in study B and resulted in a platelet concentration of 0 platelets per ml for all 40 samples.
To gain insight into the contribution(s) of pre‐analytical aspects, such as the use of different centrifugation protocols to EV research, the Rigor and Standardization Subcommittee of the International Society for Extracellular Vesicles (ISEV) initiated a task force on blood EVs in 2019. A survey among blood EV task force members revealed a need for clinically applicable quality control parameters, for example to monitor the efficacy of centrifugation protocols when preparing plasma for EV research. 25 Suggested quality control parameters include measurements of (1) the platelet concentration, (2) hemolysis, and (3) lipid profile. This study confirms the need for measuring the platelet concentration as a quality control parameter.
In clinical practice it may not always be feasible to apply a time‐consuming three‐step protocol, involving two sequential centrifugation steps followed by filtration, but reporting the platelet concentration in prepared plasma samples at the very least provides insight into the quality of samples, the interpretation of results, and the limitations of EV studies. 25 To minimize the steps of the protocol a filter may be used after a single centrifugation step. Rikkert et al. showed that a single centrifugation step of 20 min at 5000 g removes platelets as effective as the ISTH centrifugation protocol, 15 in which the plasma is centrifuged twice for 15 min at 2500 g. However, a single‐step centrifugation approach in combination with filtration needs further investigation. Moreover, the commercially available track‐etched polycarbonate membrane filters are delivered with a bulky, reusable filter housing, which (1) results in a dead volume of ~100 μl, (2) requires thorough cleaning of the filter housing, and (3) may lead to spill‐over between samples. If these filters become as important as size‐exclusion chromatography to the field of EV research, industry should consider developing more practical, disposable filters with a minimized dead volume and perhaps an automated system utilizing a pump to regulate the pressure. Future developments may also lead to a combination of filters built into standard isolation techniques, such as size‐exclusion chromatography.
The present study demonstrates that although centrifugation of blood and plasma is an efficient procedure to remove cells including platelets, preparation of “platelet‐depleted” or truly “platelet‐free” plasma by low‐speed centrifugation is impossible. Consequently, commonly used terms such as “platelet‐depleted” and “platelet‐free” plasma are misleading. Moreover, because the size and volume of remaining platelets in plasma is still relatively large compared to the EVs present in plasma, and because most if not all of the currently used isolation procedures of EVs are unable to separate platelets from EVs, platelets are a main confounder. Removal of platelets by filtration offers an excellent opportunity to prepare plasma that is nearly free from platelets, and removal of platelets, most efficiently before freeze–thawing plasma, is expected to improve the quality of plasma samples stored in biobanks for future EV analyses. Similarly, removal of platelets is expected to improve downstream characterization of isolated EVs, for example for proteomics or miRNA profiling. Thus, we consider removal of platelets an important contribution for future biomarker exploration of EVs.
AUTHOR CONTRIBUTIONS
Conceptualization: B.B., R.N. and E.v.d.P.; data curation: B.B. and E.v.d.P.; formal analysis: B.B. and E.v.d.P.; investigation: B.B., A.G., B.L., and B.D.; project administration: B.B., R.N., and E.v.d.P.; resources: A.G., A.H., R.N., and E.v.d.P.; visualization: B.B. and E.v.P.; writing—original draft: B.B., R.N., and E.v.d.P.; writing—review & editing: B.B., A.G., B.L., B.D., A.H., R.N., and E.v.d.P.
CONFLICTS OF INTERERST
EvdP is co‐founder and shareholder of the company Exometry B.V. (Amsterdam, the Netherlands). BB, AG, BL, BD, AH, and RN declare no conflicts of interest.
FUNDING INFORMATION
EvdP acknowledges funding from the Netherlands Organization for Scientific Research ‐ Domain Applied and Engineering Sciences (NWO‐TTW), research programmes VENI 15924. BB acknowledges funding for project 18HLT01: METVES II, which has received funding from the EMPIR programme co‐financed by the Participating States and from the European Union's Horizon 2020 research and innovation programme. AG acknowledges funding from the PRELUDIUM Grant of the Polish National Science Centre (2018/31/N/NZ7/02260). BD acknowledges funding by “Kom op tegen Kanker (Stand up to Cancer), the Flemisch cancer society.” BL acknowledges funding by National Natural Science Foundation of China (81702100, 82172371), the Natural Science Foundation of Guangdong Province (2019A1515011077), and the Outstanding Youths Development Scheme of Nanfang Hospital, Southern Medical University (2020 J007).
Supporting information
Appendix S1
Appendix S2
Appendix S3
Appendix S4
Appendix S5
Appendix S6
ACKNOWLEDGMENTS
The authors thank C. M. Hau and N. Hajji for excellent technical support.
Bettin B, Gasecka A, Li B, et al. Removal of platelets from blood plasma to improve the quality of extracellular vesicle research. J Thromb Haemost. 2022;20:2679‐2685. doi: 10.1111/jth.15867
Manuscript handled by: Patricia Liaw
Final decision: Patricia Liaw, 29 August 2022
REFERENCES
- 1. Royo F, Théry C, Falcón‐Pérez JM, Nieuwland R, Witwer KW. Methods for separation and characterization of extracellular vesicles: results of a worldwide survey performed by the ISEV rigor and standardization subcommittee. Cells. 2020;9:1955. [DOI] [PMC free article] [PubMed] [Google Scholar]
- 2. Suštar V, Bedina‐Zavec A, Stukelj R, et al. Nanoparticles isolated from blood: a reflection of vesiculability of blood cells during the isolation process. Int J Nanomed. 2011;6:2737‐2748. [DOI] [PMC free article] [PubMed] [Google Scholar]
- 3. Artoni A, Merati G, Padovan L, Scalambrino E, Chantarangkul V, Tripodi A. Residual platelets are the main determinants of microparticles count in frozen‐thawed plasma. Thromb Res. 2012;130:561‐562. [DOI] [PubMed] [Google Scholar]
- 4. Böing AN, van der Pol E, Grootemaat AE, Coumans FAW, Sturk A, Nieuwland R. Single‐step isolation of extracellular vesicles by size‐exclusion chromatography. J Extracell Vesicles. 2014;3. doi: 10.3402/jev.v3.23430 [DOI] [PMC free article] [PubMed] [Google Scholar]
- 5. Vollmar B, Slotta JE, Nickels RM, Wenzel E, Menger MD. Comparative analysis of platelet isolation techniques for the in vivo study of the microcirculation. Microcirculation. 2003;10:143‐152. [DOI] [PubMed] [Google Scholar]
- 6. Rikkert LG, Engelaer M, Hau CM, Terstappen LWMM, Nieuwland R, Coumans FAW. Rate zonal centrifugation can partially separate platelets from platelet‐derived vesicles. Res Pract Thromb Haemost. 2020;4:1053‐1059. [DOI] [PMC free article] [PubMed] [Google Scholar]
- 7. Yuana Y, Bertina RM, Osanto S. Pre‐analytical and analytical issues in the analysis of blood microparticles. Thromb Haemost. 2011;105:396‐408. [DOI] [PubMed] [Google Scholar]
- 8. Mitchell AJ, Gray WD, Hayek SS, et al. Platelets confound the measurement of extracellular miRNA in archived plasma. Sci Rep. 2016;6:32651. [DOI] [PMC free article] [PubMed] [Google Scholar]
- 9. Klaver JH, Greve EL, Goslinga H, Geijssen HC, Heuvelmans JH. Blood and plasma viscosity measurements in patients with glaucoma. Br J Ophthalmol. 1985;69:765‐770. [DOI] [PMC free article] [PubMed] [Google Scholar]
- 10. Viswanath DS, Natavajan G. Data Book on the Viscosity of Liquids. Hemisphere Publishing; 1989. [Google Scholar]
- 11. Corash L, Tan H, Gralnick HR. Heterogeneity of human whole blood platelet subpopulations. I. Relationship between buoyant density, cell volume, and ultrastructure. Blood. 1977;49:71‐87. [PubMed] [Google Scholar]
- 12. Martin JF, Shaw T, Heggie J, Penington DG. Measurement of the density of human platelets and its relationship to volume. Br J Haematol. 1983;54:337‐352. [DOI] [PubMed] [Google Scholar]
- 13. Martin JF, Plumb J, Kilbey RS, Kishk YT. Changes in volume and density of platelets in myocardial infarction. Br Med J (Clin Res Ed). 1983;287:456‐459. [DOI] [PMC free article] [PubMed] [Google Scholar]
- 14. Trudnowski RJ, Rico RC. Specific gravity of blood and plasma at 4 and 37 C. Clin Chem. 1974;20:615‐616. [PubMed] [Google Scholar]
- 15. Rikkert LG, Coumans FAW, Hau CM, Terstappen LWMM, Nieuwland R. Platelet removal by single‐step centrifugation. Platelets. 2021;32:440‐443. [DOI] [PubMed] [Google Scholar]
- 16. Rikkert LG, van der Pol E, van Leeuwen TG, Nieuwland R, Coumans FAW. Centrifugation affects the purity of liquid biopsy‐based tumor biomarkers. Cytometry A. 2018;93:1207‐1212. [DOI] [PMC free article] [PubMed] [Google Scholar]
- 17. Lacroix R, Judicone C, Poncelet P, et al. Impact of pre‐analytical parameters on the measurement of circulating microparticles: towards standardization of protocol. J Thromb Haemost. 2012;10:437‐446. [DOI] [PubMed] [Google Scholar]
- 18. Coumans FAW, Brisson AR, Buzas EI, et al. Methodological guidelines to study extracellular vesicles. Circ Res. 2017;120:1632‐1648. [DOI] [PubMed] [Google Scholar]
- 19. Van Deun J, Mestdagh P, Agostinis P, et al. Others. EV‐TRACK: transparent reporting and centralizing knowledge in extracellular vesicle research. Nat Methods. 2017;14:228‐232. [DOI] [PubMed] [Google Scholar]
- 20. Gasecka A, Nieuwland R, Budnik M, et al. Randomized controlled trial protocol to investigate the antiplatelet therapy effect on extracellular vesicles (AFFECT EV) in acute myocardial infarction. Platelets. 2018;31:1‐7. [DOI] [PubMed] [Google Scholar]
- 21. Arraud N, Linares R, Tan S, et al. Extracellular vesicles from blood plasma: determination of their morphology, size, phenotype and concentration. J Thromb Haemost. 2014;12:614‐627. [DOI] [PubMed] [Google Scholar]
- 22. de Rond L, van der Pol E, Hau CM, et al. Comparison of generic fluorescent markers for detection of extracellular vesicles by flow cytometry. Clin Chem. 2018;64:680‐689. [DOI] [PubMed] [Google Scholar]
- 23. de Rond L, Libregts SFWM, Rikkert LG, et al. Refractive index to evaluate staining specificity of extracellular vesicles by flow cytometry. J Extracell Vesicles. 2019;8:1643671. [DOI] [PMC free article] [PubMed] [Google Scholar]
- 24. Gasecka A, Nieuwland R, Budnik M, et al. Ticagrelor attenuates the increase of extracellular vesicle concentrations in plasma after acute myocardial infarction compared to clopidogrel. J Thromb Haemost. 2020;18:609‐623. [DOI] [PMC free article] [PubMed] [Google Scholar]
- 25. Clayton A, Boilard E, Buzas EI, et al. Considerations towards a roadmap for collection, handling and storage of blood extracellular vesicles. J Extracell Vesicles. 2019;8:1647027. [DOI] [PMC free article] [PubMed] [Google Scholar]
Associated Data
This section collects any data citations, data availability statements, or supplementary materials included in this article.
Supplementary Materials
Appendix S1
Appendix S2
Appendix S3
Appendix S4
Appendix S5
Appendix S6