

Abstract
Objective
To summarise latent tuberculosis infection (LTBI) management strategies among household contacts of bacteriologically confirmed pulmonary tuberculosis (TB) patients in high‐TB burden countries.
Methods
PubMed/MEDLINE (NCBI) and Scopus were searched (January 2006 to December 2021) for studies reporting primary data on LTBI management. Study selection, data management and data synthesis were protocol‐driven (PROSPERO‐CRD42021208715). Primary outcomes were the proportions of LTBI, initiating and completing tuberculosis preventive treatment (TPT). Reported factors influencing the LTBI care cascade were qualitatively synthesised.
Results
From 3694 unique records retrieved, 58 studies from 23 countries were included. Most identified contacts were screened (median 99%, interquartile range [IQR] 82%–100%; 46 studies). Random‐effects meta‐analysis yielded pooled proportions for: LTBI 41% (95% confidence interval [CI] 33%–49%; 21,566 tested contacts); TPT initiation 91% (95% CI 79%–97%; 129,573 eligible contacts, 34 studies); TPT completion 65% (95% CI 54%–74%; 108,679 TPT‐initiated contacts, 28 studies). Heterogeneity was significant (I 2 ≥ 95%–100%) and could not be explained in subgroup analyses. Median proportions (IQR) were: LTBI 44% (28%–59%); TPT initiation 86% (60%–100%); TPT completion 68% (44%–82%). Nine broad themes related to diagnostic testing, health system structure and functions, risk perception, documentation and adherence were considered likely to influence the LTBI care cascade.
Conclusion
The proportions of household contacts screened, detected with LTBI and initiated on TPT, though variable was high, but the proportions completing TPT were lower indicating current strategies used for LTBI management in high TB burden countries are not sufficient.
Keywords: diagnosis, high TB burden settings, household contacts, isoniazid preventive therapy, latent TB infection, screening, TB preventive therapy, treatment, tuberculosis
INTRODUCTION
Tuberculosis (TB) is a major public health problem and a leading cause of death worldwide. Over 10 million people are estimated to have developed TB in 2020; the majority were from 30 high TB burden, resource‐constrained, low‐ and middle‐income countries (LMICs) [1]. In 2014, the World Health Assembly adopted World Health Organisation's (WHO) End TB Strategy which aims to eliminate the global TB epidemic by the year 2035 [2].
Latent tuberculosis infection (LTBI) is a condition of persistent immune response to infection by Mycobacterium tuberculosis (M.tb) in people with no evidence of active TB disease [3, 4]. It is estimated that approximately 1.7 billion individuals (nearly a quarter of the global population) were infected with LTBI in 2014, with a 5%–10% lifetime risk of developing active TB; and that over 50% of the household contacts of smear‐positive index TB patients in LMICs have LTBI [5, 6]. Hence, WHO recommends that those with LTBI should be treated with tuberculosis preventive therapy (TPT) to realise the goals of the End TB Strategy [7].
Contact investigation is an essential component of the WHO's TB management algorithms to detect those with LTBI among high‐risk groups, and to initiate TPT [4, 7, 8]. WHO guidelines recommend home visits as the preferred mode of contact investigation; however, when home visits are not possible, contact investigation at a health facility is recommended. In either case, WHO advocates that trained staff should elicit the required information from the index TB patients [8] and counsel patients and their family members on the importance of LTBI testing, TPT initiation and completion [4, 7, 8]. WHO recommends the tuberculin skin test (TST) or interferon‐gamma release assays (IGRA) to detect LTBI [8]. TST is a reasonably low‐cost tool; however, its production is limited. IGRA results in fewer false‐positive results than with TST, but has higher cost and supply chain issues that challenge its routine induction in national TB programmes in LMICs [8].
The options for TPT currently recommended by WHO for adults and children with LTBI, regardless of human immunodeficiency virus (HIV) status, include: (1) isoniazid monotherapy daily for 6 or 9 months, (2) rifampicin plus isoniazid daily for 3 months, (3) rifapentine plus isoniazid weekly for 3 months, (4) a 1‐month daily regimen of rifapentine or isoniazid, or (5) 4 months of daily rifampicin [8]. As per the recommendations, child contacts under 5 years of age can be provided with TPT irrespective of their LTBI status after excluding TB [4, 7, 8].
The first‐ever United Nations high‐level meeting (UNHLM) declaration in 2018 envisaged the rapid scale‐up of access to LTBI testing and provision of TPT, with a special focus on high TB burden countries, so that at least 30 million people receive TPT by 2022 [9]. In many low‐burden, high‐income countries, systematic LTBI management has contributed to lower rates of active TB. However, in high TB burden LMICs, this is challenging as it requires the diversion of resources from treating people with active TB.
An ideal cascade of care for TPT starts with identifying the eligible population, screening for and excluding active TB, diagnosing LTBI, initiating TPT and ensuring TPT completion. Multiple factors operating at every step of the cascade affect the implementation of TPT. For instance, limited finance and manpower, low rates of contact screening and treatment initiation, inadequate documentation of cascade components and so on are some of the factors that adversely affect TPT implementation in LMICs with a high TB burden [3, 10, 11, 12, 13].
Synthesising evidence on implementation strategies and factors that affect TPT in high TB burden settings is imperative to inform attempts to achieve the global targets for managing LTBI. A recent systematic review and meta‐analysis found that contact investigation was effective in high‐burden settings [14]. Another mixed‐methods systematic review discussed the child contact losses that occur through the care cascade, along with the variations in the screening, initiation and completion of isoniazid preventive therapy among child contacts [15]. However, strategies used for child contact management were not described. While these reviews provide information on the prevalence of LTBI and the risk of incident TB, information on effective implementation strategies for the care cascade remains unclear.
This systematic review aimed to summarise the strategies used in high TB burden countries for screening and determining the eligibility for TPT among the household contacts of bacteriologically confirmed pulmonary TB patients, and to evaluate the outcomes of these strategies with respect to TPT initiation and completion. We also sought to ascertain the factors influencing these strategies and outcomes.
METHODS
This review followed the methods described in the Preferred Reporting Items for a Systematic Review and Meta‐analysis (PRISMA) 2020 statement [16] and was based on a protocol registered on the International Prospective Register of Systematic Reviews (PROSPERO ID # CRD42021208715).
Search strategy and eligibility criteria
We searched PubMed/MEDLINE (NCBI) and SCOPUS (Elsevier) for primary studies published between 1 January 2006 and 31 December 2021 describing the strategies for implementing TPT among household contacts of pulmonary TB patients in high‐burden countries that reported data on aspects of the TPT care cascade. The initial search did not yield studies in child contacts; therefore, to ensure that all age groups were covered, the search strategy was rerun with additional keywords (child contacts) and the new output was reviewed for inclusion (Table S1). We included studies published in English that reported data on strategies used in screening household contacts of bacteriologically confirmed pulmonary TB patients for LTBI. The operational definitions we used are provided in Table S2. The permitted study designs included randomised/non‐randomised controlled trials (RCTs/non‐RCTs), prospective and retrospective cohort studies, cross‐sectional studies, longitudinal studies, cost‐effectiveness studies and studies with mixed designs. Studies without usable numerical data for any component of the TPT care cascade, as well as those conducted primarily in clinically vulnerable and immunocompromised groups, qualitative studies, and studies published in languages other than English, were excluded.
Selection of studies and data management process
The search results were exported to the web‐application Rayyan (https://www.rayyan.ai/). Three review authors (KS, KDS and MM) independently screened titles and abstracts for eligibility and selected studies. Full texts were evaluated, or study authors were contacted, for additional information to determine eligibility, and disagreements were resolved through discussion. A fourth author (PT) independently checked the appropriateness of study selection.
We used a data extraction form that had been pre‐tested by two review authors (KS and KSS). Data were extracted independently by three review authors (KS, MM and KSS) and were checked by a fourth author (PT). From each study, we extracted data regarding the target population, sample size, age of household contacts, setting, study design, screening strategies, tests used, and the proportions with positive test results, proportions initiating and completing TPT among those eligible, loss‐to‐follow‐up, adverse events and treatment failures (incident TB while on TPT). We listed the factors that were reported by study authors as influencing the TPT care cascade. We contacted study authors for clarifications and for missing data. Since different study designs that assessed different aspects of the TPT care cascade were used, a formal risk of bias assessment was not possible, but deficiencies in reporting relevant data were recorded.
Data synthesis and statistical analysis
Extracted data regarding the characteristics of the included studies were analysed using descriptive statistics with Microsoft Excel. The primary outcomes of interest were the proportions of household contacts who were screened and tested for LTBI, and who initiated and completed TPT. We conducted meta‐analyses using the metafor package for the statistical software environment R (https://www.metafor-project.org/doku.php) and generated forest plots of the pooled estimates with 95% confidence intervals (CIs) for the proportions with LTBI (positive either by TST or IGRA or both as defined by study authors), and for the proportions initiating TPT among those eligible, and completing TPT. We anticipated that studies estimating LTBI positivity conducted in different regions of the world over several decades, and using different screening and diagnostic tests, algorithms and treatment protocols would result in substantial heterogeneity, and used the random‐effects model in meta‐analyses. We quantified heterogeneity using the I 2 statistic with a value more than 50% to denote significant inconsistency in the estimates. This indicates that more than half of the total heterogeneity stems from between‐study variance that could not be explained by sampling error. We also reported Tau2 (τ 2) with a value more than zero denoting the absolute value of the true variance (heterogeneity); higher values of τ 2 indicate greater heterogeneity.
We explored potential causes for significant heterogeneity in LTBI estimates in the following subgroup analyses: (1) the tests used to diagnose LTBI (TST, IGRA, combination); (2) the place of testing (hospital or health facility, household, both); and (3) the study design used (prospective, cross‐sectional or retrospective). We separately analysed the LTBI positivity in studies done in Africa, Asia and South America, sub‐grouped by countries within geographical regions within these continents. We also explored LTBI positivity in studies using TST alone sub‐grouped by the place of testing, and by the size of the skin induration used to denote a positive TST result (≥5 mm; ≥10 mm). Regarding the proportions initiating and completing TPT, we explored heterogeneity in subgroup analysis of studies including children aged <6 years; <18 years; all age groups. We also reported the range and the median and interquartile range (IQR) of these proportions for the overall pooled results and in the subgroups. Factors reported in the studies that were considered by study authors to have influenced the TPT care cascade outcomes were extracted and grouped under common categories.
RESULTS
Search results
The search yielded 3694 unique records after duplicates were removed. Figure 1 depicts the flow of the search and selection process.
FIGURE 1.
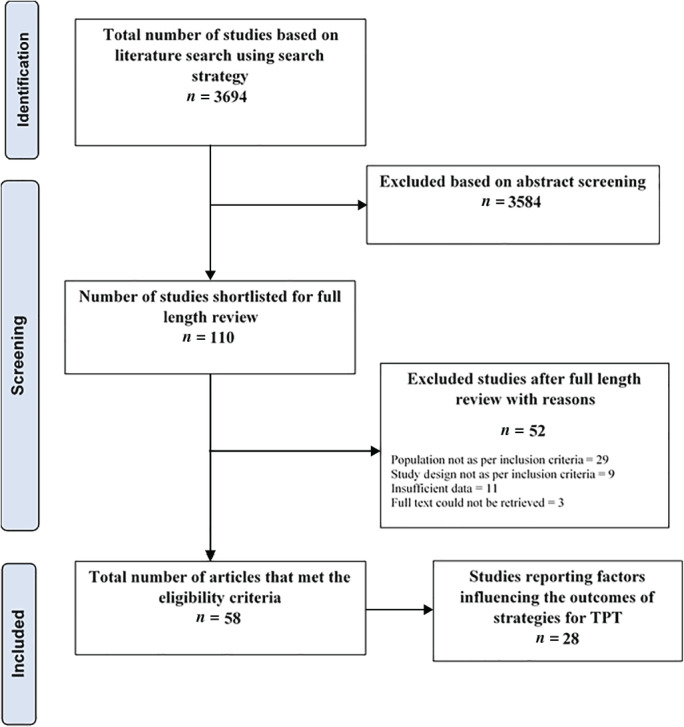
Flow diagram for study selection. TPT, tuberculosis preventive treatment
After screening the title and abstracts, 3584 records not relevant to this review were excluded (Figure 1). The full texts of 110 potentially eligible studies were assessed, and 52 studies were excluded because disaggregated data for household and non‐household contacts were not available (n = 29); or the study designs were inappropriate (n = 9); or there were insufficient data regarding components of the TPT cascade (n = 11). We included 58 studies that satisfied eligibility criteria in qualitative and quantitative synthesis (meta‐analysis).
Study characteristics
Table 1 summarises the characteristics of the 58 studies conducted in 23 LMICs that were included in this review. Twenty‐eight studies (48%) were conducted in Africa (12 from countries in East Africa, 7 from West Africa and 9 in Southern Africa). Twenty‐five studies (43%) were conducted in Asia, of which 17 were conducted in countries in South Asia (with 15 from India); 5 in South East Asia and 3 in East Asia. Three studies were done in South America (all from Brazil). Two were multi‐country cost‐effectiveness studies (one included countries in Central and West Africa and the other included centres in Asian and African countries). The majority of the studies (45/58, 78%) were published between 2011 and 2020, while six were published before 2010 (2006–2009), and seven were published in 2021. The study designs included prospective cohorts [n = 28], prospectively ascertained programme datasets [n = 6], RCTs [n = 2], cross‐sectional studies [n = 19], retrospective cohorts [n = 1] and mixed designs [n = 2].
TABLE 1.
Characteristics of the included studies
| No. | Study ID | Geographic region | TB incidence/100,000 people a | Target population | Household contacts screened among those identified (%) | Place/setting | Study design | Screening | Diagnostic test(s) | TPT initiated/completed |
|---|---|---|---|---|---|---|---|---|---|---|
| 1. | Bonnet_Uganda_2017 [17] | East Africa | 196 | Children <5 years | 281/339 (82.9) | HC/urban | Prospective cohort | V + CXR | TST | Both |
| 2. | Chandrasekaran_India_2018 [18] | South Asia | 188 | Adults + children | 1048/NR | HC/NR | Prospective cohort | CXR | TST + IGRA | NR |
| 3. | Machado_Brazil_2009 [19] | South America | 45 | Adults + children | 261/301 (86.7) | HC/NR | Prospective cohort | NR | TST | Both |
| 4. | MacPherson_South Africa_2020 [20] | Southern Africa | 554 | Adults + children | 2725/2985 (91.3) | HH/NR | RCT | V + CXR | TST | NR |
| 5. | Odera_Kenya_2020 [21] | East Africa | 259 | Adults ≥18 years | 175/NR | HC/semi‐urban | Cross‐sectional | NR | IGRA | NR |
| 6. | Praveen_India_2020 [22] | South Asia | 188 | Adults + children ≥12 years | 220/NR | HH/NR | Cross‐sectional | V | TST | NR |
| 7. | Ronge South Africa_2021 [23] | Southern Africa | 554 | Children ≤15 years | 669/669 (100) | HH/urban | Cross‐sectional | CXR | IGRA | NR |
| 8. | Rutherford_Indonesia_2012 [24] | South East Asia | 301 | Children 6 months to 9 years | 320/320 (100) | HC/urban | Prospective cohort | V | TST + IGRA | NR |
| 9. | Shah_South Africa_2011 [25] | Southern Africa | 554 | Children 6–16 years | 270/270 (100) | HH + HC/NR | Prospective cohort | NR | TST + IGRA | NR |
| 10. | Sharma_India_2017 [26] | South Asia | 188 | Adults + children 1–65 years | 1511/1511 (100) | HH/NR | Prospective cohort | V + CXR | TST + IGRA | NR |
| 11. | Stein_Uganda_2018 [27] | East Africa | 196 | Adults + children | 2585/3102 (83.3) | HH/NR | Prospective cohort | V | TST | NR |
| 12. | Zhang_China_2019 [28] | East Asia | 59 | Adults + adolescents >14 years | 196/196 (100) | HC/NR | Prospective cohort | V + CXR | IGRA | NR |
| 13. | Akhtar_Pakistan_2009 [29] | South Asia | 259 | Adults + ≥3 months | 385/385 (100) | HH/rural | Cross‐sectional | V | TST | NR |
| 14. | Hu_China_2013 [30] | East Asia | 59 | Children + adolescents 9–18 years | 1120/1136 (98.6) | School/urban | Cross‐sectional | V + CXR | IGRA | NR |
| 15. | Araujo_Brazil_2020 [31] | South America | 554 | Adults + children | 394/NR | HC/urban | Retrospective cohort | V | TST | Both |
| 16. | Maraise_South Africa_2006 [32] | Southern Africa | 554 | Children <5 years | 260/274 (94.9) | HC/urban | Prospective cohort | CXR | TST | Both |
| 17. | Nakaoka_Nigeria_2006 [33] | West Africa | 219 | Children <15 years | 161/161 (100) | HH/urban | Cross‐sectional | V | TST + IGRA | NR |
| 18. | Oxlade_Multicentric_2021 [34] b | South East Asia (Indonesia, Vietnam), West Africa (Ghana) | Indonesia = 301, Viet Nam = 176, Ghana = 143 | Children <5 years | 1619/1619 (100) | HC/rural + urban | RCT | V + CXR | TST | Initiated |
| 19. | Sun_China_2021 [35] | East Asia | 59 | Children + adolescents ≤18 years | 95/95 (100) | HC/rural + urban | Prospective cohort | V | TST + IGRA | NR |
| 20. | Triasih_Indonesia_2016 [36] | South East Asia | 301 | Children ≤15 years | 269/413 (65.1) | HC/NR | Prospective cohort | V + CXR | TST | Both |
| 21. | Adjobimey_Benin_2016 [37] | West Africa | 55 | Children <5 years | 497/499 (99.6) | HC/urban | Prospective cohort | V | ND | Both |
| 22. | Amisi_Kenya_2021 [38] | East Africa | 259 | Children <5 years | 553/NR | HC/rural + urban | Programme data | V + CXR | ND | Both |
| 23. | Silva_Brazil_2016 [39] | South America | 45 | Children ≤15 years | 1078/NR | HC/NR | Cross‐sectional | CXR | TST | Both |
| 24. | Burmen_Kenya_2014 [40] | East Africa | 259 | Children <5 years | 337/345 (97.7) | NR/rural + urban | Programme data | V | ND | Initiated |
| 25. | Garie_Ethiopia_2011 [41] | East Africa | 132 | Children <15 years | 184/184 (100) | HC/urban | Prospective cohort | V | TST | Both |
| 26. | Ginderdeuren_South Africa_2021 [42] | Southern Africa | 554 | Children <15 years | 77/170 (45.1) | HC/urban | Prospective cohort | V | ND | Both |
| 27. | Krishnamoorthy_India_2021 [43] | South Asia | 188 | Adults + children | 1523/NR | HC/NR | Prospective cohort | V + CXR | TST | NR |
| 28. | Narasimhan_India_2017 [44] | South Asia | 188 | Adults + children | 359/491 (73.1) | HH/NR | Prospective cohort | V | TST + IGRA | NR |
| 29. | Paradkar_India_2020 [45] | South Asia | 188 | Adults + children ≥1 year | 997/1009 (98.8) | HH + HC/NR | Prospective cohort | V | TST + IGRA | NR |
| 30. | Okwara_Kenya_2017 [46] | East Africa | 259 | Children <5 | 428/428 (100) | HC/rural | Prospective cohort | V | TST | Both |
| 31. | Paul_Nigeria_2019 [47] | West Africa | 219 | Children ≤5 years | 63/NR | HC/NR | Prospective cohort | V + CXR | TST | Both |
| 32. | Rekha_India_2009 [13] | South Asia | 188 | Children ≤14 years | 31/220 (14.1) | HC/rural + urban | Cross‐sectional | V | NR | Both |
| 33. | Rutherford _Indonesia_2012 [48] | South East Asia | 301 | Children <5 years | 150/150 (100) | HC/NR | Prospective cohort | V | TST + IGRA | Both |
| 34. | Sulis_Burkina Faso_2018 [49] | West Africa | 46 | Children <5 years | 956/1166 (82.0) | HH/rural + urban | Programme data | V | ND | Initiated |
| 35. | Pothukuchi _India_2011 [10] | South Asia | 188 | Children <6 years | 116/172 (67.4) | HH/rural + urban | Cross‐sectional | V | ND | Both |
| 36. | Rekha_India_2013 [50] | South Asia | 188 | Children <6 years | 53/87 (60.9) | HH/rural + urban | Prospective cohort | U | ND | Both |
| 37. | Shivaramakrishna_India_2014 [51] | South Asia | 188 | Children <6 years | 218/271 (80.4) | HH/rural | Cross‐sectional | U | ND | Both |
| 38. | Seid_Ethiopia_2020 [52] | East Africa | 132 | Children <5 years | 125/129 (96.9) | HC/urban | Mixed methods | U | ND | Both |
| 39. | Singh_India_2017 [12] | South Asia | 188 | Children <5 years | 51/59 (86.4) | HH/rural | Mixed methods | U | ND | Both |
| 40. | Tadesse_Ethiopia_2016 [53] | East Africa | 132 | Children <5 years | 237/282 (84.0) | HC/NR | Programme data | U | ND | Both |
| 41. | Belgaumkar_India_2018 [11] | South Asia | 188 | Children <6 years | 53/178 (29.8) | HC/NR | Cross‐sectional | U | ND | Both |
| 42. | Birungi_Rwanda _2019 [54] | East Africa | 58 | Children <5 years | 94/94 (100) | HC/NR | Prospective cohort | V + CXR | ND | Both |
| 43. | Black_South Africa_2018 [55] | Southern Africa | 554 | Children <5 years | 184/261 (70.5) | HC/NR | Cross‐sectional | V + CXR | TST | Both |
| 44. | Chauhan_India_2013 [56] | South Asia | 188 | Children <5 years | 253/NR | HC/NR | Prospective cohort | V + CXR | TST | NR |
| 45. | Datiko_Ethiopia_2017 [57] | East Africa | 132 | Adults + Children | 24,267/24,267 (100) | HC/rural | Prospective cohort | V + CXR | ND | Both |
| 46. | Egere_Gambia_2016 [58] | West Africa | 157 | Children <5 years | 404/404 (100) | HH/rural + urban | Prospective cohort | V | TST | Both |
| 47. | Wysocki_Brazil_2016 [59] | South America | 554 | Adults + children | 267/326 (81.9) | HC/urban | Cross‐sectional | V | TST | Both |
| 48. | Fentahun_Ethiopia_2020 [60] | East Africa | 132 | Children <5 years | 149/230 (64.8) | HC/urban | Cross‐sectional | V | ND | Initiated |
| 49. | Faksri_Thailand_2015 [61] | South East Asia | 150 | Adults + children | 100/100 (100) | HC/NR | Cross‐sectional | V | TST + IGRA | NR |
| 50. | Sayedi_Afghanistan_2020 [62] | South Asia | 193 | Adults + Children | 586,292/856,782 (68.4) | HH/urban | Programme data | V | ND | Both |
| 51. | Schwoebel_Multicentric_2020 [63] | Central Africa (Bangui, Cameroon), West Africa (Benin, Burkina Faso) | 815 | Children <5 years | 1965/1965 (100) | HH/urban | Prospective cohort | V + CXR | TST | Both |
| 52. | Sharma_India_2021 [64] | South Asia | 188 | Children <5 years | 86/NR | HH/urban | Prospective cohort | V | ND | Both |
| 53. | Soelen_South Africa_2012 [65] | Southern Africa | 554 | Children <5 years | 39/NR | HC/urban | Programme data | NR | ND | Initiated |
| 54. | Gomes_Guinea‐Bissau_2011 [66] | West Africa | 361 | Children <15 years | 1895/1904 (99.5) | HH/urban | Prospective cohort | V | TST | Both |
| 55. | Hector_Malawi_2017 [67] | Southern Africa | 141 | Children <15 years | 56/56 (100) | HC/urban | Cross‐sectional | V | TST | NR |
| 56. | Mensah_Ghana_2017 [68] | West Africa | 143 | Adults + children ≥6 months | 112/112 (100) | HC/urban | Cross‐sectional | NR | IGRA | NR |
| 57. | Nguyen_Laos_2009 [69] | South East Asia | 149 | Adults + children | 148/148 (100) | HH/urban | Cross‐sectional | NR | TST | NR |
| 58. | Mzembe_South Africa_2020 [70] | Southern Africa | 554 | Children + adolescents 10–19 years | 1809/NR | HH + HC/rural | Cross‐sectional | NR | IGRA | NR |
Abbreviations: CXR, only chest x‐ray; HC, health centre; HH, house‐to‐house; IGRA, interferon‐gamma release assay; ND, not done; NR, not reported; RCT, randomised controlled trial; TB, tuberculosis; TST, tuberculin skin test; U, unclear; V, only verbal screening; V + CXR, verbal screening + chest x‐ray.
TB Incidence: The World Bank Data, 2020, https://data.worldbank.org/indicator/SH.TBS.INCD?locations=BJ.
Data only for children <5 years from the low‐ and middle‐income countries evaluated.
In 27 (46%) of the studies, the target population was children, with only children <6 years of age included in 25 (43%). Children and adolescents were the target population in 12 (21%), only adult contacts in 1 (2%), only adolescents and adults in 1 (2%) and contacts of all ages in 17 (29%) of the studies. Household screening strategies were used in 19 (33%), and facility‐based screening was used in 35 (60%) of the studies. Three studies used both approaches, and the approach was unclear in one.
Thirty‐six (62%) of the studies reported data on screening and LTBI diagnosis, of which 14 also reported on TPT initiation/completion. Thirty‐four (59%) reported on components of TPT initiation/completion, of which 20 did not report data for LTBI diagnosis. Twenty‐eight studies (48%) provided information on the factors that may have affected the outcomes of the TPT cascade.
Components of the TPT care cascade
The implementation of the recommended sequence of steps that formed the strategy used to implement TPT among household contacts varied in the 58 studies from the high TB burden, LMIC countries included in the review.
Screening strategies
Twelve (21%) of the 58 included studies did not report the proportion of household contacts screened among those identified as contacts. In the 46 (79%) studies that provided these data, the proportion of household contacts screened among those identified ranged from 14% to 100% (Table 1). Thirty‐six studies (78%) screened >80% of identified contacts, 27 (59%) screened ≥95% and 20 (44%) screened 100% of the identified contacts. Only three studies (7%) reported screening <50% of the identified contacts. The median proportion of eligible contacts screened across the studies was 99% (IQR 82%–100%). Of the 45 studies that reported on the method used to screen out active TB, only verbal screening for symptoms was used in 26 (58%) studies and chest x‐rays were used in 19 (42%) of the studies (Table 1).
Diagnosis of LTBI
Of the 58 studies, 22 (38%) did not test for TB; most of them included children under 5–6 years of age where LTBI testing was not required to initiate TPT (Table 2). Of the 36 studies that tested for LTBI, 21 (58%) used only TST, with 17 requiring a skin induration size of ≥10 mm to denote a positive TST result, while an induration size of ≥5 mm was used in the remainder. Four studies (11%) used only IGRA, while 11 (31%) used both TST and IGRA to aid diagnosis. In the studies where both tests were used, we reported the proportions diagnosed as having LTBI based on the study authors' definitions. If this was not reported, we used the IGRA results to denote LTBI positivity (Table 2).
TABLE 2.
Diagnosis of LTBI among household contacts
| No. | Study_ID | Eligible household contacts | Number tested (%) | Test used (TST/IGRA) | TST positive, n (%) | IGRA positive, n (%) | TST + IGRA positive, n (%) | LTBI diagnosed (%, 95% CI) | Testing personnel |
|---|---|---|---|---|---|---|---|---|---|
| 1. | Bonnet_Uganda_2017 [17] | 281 | 278 (98.9) | TST | 144 (51.8) a | NA | NA | 111 (39.9, 34.4–45.8) | Doctor |
| 2. | Chandrasekaran_India_2018 [18] | 869 | 869 (100) | Both | 478 (55) a | 468(53.9) | 300 (34.5) | 646 b (74.3, 71.3–77.1) | Trained lab staff |
| 3. | Machado_Brazil_2009 [19] | 301 | 261 (86.4) | TST | 145 (55.6) c | NA | NA | 145 (49.5–61.5) | Trained nursing and lab staff |
| 4. | MacPherson_South Africa_2020 [20] | 2725 | 2725 (100) | TST | 458 (16.8) a | ND | ND | 458 (16.8, 15.5–18.3) | Nurse |
| 5. | Odera_Kenya_2020 [21] | 175 | 174 (99.4) | IGRA | NA | 97 (55.6) | NA | 97 (55.6, 48.3–62.9) | NR |
| 6. | Praveen_India_2020 [22] | 220 | 220 (100) | TST | 96 (43.6) c | NA | NA | 96 (43.6, 37.3–50.2) | Trained staff |
| 7. | Ronge_South Africa_2021 [23] | 669 | 669 (100) | Both | 302 (45.1) c | 500 (74.7) | NA | 500 (74.7, 71.3–77.9) | Nurse |
| 8. | Rutherford_Indonesia_2012 [24] | 304 | 302 (99.3) | Both | 145 (48) c | 152 (50.8) | 180 (59.2) | 180 (59.2, 54.6–64.6) | Project staff |
| 9. | Shah_South Africa_2011 [25] | 270 | 270 (IGRA) (100) | Both | 71/254 (28) a | 79 (29) QFT | NR | 71/254 (28.0, 23.0–34.0) | Project staff |
| 263 (TST) (97.4) | QFT 79/270 (29.3, 24.0–35.0) | ||||||||
| 10. | Sharma_India_2017 [26] | 1511 | 1511 (100) | Both | 732 (48.4) c | 917 (60.7) | 540 (35.7) | 917 (60.7, 58.2–63.1) | Trained staff |
| 11. | Stein_Uganda_2018 [27] | 2585 | 2562 (99.1) | TST | 1683 (65.7) c | NA | NA | 1683 (65.7, 63.8–67.5) | NR |
| 12. | Zhang_China_2019 [28] | 159 | 159 (100) | Both | 72 (45.3) c | 75 (47.2) | NR | 75 (47.2, 39.6–55.0) | Trained staff |
| 13. | Akhtar_Pakistan_2009 [29] | 385 | 359 (93.3) | TST | 179 (49.9) c | NA | NA | 179 (49.9, 44.7–55.0) | Project staff |
| 14. | Hu_China_2013 [30] | 1120 | 1106 (98.8) | IGRA | NA | 52 (4.7) | NA | 52 (4.7, 3.6–6.1) | Trained staff |
| 15. | Araujo_Brazil_2020 [31] | 475 | 435 (91.6) | TST | 351 (80.7) a | NA | NA | 351 (80.7, 76.7–84.1) | NR |
| 16. | Maraise_South Africa_2006 [32] | 260 | 243 (93.5) | TST | 122 (50.2) c | NA | NA | 122 (50.2, 44.0–56.4) | NR |
| 17. | Nakaoka_Nigeria_2006 [33] | 161 | TST 161 (100) | Both | 51 (31.9) c | 61 (42.1) | NA | 61 (42.1, 34.3–50.2) | Trained staff |
| IGRA 145 (90.1) | |||||||||
| 18. | Sun_China_2021 [35] | 95 | 95 (100) | Both | 17 (17.9) c | 5 (5.3) | 4 (4.2) | 5 (5.3, 2.3–11.7) | NR |
| 19. | Triasih_Indonesia_2016 [36] | 413 | 269 (65.1) | TST | 119 (44.2) c | NA | NA | 102 (37.9, 32.3–43.8) | NR |
| 20. | Silva_Brazil_2016 [39] | 1078 | 981 d (91) | TST | 322 (32.8) c | NA | NA | 321 (32.7, 29.9–35.7) | NR |
| 21. | Garie_Ethiopia_2011 [41] | 184 | 184 (100) | TST | 106 (57.6) c | NA | NA | 106 (57.6, 50.4–64.5) | NR |
| 22. | Krishnamoorthy_India_2021 [43] | 1523 | 1523 (100) | TST | 801 (52.6) a | NA | NA | 801 (52.6, 50.1–55.1) | NR |
| 23. | Narasimhan_India_2017 [44] | 359 | TST 357 (99.4) | Both | 193 (54.1) c | 143 (44.1) | NR | 143 (44.1, 38.8–49.6) | Trained lab staff |
| IGRA 324 (90.1) | |||||||||
| Both 323 (90) | |||||||||
| 24. | Paradkar_India_2020 [45] | 997 | 997 (100) | Both | 524 (52.6) a | 485 (48.5) | 301 (30.2) | 707 (70.9, 68.0–73.7) b | Trained lab staff |
| 25. | Okwara_Kenya_2017 [46] | 428 | 428 (100) | TST | 96 (22.4) c | NA | NA | 96 (22.4, 18.7–26.6) | NR |
| 26. | Paul_Nigeria_2019 [47] | 63 | 62 (98.4) | TST | 6 (9.7) c | NA | NA | 6 (9.7, 4.5–19.6) | NR |
| 27. | Chauhan_India_2013 [56] | 240 | 200 (83.3) | TST | 78 (39) c | NA | NA | 78 (39.0, 32.5–45.9) | Project staff |
| 28. | Egere_Gambia_2016 [58] | 404 | 328 (81.2) | TST | 63 (19.2) c | NA | NA | 63 (19.2, 15.3–23.8) | NR |
| 29. | Wysocki_Brazil_2016 [59] | 336 | 267 (79.5) | TST | 106/221 (48.0) a | NA | NA | 106 (48.0, 41.5–54.5) | NR |
| 30. | Faksri_Thailand_2015 [61] | 70 | 70 (100) | Both | NR | NR | 15 (21.4) c | 15 (21.4, 13.4–32.4) | Trained nurse |
| 31. | Schwoebel_Multicentric_2020 [63] | 1965 | 1866 (95.0) | TST | 520 (27.9) c | NA | NA | 520 (27.9, 25.9–30.0) | Nurse |
| 32. | Gomes_Guinea‐Bissau_2011 [66] | 1159 | 1159 (100) | TST | 253 (21.8) c | NA | NA | 253 (21.8, 19.6–24.3) | NR |
| 33. | Hector_Malawi_2017 [67] | 56 | 56 (100) | TST | 37 (66.1) c | NA | NA | 37 (66.1, 53.0–77.1) | NR |
| 34. | Mensah_Ghana_2017 [68] | 112 | 100 (89.3) | IGRA | NA | 65 (65) | NA | 65 (65.0, 55.1–73.6) | NR |
| 35. | Nguyen_Laos_2009 [69] | 148 | 148 (100) | TST | 46 (31.1) c | NA | NA | 46 (31.1, 24.2–39.0) | Project staff |
| 36. | Mzembe_South Africa_2020 [70] | 1809 | 266 (14.7) | IGRA | NA | 78 (29.3) | NA | 78 (29.3, 24.2–35.1) | NR |
Abbreviations: IGRA, interferon‐gamma release assay; LTBI, latent tuberculosis infection; NA, not applicable; ND, not done; NR, not reported; TST, tuberculin skin test.
TST positive = induration ≥5 mm.
LTBI diagnosed if either TST or IGRA or both were positive (as defined by study authors); in other studies where both tests were done and authors had not defined LTBI diagnosis, IGRA positives were diagnosed to have LTBI.
TST positive = induration ≥10 mm.
Ninety‐seven children did not return for TST reading.
Estimates of LTBI positivity among household contacts
Estimates of the proportions with LTBI among the 21,566 household contacts from 36 studies are presented in the forest plot in Figure 2, sub‐grouped by studies that used TST alone or IGRA alone or a combination of the two to diagnose LTBI.
FIGURE 2.
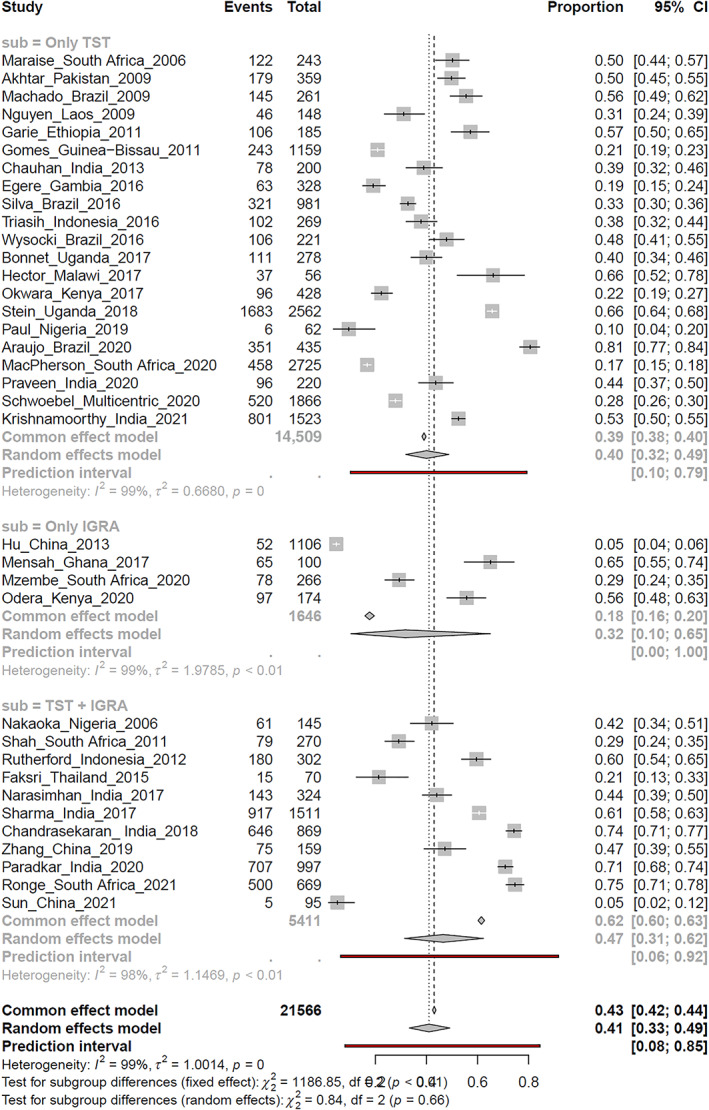
Forest plot of the latent tuberculosis infection positivity estimates in studies using tuberculin skin test or interferon‐gamma release assay or a combination of tests
The pooled random‐effects estimate for LTBI positivity in the 36 studies was 41% (95% CI 33%–49%); however, there was significant heterogeneity in these estimates that far exceeded what could be accounted for by chance (I 2 = 99%; τ 2 = 1.0; p = 0). The proportions diagnosed with LTBI varied considerably among the studies and ranged from 5% to 81%. In 15/36 studies (42%; TST 9, IGRA 1, both 5), the upper and lower bounds of the 95% CI for the LTBI positivity estimates did not overlap with the 95% CI of the pooled estimates for the proportions with LTBI in the sample (Figure 1). The median LTBI positivity estimate across the studies was 44%, with an IQR of 28%–59% (Table 3).
TABLE 3.
Summary of LTBI positivity using TST, IGRA or both and exploration of heterogeneity based on the tests used, the place of testing, the study design and geographical location of the studies
| Studies | Household contacts | LTBI positive | Proportion with LTBI (%) | Pooled LTBI positivity (random effects) | Forest plot | |||
|---|---|---|---|---|---|---|---|---|
| Range | Median (IQR) | % (95% CI) | I 2, τ 2; p | |||||
| LTBI diagnosis: all (TST/IGRA/both) | 36 | 21,566 | 9290 | 4.7–80.7 | 43.9 (28.3–58.8) | 41.0 (33.0–49.0) | 99%, 1.0; <0.01 | Figure 2, Figures S1 and S2 |
| Subgroups analysis 1: diagnostic tests used | ||||||||
| TST alone | 21 | 14,509 | 5670 | 9.7–80.7 | 39.9 (25.2–51.4) | 40.0 (32.0–49.0) | 99%, 0.67; <0.01 | Figure 2, subgroup 1 |
| IGRA alone | 4 | 1646 | 292 | 4.7–65.0 | 42.5 (10.9–62.7) | 32.0 (10.0–65.0) | 99%, 1.98; <0.01 | Figure 2, subgroup 2 |
| Both | 11 | 5411 | 3328 | 5.3–74.7 | 47.2 (29.3–70.9) | 47.0 (37.0–62.0) | 98%, 1.2; <0.01 | Figure 2, subgroup 3 |
| Subgroup analysis 2: place of testing | ||||||||
| Health facility | 22 | 8236 | 4235 | 9.7–80.7 | 49.5 (35.3–62.1) | 44.0 (35.0–55.0) | 98%, 0.96; <0.01 | Figure S1, subgroup 1 |
| Household | 11 | 11.688 | 4846 | 16.8–74.7 | 43.6 (27.9–60.7) | 43.0 (32.0–54.0) | 99%, 0.65; <0.01 | Figure S1, subgroup 2 |
| Both/school | 3 | 1642 | 209 | 4.7–29.3 | 29.3 (4.7–29.3) | 17.0 (6.0–39.0) | 99%, 0.99; <0.01 | Figure S1, subgroup 3 |
| Subgroup analysis 3: study design | ||||||||
| Prospective | 22 | 16,616 | 7286 | 9.7–74.3 | 44.1 (25.2–58.4) | 39.0 (30.0–49.0) | 99%, 0.89; <0.01 | Figure S2, subgroup 1 |
| Not prospective | 14 | 4950 | 2004 | 4.7–80.7 | 45.8 (30.7–65.3) | 44.0 (31.0–58.0) | 99%, 1.14; <0.01 | Figure S2, subgroup 2 |
| LTBI diagnosis (TST/IGRA/both): geographical regions | ||||||||
| Africa | 17 | 11,516 | 4325 | 9.7–74.7 | 39.9 (22.1–61.3) | 39.0 (29.0–50.0) | 99%, 0.81; <0.01 | Figure S3 |
| Subgroup analysis: regions | ||||||||
| West and Central Africa | 6 | 3660 | 958 | 9.7–65.0 | 24.9 (16.8–47.8) | 28.0 (16.0–44.0) | 96%, 0.72; <0.01 | Figure S3, subgroup 1 |
| East Africa | 5 | 3627 | 2093 | 22.4–65.7 | 55.6 (31.2–61.7) | 48.0 (34.0–62.0) | 96%, 0.44; <0.01 | Figure S3, subgroup 2 |
| Southern Africa | 6 | 4229 | 1274 | 16.8–74.7 | 39.8 (26.2–68.3) | 43.0 (26.0–62.0) | 99%, 0.88; <0.01 | Figure S3, subgroup 3 |
| Asia | 15 | 8152 | 4042 | 4.7–74.3 | 44.1 (21.4–51.2) | 40.0 (27.0–54.0) | 99%, 1.24; <0.01 | Figure S4 |
| Subgroup analysis: regions | ||||||||
| South Asia | 8 | 6003 | 3567 | 39.0–74.3 | 51.3 (43.7–58.4) | 55.0 (46.0–64.0) | 97%, 0.26; <0.01 | Figure S4, subgroup 1 |
| East Asia | 3 | 1360 | 132 | 4.7–47.2 | 5.3 (4.7 to –) | 12.0 (3.0–39.0) | 99%, 1.82; <0.01 | Figure S4, subgroup 2 |
| South East Asia | 4 | 789 | 343 | 5.3–59.2 | 29.7 (9.3–53.9) | 37.0 (25.0–52.0) | 95%, 0.34; <0.01 | Figure S4, subgroup 3 |
|
South America Brazil |
4 | 1898 | 923 | 32.7–80.7 | 48.8 (36.5–72.9) | 55.0 (36.0–73.0) | 99%, 0.60: <0.01 | Figure S5 |
Abbreviations: CI, confidence interval; IGRA, interferon‐gamma release assay; IQR, interquartile range; LTBI, latent tuberculosis infection; TST, tuberculin skin test.
Exploration of heterogeneity in the estimates of LTBI
Table 3 summarises the results of subgroup analyses exploring heterogeneity in the LTBI positivity estimates. The pooled estimates for the proportions with LTBI in the subgroup of studies using TST alone, IGRA alone or a combination of tests were similar to the pooled overall estimates, with no significant differences between the subgroups, as evident from the overlapping 95% CIs, and formal tests for subgroup differences (Table 3; Figure 2). Significant heterogeneity was also present within the subgroups, indicating that the inconsistency in LTBI estimates was not explained by the tests used. Similarly, neither the place of testing (Table 3; Figure S1), nor the study designs (Table 3; Figure S2) explained the heterogeneity in LTBI estimates. LTBI estimates did not also appear to be influenced by the year of publication of the studies (Figure 2). The median and IQR for the proportions with LTBI in these subgroups also overlapped (Table 3).
Geographical variations in screening and testing protocols and in resources were also explored as potential causes of heterogeneity in subgroup analyses. LTBI estimates from studies among household contacts in Africa were separately analysed, sub‐grouped by countries in West and Central Africa, East Africa and Southern Africa (Table 3; Figure S3). Studies from Asia were sub‐grouped by studies from countries in South Asia, East Asia and South East Asia (Table 3; Figure S4). Pooled estimates from studies from South America were represented by three studies from Brazil (Table 3; Figure S5). None of these sub‐group analyses adequately explained the heterogeneity in LTBI estimates.
Additionally, we explored heterogeneity in LTBI estimates in studies using TST alone sub‐grouped by the place of testing (Table 4; Figure S6) and the size of skin induration (Table 4; Figure S7). These sub‐group analyses also did not explain the heterogeneity in LTBI estimates.
TABLE 4.
Summary of LTBI positivity using TST only and exploration of heterogeneity based on place of testing and the size of skin induration
| Studies | Household contacts | LTBI positive | Proportion with LTBI (%) | Pooled LTBI positivity (random effects) | Forest plot | |||
|---|---|---|---|---|---|---|---|---|
| Range | Median (IQR) | % (95% CI) | I 2, τ 2; p | |||||
| LTBI diagnosis: TST only | 22 | 14,811 | 5850 | 5.3–80.7 | 39.9 (25.2–51.4) | 41.0 (33.0–49.0) | 99%, 0.66; <0.01 | Figures S6 and S7 |
| Subgroup analysis 1: place of testing | ||||||||
| Health facility | 15 | 5772 | 2625 | 9.7–80.7 | 48.0 (32.7–57.6) | 44.0 (34.0–54.0) | 97%, 0.68; <0.01 | Figure S6, subgroup 1 |
| Household | 7 | 9039 | 3225 | 5.3–65.7 | 27.9 (16.8–49.9) | 36.0 (24.0–48.0) | 100%, 0.53; <0.01 | Figure S6, subgroup 2 |
| Subgroup analysis 2: size of induration | ||||||||
| Induration ≥5 mm | 5 | 5182 | 1827 | 16.8–80.7 | 39.9 (28.4–66.7) | 47.0 (28.0–68.0) | 100%, 0.94; <0.01 | Figure S7, subgroup 1 |
| Induration ≥10 mm | 17 | 9629 | 4023 | 5.3–66.1 | 39.0 (22.1–53.9) | 39.0 (31.0–48.0) | 99%, 0.55; <0.01 | Figure S7, subgroup 2 |
Abbreviations: CI, confidence interval; IQR, interquartile range; LTBI, latent tuberculosis infection; TST, tuberculin skin test.
Tuberculosis preventive treatment
Table 5 provides summary estimates of the proportion of household contacts in whom TPT was initiated and the proportion completing TPT in the studies that reported these outcomes. Of the 58 included studies, 34 (59%) reported data regarding treatment initiation among the 129,573 household contacts considered eligible for TPT. Twenty‐six of these studies initiated TPT in children ≤6 years of age, four studies included children and adolescents and four included contacts of all ages (Table 5). Eighteen studies were conducted in Africa. Ten studies were conducted in Asia (seven in India). Four studies were from Brazil, and two were multi‐country studies (Table 5). Twenty‐two studies used a prospective design, while nine studies were cross‐sectional, one was a retrospective cohort study, and two used mixed methods.
TABLE 5.
Tuberculosis preventive therapy (TPT) initiation and completion among household contacts
| No. | Study_ID | Age (years) | Eligible for treatment (n) | Treatment initiated, n (%, 95% CI) | Adherence monitoring | Treatment completion, n (%, 95% CI) | Treatment regimen used | Treatment failure a |
|---|---|---|---|---|---|---|---|---|
| 1. | Bonnet_Uganda_2017 [17] | <5 | 234 | 234 (100, 98.0–100) | NR | 188 (80.3, 74.8–84.9) | 6HZ | 1 |
| 2. | Machado_Brazil_2009 [19] | All | 101 | 101 (100. 96.0–100) | NR | 54 (53.5, 43.8–62.9) | 6H | NR |
| 3. | Araujo_Brazil_2020 [31] | All | 320 | 281 (87.8, 83.8–91.0) | NR | 233 (82.9, 78.1–86.9) | 6HZ | 1 |
| 4. | Maraise_South Africa_2006 [32] | <5 | 236 | 180 (76.3, 74.5–81.2) | Yes | 36 (20.0, 14.8 to 26.4) | 6H | 4 |
| 5. | Oxlade_Multicentric_2021 [34] b | <5 | 347 | 250 (72.1, 67.1–76.5) | Yes | NR | 6H | NR |
| 6. | Triasih_Indonesia_2016 [36] | ≤5 | 99 | 86 (86.9, 78.8–92.2) | NR | 50 (58.1, 47.6–68.0) | 6H | None |
| 7. | Adjobimey_Benin_2016 [37] | <5 | 497 | 496 (99.8, 98.9–99.99) | Yes | 427 (86.1, 82.8–88.9) | 9H | 3 |
| 8. | Amisi_Kenya_2021 [38] | <5 | 472 | 427 (90.5, 87.5–92.8) | NR | 205 (48.0, 43.3–52.7) | 6H | 6 |
| 9. | Silva_Brazil_2016 [39] | ≤15 | 322 | 109 (33.9, 28.9–39.2) | Yes | 73 (67.0, 57.7–75.1) | 9H, 6H | 1 |
| 10. | Burmen_Kenya_2014 [40] | <5 | 337 | 51 (15.1, 11.7–19.4) | NR | NR | 6H | NR |
| 11. | Garie_Ethiopia_2011 [41] | <15 | 82 | 82 (100, 95.5–100) | Yes | 10 (12.2, 6.8–21.0) | 6H | 1 |
| 12. | Ginderdeuren_South Africa_2021 [42] | <15 | 56 | 56 (100, 93.5–100) | NR | 24 (42.9, 30.8–52.9) | 6H | 1 |
| 13. | Paul_Nigeria_2019 [47] | ≤5 | 55 | 55 (100, 93.5–100) | Yes | 24 (43.6, 31.4–56.7) | 6H | NR |
| 14. | Rekha_India_2009 [13] | ≤6 | 84 | 16 (19.1, 12.1–28.7) | NR | NR | 6H | NR |
| 15. | Rutherford _Indonesia_2012 [48] | <5 | 82 | 82 (100, 95.5–100) | Yes | 21 (25.6, 17.4–36.0) | 6H | NR |
| 16. | Sulis_Burkina Faso_2018 [49] | <5 | 941 | 852 (90.5, 88.5–92.6) | NR | NR | 6H | NR |
| 17. | Pothukuchi _India_2011 [10] | <6 | 116 | 97 (83.6, 75.8–85.3) | NR | 83 (85.6, 77.2–91.2) | 6H | NR |
| 18. | Rekha_India_2013 [50] | <6 | 53 | 53 (100, 93.2–100) | NR | 39 (73.6, 60.4–83.6) | 6H | NR |
| 19. | Shivaramakrishna_India_2014 [51] | <6 | 209 | 70 (33.5, 27.4–40.1) | NR | 16 (22.9, 14.6–40.0) | 6H | NR |
| 20. | Seid_Ethiopia_2018 [52] | <5 | 125 | 94 (75.2, 67.0–81.9) | NR | 74 (78.7, 69.4–85.8) | 6H | NR |
| 21. | Singh_India_2017 [12] | <5 | 50 | 11 (22.0 1.8–35.2) | NR | 10 (90.9, 62.3–98.4) | 6H | NR |
| 22. | Tadesse_Ethiopia_2016 [53] | <5 | 221 | 142 (64.3, 57.7–70.3) | NR | 114 (80.3, 73.0–84.0) | 6H | None |
| 23. | Belgaumkar_India_2018 [11] | <6 | 33 | 28 (84.9, 69.1–93.1) | NR | 21 (75.0, 56.6–87.3) | 6H | NR |
| 24. | Birungi_Rwanda_2019 [54] | <5 | 94 | 84 (89.4, 81.5–94.1) | Yes | 74 (88.1, 79.5–93.4) | 6H | 1 |
| 25. | Black_South Africa_2018 [55] | <5 | 182 | 74 (40.7, 33.8–48.0 | NR | 4 (5.4, 2.1–13.1) | 6H | NR |
| 26. | Datiko_Ethiopia_2017 [57] | All | 3027 | 1761 (58.2, 56.4–60.0) | Yes | 1574 (89.4, 87.9–90.7) | 6H | 3 |
| 27. | Egere_Gambia_2016 [58] | <5 | 368 | 328 (89.1, 85.5–91.9) | Yes | 255 (77.7, 72.9–81.9) | 6H | NR |
| 28. | Wysocki_Brazil_2016 [59] | All | 106 | 64 (60.4, 50.9–69.2) | NR | 36 (56.3, 44.1–67.7) | 6H | NR |
| 29. | Fentahun_Ethiopia_2020 [60] | <5 | 138 | 44 (31.9, 24.7–40.1) | NR | NR | 6H | NR |
| 30. | Sayedi_Afghanistan_2020 [62] | <5 | 117,593 | 101,084 (86.0, 85.8–86.2) | NR | 69,273 (68.5, 68.2–68.8) | 6H | NR |
| 31. | Schwoebel_Multicentric_2020 [63] | <5 | 1909 | 1746 (91.5, 90.1–92.6) | Yes | 1642 (94.0, 92.8–95.1) | 3RH, 6H | 1 |
| 32 | Sharma_India_2021 [64] | <5 | 86 | 62 (72.1, 61.8–80.5) | Yes | 42 (67.7, 55.4–78.1) | 6H | NR |
| 33. | Soelen_South Africa_2012 [65] | <5 | 54 | 54 (100, 93.4–100) | NR | 20 (37.0, 25.4–50.4) | 6H | NR |
| 34. | Gomes_Guinea‐Bissau_2011 [66] | <15 | 989 | 820 (82.9, 80.4–85.1) | Yes | 378 (46.1, 42.71–49.5) | 9H | 2 |
Abbreviations: CI, confidence interval; H, isoniazid; NR, not reported; R, rifampicin; TPT, tuberculosis preventive treatment; Z, pyrazinamide; the numbers before the drug names denote the number of months of treatment.
Treatment failure: incident tuberculosis disease during the course of treatment.
Data only for children <5 years from the low‐ and middle‐income countries evaluated.
Of the 34 studies reporting on TPT initiation, 28 (82%) also reported the proportions completing TPT. Six of the 26 studies that initiated TPT in children ≤6 years of age did not report treatment completion rates, with three reporting that they had referred household contacts with LTBI elsewhere after treatment initiation. The methods used to facilitate treatment adherence were reported in only 13/34 studies (38%) and the proportions actually adherent was infrequently reported. Adverse event monitoring and management were also poorly reported. Various TPT regimens were used, though daily isoniazid for 6 months was the most commonly used regimen.
In the 28 studies reporting treatment initiation and completion, 108,679 contacts were initiated on TPT. The numbers considered to be TPT treatment failures (incident TB developed while on TPT) were reported in 12 (43%) of these studies. Treatment failures were rare, affecting 25 of 74,991 (0.03%) contacts completing treatment in the 28 studies (Tables 5 and 6).
TABLE 6.
Summary of the proportions initiating and completing TPT for LTBI and exploration of heterogeneity based on age of household contacts
| Studies | Eligible household contacts | On TPT | Proportion on TPT (%) | Pooled proportion on TPT (random effects) | Forest plot | |||
|---|---|---|---|---|---|---|---|---|
| Range | Median (IQR) | % (95% CI) | I 2, τ 2; p | |||||
| TPT initiation | 34 | 129,573 | 109,974 | 15.1–100.0 | 85.5 (59.9–100) | 91.0 (79.0–97.0) | 99%, 7.79; 0.00 | Figure 3 |
| Subgroup analysis: age | ||||||||
| <6 years | 26 | 124,570 | 106,700 | 15.1–100.0 | 85.5 (58.4–98.9) | 90.0 (75.0–97.0) | 99%, 7.54; <0.01 | Figure 3, subgroup 1 |
| <18 years | 4 | 1449 | 1067 | 33.9–100.0 | 91.5 (46.2–100.0) | 98.0 (32.0–100.0) | 99%, 14.88; <0.01 | Figure 3, subgroup 2 |
| All ages | 4 | 3554 | 2207 | 58.2–100.0 | 74.1 (58.8–97.0) | 89.0 (45.0–99.0) | 97%, 4.63; <0.01 | Figure 3, subgroup 3 |
| TPT completion | 28 | 108,679 | 74,991 | 5.4–94.0 | 68.1 (44.2–82.3) | 65.0 (54.0–74.0) | 98%, 1.48; <0.01 | Figure 4 |
| Subgroup analysis: age | ||||||||
| <6 years | 20 | 105,159 | 72,364 | 5.4–94.0 | 71.1 (38.7–84.3) | 64.0 (49.0–76.0) | 98%, 1.95; <0.01 | Figure 4, subgroup 2 |
| <18 years | 4 | 1313 | 730 | 42.9–77.7 | 56.6 (43.7–75.2) | 60.0 (44.0–73.0) | 97%, 0.38; <0.01 | Figure 4, subgroup 2 |
| All ages | 4 | 2207 | 1897 | 53.5–89.4 | 69.6 (54.2–87.8) | 74.0 (55.0–87.0) | 98%, 0.71; <0.01 | Figure 4, subgroup 2 |
Abbreviations: CI, confidence interval; IQR, interquartile range; LTBI, latent tuberculosis infection; TPT, tuberculosis preventive treatment.
As with the estimates of LTBI, the proportions that initiated and completed TPT varied considerably in the studies reporting these estimates. The proportions initiated on TPT in the 34 studies ranged from 15% to 100%; and in the 28 studies that also reported treatment completion, the proportions ranged from 5% to 94% (Tables 5 and 6).
Figure 3 displays the forest plot of the proportions initiating TPT, and Figure 4 displays the forest plot of the proportions completing TPT; sub‐grouped by the age of the household contacts included. Table 6 summarises the pooled estimates for the proportions initiating and completing treatment and the results of subgroup analyses exploring heterogeneity, as well as the median proportions (with the IQR) for treatment initiation and completion.
FIGURE 3.
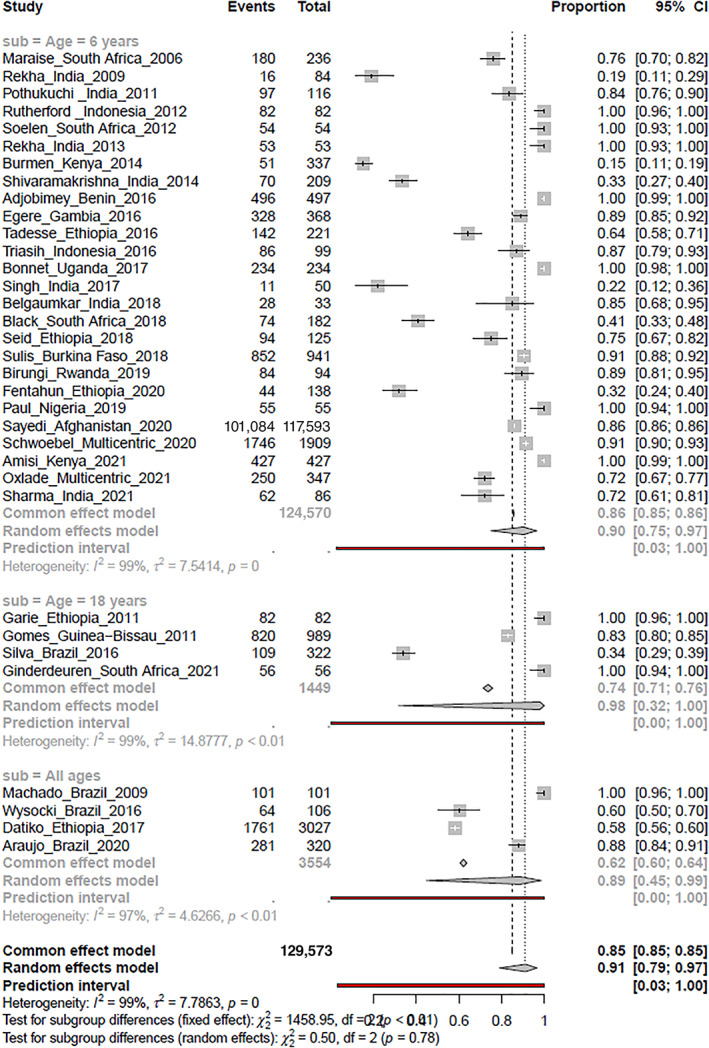
Forest plot of the proportions initiating tuberculosis preventive treatment sub‐grouped by the age of household contacts
FIGURE 4.
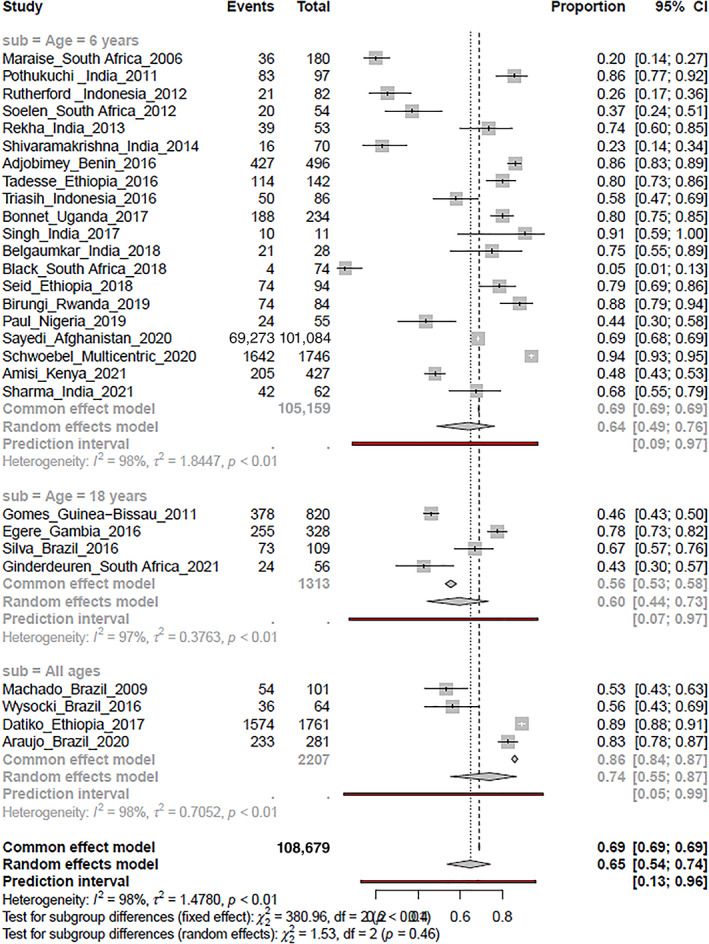
Forest plot of the proportions completing tuberculosis preventive treatment sub‐grouped by the age of household contacts
Figure 3 displays the estimates for treatment initiation rates among 129,573 household contacts who were eligible for treatment in the 34 studies. The pooled estimate for the proportions initiating TPT was 91% (95% CI 79%–97%). There was significant heterogeneity in the estimates (I 2 = 99%; τ 2 = 7.79; p < 0.01), that was not explained by subgroup analysis. The median proportion that was initiated on TPT was 86% (IQR 60%–100%) (Table 6).
Compared to the more than 90% pooled estimates for TPT initiation, the pooled estimate for the proportions completing TPT (Figure 4) was considerably lower (65%, 95% CI 54%–74%), with significant heterogeneity in the estimates (I 2 = 98%, τ 2 = 1.48, p < 0.01). The pooled treatment completion proportions did not significantly differ between the subgroups based on age; and did not explain the heterogeneity in the estimates of the proportions completing treatment. The true estimates of treatment completion with TPT are uncertain, but the median estimate for proportions completing treatment was 68% (IQR 44%–82%) (Table 6).
Factors affecting the TPT care cascade
The factors reported in 28 studies which the authors considered to have affected one or more components of the TPT care cascade are summarised in Table 7.
TABLE 7.
Factors reported to affect the TPT care cascade
| Factors | Description | Study reference |
|---|---|---|
| Duration of follow‐up | Short duration of follow‐up could have affected the assessment of TPT effectiveness and the magnitude of the true burden of Mycobacterium tuberculosis infection. | [17, 26, 59] |
| Type of test used | Using TST could have resulted in low yield for M. tuberculosis infection, since IGRA correlates better with recent M. tuberculosis exposure and has higher accuracy in diagnosing infection in children. | [18, 23] |
| Timing of tests | The timing of conducting tests could have affected the results in terms of LTBI positivity as the average time for developing hypersensitivity reactions is 4–12 weeks, thus some household contacts who might have been incubating the infection might have tested negative on the tests. | [24, 29] |
| Inadequate documentation | Retrospective studies and studies on programmatic data reported that the lack of proper documentation on the care cascade for TB management could have affected their assessment and findings. Collecting data from the programme registers and from reports that lack rigour in documenting the information could lead to selection bias for the number of household contacts. | [32, 38, 52, 53, 62] |
| Adherence to TPT | The common factors related to TPT adherence included: higher cost of transportation, medication palatability, longer treatment duration, social support, and the knowledge and beliefs of HCWs and carers. Further, treatment adherence reported in the studies could be an overestimation as it depended on pill count or on the monthly collection of prescriptions. | [37, 39, 42, 48, 66] |
| Risk perception of the participants | Parents' or caregivers' own experience concerning TB disease and its long‐term health consequences was reported as a motivating factor for TPT initiation and completion. Further, participants' perception regarding the risk related to LTBI influences the treatment initiation and adherence among HH contacts, especially among child contacts. Parents were unable to comprehend the relevance of initiating TPT among asymptomatic children. | [40, 41, 55, 60] |
| Recall bias | Studies that ascertained information on the care cascade from the participants reported that recall bias or the tendency to provide socially desirable answers could have resulted in under‐ or over‐estimation of the results in the study. | [12, 43, 51, 60, 70] |
| Participants' characteristics | One study reported that HIV positivity reduces the likelihood of completing testing, whereas in another, it was reported that HIV‐infected participants were more likely to get their contacts screened as they visit the health facility regularly and are aware of the benefits of early contact screening. Another study mentioned that subjects' immunological status could also impact the testing outcomes as the T‐SPOT.TB assay was based on the individual activated T cell. | [20, 30, 60] |
| HCWs' related | In one study, the high patient to health worker ratio was thought to have compromised the quality of care, whereas another reported that the working hours of the HCWs could have resulted in under‐representation of certain age group (especially school‐going children). | [40, 57] |
Abbreviations: HCWs, healthcare workers; HH, house‐to‐house; IGRA, interferon‐gamma release assay; IPT, isoniazid preventive therapy; LTBI, latent tuberculosis infection; TB, tuberculosis; TST, tuberculin skin test.
For the diagnosis of LTBI, short duration of the follow‐up, and the type of tests used were reported as potentially important (Table 7). The time of testing was reported as another factor that might have affected the results since contacts incubating the infection might test negative if tested early, thus leading to an underestimation of the infection prevalence. In studies where data were collected retrospectively, inadequate documentation of the care cascade components was reported to have likely impacted the study outcomes. In many settings, the information on the household contacts (especially for child contacts) was retrieved from the index patient's card, thus inadequate documentation could have led to selection bias for household contacts. Furthermore, in studies that collected information from the participants, recall bias, and the general tendency to provide socially desirable responses were reported as factors that could have resulted in over/underestimation of the findings of the studies.
For preventive treatment, factors such as higher cost of transportation, medication palatability, treatment duration, social support and the knowledge and beliefs of healthcare workers were thought to have influenced the reported treatment outcomes. Where described, treatment adherence was defined based on pill count or the monthly prescription of the medicines collected from the subjects. This might have led to an overestimation of treatment adherence. Another factor that might have impacted the results was the risk perception of the participants; parents' or caregivers' own experience concerning TB disease and its health consequences that could have motivated them to initiate treatment among their close contacts; whereas, in studies where adherence was poor, absence of signs and symptoms among contacts could have adversely impacted the treatment‐related decisions. In some studies, participants' characteristics in terms of their immune status were reported to have likely impacted the findings. Health worker‐related factors such as high patient to health worker ratio and their working hours could compromise the quality of care. The timing of household visits by the workers could lead to under‐representation of certain age groups (especially school‐going children) as many might not be available at that time (Table 7).
As reported in the studies, factors operating at multiple levels can facilitate or hinder the execution of each component of the care cascade. Therefore, for a successful realisation of the care cascade, it is imperative to address these factors in contextually appropriate ways.
DISCUSSION
This systematic review aimed to describe the strategies used in studies from high TB burden countries for detecting LTBI in household contacts of people with bacteriologically confirmed pulmonary TB who were not immunocompromised, and to ascertain the proportions initiated on and completing TPT. The 58 included studies provide updated estimates to supplement estimates from existing systematic reviews in this area [3, 6, 14, 15]. The pooled estimates for LTBI positivity of 41% (95% CI 33%–49%), using a combination of TST or IGRA or both, in 21,566 household contacts of people with bacteriologically confirmed pulmonary TB in the 36 studies provide a timely reminder of the hidden burden of TB infection. Even though there was significant heterogeneity in these estimates, the median LTBI positivity estimates (44%, IQR 28%–59%) indicate that between a third to over half of the household contacts of people with bacteriologically proven TB are likely to have LTBI.
Over half of these studies used TST alone to detect LTBI. Since most studies also used only verbal screening of symptoms to rule out active TB, concerns exist about the potential for false negative results with the use of TST alone. The number of studies that used IGRA (alone or in combination with TST) to diagnose LTBI was fewer. The relatively higher LTBI yield in these studies (albeit with wide 95% CI that overlapped with the TST‐diagnosed LTBI estimates), coupled with the likelihood of fewer false‐positive results, suggest that increasing the use of imaging modalities and molecular tests could augment the utility of contact tracing for LTBI management. However, this would need to be balanced against available resources and other programmatic considerations.
WHO recommends that contact investigation be conducted through home visits but the data in this review did not find the LTBI diagnostic yield to differ significantly with health facility‐based versus home‐based contact investigations.
The other notable finding in this review was the higher proportions of contacts with LTBI initiating TPT compared to the lower proportions completing treatment. The pooled estimates for treatment initiation in 129,573 eligible household contacts in the 34 studies was an impressive 91% (95% CI 79%–97%), compared to the pooled estimates of the proportions completing treatment (65%, 95% CI 54%–74%) among 108,679 contacts who commenced TPT in 28 of these studies. In spite of the significant heterogeneity in these estimates, the nearly 20% difference in the median proportion completing compared to initiating treatment, reveals a flaw in the TPT care cascade that can adversely impact the effectiveness of LTBI management among household contacts.
The qualitative synthesis of the factors reported by study investigators provide complementary insights about the factors related to the various components of the cascade of care that could have contributed to heterogeneity in LTBI estimates and TPT outcomes. These factors can also inform strategies to improve the effectiveness of LTBI management. No single factor or intervention can be considered pre‐eminent to improve the LTBI cascade, and many incremental strategic adjustments will be needed to reduce losses that can occur throughout the LTBI cascade of care [71].
Limitations
A major limitation in this review was the lack of adequate details provided in the included studies regarding the processes used in screening, testing or treatment initiation due to which we were unable to adequately assess the quality of implementation of LTBI management strategies. The variety of included study designs precluded valid assessments of the risk of bias uniformly applicable across these designs. The possibility of reporting biases is also high with systematic reviews using observational data.
Another major limitation was the significant heterogeneity in the pooled estimates from meta‐analysis for the diagnostic yield. This was not explained in subgroup analyses based on the diagnostic tests used and the place of testing. Additional post hoc sub‐group analyses based on the study designs employed and geographical differences in the countries where the studies were conducted also did not explain the heterogeneity. Significant heterogeneity in the estimates for TPT outcomes was also a serious limitation that was not explained in pre‐stated subgroup analyses based on the age of the household contacts. The prevalence of TB (and LTBI) varies across different populations within and between countries and between geographical regions, as was also evident in other systematic reviews and meta‐analysis of TB contact tracing [3, 6, 14, 15]; their results were similar to the estimates in this review. This highlights the inherent difficulty in accurately estimating, with the available data, the effects of strategies like TB contact tracing among diverse populations.
Anticipating that meta‐analysis of studies of disease prevalence would result in significant heterogeneity, we chose to use the random‐effects model for meta‐analysis. The random‐effects model adjusts the weights assigned to each study to account for within‐study and between‐study variability, and results in wider 95% CIs for the prevalence estimates. With the magnitude of heterogeneity observed (I 2 > 95%–100%), the weights assigned to each study in random‐effects meta‐analysis are nearly equal, regardless of the sample size and study variance. Therefore, the point estimates for LTBI and TPT outcomes in these studies generated through random‐effects meta‐analysis only represent the mean of a wide range of possible estimates [72]. In spite of the significant heterogeneity, we chose to retain the meta‐analysis estimates in order to explore heterogeneity, but caution against relying on these pooled estimates alone. The median estimates (with the IQR) that accompany each analysis offer a more conservative interpretation of LTBI positivity and TPT outcomes in the included studies.
Recommendations for LTBI management scale up
In spite of these limitations, the evidence synthesised in this review provides important information that can inform the national TB programmes in high TB burden countries while scaling up LTBI management.
Firstly, a more systematic approach is needed for screening TB symptoms (to exclude active TB). There are already comprehensive guidelines on contact investigations provided by WHO that most programmes have integrated into their systems. However, the recording and reporting for TPT eligibility need to be strengthened. Information regarding the personnel doing the screening and their training; details on the timing and frequency of screening, particularly in relation to the timing since the index case was diagnosed, also need to be documented as these can impact detection and implementation. Screening should not depend only on verbal screening of symptoms to rule out active TB, and imaging and molecular tools should be optimally utilised.
Secondly, diagnostic testing for LTBI among the household contacts should be mandatory and TPT should not be initiated without a positive result (except for those <5 years and for those with HIV infection, or on the recommendation of a consulting physician), since, on an average, only a third to a little more than half of household contacts may have LTBI. Irrespective of the diagnostic test used or considered feasible, ensuring consistent protocols and adequately trained staff in administrating the tests will result in better outcomes.
Thirdly, mechanisms to ensure better integration of TPT initiation with mechanisms to encourage and monitor adherence, detect and manage adverse events, provide counselling, to record treatment completion and follow‐up after TPT are required. Many of these problems already exist in national TB programmes for active TB case finding, and common solutions are needed for LTBI and TB case detection and management [73]. For optimum utilisation of resources, adherence mechanisms integrated with active TB management may work well, however real‐world experience indicates that this may overburden health workers who support TB treatment.
TPT scale‐up, as recommended by WHO and the commitments at UNHLM, is important. However, in high‐TB burden, resource‐constrained countries, this would require attending to approximately four‐times more people than the total number of TB patients diagnosed. Integrating TPT in the current active TB programmes, without providing additional human resources, risks overburdening of existing staff, while leaving large numbers without completing their treatment, and wasting already limited resources in terms of free testing and treatment provided under the programmes. While shorter treatment regimens may aid in treatment completion, the systems to support this need to be in place for this to work. Follow‐up mechanisms for those household contacts who complete TPT to document any further episodes of TB also need to be in place.
CONCLUSION
The results of this systematic review and meta‐analysis provide updated data on LTBI positivity, TPT initiation and completion among household contacts in high TB burden countries. The common strategies used to identify those eligible were contact investigation either at home or at health facility, mostly using verbal screening. The proportions detected with LTBI varied considerably in the studies, but the median positivity for LTBI was 44%. While the proportions initiated on TPT were reassuringly high, treatment completion proportions were worryingly lower. The qualitative data collected alongside the quantitative data provide heuristic insights about factors that could reduce losses in the LTBI cascade of care.
FUNDING INFORMATION
This publication is associated with the Research, Evidence and Development Initiative (READ‐It). READ‐It (project number 300342‐104) is funded by UK aid from the UK Government; however, the views expressed do not necessarily reflect the UK Government's official policies.
Supporting information
Table S1 Search strategies for implementing TB preventive therapy among household contacts in high TB burden settings.
Table S2. Operational definitions.
Table S3. PRISMA 2020 Checklist.
Figure S1. Forest plot of the pooled LTBI positivity estimates in studies using TST or IGRA or a combination of tests sub‐grouped by place of testing.
Figure S2. Forest plot of the pooled LTBI positivity estimates in studies using TST or IGRA or a combination of tests sub‐grouped by study design.
Figure S3. Forest plot of the pooled LTBI positivity estimates in studies from Africa using TST or IGRA or a combination of tests sub‐grouped by geographical regions.
Figure S4. Forest plot of the pooled LTBI positivity estimates in studies from Asia using TST or IGRA or a combination of tests sub‐grouped by geographical regions.
Figure S5. Forest plot of the pooled LTBI positivity estimates in studies from South America using TST or IGRA or a combination of tests.
Figure S6. Forest plot of the pooled LTBI positivity estimates in studies using TST alone sub‐grouped by place of testing.
Figure S7. Forest plot of the pooled LTBI positivity estimates in studies using TST alone sub‐grouped by the size of skin induration.
ACKNOWLEDGEMENTS
We acknowledge Prof. Paul Garner, Director – Research, Evidence and Development Initiative (READ‐IT), Liverpool School of Tropical Medicine, Liverpool for his support during the initial phase of prioritising the research question and protocol development for systematic review. We thank the authors who responded promptly and shared their full papers for screening and inclusion in the review.
Sagili KD, Muniyandi M, Shringarpure K, Singh K, Kirubakaran R, Rao R, et al. Strategies to detect and manage latent tuberculosis infection among household contacts of pulmonary TB patients in high TB burden countries ‐ a systematic review and meta‐analysis. Trop Med Int Health. 2022;27(10):842–863. 10.1111/tmi.13808
Sustainable Development Goal: Good Health and Wellbeing.
Funding information UK Government
REFERENCES
- 1. Global tuberculosis report. Geneva: World Health Organization; 2021. Licence:CC BY‐NC‐SA 3.0 IGO. [Google Scholar]
- 2. The end TB strategy. Geneva: World Health Organization; 2014. [Google Scholar]
- 3. Alsdurf H, Hill PC, Matteelli A, Getahun H, Menzies D. The cascade of care in diagnosis and treatment of latent tuberculosis infection: a systematic review and meta‐analysis. Lancet Infect Dis. 2016;16(11):1269–78. [DOI] [PubMed] [Google Scholar]
- 4. Latent tuberculosis infection: updated and consolidated guidelines for programmatic management. Geneva: World Health Organization; 2018. [PubMed] [Google Scholar]
- 5. Houben RM, Dodd PJ. The global burden of latent tuberculosis infection: a re‐estimation using mathematical modelling. PLoS Med. 2016;13(10):e1002152. [DOI] [PMC free article] [PubMed] [Google Scholar]
- 6. Fox GJ, Barry SE, Britton WJ, Marks GB. Contact investigation for tuberculosis: a systematic review and meta‐analysis. Eur Respir J. 2013;41(1):140–56. [DOI] [PMC free article] [PubMed] [Google Scholar]
- 7. WHO consolidated guidelines on tuberculosis. Module 1: prevention – tuberculosis preventive treatment. Geneva: World Health Organization; 2020. [PubMed] [Google Scholar]
- 8. Recommendations for investigating contacts of persons with infectious tuberculosis in low‐ and middle‐income countries. Geneva: World Health Organization; 2012. p. 28–41. [PubMed] [Google Scholar]
- 9. Political declaration of the high‐level meeting of the General Assembly on the fight against tuberculosis. World Health Organization. The General Assembly. 2018;2(2):101.
- 10. Pothukuchi M, Nagaraja SB, Kelamane S, Satyanarayana S, Shashidhar BS, Dewan P, et al. Tuberculosis contact screening and isoniazid preventive therapy in a South Indian district: operational issues for programmatic consideration. PLoS One. 2011;6(7):e22500. [DOI] [PMC free article] [PubMed] [Google Scholar]
- 11. Belgaumkar V, Chandanwale A, Valvi C, Pardeshi G, Lokhande R, Kadam D, et al. Barriers to screening and isoniazid preventive therapy for child contacts of tuberculosis patients. Int J Tuberc Lung Dis. 2018;22(10):1179–87. [DOI] [PubMed] [Google Scholar]
- 12. Singh AR, Kharate A, Bhat P, Kokane AM, Bali S, Sahu S, et al. Isoniazid preventive therapy among children living with tuberculosis patients: is it working? A mixed‐method study from Bhopal, India. J Trop Pediatr. 2017;63(4):274–85. [DOI] [PMC free article] [PubMed] [Google Scholar]
- 13. Banu Rekha VV, Jagarajamma K, Wares F, Chandrasekaran V, Swaminathan S. Contact screening and chemoprophylaxis in India's revised tuberculosis control programme: a situational analysis. Int J Tuberc Lung Dis. 2009;13(12):1507–12. [PubMed] [Google Scholar]
- 14. Velen K, Shingde RV, Ho J, Fox GJ. The effectiveness of contact investigation among contacts of tuberculosis patients: a systematic review and meta‐analysis. Eur Respir J. 2021;58:2100266. [DOI] [PubMed] [Google Scholar]
- 15. Szkwarko D, Hirsch‐Moverman Y, Plessis LD, Preez KD, Carr C, Mandalakas AM. Child contact management in high tuberculosis burden countries: a mixed‐methods systematic review. PLoS One. 2017;12(8):e0182185. [DOI] [PMC free article] [PubMed] [Google Scholar]
- 16. Page MJ, McKenzie JE, Bossuyt PM, Boutron I, Hoffmann TC, Mulrow CD, et al. The PRISMA 2020 statement: an updated guideline for reporting systematic reviews. BMJ. 2021;372:n71. [DOI] [PMC free article] [PubMed] [Google Scholar]
- 17. Bonnet M, Kyakwera C, Kyomugasho N, Atwine D, Mugabe F, Nansumba M, et al. Prospective cohort study of the feasibility and yield of household child tuberculosis contact screening in Uganda. Int J Tuberc Lung Dis. 2017;21(8):862–8. [DOI] [PubMed] [Google Scholar]
- 18. Chandrasekaran P, Mave V, Thiruvengadam K, Gupte N, Yogendra Shivakumar SVB, Hanna LE, et al. Tuberculin skin test and QuantiFERON‐Gold In Tube assay for diagnosis of latent TB infection among household contacts of pulmonary TB patients in high TB burden setting. PLoS One. 2018;13(8):e0199360. [DOI] [PMC free article] [PubMed] [Google Scholar]
- 19. Machado A, Finkmoore B, Emodi K, Takenami I, Barbosa T, Tavares M, et al. Risk factors for failure to complete a course of latent tuberculosis infection treatment in Salvador, Brazil. Int J Tuberc Lung Dis. 2009;13(6):719–25. [PubMed] [Google Scholar]
- 20. MacPherson P, Lebina L, Motsomi K, Bosch Z, Milovanovic M, Ratsela A, et al. Prevalence and risk factors for latent tuberculosis infection among household contacts of index cases in two South African provinces: analysis of baseline data from a cluster‐randomised trial. PLoS One. 2020;15(3):e0230376. [DOI] [PMC free article] [PubMed] [Google Scholar]
- 21. Odera S, Mureithi M, Aballa A, Onyango N, Anzala O, Oyugi J. Latent tuberculosis among household contacts of pulmonary tuberculosis cases in Nairobi, Kenya. Pan Afr Med J. 2020;37:87. [DOI] [PMC free article] [PubMed] [Google Scholar]
- 22. Praveen V. Prevalence of LTBI among household contacts of sputum positive TB patients receiving DOTS chemotherapy. Indian J Tuberc. 2020;67(4):459–65. [DOI] [PubMed] [Google Scholar]
- 23. Ronge L, Sloot R, Du Preez K, Kay AW, Kirchner HL, Grewal HMS, et al. The magnitude of interferon gamma release assay responses in children with household tuberculosis contact is associated with tuberculosis exposure and disease status. Pediatr Infect Dis J. 2021;40(8):763–70. [DOI] [PMC free article] [PubMed] [Google Scholar]
- 24. Rutherford ME, Hill PC, Maharani W, Apriani L, Sampurno H, van Crevel R, et al. Risk factors for Mycobacterium tuberculosis infection in Indonesian children living with a sputum smear‐positive case. Int J Tuberc Lung Dis. 2012;16(12):1594–9. [DOI] [PubMed] [Google Scholar]
- 25. Shah M, Kasambira TS, Adrian PV, Madhi SA, Martinson NA, Dorman SE. Longitudinal analysis of QuantiFERON‐TB Gold In‐Tube in children with adult household tuberculosis contact in South Africa: a prospective cohort study. PLoS One. 2011;6(10):e26787. [DOI] [PMC free article] [PubMed] [Google Scholar]
- 26. Sharma SK, Vashishtha R, Chauhan LS, Sreenivas V, Seth D. Comparison of TST and IGRA in diagnosis of latent tuberculosis infection in a high TB‐burden setting. PLoS One. 2017;12(1):e0169539. [DOI] [PMC free article] [PubMed] [Google Scholar]
- 27. Stein CM, Zalwango S, Malone LL, Thiel B, Mupere E, Nsereko M, et al. Resistance and susceptibility to mycobacterium tuberculosis infection and disease in tuberculosis households in Kampala, Uganda. Am J Epidemiol. 2018;187(7):1477–89. [DOI] [PMC free article] [PubMed] [Google Scholar]
- 28. Zhang HC, Ruan QL, Wu J, Zhang S, Yu SL, Wang S, et al. Serial T‐SPOT.TB in household contacts of tuberculosis patients: a 6‐year observational study in China. Int J Tuberc Lung Dis. 2019;23(9):989–95. [DOI] [PubMed] [Google Scholar]
- 29. Akhtar S, Rathi SK. Multilevel modeling of household contextual determinants of tuberculin skin test positivity among contacts of infectious tuberculosis patients, Umerkot, Pakistan. Am J Trop Med Hyg. 2009;80(3):351–8. [PubMed] [Google Scholar]
- 30. Hu Y, Zhao Q, Wu L, Wang W, Yuan Z, Xu B. Prevalence of latent tuberculosis infection and its risk factors in schoolchildren and adolescents in Shanghai, China. Eur J Public Health. 2013;23(6):1064–9. [DOI] [PubMed] [Google Scholar]
- 31. Araújo NCN, Cruz CMS, Arriaga MB, Cubillos‐Angulo JM, Rocha MS, Silveira‐Mattos PS, et al. Determinants of losses in the latent tuberculosis cascade of care in Brazil: a retrospective cohort study. Int J Infect Dis. 2020;93:277–83. [DOI] [PMC free article] [PubMed] [Google Scholar]
- 32. Marais BJ, Van Zyl S, Schaaf HS, Van Aardt M, Gie RP, Beyers N. Adherence to isoniazid preventive chemotherapy: a prospective community based study. Arch Dis Child. 2006;91(9):762–5. [DOI] [PMC free article] [PubMed] [Google Scholar]
- 33. Nakaoka H, Lawson L, Squire SB, Coulter B, Ravn P, Brock I, et al. Risk for tuberculosis among children. Emerg Infect Dis. 2006;12(9):1383–8. [DOI] [PMC free article] [PubMed] [Google Scholar]
- 34. Oxlade O, Benedetti A, Adjobimey M, Alsdurf H, Anagonou S, Cook VJ, et al. Effectiveness and cost‐effectiveness of a health systems intervention for latent tuberculosis infection management (ACT4): a cluster‐randomised trial. Lancet Public Health. 2021;6(5):e272–82. [DOI] [PubMed] [Google Scholar]
- 35. Sun L, Qi X, Guo Y, Qi H, Li J, Wu X, et al. Tuberculosis infection screening in children with close contact: a hospital‐based study. BMC Infect Dis. 2021;21(1):815. [DOI] [PMC free article] [PubMed] [Google Scholar]
- 36. Triasih R, Padmawati RS, Duke T, Robertson C, Sawyer SM, Graham SM. A mixed‐methods evaluation of adherence to preventive treatment among child tuberculosis contacts in Indonesia. Int J Tuberc Lung Dis. 2016;20(8):1078–83. [DOI] [PubMed] [Google Scholar]
- 37. Adjobimey M, Masserey E, Adjonou C, Gbénagnon G, Schwoebel V, Anagonou S, et al. Implementation of isoniazid preventive therapy in children aged under 5 years exposed to tuberculosis in Benin. Int J Tuberc Lung Dis. 2016;20(8):1055–9. [DOI] [PubMed] [Google Scholar]
- 38. Amisi JA, Carter EJ, Masini E, Szkwarko D. Closing the loop in child TB contact management: completion of TB preventive therapy outcomes in western Kenya. BMJ Open. 2021;11(2):e040993. [DOI] [PMC free article] [PubMed] [Google Scholar]
- 39. Barbosa Silva AP, Hill P, Belo MTCT, Rabelo SG, Menzies D, Trajman A. Non‐completion of latent tuberculous infection treatment among children in Rio de Janeiro state, Brazil. Int J Tuberc Lung Dis. 2016;20(4):479–86. [DOI] [PubMed] [Google Scholar]
- 40. Burmen B, Mutai K, Malika T. Isoniazid preventative therapy uptake for child household contacts of tuberculosis index cases, Kisumu County, Kenya, 2014‐2015. J Public Health Afr. 2019;10(1):827. [DOI] [PMC free article] [PubMed] [Google Scholar]
- 41. Garie KT, Yassin MA, Cuevas LE. Lack of adherence to isoniazid chemoprophylaxis in children in contact with adults with tuberculosis in Southern Ethiopia. PLoS One. 2011;6(11):e26452. [DOI] [PMC free article] [PubMed] [Google Scholar]
- 42. Van Ginderdeuren E, Bassett J, Hanrahan CF, Mutunga L, Van Rie A. Gaps in the tuberculosis preventive therapy care cascade in children in contact with TB. Paediatr Int Child Health. 2021;41(4):237–46. [DOI] [PubMed] [Google Scholar]
- 43. Krishnamoorthy Y, Ezhumalai K, Murali S, Rajaa S, Jose M, Sathishkumar A, et al. Prevalence and risk factors associated with latent tuberculosis infection among household contacts of smear positive pulmonary tuberculosis patients in South India. Trop Med Int Health. 2021;26(12):1645–51. [DOI] [PubMed] [Google Scholar]
- 44. Narasimhan P, MacIntyre CR, Mathai D, Wood J. High rates of latent TB infection in contacts and the wider community in South India. Trans R Soc Trop Med Hyg. 2017;111(2):55–61. [DOI] [PubMed] [Google Scholar]
- 45. Paradkar M, Padmapriyadarsini C, Jain D, Shivakumar SVBY, Thiruvengadam K, Gupte AN, et al. Tuberculosis preventive treatment should be considered for all household contacts of pulmonary tuberculosis patients in India. PLoS One. 2020;15(7):e0236743. [DOI] [PMC free article] [PubMed] [Google Scholar]
- 46. Okwara FN, Oyore JP, Were FN, Gwer S. Correlates of isoniazid preventive therapy failure in child household contacts with infectious tuberculosis in high burden settings in Nairobi, Kenya – a cohort study. BMC Infect Dis. 2017;17(1):623. [DOI] [PMC free article] [PubMed] [Google Scholar]
- 47. Paul NI, Gabriel‐Job N. Adherence to isoniazid preventive therapy (IPT) among children in close contact with adult pulmonary tuberculosis (PTB) patients. J Adv Med Med Res. 2019;30(11):1–8. [Google Scholar]
- 48. Rutherford ME, Ruslami R, Maharani W, Yulita I, Lovell S, Van Crevel R, et al. Adherence to isoniazid preventive therapy in Indonesian children: a quantitative and qualitative investigation. BMC Res Notes. 2012;5(1):7. [DOI] [PMC free article] [PubMed] [Google Scholar]
- 49. Sulis G, Combary A, Getahun H, Gnanou S, Giorgetti PF, Konseimbo A, et al. Implementation of tuberculosis prevention for exposed children, Burkina Faso. Bull World Health Organ. 2018;96(6):386–92. [DOI] [PMC free article] [PubMed] [Google Scholar]
- 50. Rekha B, Jagarajamma K, Chandrasekaran V, Wares F, Sivanandham R, Swaminathan S. Improving screening and chemoprophylaxis among child contacts in India's RNTCP: a pilot study. Int J Tuberc Lung Dis. 2013;17(2):163–8. [DOI] [PubMed] [Google Scholar]
- 51. Shivaramakrishna HR, Frederick A, Shazia A, Murali L, Satyanarayana S, Nair SA, et al. Isoniazid preventive treatment in children in two districts of South India: does practice follow policy? Int J Tuberc Lung Dis. 2014;18(8):919–24. [DOI] [PMC free article] [PubMed] [Google Scholar]
- 52. Seid G, Tsedalu T, Ayele M. Adherence to isoniazid preventive therapy among under‐five children in contact with adult bacteriologically confirmed pulmonary tuberculosis patients: a mixed‐method study. Int J Microbiol. 2020;2020:8834806. [DOI] [PMC free article] [PubMed] [Google Scholar]
- 53. Tadesse Y, Gebre N, Daba S, Gashu Z, Habte D, Hiruy N, et al. Uptake of isoniazid preventive therapy among under‐five children: TB contact investigation as an entry point. PLoS One. 2016;11(5):e0155525. [DOI] [PMC free article] [PubMed] [Google Scholar]
- 54. Birungi FM, Graham SM, Uwimana J, Musabimana A, Van Wyk B. Adherence to isoniazid preventive therapy among child contacts in Rwanda: a mixed‐methods study. PLoS One. 2019;14(2):e0211934. [DOI] [PMC free article] [PubMed] [Google Scholar]
- 55. Black F, Amien F, Shea J. An assessment of the isoniazid preventive therapy programme for children in a busy primary healthcare clinic in Nelson Mandela Bay Health District, Eastern Cape Province, South Africa. S Afr Med J. 2018;108(3):217–23. [DOI] [PubMed] [Google Scholar]
- 56. Chauhan S, Gahalaut P, Rathi AK. Tuberculin skin test, chest radiography and contact screening in children ≤5 y: relevance in Revised National Tuberculosis Control Programme (RNTCP). Indian J Pediatr. 2013;80(4):276–80. [DOI] [PubMed] [Google Scholar]
- 57. Datiko DG, Yassin MA, Theobald SJ, Cuevas LE. A community‐based isoniazid preventive therapy for the prevention of childhood tuberculosis in Ethiopia. Int J Tuberc Lung Dis. 2017;21(9):1002–7. [DOI] [PMC free article] [PubMed] [Google Scholar]
- 58. Egere U, Sillah A, Togun T, Kandeh S, Cole F, Jallow A, et al. Isoniazid preventive treatment among child contacts of adults with smear‐positive tuberculosis in The Gambia. Public Health Action. 2016;6(4):226–31. [DOI] [PMC free article] [PubMed] [Google Scholar]
- 59. Wysocki AD, Villa TCS, Arakawa T, Brunello MEF, Vendramini SHF, Monroe AA, et al. Latent tuberculosis infection diagnostic and treatment cascade among contacts in primary health care in a city of Sao Paulo state, Brazil: cross‐sectional study. PLoS One. 2016;11(6):e0155348. [DOI] [PMC free article] [PubMed] [Google Scholar]
- 60. Fentahun N, Wasihun Y, Mamo A, Gebretsadik LA. Contact screening and isoniazid preventive therapy initiation for under‐five children among pulmonary tuberculosis‐positive patients in Bahir Dar Special Zone, Northwest Ethiopia: a cross‐sectional study. Tuberc Res Treat. 2020;2020:6734675. [DOI] [PMC free article] [PubMed] [Google Scholar]
- 61. Faksri K, Reechaipichitkul W, Pimrin W, Bourpoern J, Prompinij S. Transmission and risk factors for latent tuberculosis infections among index case‐matched household contacts. Southeast Asian J Trop Med Public Health. 2015;46(3):486–95. [PubMed] [Google Scholar]
- 62. Sayedi SM, Seddiq MK, Rashidi MK, Qader G, Ikram N, Melese M, et al. Active household contact screening for tuberculosis and provision of isoniazid preventive therapy to under‐five children in Afghanistan. PLoS One. 2020;15(10):e0240031. [DOI] [PMC free article] [PubMed] [Google Scholar]
- 63. Schwoebel V, Koura KG, Adjobimey M, Gnanou S, Wandji AG, Gody JC, et al. Tuberculosis contact investigation and short‐course preventive therapy among young children in Africa. Int J Tuberc Lung Dis. 2020;24(4):452–60. [DOI] [PubMed] [Google Scholar]
- 64. Sharma N, Basu S, Khanna A, Sharma P, Chopra KK, Chandra S. Adherence to isoniazid preventive therapy among children living with tuberculosis patients in Delhi, India: an exploratory prospective study. Indian J Tuberc. 2022;69(1):100–3. [DOI] [PubMed] [Google Scholar]
- 65. Van Soelen N, Du Preez K, Van Wyk SS, Mandalakas AM, Enarson DA, Reid AJ, et al. Does an isoniazid prophylaxis register improve tuberculosis contact management in South African children? PLoS One. 2013;8(12):e80803. [DOI] [PMC free article] [PubMed] [Google Scholar]
- 66. Gomes VF, Wejse C, Oliveira I, Andersen A, Vieira FJ, Carlos LJ, et al. Adherence to isoniazid preventive therapy in children exposed to tuberculosis: a prospective study from Guinea‐Bissau. Int J Tuberc Lung Dis. 2011;15(12):1637–43. [DOI] [PubMed] [Google Scholar]
- 67. Hector J, Anderson ST, Banda G, Kamdolozi M, Jefferys LF, Shani D, et al. TST positivity in household contacts of tuberculosis patients: a case‐contact study in Malawi. BMC Infect Dis. 2017;17:259. [DOI] [PMC free article] [PubMed] [Google Scholar]
- 68. Mensah G, Sowah S, Yeboah N, Addo K, Jackson‐Sillah D. Utility of QuantiFERON tuberculosis gold‐in‐tube test for detecting latent tuberculosis infection among close household contacts of confirmed tuberculosis patients in Accra, Ghana. Int J Mycobacteriol. 2017;6(1):27–33. [DOI] [PubMed] [Google Scholar]
- 69. Nguyen TH, Odermatt P, Slesak G, Barennes H. Risk of latent tuberculosis infection in children living in households with tuberculosis patients: a cross sectional survey in remote northern Lao People's Democratic Republic. BMC Infect Dis. 2009;9:96. [DOI] [PMC free article] [PubMed] [Google Scholar]
- 70. Mzembe T, Lessells R, Karat AS, Randera‐Rees S, Edwards A, Khan P, et al. Prevalence and risk factors for Mycobacterium tuberculosis infection among adolescents in rural South Africa. Open Forum Infect Dis. 2020;8(1):ofaa520. [DOI] [PMC free article] [PubMed] [Google Scholar]
- 71. Barss L, Moayedi‐Nia S, Campbell JR, Oxlade O, Menzies D. Interventions to reduce losses in the cascade of care for latent tuberculosis: a systematic review and meta‐analysis. Int J Tuberc Lung Dis. 2020;24(1):100–9. [DOI] [PubMed] [Google Scholar]
- 72. Imrey PB. Limitations of meta‐analyses of studies with high heterogeneity. JAMA Netw Open. 2020;3(1):e1919325. [DOI] [PubMed] [Google Scholar]
- 73. Burugina Nagaraja S, Thekkur P, Satyanarayana S, Tharyan P, Sagili KD, Tonsing J, et al. Active case finding for tuberculosis in India: a syntheses of activities and outcomes reported by the National Tuberculosis Elimination Programme. Trop Med Infect Dis. 2021;6(4):206. [DOI] [PMC free article] [PubMed] [Google Scholar]
Associated Data
This section collects any data citations, data availability statements, or supplementary materials included in this article.
Supplementary Materials
Table S1 Search strategies for implementing TB preventive therapy among household contacts in high TB burden settings.
Table S2. Operational definitions.
Table S3. PRISMA 2020 Checklist.
Figure S1. Forest plot of the pooled LTBI positivity estimates in studies using TST or IGRA or a combination of tests sub‐grouped by place of testing.
Figure S2. Forest plot of the pooled LTBI positivity estimates in studies using TST or IGRA or a combination of tests sub‐grouped by study design.
Figure S3. Forest plot of the pooled LTBI positivity estimates in studies from Africa using TST or IGRA or a combination of tests sub‐grouped by geographical regions.
Figure S4. Forest plot of the pooled LTBI positivity estimates in studies from Asia using TST or IGRA or a combination of tests sub‐grouped by geographical regions.
Figure S5. Forest plot of the pooled LTBI positivity estimates in studies from South America using TST or IGRA or a combination of tests.
Figure S6. Forest plot of the pooled LTBI positivity estimates in studies using TST alone sub‐grouped by place of testing.
Figure S7. Forest plot of the pooled LTBI positivity estimates in studies using TST alone sub‐grouped by the size of skin induration.