



Abstract
Spatial genetic structure (SGS) is important to a population's ability to adapt to environmental change. For species that reproduce both sexually and asexually, the relative contribution of each reproductive mode has important ecological and evolutionary implications because asexual reproduction can have a strong effect on SGS. Reef‐building corals reproduce sexually, but many species also propagate asexually under certain conditions. To understand SGS and the relative importance of reproductive mode across environmental gradients, we evaluated genetic relatedness in almost 600 colonies of Montipora capitata across 30 environmentally characterized sites in Kāneʻohe Bay, Oʻahu, Hawaii, using low‐depth restriction digest‐associated sequencing. Clonal colonies were relatively rare overall but influenced SGS. Clones were located significantly closer to one another spatially than average colonies and were more frequent on sites where wave energy was relatively high, suggesting a strong role of mechanical breakage in their formation. Excluding clones, we found no evidence of isolation by distance within sites or across the bay. Several environmental characteristics were significant predictors of the underlying genetic variation (including degree heating weeks, time spent above 30°C, depth, sedimentation rate and wave height); however, they only explained 5% of this genetic variation. Our results show that asexual fragmentation contributes to the ecology of branching corals at local scales and that genetic diversity is maintained despite strong environmental gradients in a highly impacted ecosystem, suggesting potential for broad adaptation or acclimatization in this population.
Keywords: clonality, environmental mosaic, genetic relatedness, Kāne'ohe Bay, Montipora capitata, seascape genomics
1. INTRODUCTION
Coral reefs are diverse ecosystems that support a disproportionate number of the world's marine organisms and provide valuable ecosystem services to humans. The health of reefs is determined by a complex interaction of environmental and biological factors, where coral assemblage structure is tightly linked to reef function. Despite their ecological importance, coral reefs are declining worldwide (De'ath et al., 2012; Hughes et al., 2017; Pandolfi et al., 2003). Major anthropogenic factors including climate change, pollution from terrestrial runoff, dredging, overfishing and coastal development are negatively impacting corals, while interactions among multiple stressors often amplify declines (Muthukrishnan & Fong, 2014). Climate change‐induced heat stress can be exacerbated by local stressors, resulting in increased coral bleaching and mortality (Donovan et al., 2021; Hoegh‐Guldberg, 1999; Sully et al., 2019; van Oppen & Lough, 2018—but see Hughes et al., 2017). The decline of coral reefs has prompted a growing interest in developing active management solutions (van Oppen et al., 2017), which are dependent on the characterization of environmental and biological factors and their interactions.
Environmental differences over large and small spatial scales can generate intraspecific genetic divergence in corals, which may represent local adaptation to salinity, water chemistry, sedimentation and temperature (Bay & Palumbi, 2014; Cooke et al., 2020; Dixon et al., 2015; Selmoni et al., 2020, 2021). Genetic divergence also can be driven by local anthropogenic pressure (Zvuloni et al., 2008), where corals in similar conditions tend to be more genetically similar (Tisthammer et al., 2020). Kāne'ohe Bay, located on the northeastern coast of O'ahu, Hawai'i, is largely sheltered by a barrier reef separating a fringing reef and dozens of patch reefs of various sizes from the open ocean. Despite a history of regular natural and anthropogenic disturbance, coral cover remains at ~60% in the bay (Bahr et al., 2015). The reefs of Kāne'ohe Bay are among the best‐studied in the world and experience a broad range of conditions including diel variability in temperature, pH and oxygen concentration (Barott et al., 2021; Drupp et al., 2011, 2013; Guadayol et al., 2014; Shamberger et al., 2011) driven by the timing of low tide, water residence times and flow dynamics (Koweek et al., 2015; Lowe et al., 2009a). These interacting physical and biochemical processes create small‐scale variation over as little as 25 m (Guadayol et al., 2014) that is ideal for studying genetic–environmental correlates in corals.
Clonal propagation occurs in many coral species, including branching and massive morphologies across a range of environments, suggesting the ubiquity of this process as an alternative reproductive strategy (Adjeroud et al., 2014; Baums et al., 2006; Drury et al., 2019; Foster et al., 2007, 2013; Gélin et al., 2017; Gorospe & Karl, 2013; Manzello et al., 2019). However, the contribution of clonality to a coral population can be highly variable within and between species, creating substantial scope for adjusting to small‐scale environmental gradients and diffusing disturbance risk. The aim of this study was to examine how spatial patterns of clonality and genetic structure vary across an environmental mosaic in a reef‐building coral. We used Montipora capitata as a model to evaluate if (i) clonal reproduction plays a role in the distribution of colonies across spatial scales and (ii) environmental correlates explain spatial genetic structure. To do so, we mapped and sampled tissue from ~20 colonies at each of 30 sites where we also measured environmental characteristics (temperature, sedimentation rates and wave energy). This study also serves as a foundation for long‐term monitoring of a model coral population in the context of environmental heterogeneity.
2. METHODS
2.1. Site and colony selection
In 2017, we established long‐term study sites at 30 patch reefs spanning 12 km across Kāne'ohe Bay, O'ahu, Hawai'i (Figure 1a; Figure S1). The bay was divided into five blocks from south to north based on the water flow regimes and modelled water residence time (Lowe et al., 2009a, 2009b). Block 1 has the longest water residence time with >30 days on average, blocks 2 and 3 have a residency of 10–20 days, and blocks 4 and 5 have typical residency times less than 1 day. We defined patch reefs in qgis (QGIS Development Team, 2017) based on benthic habitat maps (Hawai'i Statewide GIS Program, 2017; Neilson et al., 2014) and imagery available in the qgis OpenLayers plugin. Features were considered patch reefs if they were distinct coral reef structures not contiguous with coral structure of the fringing reef or forereef. All patch reef polygons were assigned to a block. For each block, 30 random GPS coordinates were generated within the patch reef polygons using the random points function in qgis. Coordinates that fell on the patch reef including Moku o Lo'e Island (Hawai'i Institute of Marine Biology) in block 2 were excluded from site selection because of the terrestrial influence of the island and the significantly altered reef ecosystem due to development and research.
FIGURE 1.

Study system. (a) Map of Kāne'ohe Bay with colours denoting 30 sites distributed across five blocks. Sites were chosen using a random stratified design on patch reefs and ~20 Montipora capitata colonies were sampled from each. (b) Example of an individual site, where corals are selected along a 10‐m transect running in up to four cardinal directions from the centre. Photomosaic background for example only, corresponding to a 6‐m radius from the central cinder block.
The random points were surveyed in sequential order and the first six suitable sites in each block were retained for the study, with a total of 30 sites across the bay (Figure 1a; Table S1). Sites were considered suitable if at least 20 colonies of Montipora capitata > 10 cm diameter were found in the initial survey and if the site was confirmed to be on a patch reef. Coordinates that fell very close to the edge of a patch reef were excluded. For selected sites, the central coordinate point was marked with a cinder block and nominal depth was recorded. Starting at the cinder block, a 10‐m transect tape was laid consecutively to the west, south, east and north directions until 20 colonies of >10 cm diameter were found (Figure 1b; <10 m from the central block). Only corals that appeared visually healthy and thus physiologically and reproductively recovered from the 2014/2015 bleaching event (Cunning et al., 2016; Johnston et al., 2020; Ritson‐Williams & Gates, 2020; Wall, 2019; Wall et al., 2019) were chosen for this study and individually tagged. Each colony was photographed with a colour card standard and size scale after tagging. The position of the colonies along the transect was recorded, which later allowed us to calculate the distance between colonies within the same site.
Sites were periodically revisited, tags cleaned of biofouling, and colonies rephotographed and scored for health. During early 2019, colonies were individually assessed and ambiguous colonies that could no longer be definitely associated with a tag (either because the tag was lost, or the colony died) were noted and excluded from subsequent monitoring. Remaining colonies were retagged.
2.2. Environmental monitoring
Temperature data were recorded at 10‐min intervals with calibrated Hobo Pendant or Water Temp Pro v2 loggers (Onset Computer Corp.) attached to the cinder block at the centre of each site. Deployments began in July 2017 with loggers periodically retrieved, downloaded, recalibrated and/or cross‐validated, and replaced at ~6–9‐month intervals. Temperature monitoring is ongoing.
Sediment traps (16″ vertically mounted capped 2″ PVC pipe) were attached to each cinder block. Sediment traps were exchanged every 1–2 months for a total of seven deployments and the dry weight of recovered material was used to estimate the sediment accumulation rate for each site following Storlazzi et al. (2011).
Current meters (TCM‐x w/MAt1 data logger, Lowell Industries) were deployed at one location in each block from March 18 to March 29, 2019. Meters were anchored to a cement slab following manufacturer's installation guidelines and used to calculate root mean square (RMS) water velocity and wave height, which was generalized to nearby sites within the block. While there is no available information on longer‐term patterns of wave energy in Kāne'ohe Bay, we expect that the relative differences within blocks are representative of longer‐scale patterns across tides and seasonal weather patterns.
2.3. DNA sampling, ddRAD library preparation and sequencing
A <1‐cm3 fragment was sampled in early 2018 from each tagged colony, preserved in 70% ethanol and stored at −20°C until processed. We extracted DNA from an ~2‐mm3 piece of each fragment using Nucleospin Tissue Kits (Macherey‐Nagel,) following the manufacturer's instructions and quantified by fluorimetry (Quant‐it HS dsDNA kit, Thermo‐Fisher). We followed the general strategy of double‐digest restriction site‐associated DNA sequencing (ddRAD) outlined in Peterson et al. (2012).
Briefly, we used an in silico digestion (ddradseqtools Python package; Mora‐Márquez et al., 2017) of the M. capitata genome (Shumaker et al., 2019) to choose enzymes expected to yield ~3000 fragments in the range 220–240 bp. BclI and EcoRI restriction enzymes (New England Biolabs [NEB]) were used to digest ~300 ng DNA from each sample in 30‐μl reactions. We then ligated adapters (Integrated DNA Technologies), which included sequences complementary to the restriction cut motifs and sites for annealing PCR primers, with T4 DNA ligase (NEB). Samples were amplified (Q5 High‐Fidelity Polymerase Kit, NEB) with a unique pair of primers based on Illumina TruSeq sequences (Illumina Inc.), each containing a custom 6‐bp barcode and a variable/degenerate 4‐bp sequence for detecting PCR (polymerase chain reaction) duplicates, along with p5/p7 flanking primers to enhance production of full‐length constructs. The constructs were quantified by fluorimetry as above, reduced into 12 subpools of ~50 samples each, and size‐selected on a Pippin Prep electrophoresis recovery instrument (Sage Science) using “Tight” mode with a 370‐bp target size. Each subpool was then requantified, and all subpools were combined into an equimolar final pool. Clean up with Ampure XP SPRI beads (Beckman Coulter) was performed after ligation, subpooling and final pooling steps to remove reagent contamination and for rough size selection.
The final sequencing library was composed of 640 uniquely barcoded samples. Replicates (69 independently extracted and prepared biological replicates from 10 colonies [n = 6–7 per colony] with two colonies from each block) were included in the library to evaluate clonality following Manzello et al. (2019). The library was sequenced on a single lane of an Illumina HiSeq 4000 using paired‐end 150‐bp chemistry (GeneWiz).
2.4. Environmental data analysis
There were gaps in temperature data throughout the time series due to lost or corrupted loggers. We used a machine learning approach to impute raw temperature data using the missForest package (Stekhoven & Bühlmann, 2011). After filtering raw temperature data to time points with records for >70% of sites (at least 21 sites), we imputed missing information with mtry = 100 and ntree = 100. This approach presents a uniformly incomplete time series from July 2017 to March 2019 by filling in 12.8% of the overall dataset (Figure 2a). To evaluate the accuracy of this approach, we randomly sampled 5000 time points and created 5% missingness in random known values before rerunning the imputation analysis. Imputed values were within 0.1°C of known values in 88% of observations and the absolute difference averaged 0.07 ± 0.002°C from known values (mean ± 1SE). This performance suggests the data set provides robust context for using machine learning to fill in gaps in environmental data. We performed a principal component analysis of all temperature points in the time series for each block (Figure 2b).
FIGURE 2.
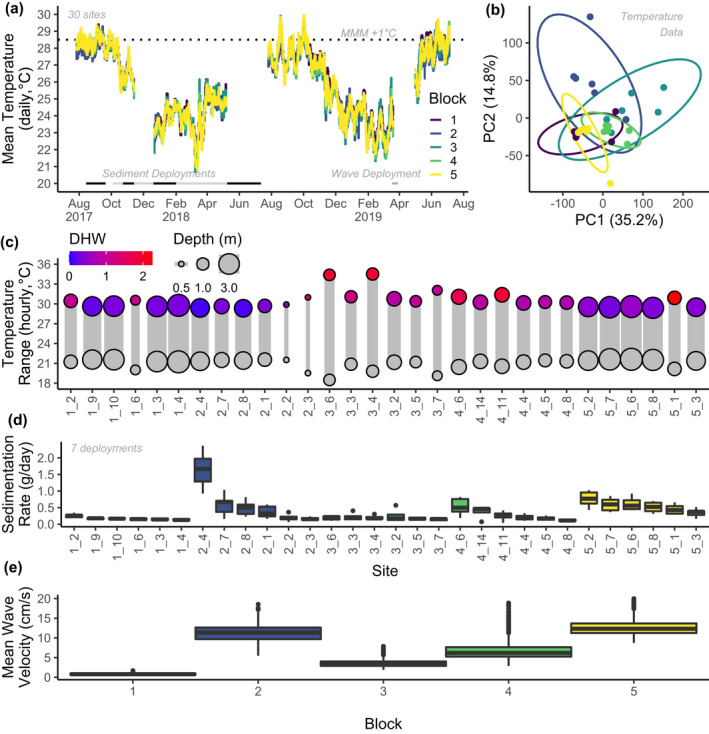
Environmental characteristics. (a) Temperature profiles from August 2017 to August 2019 for the 30 sites, colour coded by block. (b) PCA of all temperature data in panel (a), colour coded by block. Ellipses are 95% confidence intervals. (c) Minimum and maximum hourly temperature at all sites. Grey bar width and point size correspond to nominal site depth and colour corresponds to degree heating weeks (DHW) accumulated over three summers (2017–2019). (d) Mean sedimentation from seven time points on square root transformed y‐axis for visualization. (e) Mean wave velocity in each block. Boxplots represent mean ± 1 IQR.
From these data, we summarized hourly means and calculated degree heating weeks (DHW) as time spent above 28.5°C (mean monthly maximum [MMM] + 1°C; Dilworth et al., 2021) and summarized the total DHW through summers of 2017–2019. We also calculated the global mean, maximum and minimum temperature at each site and the average daily range. We took the bay‐wide average temperature for each day and calculated the residual, which was averaged for each site for the entire time period, and calculated the total number of hours spent above 30°C. We used hourly averaged NOAA NCRMP temperature data from 2008 to 2019 at five nearshore O'ahu sites (<10 m; Pacific Islands Fisheries Science Center, 2021) to evaluate local seasonality and defined the warmest stable period of the year (hereafter “summer”) as August 15 to October 15 (Figure S2). We calculated daily temperature profiles for each site during this period (Figure S3). Finally, we extracted data from the summer and calculated the 3‐year average for mean, standard deviation, daily range and minimum temperature. We used depth‐corrected wave height, wave velocity (RMS) and sedimentation rate as inputs for the distance‐based redundancy analysis (dbRDA).
2.5. Analysis of genomic data
We trimmed adapters and removed PCR duplicates from sequencing data using tagseq_clipper.pl (https://github.com/z0on/tag‐based_RNAseq) and then trimmed reads using trimmomatic 0.39 (Bolger et al., 2014) when the 5‐bp average quality score was <20. Reads were aligned to the M. capitata genome using bowtie2 1.3.0 (Langmead & Salzberg, 2012) with –very‐sensitive‐local settings.
Aligned reads were processed to assess pairwise genetic distance using angsd 0.931 (Korneliussen et al., 2014) with the following specifications: ‐doIBS 1, ‐minInd 320, ‐minQ 30, ‐minMapQ 20, ‐SNPpval 1e‐4. The identity by state (IBS) function in angsd takes a single random read at each locus to standardize variable depth sites before calculating an overall genetic distance for each pair of samples. This approach was used with relatively permissive coverage settings (>55% of samples) to provide an initial estimate of clonality for our analysis. Genotype–environment correlations were analysed separately using more stringent filtration: we calculated genotype likelihoods using angsd with allele frequency priors (‐GL 2, ‐doGeno 8, ‐doPost 1, ‐minInd 200, ‐minQ 30, ‐minMapQ 20, ‐genoMinDepth 3). We then summed the probability of the heterozygote (ab) and 2× secondary homozygote (bb) to predict the number of secondary alleles without hard‐calling genotypes for each sample following Drury and Lirman (2021). This output was subsequently filtered in R to create a final data set of GLs for 9955 loci which were present in at least 82% of samples (range 82.7%–99.4% coverage). Depth averaged 20.2 ± 8.5 reads per locus (1SD; range 10–63).
We used the relatedness from angsd to calculate the 95th percentile of pairwise distance between biological replicates after visually assessing outliers (Figure 3a); this value was used as the threshold for calling genotypes using hierarchical clustering with the complete method in the R package hclust. Several samples (~15) were closely related to called clonal groups but not assigned as clonal replicates by our threshold approach (Figure 3b); however, this is a small proportion of our data set and the choice of a different threshold is unlikely to impact our conclusions. It is possible that these samples had lower depth or more sparse/variable coverage, but our approach should be conservative for handling these instances.
FIGURE 3.

Patterns of clonality in Montipora capitata across Kāne'ohe Bay. (a) Distribution of pairwise genetic distances in biological replicates (69). Red highlighted values were visually inspected and designated as outliers. Grey values represent distribution from which the 95th percentile was calculated to determine clones in the broader population. (b) Identity by descent dendrogram calculated using complete hierarchical clustering. Orange groupings represent biological replicates (n = 10) and blue groupings represent inferred clones. One genotype at site 5_6 was composed of eight colonies, but most other clones were pairs of colonies within the same site.
After determining the existence of clonal groups, we calculated the genet:ramet ratio (G:R; 1 = no clonality, 0 = complete clonality) by dividing the number of genotypes by the number of samples at each site and calculated mean pairwise relatedness (using IBS values described above where lower = more closely genetically related) with and without clones at each site. We used a Wilcoxon test to compare the spatial distance of all nonclonal samples at a site with the distance of clonal samples to evaluate spatial clustering. We used a Mantel test to calculate isolation by distance after randomly selecting one individual from each genotype at each site using the R package ade4 (Dray & Dufour, 2007). Wilcoxon and Mantel p‐values were false discovery rate (FDR)‐adjusted to account for multiple comparisons. To test for the effect of physical disturbance, we used a linear regression to compare genet:ramet ratio to wave height and depth. We also used a Mantel test to compare geographical and genetic distance across Kāne'ohe Bay. We processed genotype likelihood values as described above as the summary statistic of the genotype of each sample at each locus and randomly excluded all but one sample from each genotype to remove clonality from the downstream analysis. We used a dbRDA with Bray–Curtis distances to project genetic variation between individuals explained by environmental factors into reduced dimensional space (Capblancq et al., 2018), with an ANOVA to test for overall significance using the R package vegan (Dixon, 2003). We used a PERMANOVA to test for significant differences between blocks and calculated variance explained using sum of squares of all environmental characteristics. All statistical analyses were performed in R 4.0.4 (R Core Team, 2021).
3. RESULTS
The 30 sites in this study had broadly different environmental characteristics (Figure 2; Table S1). Temperatures followed the same seasonal trajectory throughout the bay (Figure 2a) but had substantially different fine‐scale dynamics including minimum, maximum and daily range (Figure 2c). During the 2.5 years, sites experienced between 0 and 2.2 DHW (Figure 2c) but daily temperature ranges differed substantially (0.51–2.58°C), including peak temperatures >34°C at two sites (3_4 and 3_6). Sites experienced between 0 and 148 h above 30°C during the 2.5 years. Nominal depth ranged from 0.5 to 3.5 m (Figure 2c), sediment capture ranged nearly 300‐fold from 0.01 to 2.93 g day−1 (Figure 2d), wave height ranged from 0.08 to 0.31 m (Figure 2e), and mean water velocity ranged greater than 10‐fold from 0.8 to 12.56 cm s−1 (Figure 2; Table S1).
After filtration, initial quality control and alignment, samples had a mean of 209,462 ± 136,798 reads (mean ± SD). We used angsd for this analysis, which is suitable for low and variable depth sequencing. The genetic distance (1‐IBS) of biological replicates sequenced from independent extractions and library preparations of multiple tissue samples of the same colony was between 0.04 and 0.15; however, there was a clear set of outliers >0.07 (Figure 3a). The 95th percentile of the nonoutlier pairwise distances was 0.064, which was used as the clonality threshold following Drury et al. (2019) (Figure 3).
All but one biological replicate of each sample was excluded resulting in a total of 579 samples used in clonality analysis. These samples represented 531 genotypes, of which 36 were found to have clones for a bay‐wide genet:ramet ratio of 0.917. The most abundant genotype was composed of eight sampled colonies (Figure 3b), all of which were at a single site (5_6) in block 5, which had the lowest genet:ramet ratio of any site (G:R = 0.578; Table S2). Three genotypes included colonies from multiple reefs (n = 2–3 reefs), all of which were in block 2, which has high wave energy (mean RMS = 11.178). Most clonal genotypes contained only two representative colonies at the same site (26 of 36). G:R ranged from 0.578 to 1, and 11 sites had G:R equal to 1, indicating no clones were found (Table S2).
We used dbRDA to examine environmental drivers of genetic variation and found eight factors were significant after multiple comparisons correction (p < .05; Figure 4a; Table S3); however, all variables only explained 4.8% of the variation. In order of explained variance, these were depth, hours above 30°C, degree heating weeks, mean sedimentation, summer daily temperature range, minimum temperature, wave height and temperature residual (Table S3). There was significant population structuring between blocks (Figure 4b; PERMANOVA p < .001). We examined the presence of samples from corals that were members of a clonal genotype (only one colony from each genotype was included) in the dbRDA and found that clonal colonies had a similar overall distribution of genetic variance to nonclonal colonies across the bay (Figure 4c).
FIGURE 4.
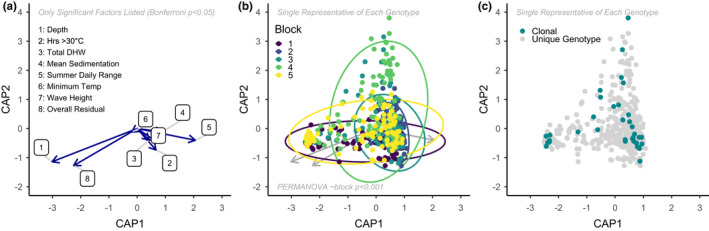
Distance‐based redundancy analysis (dnRDA) was used to examine environmental drivers of underlying genetic patterns. Points represent individual colonies in the study, with only one random individual from each clonal group (i.e., clones removed). (a) Significant (Bonferroni p < .05) environmental drivers of genetic patterns in the bay. Each arrow signifies the multiple partial correlation of the environmental driver in the RDA whose length and direction can be interpreted as indicative of its contribution to the explained variation. Environmental variables are listed in descending order of variance explained. (b) Distribution of colonies based on genotype likelihoods, coloured per block. Ellipses are 95% confidence intervals. (c) Distribution of corals with clonal replicates in the bay. For all dbRDA, only one individual sample from a genotype was used to avoid clonality effects in the analysis.
There was little variation in relatedness among sites, with mean values within a site ranging from 0.106 to 0.121 with clones included (Figure 5b,c). When only one random sample from each clonal group at each site was included, the minimum mean relatedness increased to 0.114. Within sites there were no examples of significant isolation by distance after multiple comparisons correction (Mantel test FDR p > .1), but at all sites with clones (n = 19), colonies of the same genotype had significantly lower pairwise spatial distance than the pairwise distance between all colonies at that site (Wilcox test; FDR p < .045). There was a significant negative relationship between G:R and wave height (lm p = .047) and depth (lm p = .046) which explained 31.4% of the variance, indicating that wave energy is positively related to the presence of clones (lm p = .123). We used a Mantel test to compare genetic distance (one instance of every genotype) and geographical distance over the entire population and found no relationship (Figure S4; R = −.009, p = .71).
FIGURE 5.
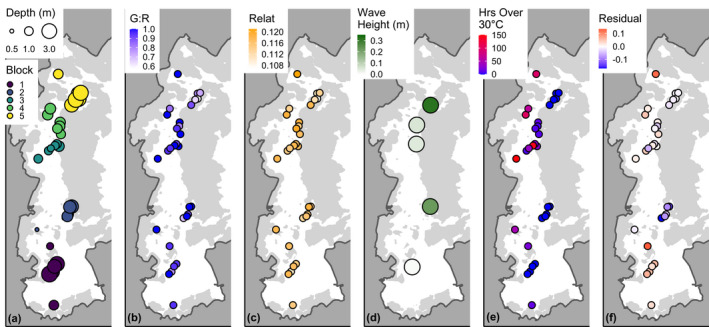
Spatial distribution of genetic and environmental outcomes. (a) Map of Kāne'ohe Bay with colours denoting five blocks and circle size displaying depth. (b) Genet: ramet ratio at each site. (c) Mean pairwise relatedness at each site, excluding all but one representative of each genotype. (d) Mean wave height from a single site in each block. (e) Hours over 30°C at each site. (f) Average residual temperature at each site.
Environmental characteristics of individual sites were highly variable across Kāne'ohe Bay (Figure 5). Wave energy was low in the South Bay (block 1) and at midbay sites shielded by the sandbar (Figure 5d; blocks 3 and 4). High‐temperature sites were concentrated in northern and inshore reefs (Figure 5e,f), with negative residuals (cooler than average sites) centred in the relatively exposed block 2 (Figure 5f).
4. DISCUSSION
4.1. Genetic–environmental correlates
Previous work has found strong associations of individual genetic loci with environmental factors including temperature, salinity, wave action and water quality over spatial scales from hundreds of metres to thousands of kilometres (Bay & Palumbi, 2014; Cooke et al., 2020; Jin et al., 2016; Selmoni et al., 2020, 2021). Population structure is also related to tidal flux (Underwood et al., 2020) and depth, although depth contrasts have primarily been between shallow and mesophotic reefs (Bongaerts et al., 2017; Serrano et al., 2014). Conversely, our study represents a range of sites across an environmental mosaic of depth, wave action, sedimentation rate and temperature combinations in a semi‐enclosed bay with a total distance separating sites of less than 12 km. We show that no single environmental factor was disproportionately influential on genetic variation, but that depth, sedimentation rate, wave height and several temperature metrics were all significant (Table S3). Previous work has found strong associations of individual genetic loci with environmental factors including temperature, salinity, wave action and water quality over spatial scales from hundreds of metres to thousands of kilometres (Bay & Palumbi, 2014; Cooke et al., 2020; Jin et al., 2016; Selmoni et al., 2020, 2021). The lack of clear, strong relationships with any individual environmental variable suggests that tradeoffs may be important in an environmentally heterogeneous system, dampening strong local adaptation but creating some signals in the underlying genetic variation.
In Montipora capitata in Kāne'ohe Bay, depth strongly dictates symbiosis state, where Durusdinium is dominant at depths less than 2 m and Cladocopium prevalence increases with depth, becoming dominant below ~4.3 m (Innis et al., 2018). Symbiont community also closely covaries with host genetics (Drury et al., 2022), so we hypothesize that light, which is strongly attenuated within the first few metres in this ecosystem, acts as a selective pressure via differential impacts on corals harbouring Cladocopium and Durusdinium. Differential wave energy could also impact genetic variance directly (e.g., influencing larval settlement and survivorship dynamics) or indirectly by correlation with other environmental factors (e.g., sedimentation rate and temperature; Figure 4a). After depth and wave energy, the next most important explanatory variables were temperature characteristics of individual sites, including total degree heating weeks and hours >30°C, suggesting that some underlying genetic variation is associated with local conditions during the hottest time of the year. Interestingly, minimum temperature was also a significant predictor of this genetic variation, which may indicate that tradeoffs between warm and cold tolerance (Howells et al., 2013) are an important factor for coral populations that experience large annual temperature variation of >15°C at some sites (this study).
4.2. Population structure
We found signs of population structuring between blocks in Kāne'ohe Bay, although these differences were represented by restrictions of genetic diversity in certain areas rather than wide divergence. Block 4 separated along the second principal component (Figure 4b), which was not strongly related to any environmental variables, and block 2 was particularly constrained (in multivariate genetic space) relative to other blocks. We then showed that this genetic variation was related to several environmental characteristics which were significant but had limited explanatory power (<5% variance explained). These results are probably a signal of environmental influence in factors that were not measured, which may relate to water residence times or other anthropogenic impacts that covary with gross position within Kāne'ohe Bay and potentially impact dispersal and recruitment.
Previous work across the Hawaiian archipelago found that M. capitata from Kāne'ohe Bay is well connected with the other Main Hawaiian island populations, including those in Maui and Hawai'i (Concepcion et al., 2014), despite distinctive higher anthropogenic pressure and higher temperatures (Bahr et al., 2015). Locatelli and Drew (2019) also found signatures suggesting some fine‐scale genetic structure in M. capitata within Kāne'ohe Bay, although their sampling regime was more focused on inshore–offshore gradients, did not include the southern part of Kāne'ohe Bay and probably did not capture the environmental mosaicism of our sites. Cumulatively, these observations support the decoupling of genetic and geographical distance observed in multiple coral studies (“coral population genetic paradox,” Gorospe & Karl, 2013) and highlight the complexity of genetic–environmental correlates interacting with demographic processes across multiple spatial scales.
4.3. Drivers of coral clonality
The breakdown of isolation by distance in corals is influenced by mixed reproductive strategies, which can have a strong effect on spatial genetic structure (SGS), especially over small spatial scales such as individual reefs. There is significant complexity even within asexual reproductive strategies, including production of ameiotic parthenogenetic larvae, budding and physical fragmentation, which interact with habitat disturbance to impact clonality patterns. For example, Pocillopora acuta release ameiotic parthenogenetic larvae with moderate dispersal potential (comparatively lower than broadcast spawning larvae, but higher than fragmentation), achieving very high levels of clonality over the same spatial scale and in the same patch reef environments where we observed M. capitata in Kāne'ohe Bay (Gorospe & Karl, 2013). P. acuta in the Philippines has been found to dominate reefs via asexual reproduction of ameiotic larvae, with clonality rates highest where there is less wave energy (Torres et al., 2020). However, other studies have found no evidence of localized populations being structured by asexual recruitment in Pocillopora damicornis regardless of habitat (Miller & Ayre, 2004). Lobactis scutaria (formerly Fungia scutaria) can form clones by budding and is often found in dense localized aggregations presumed to be largely derived from asexual reproduction (Lacks, 2000). Conversely, as a hermaphroditic broadcast spawner, M. capitata follows the dominant sexual strategy in scleractinia (Harrison, 2011), with rare self‐fertilization (Padilla‐Gamiño et al., 2011) and no known production of parthenogenetic larvae. In an environment like Kāne'ohe Bay, this effectively restricts asexual propagules to individual patch reefs, which are separated by deeper water. However, we did find three instances of colonies identified as the same genotype on separate patch reefs, all in block 2. Two of these instances were on neighbouring reefs separated by ~300 m (2_1 and 2_4), but the third comparison (2_3 and 2_4) is nearly 2 km apart. Other studies have also documented broadly distributed clones (Dimond et al., 2017) (although not at this scale), which could be the product of biological or human activity or natural physical action; however, we consider a sequencing error to be the most parsimonious explanation in this case, given the intervening depths between patch reefs.
Even within individual species, different patterns in clonality frequency have been observed across the species range, with some regions showing a higher prevalence of asexual recruitment that may be due to habitat differences (Adjeroud et al., 2014; Baums et al., 2006). In other ecosystems, clonality is expected to be more prevalent in stable habitats which favour selected, reduced genetic diversity, while habitats with more environmental variation or disturbance support more genetic diversity (see discussion in Miller & Ayre, 2004). In corals, this expectation may be complicated by the relationship between habitat stability and wave energy which is a major driver of the fragmentation mode of asexual reproduction. Coffroth and Lasker (1998) discussed expectations for fragmentation‐based coral reproduction across physical disturbance levels and concluded that clonality will be highest where there is enough periodic physical disruption to promote some breakage but not enough to prevent survival and attachment of new propagules.
4.4. Clonality patterns in Kāne'ohe Bay corals
Clonality is a frequently observed driver of SGS on coral reefs, but the degree of clonality varies widely from almost none in some species–site combinations to nearly 100% in others (Baums et al., 2006; Drury et al., 2019; Foster et al., 2013; Hunter, 1993; Manzello et al., 2019; Miller & Ayre, 2004). Previous work in Kāne'ohe Bay shows that clonality ranges from low (G:R > 0.95) (Locatelli & Drew, 2019) to moderate (G:R ~ 0.5) (Nishikawa et al., 2009) levels in M. capitata, despite the existence of substantial fragmentation potential (Jokiel et al., 1983) and high survival rates of fragments (Cox, 1992). Consistent with these studies, we found that clonality is a significant but not a prominent feature of the M. capitata population of Kāne'ohe Bay patch reefs. For sites where we detected clonality, there was a clear spatial correlation with clonemates positioned more closely to one another relative to nonclonal colonies, consistent with expectations that genetic dissimilarity increases with distance over small spatial scales when clones are included in SGS analysis (Gorospe & Karl, 2013).
Jokiel et al. (1983) examined Montipora verrucosa (presumed to be equivalent to what is presently identified as M. capitata) and Montipora dilatata, which is no longer common in Kāne'ohe Bay in the vicinity of our site 1_6. They observed that patches of M. dilatata were greatly reliant on asexual reproduction (100% of colonies were histocompatible) while M. verrucosa patches were dependent on sexual reproduction (only 5% histocompatible). These results highlight wide intrageneric variability in clonal structure and the potential role of morphology in SGS patterns. M. dilatata has a thin branching structure and can easily be broken, which contrasts with the typically more substantial branches or plates of M. capitata and may explain the relative differences between species.
While our results show increased clonality at sites that are subjected to more wave energy, corals were only sampled at patch reefs, which excludes habitats subjected to the highest levels of wave energy. Our sites with the most exposure to pelagic conditions were in block 5, adjacent to the northern channel (mean G:R 0.73). Hunter (1993) included exposed forereef sites outside Kāne'ohe Bay and observed a reduction in Porites compressa clonality there (G:R 0.87) and in more sheltered South Kaneohe Bay (SKB) sites (G:R 0.96) relative to North Kaneohe Bay (NKB) sites (G:R 0.64) where wave energy is intermediate. These observations are consistent with the predictions of Coffroth and Lasker (1998), indicating that some of the more exposed patch reefs in Kāne'ohe Bay may represent a favourable “Goldilocks” zone for M. capitata and P. compressa clonality.
Within a gradient of physical disturbance, substrate is also an important determinant of the outcomes of fragmentation (Coffroth & Lasker, 1998). In Kāne'ohe Bay, Nishikawa et al. (2009) noted that the sheltered site (SHEL; equivalent to our site 1_2) had many small unattached M. capitata colonies whereas the exposed site (EXPO; in the vicinity of our sites 2_1, 2_2, 2_4, 2_7 and 2_8) had mostly large attached colonies and that the ratio of genotypes to colonies was significantly lower for unattached versus attached colonies at SHEL, which is primarily sandy mud unconducive to fragment attachment. We found high genetic diversity at the equivalent sites (G:R for site 1_2 was 0.95 and mean G:R for sites at block 2 was 0.92); however, we did not include small unattached colonies in our sampling scheme. Inclusion of such colonies may have increased the level of clonality detected at sites with sufficient wave energy to fragment existing colonies, but insufficient hard substrate for them to establish themselves as fixed structures.
4.5. Adaptive implications of clonality
Clonality by fragmentation, budding or production of asexual planulae may be an adaptation to unfavourable environmental conditions (Foster et al., 2013). Fragmentation allows species and genets to persist when unable to sexually reproduce (Honnay & Bossuyt, 2005), enables well‐adapted genotypes to become locally dominant (Drury et al., 2019), and enables escape from some sources of size‐specific mortality by increasing the frequency and range of a genotype. Fragments are also likely to have a higher chance of survival than planulae because they surpass size‐specific mortality thresholds (Jackson, 1977) and may allow the colonization of areas on the reef not suitable for larval settlement (Highsmith, 1982). Furthermore, spawning in most corals is restricted to one or a few months (Richmond & Hunter, 1990), while fragmentation can happen year‐round. However, fragmentation limits the genetic diversity of populations not undergoing recombination during sexual reproduction and severe fragmentation can negatively impact corals due to the energetic cost of lesion recovery, higher chances of infection and decreased fecundity due to size reduction (Lirman, 2000; Lirman et al., 2010; Smith & Hughes, 1998; Zakai et al., 2000).
The adaptive value of asexual reproduction in corals may drive the evolution of fragmentation potential in some species (Highsmith, 1982). Particular patterns of three‐dimensionality (Lasker, 1984) and increased growth (“pruning vigour”) following fragmentation in some species (Lirman et al., 2010) have been proposed as adaptations to enhance asexual propagation, although this is difficult to evaluate experimentally and we found no indication of a genetic basis for the frequency of fragmentation (Figure 4c) in our survey. Corals that were documented to be part of a multicolony clone were distributed as expected in multivariate genetic space similarly to all other colonies in the site (some of which could also be clonal but were not sampled) indicating that no genetic variants relate to fragmentation. While genetic correlates with skeletal density and morphology may exist, our results support physical drivers of clonality because the genet:ramet ratio is lower (more clones) at sites with larger wave height, consistent with stochastic fragmentation.
Although clonality provides advantages to individual genets, high levels of genetic diversity within populations enhance ecosystem recovery after extreme events and are key for the longevity of those populations in a rapidly changing climate (Baums, 2008; Baums et al., 2019; Booy et al., 2000; DiBattista, 2008).
5. CONCLUSIONS
By investigating the spatial genetic structure of almost 600 colonies of M. capitata across 30 sites in Kāne'ohe Bay, we confirm high genetic diversity and show that clonality is rare and mostly restricted to habitats conducive to fragmentation by wave energy. We also show that nonclonal genetic relatedness across the bay is not correlated with distances among colonies, which indicates high levels of mixing and dispersal in sexually produced larvae. These results indicate a high potential for acclimation or adaptation of multiple genotypes to the environmental conditions present in the bay, rather than selection of a few more resilient ones. This is particularly relevant because the decline of coral reefs has led to an increased interest in coral restoration efforts worldwide (reviewed in Boström‐Einarsson et al., 2020). However, a major concern is that newly restored populations will have less genetic diversity than original populations due to few donor colonies or small or nonexistent genetic diversity among the donor colonies (Baums, 2008; Baums et al., 2019; Shearer et al., 2009), leading to genetic swamping or maladaptation. Incorporating metrics of genetic diversity in coral reef restoration efforts can provide valuable information when selecting coral colonies and provide perspective on natural reproductive and spatial dynamics. Future studies that incorporate clonality patterns and general spatial genetic structure as well as bleaching dynamics, symbiont diversity, and environmental variability will help elucidate the selective pressures reef‐building corals are undergoing and help predict responses to the environmental conditions expected with climate change.
AUTHOR CONTRIBUTIONS
LRJ, CC, MRDS and RG conceived the study. CC, MRDS, LRJ, DC, JH, CH, CH, VK, RK, CM, SM and CD collected data. CC, CD, CH and LRJ analysed data. CC, MRDS, LRJ and CD wrote the manuscript. CD, RG, JM and SM contributed funding and reagents. All authors edited the manuscript and approved the final version.
Supporting information
Figures S1–S4
Tables S1–S3
ACKNOWLEDGEMENTS
We thank Carly Kenkel and Sarah Davies for supplying barcode adapters and Rob Toonen and Misha Matz for discussions on library preparation and sequencing approaches. We thank James Dimond, Michael Hansen, Noah Rose and two anonymous reviewers for thorough and helpful comments on the manuscript. We thank the Gates Coral Laboratory and Coral Resilience Laboratory for assistance with field and laboratory work. CC, FD, MRDS and JH acknowledge the Paul G. Allen Family Foundation. MRDS acknowledges the American Association for University Women. LRJ is grateful for the financial support for travel provided by the Thinking Matters Fellowship at Stanford University. We dedicate this paper to our coauthor Ruth Gates who encouraged us to search for solutions to the coral reef crisis. Colonies were tagged and sampled under DAR Permit SAP 2018‐03 to HIMB. This is HIMB contribution 1898 and SOEST contribution 11550.
Caruso, C. , Rocha de Souza, M. , Ruiz‐Jones, L. , Conetta, D. , Hancock, J. , Hobbs, C. , Hobbs, C. , Kahkejian, V. , Kitchen, R. , Marin, C. , Monismith, S. , Madin, J. , Gates, R. , & Drury, C. (2022). Genetic patterns in Montipora capitata across an environmental mosaic in Kāne'ohe Bay, O'ahu, Hawai'i. Molecular Ecology, 31, 5201–5213. 10.1111/mec.16655
Carlo Caruso and Mariana Rocha de Souza contributed equally to this work.
Handling Editor: Michael M. Hansen
DATA AVAILABILITY STATEMENT
All data are available at github.com/druryc/mcap_clonality. Sequencing data are available at NCBI BioProject PRJNA 868322.
REFERENCES
- Adjeroud, M. , Guérécheau, A. , Vidal‐Dupiol, J. , Flot, J.‐F. , Arnaud‐Haond, S. , & Bonhomme, F. (2014). Genetic diversity, clonality and connectivity in the scleractinian coral Pocillopora damicornis: A multi‐scale analysis in an insular, fragmented reef system. Marine Biology, 161(3), 531–541. 10.1007/s00227-013-2355-9 [DOI] [Google Scholar]
- Bahr, K. D. , Jokiel, P. L. , & Toonen, R. J. (2015). The unnatural history of Kāne'ohe Bay: Coral reef resilience in the face of centuries of anthropogenic impacts. PeerJ, 3, e950. 10.7717/peerj.950 [DOI] [PMC free article] [PubMed] [Google Scholar]
- Barott, K. L. , Huffmyer, A. S. , Davidson, J. M. , Lenz, E. A. , Matsuda, S. B. , Hancock, J. R. , Innis, T. , Drury, C. , Putnam, H. M. , & Gates, R. D. (2021). Coral bleaching response is unaltered following acclimatization to reefs with distinct environmental conditions. Proceedings of the National Academy of Sciences of the United States of America, 118(22), e2025435118. 10.1073/pnas.2025435118 [DOI] [PMC free article] [PubMed] [Google Scholar]
- Baums, I. B. (2008). A restoration genetics guide for coral reef conservation. Molecular Ecology, 17(12), 2796–2811. 10.1111/j.1365-294X.2008.03787.x [DOI] [PubMed] [Google Scholar]
- Baums, I. B. , Baker, A. C. , Davies, S. W. , Grottoli, A. G. , Kenkel, C. D. , Kitchen, S. A. , Kuffner, I. B. , LaJeunesse, T. C. , Matz, M. V. , Miller, M. W. , Parkinson, J. E. , Shantz, A. A. , & Shantz, A. A. (2019). Considerations for maximizing the adaptive potential of restored coral populations in the western Atlantic. Ecological Applications, 29(8), e01978. 10.1002/eap.1978 [DOI] [PMC free article] [PubMed] [Google Scholar]
- Baums, I. B. , Miller, M. W. , & Hellberg, M. E. (2006). Geographic variation in clonal structure in a reef‐building Caribbean coral. Acropora palmata. Ecological Monographs, 76(4), 503–519. 10.1890/0012-9615(2006)076[0503:gvicsi]2.0.co;2 [DOI] [Google Scholar]
- Bay, R. A. , & Palumbi, S. R. (2014). Multilocus adaptation associated with heat resistance in reef‐building corals. Current Biology, 24(24), 2952–2956. 10.1016/j.cub.2014.10.044 [DOI] [PubMed] [Google Scholar]
- Bolger, A. M. , Lohse, M. , & Usadel, B. (2014). Trimmomatic: A flexible trimmer for Illumina sequence data. Bioinformatics, 30(15), 2114–2120. 10.1093/bioinformatics/btu170 [DOI] [PMC free article] [PubMed] [Google Scholar]
- Bongaerts, P. , Riginos, C. , Brunner, R. , Englebert, N. , Smith, S. R. , & Hoegh‐Guldberg, O. (2017). Deep reefs are not universal refuges: Reseeding potential varies among coral species. Science Advances, 3(2), e1602373. [DOI] [PMC free article] [PubMed] [Google Scholar]
- Booy, G. , Hendriks, R. J. J. , Smulders, M. J. M. , Groenendael, J. M. , & Vosman, B. (2000). Genetic diversity and the survival of populations. Plant Biology, 2(4), 379–395. 10.1055/s-2000-5958 [DOI] [Google Scholar]
- Boström‐Einarsson, L. , Babcock, R. C. , Bayraktarov, E. , Ceccarelli, D. , Cook, N. , Ferse, S. C. A. , Hancock, B. , Harrison, P. , Hein, M. , Shaver, E. , Smith, A. , Suggett, D. , Stewart‐Sinclair, P. J. , Vardi, T. , & McLeod, I. M. (2020). Coral restoration – A systematic review of current methods, successes, failures and future directions. PLoS One, 15(1), e0226631. 10.1371/journal.pone.0226631 [DOI] [PMC free article] [PubMed] [Google Scholar]
- Capblancq, T. , Luu, K. , Blum, M. G. B. , & Bazin, E. (2018). Evaluation of redundancy analysis to identify signatures of local adaptation. Molecular Ecology Resources, 18(6), 1223–1233. 10.1111/1755-0998.12906 [DOI] [PubMed] [Google Scholar]
- Coffroth, M. A. , & Lasker, H. R. (1998). Population structure of a clonal gorgonian coral: The interplay between clonal reproduction and disturbance. Evolution, 52(2), 379–393. 10.1111/j.1558-5646.1998.tb01639.x [DOI] [PubMed] [Google Scholar]
- Concepcion, G. T. , Baums, I. B. , & Toonen, R. J. (2014). Regional population structure of Montipora capitata across the Hawaiian Archipelago. Bulletin of Marine Science, 90(1), 257–275. 10.5343/bms.2012.1109 [DOI] [Google Scholar]
- Cooke, I. , Ying, H. , Forêt, S. , Bongaerts, P. , Strugnell, J. M. , Simakov, O. , Zhang, J. , Field, M. A. , Rodriguez‐Lanetty, M. , Bell, S. C. , Bourne, D. G. , van Oppen, M. J. , Ragan, M. A. , & Miller, D. J. (2020). Genomic signatures in the coral holobiont reveal host adaptations driven by Holocene climate change and reef specific symbionts. Science Advances, 6(48), 1–12. 10.1126/sciadv.abc6318 [DOI] [PMC free article] [PubMed] [Google Scholar]
- Cox, E. F. (1992). Fragmentation in the Hawaiian coral Montipora verrucosa . Proceedings of the 7th International Coral Reef Symposium, 1, 513–516. [Google Scholar]
- Cunning, R. , Ritson‐Williams, R. , & Gates, R. D. (2016). Patterns of bleaching and recovery of Montipora capitata in Kāne'ohe Bay, Hawai'i, USA. Marine Ecology Progress Series, 551, 131–139. 10.3354/meps11733 [DOI] [Google Scholar]
- De'ath, G. , Fabricius, K. E. , Sweatman, H. , & Puotinen, M. (2012). The 27‐year decline of coral cover on the Great Barrier Reef and its causes. Proceedings of the National Academy of Sciences of the United States of America, 109(44), 17995–17999. 10.1073/pnas.1208909109 [DOI] [PMC free article] [PubMed] [Google Scholar]
- DiBattista, J. (2008). Patterns of genetic variation in anthropogenically impacted populations. Conservation Genetics, 9(1), 141–156. 10.1007/s10592-007-9317-z [DOI] [Google Scholar]
- Dilworth, J. , Caruso, C. , Kahkejian, V. A. , Baker, A. C. , & Drury, C. (2021). Host genotype and stable differences in algal symbiont communities explain patterns of thermal stress response of Montipora capitata . Coral Reefs, 40(1), 151–163. 10.1007/s00338-020-02024-3 [DOI] [Google Scholar]
- Dimond, J. L. , Gamblewood, S. K. , & Roberts, S. B. (2017). Genetic and epigenetic insight into morphospecies in a reef coral. Molecular Ecology, 26(19), 5031–5042. 10.1111/mec.14252 [DOI] [PubMed] [Google Scholar]
- Dixon, G. B. , Davies, S. W. , Aglyamova, G. V. , Meyer, E. , Bay, L. K. , & Matz, M. V. (2015). Genomic determinants of coral heat tolerance across latitudes. Science, 348, 1460–1462. [DOI] [PubMed] [Google Scholar]
- Dixon, P. (2003). VEGAN, a package of R functions for community ecology. Journal of Vegetation Science, 14(6), 927–930. 10.1111/j.1654-1103.2003.tb02228.x [DOI] [Google Scholar]
- Donovan, M. K. , Burkepile, D. E. , Kratochwill, C. , Shlesinger, T. , Sully, S. , Oliver, T. A. , Hodgson, G. , Freiwald, J. , & van Woesik, R. (2021). Local conditions magnify coral loss after marine heatwaves. Science, 372(6545), 977–980. 10.1126/science.abd9464 [DOI] [PubMed] [Google Scholar]
- Dray, S. , & Dufour, A.‐B. (2007). The ade4 package: Implementing the duality diagram for ecologists. Journal of Statistical Software, 22(4), 1–20. [Google Scholar]
- Drupp, P. , De Carlo, E. H. , Mackenzie, F. T. , Bienfang, P. , & Sabine, C. L. (2011). Nutrient inputs, phytoplankton response, and CO2 variations in a semi‐enclosed subtropical embayment, Kaneohe Bay, Hawaii. Aquatic Geochemistry, 17(4), 473–498. 10.1007/s10498-010-9115-y [DOI] [Google Scholar]
- Drupp, P. S. , De Carlo, E. H. , Mackenzie, F. T. , Sabine, C. L. , Feely, R. A. , & Shamberger, K. E. (2013). Comparison of CO2 dynamics and air–sea gas exchange in differing tropical reef environments. Aquatic Geochemistry, 19(5), 371–397. 10.1007/s10498-013-9214-7 [DOI] [Google Scholar]
- Drury, C. , Bean, N. K. , Harris, C. I. , Hancock, J. R. , Huckeba, J. , Martin, H. C. , Roach, T. N. F. , Quinn, R. A. , & Gates, R, D. (2022). Intrapopulation adaptive variance supports thermal tolerance in a reef‐building coral. Communications Biology, 5(1), 486. 10.1038/s42003-022-03428-3 [DOI] [PMC free article] [PubMed] [Google Scholar]
- Drury, C. , Greer, J. B. , Baums, I. , Gintert, B. , & Lirman, D. (2019). Clonal diversity impacts coral cover in Acropora cervicornis thickets: Potential relationships between density, growth, and polymorphisms. Ecology and Evolution, 9(8), 4518–4531. 10.1002/ece3.5035 [DOI] [PMC free article] [PubMed] [Google Scholar]
- Drury, C. , & Lirman, D. (2021). Genotype by environment interactions in coral bleaching. Proceedings. Biological Sciences/The Royal Society, 288(1946), 20210177. 10.1098/rspb.2021.0177 [DOI] [PMC free article] [PubMed] [Google Scholar]
- Foster, N. L. , Baums, I. B. , & Mumby, P. J. (2007). Sexual vs. asexual reproduction in an ecosystem engineer: The massive coral Montastraea annularis . The Journal of Animal Ecology, 76(2), 384–391. 10.1111/j.1365-2656.2006.01207.x [DOI] [PubMed] [Google Scholar]
- Foster, N. L. , Baums, I. B. , Sanchez, J. A. , Paris, C. B. , Chollett, I. , Agudelo, C. L. , Vermeij, M. J. A. , & Mumby, P. J. (2013). Hurricane‐driven patterns of clonality in an ecosystem engineer: The Caribbean coral Montastraea annularis . PLoS One, 8(1), e53283. 10.1371/journal.pone.0053283 [DOI] [PMC free article] [PubMed] [Google Scholar]
- Gélin, P. , Fauvelot, C. , Mehn, V. , Bureau, S. , Rouzé, H. , & Magalon, H. (2017). Superclone expansion, long‐distance clonal dispersal and local genetic structuring in the coral Pocillopora damicornis type β in Reunion Island, South Western Indian Ocean. PloS One, 12(1), e0169692. 10.1371/journal.pone.0169692 [DOI] [PMC free article] [PubMed] [Google Scholar]
- Gorospe, K. D. , & Karl, S. A. (2013). Genetic relatedness does not retain spatial pattern across multiple spatial scales: Dispersal and colonization in the coral, Pocillopora damicornis . Molecular Ecology, 22(14), 3721–3736. 10.1111/mec.12335 [DOI] [PubMed] [Google Scholar]
- Guadayol, Ò. , Silbiger, N. J. , Donahue, M. J. , & Thomas, F. I. M. (2014). Patterns in temporal variability of temperature, oxygen and pH along an environmental gradient in a coral reef. PLoS One, 9(1), e85213. 10.1371/journal.pone.0085213 [DOI] [PMC free article] [PubMed] [Google Scholar]
- Harrison, P. L. (2011). Sexual reproduction of scleractinian corals. In Dubinsky Z. & Stambler N. (Eds.), Coral reefs: An ecosystem in transition (pp. 59–85). Springer Netherlands. [Google Scholar]
- Hawai'i Statewide GIS Program . (2017). Oceans and estuaries: Benthic habitat. State of Hawai'i Office of Planning and Sustainable Development. http://planning.hawaii.gov/gis/download‐gis‐data‐expanded [Google Scholar]
- Highsmith, R. C. (1982). Reproduction by fragmentation in corals. Marine Ecology Progress Series, 7, 207–226. 10.3354/meps007207 [DOI] [Google Scholar]
- Hoegh‐Guldberg, O. (1999). Climate change, coral bleaching and the future of the world's coral reefs. Marine and Freshwater Research, 50(8), 839–866. 10.1071/mf99078 [DOI] [Google Scholar]
- Honnay, O. , & Bossuyt, B. (2005). Prolonged clonal growth: Escape route or route to extinction? Oikos, 108(2), 427–432. 10.1111/j.0030-1299.2005.13569.x [DOI] [Google Scholar]
- Howells, E. J. , Berkelmans, R. , van Oppen, M. J. H. , Willis, B. L. , & Bay, L. K. (2013). Historical thermal regimes define limits to coral acclimatization. Ecology, 94(5), 1078–1088. [DOI] [PubMed] [Google Scholar]
- Hughes, T. P. , Kerry, J. T. , Álvarez‐Noriega, M. , Álvarez‐Romero, J. G. , Anderson, K. D. , Baird, A. H. , Babcock, R. C. , Beger, M. , Bellwood, D. R. , Berkelmans, R. , Bridge, T. C. , Butler, I. R. , Byrne, M. , Cantin, N. E. , Comeau, S. , Connolly, S. R. , Cumming, G. S. , Dalton, S. J. , Diaz‐Pulido, G. , … Wilson, S. K. (2017). Global warming and recurrent mass bleaching of corals. Nature, 543(7645), 373–377. 10.1038/nature21707 [DOI] [PubMed] [Google Scholar]
- Hunter, C. L. (1993). Genotypic variation and clonal structure in coral populations with different disturbance histories. Evolution, 47(4), 1213–1228. 10.1111/j.1558-5646.1993.tb02148.x [DOI] [PubMed] [Google Scholar]
- Innis, T. , Cunning, R. , Ritson‐Williams, R. , Wall, C. B. , & Gates, R. D. (2018). Coral color and depth drive symbiosis ecology of Montipora capitata in Kāne'ohe Bay, O'ahu, Hawai'i. Coral Reefs, 37(2), 423–430. [Google Scholar]
- Jackson, J. B. C. (1977). Competition on marine hard substrata: The adaptive significance of solitary and colonial strategies. The American Naturalist, 111(980), 743–767. 10.1086/283203 [DOI] [Google Scholar]
- Jin, Y. K. , Lundgren, P. , Lutz, A. , Raina, J.‐B. , Howells, E. J. , Paley, A. S. , Willis, B. L. , & van Oppen, M. J. H. (2016). Genetic markers for antioxidant capacity in a reef‐building coral. Science Advances, 2(5), e1500842. 10.1126/sciadv.1500842 [DOI] [PMC free article] [PubMed] [Google Scholar]
- Johnston, E. C. , Counsell, C. W. W. , Sale, T. L. , Burgess, S. C. , & Toonen, R. J. (2020). The legacy of stress: Coral bleaching impacts reproduction years later. Functional Ecology, 34(11), 2315–2325. 10.1111/1365-2435.13653 [DOI] [Google Scholar]
- Jokiel, P. L. , Hildemann, W. H. , & Bigger, C. H. (1983). Clonal population structure of two sympatric species of the reef coral Montipora . Bulletin of Marine Science, 33(1), 181–187. [Google Scholar]
- Korneliussen, T. S. , Albrechtsen, A. , & Nielsen, R. (2014). ANGSD: Analysis of next generation sequencing data. BMC Bioinformatics, 15, 356. 10.1186/s12859-014-0356-4 [DOI] [PMC free article] [PubMed] [Google Scholar]
- Koweek, D. A. , Dunbar, R. B. , Monismith, S. G. , Mucciarone, D. A. , Woodson, C. B. , & Samuel, L. (2015). High‐resolution physical and biogeochemical variability from a shallow back reef on Ofu, American Samoa: An end‐member perspective. Coral Reefs, 34(3), 979–991. 10.1007/s00338-015-1308-9 [DOI] [Google Scholar]
- Lacks, A. L. (2000). Reproductive ecology and distribution of the scleractinian coral Fungia scutaria in Kane‘ohe Bay, O'ahu, Hawai'i . Doctoral disseratation, University of Hawai'i, Honolulu. http://scholarspace.manoa.hawaii.edu/handle/10125/16333
- Langmead, B. , & Salzberg, S. L. (2012). Fast gapped‐read alignment with Bowtie 2. Nature Methods, 9(4), 357–359. 10.1038/nmeth.1923 [DOI] [PMC free article] [PubMed] [Google Scholar]
- Lasker, H. R. (1984). Asexual reproduction, fragmentation, and skeletal morphology of a plexaurid gorgonian. Marine Ecology Progress Series, 19, 261–268. 10.3354/meps019261 [DOI] [Google Scholar]
- Lirman, D. (2000). Fragmentation in the branching coral Acropora palmata (Lamarck): Growth, survivorship, and reproduction of colonies and fragments. Journal of Experimental Marine Biology and Ecology, 251(1), 41–57. 10.1016/s0022-0981(00)00205-7 [DOI] [PubMed] [Google Scholar]
- Lirman, D. , Thyberg, T. , Herlan, J. , Hill, C. , Young‐Lahiff, C. , Schopmeyer, S. , Huntington, B. , Santos, R. , & Drury, C. (2010). Propagation of the threatened staghorn coral Acropora cervicornis: Methods to minimize the impacts of fragment collection and maximize production. Coral Reefs, 29(3), 729–735. 10.1007/s00338-010-0621-6 [DOI] [Google Scholar]
- Locatelli, N. S. , & Drew, J. A. (2019). Population structure and clonal prevalence of scleractinian corals (Montipora capitata and Porites compressa) in Kaneohe Bay, Oahu. 2019.12.11.860585. 10.1101/2019.12.11.860585 [DOI]
- Lowe, R. J. , Falter, J. L. , Monismith, S. G. , & Atkinson, M. J. (2009a). A numerical study of circulation in a coastal reef‐lagoon system. Journal of Geophysical Research, 114(C6), 1–18. 10.1029/2008jc005081 [DOI] [Google Scholar]
- Lowe, R. J. , Falter, J. L. , Monismith, S. G. , & Atkinson, M. J. (2009b). Wave‐driven circulation of a coastal reef–lagoon system. Journal of Physical Oceanography, 39(4), 873–893. 10.1175/2008JPO3958.1 [DOI] [Google Scholar]
- Manzello, D. P. , Matz, M. V. , Enochs, I. C. , Valentino, L. , Carlton, R. D. , Kolodziej, G. , Serrano, X. , Towle, E. K. , & Jankulak, M. (2019). Role of host genetics and heat‐tolerant algal symbionts in sustaining populations of the endangered coral Orbicella faveolata in the Florida keys with ocean warming. Global Change Biology, 25(3), 1016–1031. 10.1111/gcb.14545 [DOI] [PubMed] [Google Scholar]
- Miller, K. J. , & Ayre, D. J. (2004). The role of sexual and asexual reproduction in structuring high latitude populations of the reef coral Pocillopora damicornis . Heredity, 92(6), 557–568. 10.1038/sj.hdy.6800459 [DOI] [PubMed] [Google Scholar]
- Mora‐Márquez, F. , García‐Olivares, V. , Emerson, B. C. , & López de Heredia, U. (2017). ddradseqtools: A software package for in silico simulation and testing of double‐digest RADseq experiments. Molecular Ecology Resources, 17(2), 230–246. 10.1111/1755-0998.12550 [DOI] [PubMed] [Google Scholar]
- Muthukrishnan, R. , & Fong, P. (2014). Multiple anthropogenic stressors exert complex, interactive effects on a coral reef community. Coral Reefs, 33(4), 911–921. 10.1007/s00338-014-1199-1 [DOI] [Google Scholar]
- Neilson, B. , Blogett, J. , Gewecke, C. , Stubbs, B. , & Tejchma, K. (2014). Kaneohe Bay, Oahu snap‐assessment report. University of Hawaii, Social Science Research Institute & State of Hawaii Department of Land and Natural Resources Division of Aquatic Resources. https://dlnr.hawaii.gov/ais/files/2014/06/KbaySnapAssessReportMay2014.pdf [Google Scholar]
- Nishikawa, A. , Kinzie, R. A. , & Sakai, K. (2009). Fragmentation and genotypic diversity of the scleractinian coral Montipora capitata in Kaneohe Bay, Hawaii. Journal of the Marine Biological Association of the United Kingdom, 89(1), 101–107. 10.1017/S0025315408002865 [DOI] [Google Scholar]
- Pacific Islands Fisheries Science Center . (2021). National Coral Reef Monitoring Program: Water temperature data from subsurface temperature recorders (STRs) deployed at coral reef sites in the Hawaiian archipelago from 2005 to 2019 . https://www.fisheries.noaa.gov/inport/item/37070; 10.7289/V5DJ5CXW
- Padilla‐Gamiño, J. L. , Weatherby, T. M. , Waller, R. G. , & Gates, R. D. (2011). Formation and structural organization of the egg–sperm bundle of the scleractinian coral Montipora capitata . Coral Reefs, 30(2), 371–380. 10.1007/s00338-010-0700-8 [DOI] [Google Scholar]
- Pandolfi, J. M. , Bradbury, R. H. , Sala, E. , Hughes, T. P. , Bjorndal, K. A. , Cooke, R. G. , McArdle, D. , McClenachan, L. , Newman, M. J. H. , Paredes, G. , Warner, R. R. , & Jackson, J. B. C. (2003). Global trajectories of the long‐term decline of coral reef ecosystems. Science, 301(5635), 955–958. 10.1126/science.1085706 [DOI] [PubMed] [Google Scholar]
- Peterson, B. K. , Weber, J. N. , Kay, E. H. , Fisher, H. S. , & Hoekstra, H. E. (2012). Double digest RADseq: An inexpensive method for de novo SNP discovery and genotyping in model and non‐model species. PLoS One, 7(5), e37135. 10.1371/journal.pone.0037135 [DOI] [PMC free article] [PubMed] [Google Scholar]
- QGIS Development Team . (2017). QGIS geographic information system. Open Source Geospatial Foundation Project. http://qgis.osgeo.org [Google Scholar]
- R Core Team . (2021). R: A language and environment for statistical computing. R Foundation for Statistical Computing. http://www.R‐project.org/ [Google Scholar]
- Richmond, R. H. , & Hunter, C. L. (1990). Reproduction and recruitment of corals: Comparisons among the Caribbean, the Tropical Pacific, and the Red Sea. Marine Ecology Progress Series, 60, 185–203. 10.3354/meps060185 [DOI] [Google Scholar]
- Ritson‐Williams, R. , & Gates, R. D. (2020). Coral community resilience to successive years of bleaching in Kāne'ohe Bay, Hawai'i. Coral Reefs, 39, 757–769. 10.1007/s00338-020-01944-4 [DOI] [Google Scholar]
- Selmoni, O. , Lecellier, G. , Magalon, H. , Vigliola, L. , Oury, N. , Benzoni, F. , Peignon, C. , Joost, S. , & Berteaux‐Lecellier, V. (2021). Seascape genomics reveals candidate molecular targets of heat stress adaptation in three coral species. Molecular Ecology, 30(8), 1892–1906. 10.1111/mec.15857 [DOI] [PMC free article] [PubMed] [Google Scholar]
- Selmoni, O. , Rochat, E. , Lecellier, G. , Berteaux‐Lecellier, V. , & Joost, S. (2020). Seascape genomics as a new tool to empower coral reef conservation strategies: An example on north‐western Pacific Acropora digitifera. Evolutionary Applications, 13(8), 1923–1938. 10.1111/eva.12944 [DOI] [PMC free article] [PubMed] [Google Scholar]
- Serrano, X. , Baums, I. B. , O'Reilly, K. , Smith, T. B. , Jones, R. J. , Shearer, T. L. , Nunes, F. L. , & Baker, A. C. (2014). Geographic differences in vertical connectivity in the Caribbean coral Montastraea cavernosa despite high levels of horizontal connectivity at shallow depths. Molecular Ecology, 23(17), 4226–4240. [DOI] [PubMed] [Google Scholar]
- Shamberger, K. E. F. , Feely, R. A. , Sabine, C. L. , Atkinson, M. J. , DeCarlo, E. H. , Mackenzie, F. T. , Drupp, P. S. , & Butterfield, D. A. (2011). Calcification and organic production on a Hawaiian coral reef. Marine Chemistry, 127(1), 64–75. 10.1016/j.marchem.2011.08.003 [DOI] [Google Scholar]
- Shearer, T. L. , Porto, I. , & Zubillaga, A. L. (2009). Restoration of coral populations in light of genetic diversity estimates. Coral Reefs, 28(3), 727–733. 10.1007/s00338-009-0520-x [DOI] [PMC free article] [PubMed] [Google Scholar]
- Shumaker, A. , Putnam, H. M. , Qiu, H. , Price, D. C. , Zelzion, E. , Harel, A. , Wagner, N. E. , Gates, R. D. , Yoon, H. S. , & Bhattacharya, D. (2019). Genome analysis of the rice coral Montipora capitata . Scientific Reports, 9(1), 2571. 10.1038/s41598-019-39274-3 [DOI] [PMC free article] [PubMed] [Google Scholar]
- Smith, L. D. , & Hughes, T. P. (1998). An experimental assessment of survival, re‐attachment and fecundity of coral fragments. Journal of Experimental Marine Biology and Ecology, 235, 147–164. [Google Scholar]
- Stekhoven, D. J. , & Bühlmann, P. (2011). MissForest—Nonparametric missing value imputation for mixed‐type data. Bioinformatics, 28(1), 112–118. 10.1093/bioinformatics/btr597 [DOI] [PubMed] [Google Scholar]
- Storlazzi, C. D. , Field, M. E. , & Bothner, M. H. (2011). The use (and misuse) of sediment traps in coral reef environments: Theory, observations, and suggested protocols. Coral Reefs, 30(1), 23–38. 10.1007/s00338-010-0705-3 [DOI] [Google Scholar]
- Sully, S. , Burkepile, D. E. , Donovan, M. K. , Hodgson, G. , & van Woesik, R. (2019). A global analysis of coral bleaching over the past two decades. Nature Communications, 10(1), 1264. 10.1038/s41467-019-09238-2 [DOI] [PMC free article] [PubMed] [Google Scholar]
- Tisthammer, K. H. , Forsman, Z. H. , Toonen, R. J. , & Richmond, R. H. (2020). Genetic structure is stronger across human‐impacted habitats than among islands in the coral Porites lobata . PeerJ, 8, e8550. 10.7717/peerj.8550 [DOI] [PMC free article] [PubMed] [Google Scholar]
- Torres, A. F. , Forsman, Z. H. , & Ravago‐Gotanco, R. (2020). Shifts in coral clonality along a gradient of disturbance: Insights on reproduction and dispersal of Pocillopora acuta . Marine Biology, 167(11), 161. 10.1007/s00227-020-03777-9 [DOI] [Google Scholar]
- Underwood, J. N. , Richards, Z. , Berry, O. , Oades, D. , Howard, A. , & Gilmour, J. P. (2020). Extreme seascape drives local recruitment and genetic divergence in brooding and spawning corals in remote north‐west Australia. Evolutionary Applications, 13(9), 2404–2421. 10.1111/eva.13033 [DOI] [PMC free article] [PubMed] [Google Scholar]
- van Oppen, M. J. H. , Gates, R. D. , Blackall, L. L. , Cantin, N. , Chakravarti, L. J. , Chan, W. Y. , Cormick, C. , Crean, A. , Damjanovic, K. , Epstein, H. , Harrison, P. L. , Jones, T. A. , Miller, M. , Pears, R. J. , Peplow, L. M. , Raftos, D. A. , Schaffelke, B. , Stewart, K. , Torda, G. , … Putnam, H. M. (2017). Shifting paradigms in restoration of the world's coral reefs. Global Change Biology, 23(9), 3437–3448. 10.1111/gcb.13647 [DOI] [PubMed] [Google Scholar]
- van Oppen, M. J. H. , & Lough, J. M. (2018). Synthesis. In van Oppen M. J. H. & Lough J. M. (Eds.), Coral bleaching: Patterns, processes, causes and consequences (pp. 343–348). Springer International Publishing. [Google Scholar]
- Wall, C. B. (2019). Environmental and biological effects on nutritional mode and resource partitioning in scleractinian corals . Doctoral dissertation, University of Hawai'i at Manoa. https://scholarspace.manoa.hawaii.edu/handle/10125/63446
- Wall, C. B. , Ritson‐Williams, R. , Popp, B. N. , & Gates, R. D. (2019). Spatial variation in the biochemical and isotopic composition of corals during bleaching and recovery. Limnology and Oceanography., 64, 2011–2028. 10.1002/lno.11166 [DOI] [PMC free article] [PubMed] [Google Scholar]
- Zakai, D. , Levy, O. , & Chadwick‐Furman, N. E. (2000). Experimental fragmentation reduces sexual reproductive output by the reef‐building coral Pocillopora damicornis . Coral Reefs, 19(2), 185–188. 10.1007/s003380000091 [DOI] [Google Scholar]
- Zvuloni, A. , Mokady, O. , Al‐Zibdah, M. , Bernardi, G. , Gaines, S. D. , & Abelson, A. (2008). Local scale genetic structure in coral populations: A signature of selection. Marine Pollution Bulletin, 56(3), 430–438. 10.1016/j.marpolbul.2007.11.002 [DOI] [PubMed] [Google Scholar]
Associated Data
This section collects any data citations, data availability statements, or supplementary materials included in this article.
Supplementary Materials
Figures S1–S4
Tables S1–S3
Data Availability Statement
All data are available at github.com/druryc/mcap_clonality. Sequencing data are available at NCBI BioProject PRJNA 868322.