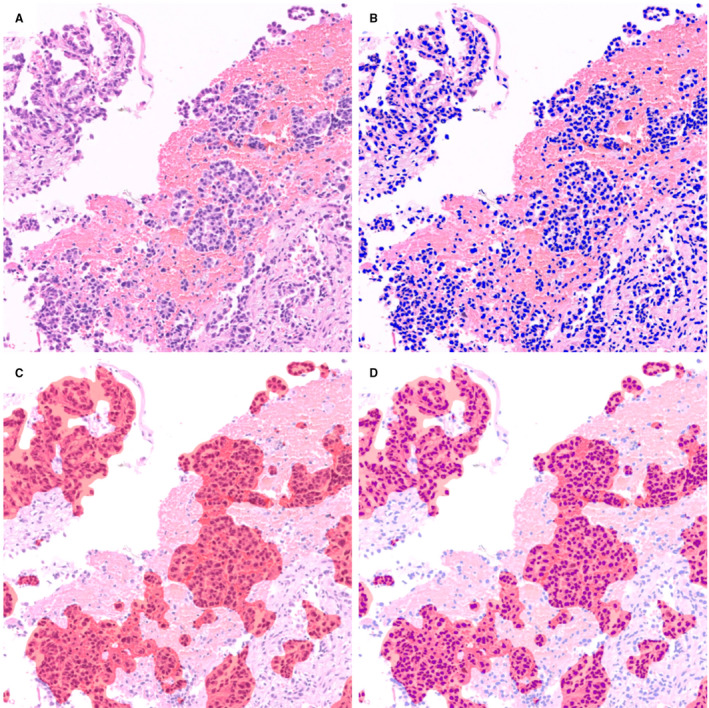
Figure 1.

Calculation of tumour cellularity using two algorithms. Original haematoxylin and eosin (H&E) image (A) was analysed using two distinct algorithms. Nuclei on the H&E image were masked as blue markers (B) and tumour clusters were segmented as red masking (C). Combining (B) with (C), the total number of nuclei (number of blue markers) and the number of tumour nuclei (number of blue markers within red mask) could be obtained (D), thus we can calculate the tumour cellularity of samples.
