

Abstract
Mixtures of n‐carboxylic acids (n‐CA) as derived from microbial conversion of waste biomass were converted to bio‐fuel using Kolbe electrolysis. While providing full carbon and electron balances, key parameters like electrolysis time, chain length of n‐CA, and pH were investigated for their influence on reaction efficiency. Electrolysis of n‐hexanoic acid showed the highest coulombic efficiency (CE) of 58.9±16.4 % (n=4) for liquid fuel production among individually tested n‐CA. Duration of the electrolysis was varied within a range of 0.27 to 1.02 faraday equivalents without loss of efficiency. Noteworthy, CE increased to around 70 % by hetero‐coupling when electrolysing n‐CA mixtures regardless of the applied pH. Thus, 1 L of fuel could be produced from 12.4 mol of n‐CA mixture using 5.02 kWh (<1 € L−1). Thus, a coupling with microbial processes producing n‐CA mixtures from different organic substrates and waste is more than promising.
Keywords: Bioeconomy, electrobiorefinery, electrochemistry, green chemistry, power-to-fuels
Converting mixtures is more profitable: Hetero‐coupling increases the electron efficiency of the electrochemical synthesis of alkanes from bio‐based n‐carboxylic acids up to 70 %, when electrolysing mixtures thereof. Thus, bio‐based drop‐in fuel is gained at 5.02 kWh L−1.

Introduction
In the endeavor of a sustainable and eco‐friendly economy, bio‐based resources have to replace fossil feedstock for the synthesis of chemicals and fuels. For establishing a circular and bio‐based economy, the sector of electric energy harvest and storage needs to be intimately interweaved into the chemical industry. Electrochemistry provides that connecting thread by enabling storage of electric energy in form of chemical energy carriers. Therefore, electro‐organic reactions like cathodic CO2 reduction[ 1 , 2 ] and hydrogenations/hydrodeoxygenations[ 3 , 4 ] as well as anodic coupling of biomolecules or decarboxylation[ 5 , 6 , 7 ] have to be brought to the spotlight. One specific reaction holding great promise for establishing electrobiorefineries [8] is the anodic decarboxylation of n‐carboxylic acids (n‐CA), also known as Kolbe electrolysis.
The Kolbe electrolysis, already discovered in the 19th century, [9] can be performed at ambient temperature and in aqueous solutions, making it environmentally friendly. Till now, mainly the Kolbe electrolysis of short‐chain n‐CA at low concentrations was studied.[ 9 , 10 ] For implementation in electrobiorefineries, highly concentrated n‐CA with a chain length between 4 and 8 C‐atoms, also called medium‐chain CA (MCCA), in alkaline aqueous solutions need to be electrolysed. [11] The MCCA in alkaline solutions are gained from the conversion of complex feedstock and waste by biological processes, for example using acid whey [12] or corn beer. [13] Using Kolbe electrolysis, MCCA can be converted into mixtures of alkanes (Kolbe products) or oxygenates like alcohols or esters (non‐Kolbe products) [14] via different reaction pathways leading to hydrocarbon mixtures (see Figure S1). For the electrolysis of different MCCA towards Kolbe products in aqueous solutions on monolithic platinum electrodes, a coulombic efficiency for the products (CEproduct) around 50 % and also a yield for the products (Y product) around 50 % was achieved in batch systems. [15] Also, electrodes coated with Pt nano‐particles showed good results of CEproduct between 45–65 % and Y product between 35–50 % using n‐octanoic acid as reactant.[ 16 , 17 ] The CEproduct was reported to be even increased up to 67 % and the Y product to 75 % when performing electrolysis in flow reactors. [18] In a previous study, we provided proof of principle for a whole process line for the production of a hydrocarbon mixture with fuel‐like properties starting from corn beer. [13] Biologically synthesized MCCA were used as starting material for the Kolbe electrolysis, achieving a CE of up to 80 % and a n‐CA conversion rate per electrode surface area of 2.1×10⁻³ mol cm−2 h−1. The total carbon efficiency (expressed in chemical oxygen demand equivalents) of the entire process line was 0.5 gfuel gcorn beer −1. [13]
To gain fuel‐like hydrocarbon mixtures in large quantities and also to exploit other feedstock [19] that can provide different MCCA mixtures using biological conversion, further electrochemical process engineering is required. Therefore, there is an imperative for assessing and engineering reactor components like the electrode material [20] as well as process parameters such as pH and supporting electrolyte. [21] Also, the monitoring of the products and not only the n‐CA degradation, defined as the amount of electrolytically converted acid, as well as providing energy and carbon balances are of utmost importance for bringing the Kolbe electrolysis to industrial scale. The MCCA produced via biological conversion of biomass usually have to be extracted from the fermentation broth using an organic or aqueous extraction solution. Thus, investigations of process parameters of Kolbe electrolysis can be performed in aqueous solutions using pure n‐CA. Thereby, also current‐controlled (galvanostatic) and not potential‐controlled operation is necessary to allow scale‐up as well as implementation into industrial processes.[ 22 , 23 , 24 ] Performing the Kolbe electrolysis directly in the fermentation broth would require intensive process engineering and development as well as investigations regarding, for example, possible inhibitors of the electrolysis stemming from the biological process step, side reactions with media components, or the influence of biomass.
This study describes the Kolbe electrolysis of single n‐CAs at high concentrations that are commonly gained from bioconversion using reactor microbiomes (n‐butanoic, n‐hexanoic, and n‐octanoic acid). The electrolysis of the mixture thereof was also performed since using mixtures is representative for scouting the implementation of a combined biological–electrochemical process. Thereby, the whole product spectrum was monitored and the influence of the pH on the CE is assessed. Here, it is important to mention that n‐CAs with a chain length longer than 4 C‐atoms are only limitedly soluble in aqueous solutions. Therefore, only neutral and alkaline pH were investigated, allowing also n‐hexanoic acid and n‐octanoic acid to be fully dissolved in the aqueous electrolyte. Additionally, the influence of the carbon chain length and pH on the formation of micelles, typically leading to electrode blocking, [25] was investigated. We show that high yield and selectivity, as well as high CE for the Kolbe electrolysis of different n‐CA being relevant products of the biological biomass conversion can be reached, especially by hetero‐coupling of the formed radicals when using n‐CA mixtures.
Results and Discussion
Influence of the degree of conversion
We previously performed Kolbe electrolysis of 0.5 m n‐hexanoic acid (C6) at 0.5 faraday equivalents (FE) yielding a CEdimer of around 50 %. [20] FE reflect the amount of charge required to convert a defined share of the substrate assuming 100 % efficiency and selectivity of the corresponding reaction. Thus, in the case of 0.5 FE the amount of charge that is necessary to convert 50 % of the substrate (here theoretically 52 mmol C6 and hence 5004 C for 200 mL solution) is used. In this study, using the same conditions, a comparable product spectrum and CEdimer was reached showing excellent reproducibility (see Figure S2). Further, it was of interest, if the CEdimer could be increased by decreasing or increasing the time of electrolysis, meaning using different FE (see Figure S3). This is of particular interest because a variable electrolysis time should allow easier linking of the chemical industry and the energy sector. As Figure S3 shows, the optimum for the electrolysis of C6 is reached with CEdimer=51.2±14.7 % at 0.43±0.02 FE that was therefore further used in this study. Thereby, the highest Y dimer of 76 %, reported by Sanderson et al. that was achieved for the electrolysis of 1.0 m C6 is comparable to the results for the optimized conditions presented here (Y dimer=68.6±18.6 %, see Table 1), especially when considering that a higher substrate concentration is favorable for the formation of the Kolbe product. [26] Remarkably, in the range of 0.3 to 1.0 FE the Kolbe electrolysis of C6 also possess a high CEdimer, whereas exceeding 1.0 FE leads to a drastic decrease, because of reaching the limiting n‐CA concentration (see Section S7).
Table 1.
Selectivity (S dimer) and yield (Y dimer) for the production of the Kolbe product (dimer) per converted n‐CA for C4, C6, and C8 as substrate as well as selectivity (S fuel) and yield (Y fuel) for the sum of fuel‐like compounds in the organic phase per converted n‐CA for an artificial n‐CA mixture as substrate. Carbon balance, CEfuel, and CEoverall for the electrolysis of the individual n‐CA and the artificial acid mixture.[a]
|
Substrate |
Carbon balance [%] |
Y dimer or Y fuel [%] |
S dimer or S fuel [%] |
CEfuel [%] |
CEoverall [%] |
|---|---|---|---|---|---|
|
n‐butanoic acid (n=3) |
42.1±24.5 |
11.3±7.5 |
14.4±3.7 |
– |
11.5±5.3 |
|
n‐hexanoic acid (n=4) |
83.4±15.2 |
68.6±18.6 |
68.4±4.9 |
58.9±16.4 |
73.2±15.9 |
|
n‐octanoic acid (n=3) |
29.0±9.7* (111.3±10.6) |
24.0±9.0* (92.0±10.4) |
69.9±5.4 |
25.4±3.3 |
35.1±5.5 |
|
mix, pH=7.07±0.25 (n=3) |
87.2±16.2 |
81.9±16.8 |
78.6±2.0 |
69.5±11.1 |
81.2±12.0 |
|
mix, pH=8.21±0.34 (n=3) |
86.1±3.7 |
80.1±4.7 |
78.5±1.9 |
67.5±2.2 |
80.3±1.2 |
[a] – indicates that no liquid organic phase was formed. n provides number of replicates and ± represents the 95 % confidence interval. Please note that values marked with * are not representative because of phase separation and low solubility of n‐CA, which lead to an overestimation of acid consumption in the aqueous phase. Consequently, values given in brackets are based on the acid consumption being calculated from CO2 and ester production (see Experimental Section: carbon balance, yield, selectivity, and rates of the electrolysis).
Kolbe electrolysis of individual n‐CA
The use of n‐CA with variable chain length obtained from biological processes is of great interest for its conversion into fuel‐like hydrocarbons using Kolbe electrolysis. Therefore, the optimized experimental conditions for the electrolysis of hexanoic acid (C6) were used as comparison point to study the Kolbe electrolysis of n‐butanoic (C4) and n‐octanoic acid (C8).
Figure 1 shows the results from the electrolysis of C4 and C8 compared to C6. Converting all three single acids via Kolbe electrolysis is possible, but there are limitations when using C4 or C8 as substrate. The electrolysis of only C4 shows a low CEacid degradation. This is strongly supported by the low CE of 9.1±5.1 %, as CE is directly linked to the conversion of n‐CA (Figure S1). As shown in Figure 1, no liquid organic compounds and only gaseous products including the volatile dimer derived from C4 (i. e., n‐hexane) were formed during electrolysis of C4. In addition to n‐hexane with CEdimer=3.0±1.9 %, only ΣProp (the sum of propane and propene) with CEΣProp=8.6±3.4 % and S ΣProp=85.5±3.6 % was produced during electrolysis of C4, resulting in a ratio between dimerization and disproportionation of 1 : 5.8, meaning disproportionation occurs about 6 times more frequently than dimerization for C4. This indicates a mechanism shift towards non‐Kolbe products under the applied conditions using C4 as substrate. Furthermore, the CE increased significantly, up to 31.0±14.3 % compared to C6 (CE =2.0±0.8 %, Figure 1). This shows that the main share of the electrons is used for the competitive reaction [i. e., the oxygen evolution reaction (OER)] and not to the electrolysis of n‐CA. The results for Kolbe electrolysis of C4 presented here are lower compared to literature values. Levy et al. could achieve a Y dimer of 20.5 %, and Lopez‐Ruiz et al. reported a CEacid degradation around 75 % with a carbon selectivity of 35.1 % for n‐hexane.[ 27 , 28 ] However, the experimental setup and conditions of both studies differ from the ones used here that are relevant for integration into electrobiorefinieries. Lopez‐Ruiz et al. performed the electrolysis potentiostatically at 5 V vs. Ag/AgCl, and Levy et al. used a flow‐through system with an n‐CA concentration of 1.4 m. This may explain the differences, as it is known that both potential and acid concentration are critical parameters and can have a major impact on the efficiency of the Kolbe electrolysis.
Figure 1.
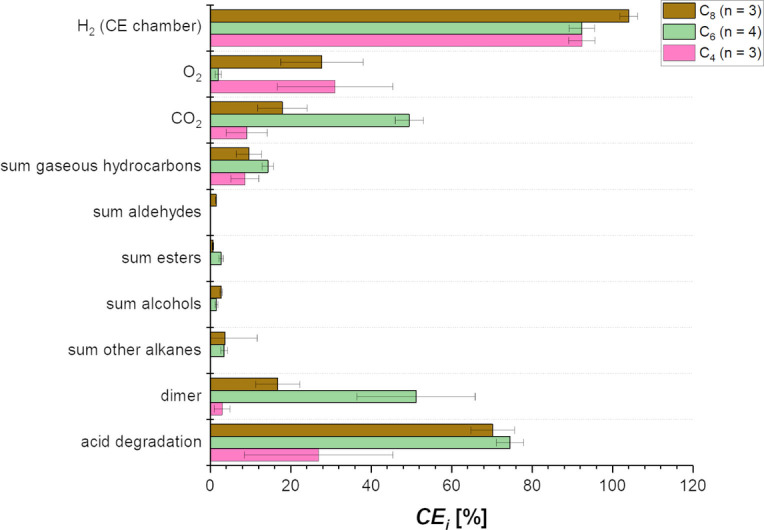
Kolbe electrolysis of 0.5 m n‐butanoic acid (C4), n‐hexanoic acid (C6), and n‐octanoic acid (C8) in a two‐chamber electrochemical cell with 150 mA cm−2 up to 0.45 FE at pH=7 (C4 and C6) or pH=8.6 (C8). CE i for substrate consumption and the formation of different products of the electrolysis are presented. The shown values are averages of the replicates (n) and the error bars represent the 95 % confidence interval. Note: The value for CEacid degradation of C8 is not representative because of phase separation caused by low solubility and agglomeration of the n‐CA, leading to an overestimation of acid consumption in the aqueous phase.
On the other hand, the use of C8 acid as substrate requires that the starting pH of the solution has to be increased, here from pH=7 to pH=8.6, because of foam formation during the electrolysis. This effect might be caused by the partly undissolved acid in combination with the formation of gases at the electrodes. In the electrolysis at pH=8.6, the dimer n‐tetradecane is the main product with CEdimer=16.81±5.48 % at S dimer of nearly 70 %. This shows that dimerization is the preferred reaction pathway using C8 as substrate, which can also be seen by the ratio between dimerization and disproportionation of 1:0.1. The CE for C8 (27.8±10.2 %) is comparable to that reached when using C4 as substrate. This implies that the OER is also not as successfully suppressed over the whole duration of the electrolysis of C8 as during electrolysis of C6 (Figure 2). This can be explained by the pH dependent behavior of C8 solutions. Having alkaline pH at the beginning of the experiment, C8 is fully soluble in the aqueous solution providing the octanoate anion as substrate for the Kolbe electrolysis. But already at neutral or slightly acidic pH, C8 starts to form agglomerates in aqueous solution at these concentrations. [25] This limits the availability of the octanoate anion at the electrode surface that is required for the Kolbe electrolysis. During electrolysis of C8 the pH of the anolyte decreases to 6.9, leading to agglomerate formation and inhibition of the Kolbe electrolysis, as well as a further increase in the OER at reaction times longer than 180 min (Figure 2). At that point, the OER is favored over the Kolbe electrolysis explaining the high CE for C8 as substrate. This agglomeration behavior of C8 is dependent on pH and concentration, which is shown in Figure S6. For a 0.5 m C8 solution the conductivity starts to drop at pH≈8, reaching the minimum conductivity at a pH range from 6.8 to 6.2. On the other hand, a 0.1 m solution shows no conductivity collapse. In comparison, neither 0.5 m C4 nor 0.5 m C6 are showing any conductivity collapse due to agglomeration during the conductometric titration (Figure S6). The results presented here for the Kolbe electrolysis of C8 are comparable to literature values. For a similar electrolyte composition and n‐CA concentration a CEacid degradation of 57±0.4 % could be achieved. [25] Yuan et al. reported a CEhydrocarbons around 65 % with an Y hydrocarbons around 50 % using electrodes coated with Pt nanoparticles. [16] Hydrocarbons in this respect are the sum of n‐tetradecane, n‐heptane, and n‐heptene, with n‐tetradecane and n‐heptane being produced in equal portions. Thus, the CEhydrocarbons and Y hydrocarbons are high, but the use of these kind of tailor‐made specialized electrode materials is not applicable for a technical process and comes with significantly higher costs than the electrodes used here. [20]
Figure 2.

Oxygen evolution over the duration of the electrolysis for different n‐CA in a two‐chamber electrochemical cell with 150 mA cm−2 up to 0.45 FE at pH=7 (C4 and C6) or pH=8.6 (C8). The shown values are averages of the replicates (n) and the error bars represent the 95 % confidence interval.
The interaction and coverage of the electrode surface with the respective n‐CA differs depending on the carbon chain length of the n‐CA (Figure 3). Thereby it is of note that the physical‐chemical properties are different for the here used concentrations in comparison to the ideal that is infinitely diluted aqueous solutions. For C4, the surface coverage with butanoate anions is relatively low in comparison to C6 and C8, as due to its lower hydrophobicity C4 has a higher solubility in the aqueous phase. This lower coverage of the electrode surface with butanoate anions results in their lower availability for the first oxidation step of the Kolbe electrolysis yielding the C3‐radical. Thus, insufficient radicals are formed closely enough to allow dimerization with high efficiency. This explains the low CEhexane=3.0±1.9 % for electrolysis of C4. In addition, the low hydrophobicity means that the formed radicals do not remain on the electrode surface, preventing the second oxidation step to non‐Kolbe products formed from the oxidation of the carbocation. Instead, the radicals disproportionate forming propane and propene which can be seen in the higher CEΣProp=8.6±3.4 %. The highest CE among the different single n‐CA is obtained with C4, which can also be seen in Figure 1. Due to the low hydrophobicity of C4, no hydrophobic layer forms on the electrode surface, which would prevent water electrolysis. Thus, water molecules reach the electrode surface and are oxidized, leading to a CE =31.0±14.3 %. This hypothesis is strongly supported by the measured contact angles at the electrode surface. The electrolyte solution without n‐CA shows a contact angle of θ=65.9±4.9°, indicating slight hydrophobicity of the electrode surface. If C4 is added to the solution, the contact angle increases even further to θ=72.1±1.9° (see Table S7). This shows that the hydrophilicity even increases, supporting that no hydrophobic layer consisting of butanoate anions forms on the electrode surface.
Figure 3.

Representation of the electrode surface–molecule interaction during the Kolbe electrolysis of different single n‐CA. (A) Kolbe electrolysis of n‐butanoic acid (C4). (B) Kolbe electrolysis of n‐hexanoic acid (C6). (C) Kolbe electrolysis of n‐octanoic acid (C8). The thickness of the arrows represents the dominating reaction pathways as discussed.
In the case of C6 as substrate for Kolbe electrolysis the coverage of the electrode with hexanoate anions can be considered high, leading also to a high concentration of radicals and therefore an efficient dimerization (CEdimer=51.2±14.7 %). Additionally, because of the higher hydrophobicity of C6 a hydrophobic layer is formed on the electrode surface which inhibits water oxidation nearly completely (CE =2.0±0.8 %), which can also be seen in Figure 1. This formation of a hydrophobic layer is strongly supported by the smaller contact angle of the electrolyte solution containing C6 (θ=48.7±1.0°, Table S7) at the electrode surface. Apparently, the fast dimerization also prevents disproportionation to shorter‐chain alkanes. Since the dimerization after the first oxidation step is the favored reaction pathway the CE i for non‐Kolbe products formed from the carbocation after the second oxidation step is low. Overall, this leads to a high Y dimer and S dimer (see Table 1).
Using C8 as substrate, the CEdimer of 16.8±5.5 % is lower than when using C6. For C8 as substrate for the Kolbe electrolysis the coverage of the electrode with octanoate anions can be expected to be at least as high as when using C6 (see Figure 3), which is also very much in line with the low contact angle of C8 electrolyte solution of θ=23.6±0.3°. This is even lower than for the solution containing C6 suggesting an even higher attraction of octanoate anions to the electrode surface. However, the overall kinetics seem to be lower leading to a lower concentration of C7‐radicals at the electrode surface and hence a less efficient dimerization. Further, this can be also explained by the larger molecule size of C8. As a result, the intermolecular distance of the C7‐radicals is increased, and hence dimerization is less efficient. Therefore, a higher portion of the radicals undergoes disproportionation. Also, with C8 as substrate a hydrophobic layer is formed on the electrode surface, which inhibits the OER in the beginning of the electrolysis. In line with the measured contact angle, a high attraction of octanoate to the electrode surface is expected. Therefore, a really dense hydrophobic layer can be assumed. This hypothesis is further supported by the increased cell potential (E cell) and working electrode potential (E WE) during the electrolysis of C8 compared to C4 or C6 (Figure S8). Due to the dense hydrophobic layer the internal resistance increases, leading to an increasing overpotential. However, with decreasing pH in the solution C8 starts to form agglomerates, and this hydrophobic layer detaches leading to an increasing oxygen evolution over time (see Figure 2).
Overall, it becomes clear that C6 seems the best‐suited single substrate for Kolbe electrolysis among the tested n‐CA. Portions of C8 in an expected n‐CA mixture can also be converted to a potential drop‐in fuel. However, the proportion should be kept sufficiently low to avoid agglomeration of C8 at higher concentrations. C4, on the other hand, can only be electrolysed with low efficiency, and hence no liquid organic phase forms that can be used as drop‐in fuel. Another important point to mention is the relative carbon loss due to decarboxylation during the Kolbe electrolysis (see Figure S1). For C4, 1 out of 4 C‐atoms and for C8, only 1 of 8 C‐atoms is lost as CO2, meaning that depending on the chain length the carbon loss ranges between 12.5 and 25 %.
Kolbe electrolysis of a n‐CA mixture
To achieve drop‐in fuel/ fuel additive production from biomass using an electrobiorefinery, Kolbe electrolysis of a mixture of n‐CA is necessary. Here a n‐CA mixture that resembles the solution gained by Xu et al. from a two‐stage microbial conversion of acid whey was used for the Kolbe electrolysis. [12] Additionally, the influence of the pH was investigated to decipher the impact of agglomeration that can be seen for C8 during single acid electrolysis. Thereby, the pH of 7 was chosen to compare the results of the electrolysis of the n‐CA mixture with the results of the single acids (see above). The used pH of 8.2 resembles a possible cost‐effective and direct combination with the extraction by pertraction as is described by Xu et al. [12]
It can be expected that intermolecular interactions between the different n‐CA may have a weakening effect on the agglomeration of C8 in a n‐CA mixture. This, however, is only the case to a limited extent as reflected by the contact angels of θ=25.1±5.1° and 35.5±11.1° for pH=7 and 8.2, respectively. For C4 these intermolecular interactions may improve the efficiency of the process, because the C3‐radical, formed from C4, can combine with radicals formed from other n‐CA leading to longer chain alkanes than n‐hexane, which are less volatile. [27]
Figure 4 shows a high CEacid degradation>80 % for both tested pHs. Thereby, in line with the relative molar concentrations the largest share is C6 conversion (CE ≈63 %), followed by the other two n‐CA with CE ≈11.5 % and CE ≈8 % (Figure 4B). As expected, compared to the single acid electrolysis the product spectrum was more diverse because of the greater variety of possible recombinations of the formed radicals. Not only homo‐coupling, meaning the recombination of two radicals of the same chain length, takes place but also hetero‐coupling. Homo‐coupling is the dominating reaction pathway for C6, meaning that two C5‐radicals form n‐decane. Since C6 shows the highest conversion, the highest CE i among the products is CEdecane with above 40 % for both pHs. Noteworthy, the CEdecane is lower than can be expected for only homo‐coupling of C6, which strongly suggests that n‐decane formation via recombination of C3‐radicals and C7‐radicals is very unlikely. Compared to the single acid electrolysis the CE for the homo‐coupled dimers from C4 and C8 decreases to CEhexane and CEtetradecane below 1 % at both pHs. Instead, the formed radicals from C4 and C8 performed preferably hetero‐coupling with the C5‐radical formed from C6. This leads to a high CE i for n‐octane with around 8 %, produced via combination of C5‐ and C3‐radicals, and n‐dodecane with around 10 %, gained via combination of C5‐ and C7‐radicals,. The CE i of all produced organic compounds in the liquid organic phase can be summed up because the combined organic phase is a very likely to serve as drop‐in fuel/fuel additive. In total, an excellent CEfuel=69.5±11.1 % for pH 7 and CEfuel=67.5±2.2 % for pH 8.2 was achieved. This is well above the CEfuel=58.9±16.4 % using only C6 as substrate. This shows that using a n‐CA mixture increases the efficiency of fuel production via Kolbe electrolysis compared to using single n‐CA. Also, the OER is successfully suppressed at both pHs using a n‐CA mixture as substrate, as CE was below 1 % for both cases (see Figure 4).
Figure 4.

Kolbe electrolysis of a 0.47 m artificial n‐CA mixture containing n‐butanoic acid (C4), n‐hexanoic acid (C6), and n‐octanoic acid (C8) in a molar ratio of 3 : 8 : 1 in a two‐chamber electrochemical cell with 150 mA cm−2 up to 0.45 FE at two different pH (pH=7 and 8.2). (A) CE i for total substrate consumption and the formation of different products of the electrolysis are presented. (B) CE i for the different n‐CA in total substrate consumption. A detailed product distribution is given in Figure S9. The shown values are averages of the replicates (n) and the error bars represent the 95 % confidence interval.
Additionally, the selectivity and yield for the production of the respective dimer were calculated (see Table 1). C6 shows the highest combination of yield and selectivity for dimer production with Y dimer=68.6±18.6 % and S dimer=68.4±4.9 % among the individually tested n‐CA. S dimer=69.9±5.4 % for C8 is comparable to that of C6. The Kolbe electrolysis of C4 shows only a low yield as well as a low selectivity for dimer formation. This confirms that C6 is the optimal substrate for Kolbe electrolysis among the individually tested n‐CA. Furthermore, Table 1 shows that the selectivity and yield for the sum of fuel‐like compounds, using a n‐CA mixture, resembling the composition gained by Xu et al. from a two‐stage microbial conversion of acid whey, [12] as substrate for the Kolbe electrolysis, is around 80 %. This demonstrates that most of the products are in the liquid organic phase that could be used as drop‐in fuel and only a minor share are present in the gas phase that may also serve as combustion fuel.
A schematic representation of the interaction and coverage of the electrode surface with carboxylic acid molecules as well as the selectivity for the different reaction pathways using a n‐CA mixture as substrate is shown in Figure 5. With a selectivity around 70 % dimerization is the preferred pathway. However, it has to be distinguished between homo‐ and hetero‐coupling. Homo‐coupling with S homo=49.7±1.1 % mainly takes place for C5‐radicals derived from C6 as already mentioned before. Thereby, 66.1 % of the converted C6 molecules undergo homo‐coupling of the C5‐radicals while only 8–10 % of the converted C4 and C8 result in homo‐coupled dimers of the resulting radicals. The C3‐radicals and C7‐radicals, on the other hand, preferably perform hetero‐coupling with C5‐radicals resulting in S hetero=21.7±0.9 %. Only about 7 % of converted C6 can be accounted for hetero‐coupled products, but between 24–26 % of the converted C4 and C8. With a similar selectivity to hetero‐coupling also disproportionation takes place, mainly for C4 and C6. The least likely pathway is the 2nd oxidation step to a carbocation, which produces non‐Kolbe products like esters and alcohols. This has only a selectivity of around 10 %. Here, it is important to stress that biological conversions of bio‐based feedstock yield mixtures of n‐CA and usually not solutions containing single acids. This diversity of substrate can be detrimental for other chemical conversions. This is not the case here. Even further, using a n‐CA mixture as substrate for the Kolbe electrolysis can overcome the drawbacks of the electrolysis of individual n‐CA, which as single acids did not form any liquid organic products or show agglomeration, and is therefore a highly elegant way to produce bio‐based fuel.
Figure 5.

(A) Representation of the electrode surface–molecule interaction with the thickness of the arrows representing the dominating reaction pathways and the selectivity, Si , for the different reaction pathways. (B) Achieved product selectivity during the Kolbe electrolysis of a n‐CA mixture. The shown values are averages of the replicates (n=6, Mix pH 7 and Mix pH 8.2) and the error bars represent the 95 % confidence interval.
In addition, the operational expenditures (OPEX) of a process similar to our previous study by Urban et al. without the need of down‐streaming and demonstrating the comparable fuel‐like properties of the gained product including a higher heating value of around 46 MJ kg−1[13] were analysed (see Section S13). The used n‐CA mixture serves as model for a real n‐CA mixture (MCCA mixture) derived from bio‐based feedstock or even waste via a biological conversion. [12] Then, the production costs of fuel additives via Kolbe electrolysis can be simplified as follows: Per conversion of 1 mol of n‐CA (average for the mixture) from the mixture 80.4 mL of liquid fuel mixture are produced. In order to obtain 1 L fuel, 12.4 mol of n‐CA have to be converted using 5.02 kWh (see Table S8). Considering the electric energy price, this results in OPEX of 0.53 € (0.59 $) per produced liter of fuel mixture. Although this calculation does not consider agitation costs and other costs for drive peripherals, it conveys one important key message: the costs of fuel produced via Kolbe electrolysis can compete with the costs for traditional petroleum‐based fuel and, in addition, governmental funding for the development and expansion of such processes is desirable. [29]
Conclusion
Using a n‐carboxylic acids mixture as substrate for Kolbe electrolysis results in improved yields of liquid fuels by hetero‐coupling of the derived radicals. A CEfuel of nearly 70 % for the n‐CA mixture was demonstrated to be 10 % higher than CEfuel when using only C6, which is the most suitable single n‐CA. Thereby, the radicals formed from C4 and C8 mainly undergo hetero‐coupling with a selectivity of 21.7±0.9 %, while the radicals of C6 mainly homo‐couple (Shomo=49.7±1.1 %). This performance, jointly with the economic consideration showing an operational expenditure of less than 1 € L−1, demonstrates that n‐CA mixtures can be successfully used for the production of drop‐in fuel via Kolbe electrolysis. Further, we shed light on influencing parameters for an efficient formation of Kolbe products that strongly depends on the chain length and the concentration of the n‐CA in the aqueous reaction solution. There is a delicate balance between the need for the formation of a hydrophobic layer on the electrode surface as well as the need of relative proximity of the formed radicals at the electrode.
Specifically, the Kolbe electrolysis enables the upgrading of n‐CA mixtures, originated from microbial conversions of a variety of substrates such as corn beer, [13] acid whey, [12] or other organic waste streams[ 30 , 31 , 32 ] to fuels or fuel additives. In general, the combination of microbial and electrochemical conversion in electrobiorefineries offers the potential to make an important contribution to a circular and bio‐based but also viable economy.
Experimental Section
General remarks
All chemicals were of at least analytical grade if not stated otherwise. All solutions were prepared with deionized water (Milli‐Q IQ 7000, Merck KgaA, Darmstadt, Germany). A list of all used symbols and abbreviations as well as details to chemicals and applied analytical methods can be found in the Supporting Information.
Experimental setup
Electrochemical conversion of n‐butanoic (C4), n‐hexanoic (C6), and n‐octanoic acid (C8) by Kolbe electrolysis, as well as acidification after the electrolysis, were performed in a three‐neck 250 mL flask (Schott AG, Mainz, Germany) already described in detail in our previous study. [20] Briefly, the flask was equipped with the working electrode (WE), the counter electrode (CE, 18 mm distance to WE) with a CE chamber, the reference electrode (RE), two needle ports, a pH electrode, and a conductivity electrode. The whole setup was fabricated gas tight, except the two needle ports for gas inlet and gas outlet.
All experiments were carried out under galvanostatic conditions by a DC power source (2230‐30‐1 triple Channel DC Power Supply, Keithley/Tektronix GmbH, Köln, Germany) using a three‐electrode setup consisting of a platinized titanium WE (Umicore, Schwaebisch Gmuend, Germany) with a geometric surface area of 2 cm2, an Ag/AgCl sat. KCl reference electrode (SE 11, Xylem Analytics Germany Sales GmbH & Co. KG/Sensortechnik Meinsberg, Waldheim, Germany), and a CE (Platinum foil, 1×1.2 cm, Goodfellow, Huntingdon, UK). The DC power supply was connected to the WE serving as anode and the CE serving as cathode. The cell potential (E cell) between WE and CE was measured using the DC power supply. The anode potential was measured relative to the RE with an additional multimeter (Autoranging Mini MultiMeter MN16, Extech Instruments, Nashua, USA). The system was operated in two‐chamber configuration with the cathode chamber separated via a custom‐made glass tube interfaced via an ion exchange membrane (fumasep FKS‐PET‐130, FUMATECH BWT GmbH, Bietigheim‐Bissingen, Germany). The working volume of the anode chamber was 200 mL and that of the cathode chamber was 9 mL.
The aqueous n‐CA solution in the anode chamber was purged with nitrogen for at least 15 min before each electrolysis. For all connections gas‐tight Tygon tubes (Saint‐Gobain, Charny, France) were used. The pH, temperature, and conductivity were measured continuously during the experiment using a SevenExcellence S470 (Mettler‐Toledo, Greifensee, Switzerland) with an InLab Micro Pro pH electrode and an InLab 710 conductivity electrode (both Mettler‐Toledo, Greifensee, Switzerland). Both electrodes were calibrated with commercial buffer solutions (Mettler‐Toledo, Greifensee, Switzerland) directly before each experiment. After each electrolysis the anode was cleaned with acetone and afterwards rinsed with water. All other inlet parts of the setup were also cleaned with water.
Kolbe electrolysis
500 mL aqueous n‐CA solution for the anode chamber was prepared as described in our previous study. [20] Briefly, for all electrolysis experiments a 0.5 m n‐CA solution was prepared by adding the corresponding amount of n‐CA into a flask with water. Afterwards Na2SO4 was added up to 0.25 m. Finally, the pH for C4 and C6 was adjusted to pH=7 and for C8 due to solubility reasons to pH=8.6 by adding NaOH pellets or H2SO4 (3 m or 50 %). For the electrolysis of the n‐CA mixture, the acids were added in a molar ratio of 3 : 8 : 1 (C4/C6/C8) to result in an overall acid concentration of 0.47 m. The pH of the solution was adjusted to pH=7 or pH=8.2 using NaOH pellets and H2SO4 (3 m or 50 %). The solution for the cathode chamber was prepared to a similar pH and conductivity as the used n‐CA solution by adding NaOH pellets and Na2SO4 to water.
200 mL of the n‐CA solution was used for the electrolysis and 100 mL as blank solution (200 mL remained unused). The 200 mL for the electrolysis were filled into the electrochemical reactor described above and the reactor was weighed. Thereafter, the cathode chamber was filled with 9 mL of the cathode chamber solution and the complete experimental setup was assembled. The gas outlet was connected to a N2‐mass flow meter/controller (MFM; LOW‐ΔP‐FLOW F‐101D, 60 mLn min−1, Bronkhorst High‐Tech B.V., Ruurlo, Netherlands) controlled via a Flow‐Bus (Bronkhorst High‐Tech B.V., Ruurlo, Netherlands) with a microGC (3000 Micro GC, INFICON, Cologne, Germany) in by‐pass in order to determine the composition and the volume of the produced gas. The electrolysis was carried out for different times reaching FE of 0.27±0.002, 0.43±0.02, 0.75±0.04, 1.02±0.01 and 2.05±0.10 with a constant current density of 150 mA cm−2 at room temperature (Ø=23.7 °C) and 1000 rpm stirring. The average temperature of the anolyte at the end of the electrolysis was 32.9 °C (C4, C6, n‐CA mixture) or 36.1 °C (C8).
After the electrolysis, the system was kept gas tight and the stirring was stopped to allow phase separation between the aqueous electrolyte solution and the formed organic products. First, 0.6 mL of the aqueous solution was taken and discarded as dead volume of the needle. Afterwards, a 1 mL sample for high‐performance liquid chromatography (HPLC) analysis was taken from the aqueous phase of the reactor. The N2‐mass flow meter/controller was changed to a CO2‐mass flow meter/controller (EL‐FLOW Select F‐201CV, 500 mLn min−1, Bronkhorst High‐Tech B.V., Ruurlo, Netherlands) and the stirring was turned on again. Through the needle port 50 % H2SO4 was added to the anode chamber to adjust the solution to pH=2. Thereby, the CO2 dissolved in the anolyte was gassed out and its volume was measured in order to calculate the carbon balance. Here, it is important to mention that due to the combined gas phase of anode and cathode chamber partially CO2 was also dissolved in the (highly) alkaline catholyte but not quantified by the aforementioned approach. This leads in general to an underestimation of the formed CO2.
GC–MS for quantification of liquid organic electrolysis products
To quantify the amount of reaction products in the liquid organic phase, first the reaction mixture as well as the blank solution (pH=2) were left to settle for at least 2 h in a separating funnel for phase separation. 15 mL of n‐hexane was added to the blank to enhance phase separation. Both phases (aqueous and organic) were separately collected into flasks. 5 mL of n‐hexane was used to rinse the separating funnel of the blank and was added to the organic phase. The weight of both phases was determined. The density of the phases was determined by weighing 1 mL. Samples from the organic phase were prepared for analysis by in parallel diluting aliquots in n‐hexane and dichloromethane. Dilutions of 1 : 10, 1 : 100, and 1 : 1000 were analysed. The aqueous phase was analysed via HPLC.
Both dilutions series of the organic phase were analysed via gas chromatography–mass spectrometry (GC–MS) (GC 7890A and MSD 5975C InertXL, Agilent, Santa Clara, USA), using a DB‐FATWAX capillary column (30 m ×250 μm ×0.25 μm, Agilent, Santa Clara, USA) with helium as carrier gas and undecanoic acid methyl ester as internal standard for the organic phase. The initial temperature was 50 °C (held for 2 min) and it was increased to 250 °C with a temperature ramp of 15 K min−1. n‐CA, n‐alkanes, alcohols, and esters were identified using retention times and mass spectra of pure reference compounds. n‐CA (C4–C10, 4 levels), n‐alkanes (C5–C7 and C8–C18, each 4 levels), alcohols (C3–C8, 3 levels), and some esters (C10–C11, 3 levels) were quantified using external standards. The concentration of esters that were not calibrated (being a very minor share) was estimated using an average response factor of all calibrated esters.
HPLC for quantification of n‐CA
Samples from the blank solution and after the electrolysis (before acidification) were subjected to HPLC analysis. Furthermore, the aqueous phase after phase separation from the electrolysed solution as well as from the blank solution was analysed by HPLC. Samples were diluted in water to 1 : 5 or 1 : 20 depending on the expected acid concentration. All samples containing C4 were adjusted to pH=2. Samples of pure C8‐electrolysis were adjusted to pH=12.
HPLC analysis was performed at 208 nm with the gradient shown in Table S3 with a constant flow of 0.8 mL min−1. Measurements were carried out at room temperature for 30 min. Between each sample the column was re‐equilibrated for 5 min to the starting measurement conditions. n‐CA were identified using retention times of pure reference compounds and quantified with external standards. Thus, an 8‐point calibration in the range 0.1–5 mg mL−1 was performed based on a mixture of n‐CA with a chain length ranging from C2 to C10.
Gas phase analysis
During electrolysis the gas composition was monitored with a four‐channel microGC equipped with a thermal conductivity detector, which was calibrated to analyse the experimental gas profile (see Table S4). Details on the method can be found in Table S5. Measurements were carried out at the beginning of the electrolysis (t 0) and every 10 min during the first 90 min of the experiment. During the remaining time of the experiment the gas composition was measured every 30 min.
From the mass flow controller, the measured volume [mL] was gained and the mole fraction y i of each individual gas component i [%] was obtained from the microGC‐TCD (thermal conductivity detector) measurement.
Data processing and calculations
Quantification of gas components: For quantification of individual components in gas mixtures data from the MFM and the microGC‐TCD measurements were combined. This allowed to calculate the absolute amount of each gaseous component that was produced during electrolysis. All gas phase calculations were based on our method paper by Neubert et al. [33]
Coulombic efficiencies: The CE for each component i, CE i , for electrochemical n‐CA decarboxylation and the formation of different products (Table S1), was derived from the charge Qi calculated for each reaction in relation to the total charge (Q total) measured during electrolysis according to Equation (1). Qi was calculated from the consumed or produced amount of substance ni within the electrolysis solution (the volume was assumed to be constant):
| (1) |
with Qi determined according to Equation 2:
| (2) |
Where ni is the amount of each substance in mol, zi is the number of transferred electrons per molecule (see Table S1), and F=96.485 C mol−1 is the Faraday constant. For n‐CA, ni equals the difference of the amount of n‐CA before and after electrolysis determined via HPLC.
Q total can be derived from the integrated current (i) that was set over time [Eq. 3]:
| (3) |
Additionally, the CEfuel of the electrolysis was calculated according to Equation (4) from the sum of Q i of all fuel‐like compounds (alkanes, esters, and alcohols in the liquid organic phase):
| (4) |
Similarly, CEoverall of the electrolysis was calculated from the sum of Qi of all organic products in the liquid and gaseous phase (excluding H2, CO2, and O2).
Carbon balance, yield, selectivity, and rates of the electrolysis: The carbon balance for the electrolysis was calculated as the ratio of the molar amount of carbon that was found in all formed products ( ) and the molar amount of carbon that was consumed from the substrate (n C,CA), as depicted in Equation (5). The consumed amount of carbon from the n‐CA equals the difference of n‐CA before and after electrolysis determined via HPLC.
| (5) |
The yield of the dimerization product, Y dimer, was determined according to Equation (6) as ratio of the amount of formed dimer and the amount of consumed CA.
| (6) |
For n‐octanoic acid (C8) a corrected carbon balance and Y dimer are calculated due to its limited homogeneous solubility. For the corrected values Δn CA equals the sum of produced CO2 and all esters since for each acid molecule converted one molecule of CO2 is cleaved off and for ester production also an additional (unconverted) acid is required.
In order to assess the selectivity of the dimerization pathway of the electrolysis, S dimer, the molar amount of n‐CA was related to the amount of all products formed (excluding CO2, H2, and O2), as shown in Equation 7:
| (7) |
Statistical analysis
All experiments were done in at least three independent replicates (n≥3). In this regard independent replicates means that the n‐CA solution, the following electrolysis of the solution, and finally the sample preparation was performed fully independent for each single replicate. All values are given as the mean ± confidence interval (CI, α=0.05) if not stated otherwise.
Conflict of interest
The authors declare no conflict of interest.
1.
Supporting information
As a service to our authors and readers, this journal provides supporting information supplied by the authors. Such materials are peer reviewed and may be re‐organized for online delivery, but are not copy‐edited or typeset. Technical support issues arising from supporting information (other than missing files) should be addressed to the authors.
Supporting Information
Acknowledgements
We thank Jana Reichenbach and Lukas Y. Wick for support with the contact angle measurements. This research is financed by the German Federal Ministry of Education and Research (BMBF) under the VIP+‐project MolkeKraft: Microbial‐electrochemical exploitation of sour whey for the production of drop‐in aviation fuel (Funding code: 03VP06911). The responsibility for the content lies with the authors. This work was supported by the Helmholtz‐Association in the frame of the Integration Platform “Tapping nature's potential for sustainable production and a healthy environment” at the UFZ. Open Access funding enabled and organized by Projekt DEAL.
K. Neubert, M. Hell, M. Chávez Morejón, F. Harnisch, ChemSusChem 2022, 15, e202201426.
Data Availability Statement
The data that support the findings of this study are available in the supplementary material of this article.
References
- 1. Hegner R., Neubert K., Rosa L. F. M., Harnisch F., ChemElectroChem 2019, 6, 3731–3735. [Google Scholar]
- 2. Hori Y., Wakebe H., Tsukamoto T., Koga O., Electrochim. Acta 1994, 39, 1833–1839. [Google Scholar]
- 3. Harnisch F., Morejón M. C., Chem. Rec. 2021, 21, 2277–2289. [DOI] [PubMed] [Google Scholar]
- 4. Matthiesen J. E., Carraher J. M., Vasiliu M., Dixon D. A., Tessonnier J. P., ACS Sustainable Chem. Eng. 2016, 4, 3575–3585. [Google Scholar]
- 5. Schäfer H. J., in Top. Curr. Chem. Vol. 152, Electrochem. IV (Ed.: Steckhan E.), Springer, Berlin, Heidelberg, 1990, pp. 91–151. [Google Scholar]
- 6. Zhang B., Gao Y., Hioki Y., Oderinde M. S., Qiao J. X., Rodriguez K. X., Zhang H.-J., Kawamata Y., Baran P. S., Nature 2022, 606, 313–318. [DOI] [PMC free article] [PubMed] [Google Scholar]
- 7. Kirste A., Elsler B., Schnakenburg G., Waldvogel S. R., J. Am. Chem. Soc. 2012, 134, 3571–3576. [DOI] [PubMed] [Google Scholar]
- 8. Harnisch F., Urban C., Angew. Chem. Int. Ed. 2018, 57, 10016–10023; [DOI] [PubMed] [Google Scholar]; Angew. Chem. 2018, 130, 10168–10175. [Google Scholar]
- 9. Faraday M., Ann. Phys. 1834, 109, 433–451. [Google Scholar]
- 10. Kolbe H., Justus Liebigs Ann. Chem. 1849, 69, 257–294. [Google Scholar]
- 11. Harnisch F., Schröder U., ChemElectroChem 2019, 6, 4126–4133. [Google Scholar]
- 12. Xu J., Hao J., Guzman J. J. L., Spirito C. M., Harroff L. A., Angenent L. T., Joule 2018, 2, 280–295. [Google Scholar]
- 13. Urban C., Xu J., Sträuber H., Dos Santos Dantas T. R., Mühlenberg J., Härtig C., Angenent L. T., Harnisch F., Energy Environ. Sci. 2017, 10, 2231–2244. [Google Scholar]
- 14. Meyers J., Mensah J. B., Holzhäuser F. J., Omari A., Blesken C. C., Tiso T., Palkovits S., Blank L. M., Pischinger S., Palkovits R., Energy Environ. Sci. 2019, 12, 2406–2411. [Google Scholar]
- 15. Holzhäuser F. J., Mensah J. B., Palkovits R., Green Chem. 2020, 22, 286–301, https://pubs.rsc.org/en/content/articlehtml/2020/gc/c9gc03264a [Google Scholar]
- 16. Yuan G., Wang L., Zhang X., Luque R., Wang Q., ACS Sustainable Chem. Eng. 2019, 7, 18061–18066. [Google Scholar]
- 17. Yuan G., Wu C., Zeng G., Niu X., Shen G., Wang L., Zhang X., Luque R., Wang Q., ChemCatChem 2020, 12, 642–648. [Google Scholar]
- 18. Kurig N., Meyers J., Holzhäuser F. J., Palkovits S., Palkovits R., ACS Sustainable Chem. Eng. 2021, 9, 1229–1234. [Google Scholar]
- 19. Khor W. C., Andersen S., Vervaeren H., Rabaey K., Biotechnol. Biofuels 2017, 10, https://biotechnologyforbiofuels.biomedcentral.com/articles/10.1186/s13068-017-0863-4. [DOI] [PMC free article] [PubMed] [Google Scholar]
- 20. Neubert K., Schmidt M., Harnisch F., ChemSusChem 2021, 14, 3097–3109. [DOI] [PMC free article] [PubMed] [Google Scholar]
- 21. Stang C., Harnisch F., ChemSusChem 2016, 9, 50–60. [DOI] [PubMed] [Google Scholar]
- 22. Wiebe A., Gieshoff T., Möhle S., Rodrigo E., Zirbes M., Waldvogel S. R., Angew. Chem. Int. Ed. 2018, 57, 5594–5619; [DOI] [PMC free article] [PubMed] [Google Scholar]; Angew. Chem. 2018, 130, 5694–5721. [Google Scholar]
- 23. Möhle S., Zirbes M., Rodrigo E., Gieshoff T., Wiebe A., Waldvogel S. R., Angew. Chem. Int. Ed. 2018, 57, 6018–6041; [DOI] [PMC free article] [PubMed] [Google Scholar]; Angew. Chem. 2018, 130, 6124–6149. [Google Scholar]
- 24. Yan M., Kawamata Y., Baran P. S., Angew. Chem. Int. Ed. 2018, 57, 4149–4155; [DOI] [PMC free article] [PubMed] [Google Scholar]; Angew. Chem. 2018, 130, 4219–4225. [Google Scholar]
- 25. Urban C., Harnisch F., ChemElectroChem 2017, 4, 1378–1389. [Google Scholar]
- 26. Sanderson J. E., Levy P. F., Cheng L. K., Barnard G. W., J. Electrochem. Soc. 1983, 130, 1844–1848. [Google Scholar]
- 27. Levy P. F., Sanderson J. E., Cheng L. K., J. Electrochem. Soc. 1984, 131, 773–777. [Google Scholar]
- 28. Lopez-Ruiz J. A., Qiu Y., Andrews E., Gutiérrez O. Y., Holladay J. D., J. Appl. Electrochem. 2021, 51, 107–118. [Google Scholar]
- 29.BMDV, “Erneuerbare Kraftstoffe,” can be found under https://www.bmvi.de/SharedDocs/DE/Artikel/G/Alternative-Kraftstoffe/erneuerbare-kraftstoffe.html, 2022.
- 30. Selder L., Turunen R., Vuoristo K. S., Uusitalo J., Zeng A. P., Bioresour. Technol. Reports 2021, 16, 100828. [Google Scholar]
- 31. Contreras-Dávila C. A., Carrión V. J., Vonk V. R., Buisman C. N. J., Strik D. P. B. T. B., Water Res. 2020, 169, 115215. [DOI] [PubMed] [Google Scholar]
- 32. Kucek L. A., Xu J., Nguyen M., Angenent L. T., Front. Microbiol. 2016, 7, 1892. [DOI] [PMC free article] [PubMed] [Google Scholar]
- 33. Neubert K., Kretzschmar J., dos Santos T. R., Härtig C., Harnisch F., ChemTexts 2021, 7(4), art. 27, https://link.springer.com/article/10.1007/s40828-021-00151-0. [Google Scholar]
Associated Data
This section collects any data citations, data availability statements, or supplementary materials included in this article.
Supplementary Materials
As a service to our authors and readers, this journal provides supporting information supplied by the authors. Such materials are peer reviewed and may be re‐organized for online delivery, but are not copy‐edited or typeset. Technical support issues arising from supporting information (other than missing files) should be addressed to the authors.
Supporting Information
Data Availability Statement
The data that support the findings of this study are available in the supplementary material of this article.