Abstract
Programmed death ligand 1 (PD‐L1) is widely known as an immune checkpoint, and immunotherapy through the inhibition of checkpoint molecules has become an important component in the successful treatment of tumours via programmed death 1 (PD‐1)/PD‐L1 signalling pathways. However, its biological functions and expression profile in colorectal cancer (CRC) are elusive. We previously found that PD‐L1 can bind to PD‐L1 and cause cell detachment. However, the detailed molecular mechanisms of how PD‐L1 binds to PD‐L1 and how it transmits signals to the cell remain unclear. In this study, we disclosed that PD‐L1 expression was dramatically upregulated in CRC compared to normal tissues. Ectopic expression of PD‐L1 inhibits cell adhesive capacity and promotes cell migration in CRC cell lines, while silencing PD‐L1 had the opposite effects and suppressed invasion and proliferation. Mechanistically, PD‐L1 was found to promote epithelial–mesenchymal transition (EMT) through the ERK signalling molecule pathway and interacted with the 1–86 aa fragment of KRAS to transduce signals. Collectively, our study demonstrated the role of PD‐L1 after binding to PD‐L1 in CRC, thereby providing a new theoretical basis for further improving immunotherapy with anti‐PD‐L1 antibodies.
Keywords: cell adhesion, colorectal cancer (CRC), ERK, KRAS, migration, PD‐L1
1. INTRODUCTION
Colorectal cancer (CRC) is the third most common tumour and the second leading cause of cancer‐related mortality in the world, with 935 000 deaths from CRC in 2020 globally. 1 Despite considerable developments in CRC treatment strategies, effective treatments for colorectal cancer are deficient. Targeting cancer cells from programmed death ligand 1 (PD‐L1) could be an important area of immunotherapy. Therefore, understanding the specific mechanism of CRC progression, especially the specific role of PD‐L1, is important for developing diagnostic techniques and therapeutic strategies for patients with CRC.
Programmed death ligand 1 and programmed death 1 (PD‐1) are important negative immune regulators. PD‐L1 expressed on the surface of tumour cells binds to the PD‐1 receptor on the surface of T cells through a transmembrane form, which delivers regulatory signals to the cells and inhibits T cell activation and proliferation, thereby mediating immune escape of tumour cells and resistance to conventional chemoradiotherapy. 2 , 3 Because of its role in affecting the immune system, PD‐L1 is widely known as one of the immune checkpoints, and immunotherapy by inhibiting checkpoint molecules has become an important component of successful tumour treatment. 4 Studies have reported that the intracellular segment of PD‐L1 is the signal transduction domain, which can promote proliferation and resist the proapoptotic effects of interferons, further supporting the role of PD‐L1 in signal transduction. 5 , 6
To further investigate the molecular function and mechanism of PD‐L1, we constructed PD‐L1 transgenic mice and found that simultaneous expression of PD‐L1 on germ cells and Sertoli cells will cause PD‐L1 to bind and interact with PD‐L1 and thus cause germ cell detachment. 7 Due to the special physiological structure of the seminiferous tubule, germ cells only contact adjacent Sertoli cells, which provide structural and nutritional support. 8 In addition, the significance of ERK signalling, which can be activated by the nonclassical actions of testosterone, is necessary for maintaining ectoplasmic specialization (ES) connections. 9 , 10 , 11 Some studies have indicated that PD‐L1 may regulate common physiological processes such as cell adhesion, proliferation and migration, but most of the studies focus on tumour cells. Analysis of some clinical cases declares that the expression level of PD‐L1 is positively correlated with the degree of tumour cell invasion and lymph node metastasis in non‐small cell lung cancer, colon cancer, and head and neck tumours. 12 , 13 , 14 Signalling pathways such as epithelial–mesenchymal transition (EMT), PI3K/AKT/mTOR and RAS/ERK may be regulated by PD‐L1 to mediate physiological processes. 15 , 16 PD‐L1 binds with the 112–480 aa domain of AKT to phosphorylate the signalling pathway, thus preventing cytoskeletal disintegration caused by tumour cell autophagy and promoting the invasion and metastasis of tumour cells. 17 Thus, the effect of PD‐L1 is complicated and may be dependent on the type of cancer.
This study, combined with previous studies that found that PD‐L1 can bind to PD‐L1 to cause cell detachment, we investigated the clinical relevance and specific mechanisms of PD‐L1 in CRC. Our findings may complement the molecular role of PD‐L1 and its role in CRC.
2. RESULTS
2.1. PD‐L1 mRNA is upregulated in CRC samples compared with normal colorectal samples in the TCGA database
To explore the potential role and specific mechanism of PD‐L1 in cancer progression, we assessed the expression profiles of PD‐L1 in tumours and adjacent noncancerous tissues in TCGA datasets. We analysed the expression of PD‐L1 in different types of cancer by analysing the Ramaswamy multicancer dataset from the Oncomine database 18 , 19 (Figure 1A). We found that PD‐L1 was predominantly upregulated in CRC (n = 330), lymphoma (n = 19), and cervical cancer (n = 35) datasets (Figure 1A). The higher expression of PD‐L1 in CRC was further confirmed in three CRC datasets, GSE20916, GSE20842, GSE5206 and GSE4183 from GEO (Gene Expression Omnibus) (Figure 1B–E). However, we found that low expression of PD‐L1 was associated with advanced T stage in the TCGA dataset (Figure 1F). Taken together, our analysis of the online public database reveals a potential significant involvement of PD‐L1 in CRC.
FIGURE 1.
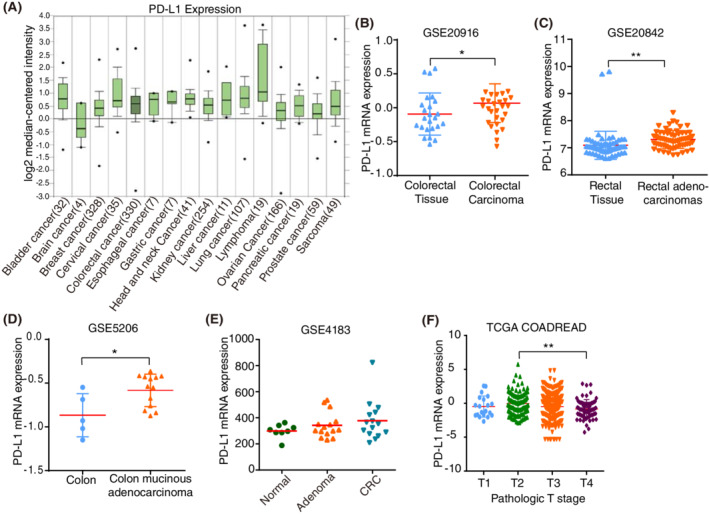
Programmed death ligand 1 (PD‐L1) mRNA expression in human cancer and noncancerous tissues. (A). Analysis of the expression levels of PD‐L1 in different types of cancer in datasets retrieved from the Oncomine database. The numbers of datasets with statistically significant mRNA levels are shown. (B–E). Human PD‐L1 mRNA expression in colorectal cancer (CRC) and adjacent noncancerous tissue from various GEO datasets. (F). PD‐L1 expression levels in different pathologic T stages in the TCGA datasets. **p < 0.01, *p < 0.05
2.2. PD‐L1/PD‐L1 mediates cell adhesion and migration of CRC cells
Following the identification of the potential involvement of PD‐L1 in CRC, we sought to assess the biological effect of PD‐L1 on CRC cells. We examined PD‐L1 expression in eight CRC cell lines and selected SW480 cells with the lowest PD‐L1 expression (Figure 2A,B). We transfected SW480 cells with PD‐L1‐HA expression lentivirus, and the mRNA and protein levels of PD‐L1 substantially increased in PD‐L1 expression lentivirus‐transfected SW480 cells (Figure 2C,D), and PD‐L1 was mainly localized to the cell membrane by immunocytochemistry assay (Figure 2F). We found that PD‐L1 with HA in CRC cells could bind to PD‐L1 with FLAG (Figure 2E), and in a previous study we found that PD‐L1 interacted with PD‐L1 to cause cell shedding. 7 Then, we investigated the effect of PD‐L1/PD‐L1 on the migration of CRC cells. Transwell assays showed that PD‐L1 substantially inhibited the migration of SW480 cells (Figure 3A). PD‐L1 also suppressed the expression of adhesion‐related factors such as ICAM, VCAM, MDCAM, SELE and VAP at the transcriptional level (Figure 3B). We also found a positive correlation between adhesion factors (ICAM and VCAM) and EMT (Figure 3C). Meanwhile, we found interactions between PD‐L1 and adhesion factors in the functional protein binding network (Figure 3D). In addition, gene‐set enrichment analysis (GSEA) analysis showed that PD‐L1 expression was positively correlated with the functional gene cluster of EMT (Figure 3E), and we showed that PD‐L1 upregulated the expression of β‐catenin and vimentin (mesenchymal markers) by western blotting (Figure 3F), which indicated that PD‐L1/PD‐L1 promoted CRC migration.
FIGURE 2.
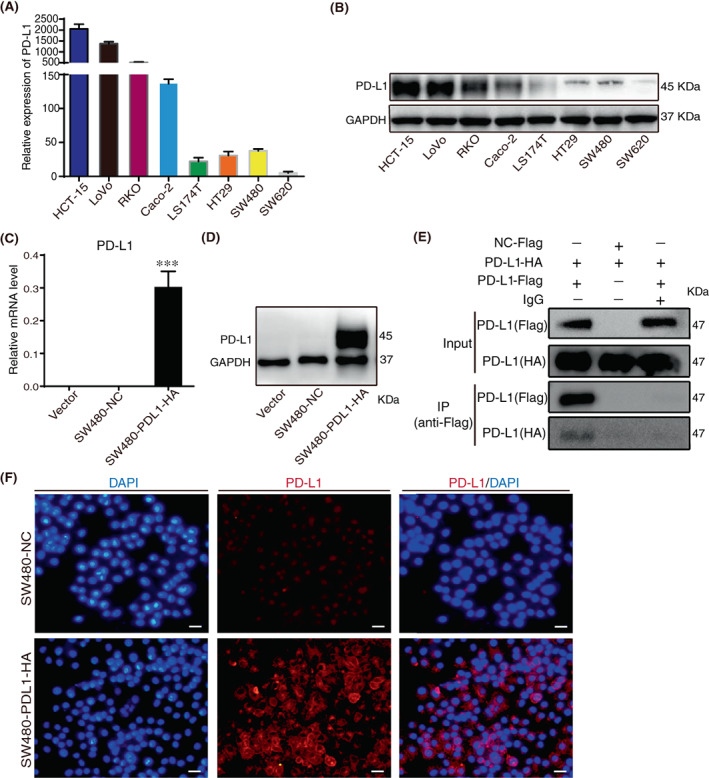
Establishment of colorectal cancer (CRC) cell lines with exogenously high expression of programmed death ligand 1 (PD‐L1). (A). mRNA levels of PD‐L1 were determined by quantitative RT–PCR in eight colorectal cancer (CRC) cells. (B). Protein levels of PD‐L1 were estimated by Western blotting in eight CRC cells. (C). mRNA levels of PD‐L1 were determined by quantitative RT–PCR in vector, SW480‐NC and SW480‐PDL1‐HA cells. (D). Protein levels of PD‐L1 were estimated by Western blotting in vector, SW480‐NC and SW480‐PDL1‐HA cells. (E). Co‐IP analysis of interactions between SW480‐PD‐L1‐Flag and SW480‐PD‐L1‐HA. (F). ICC staining of PD‐L1 and DAPI in SW480‐NC and SW480‐PDL1‐HA cells was shown. The scale bar shows 50 μm
FIGURE 3.
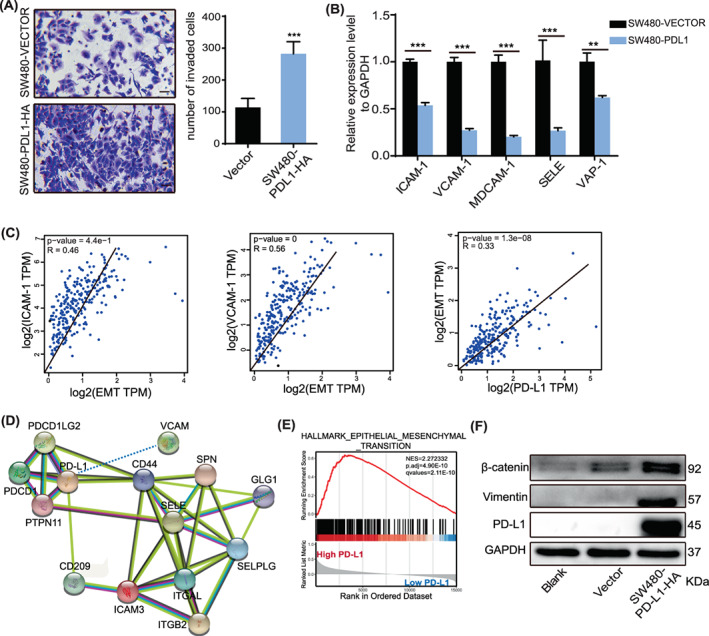
Programmed death ligand 1 (PD‐L1) promotes cell migration and is associated with adhesion factors. (A). Transwell assays were performed to analyse the effect of PD‐L1 on colorectal cancer (CRC) cell migration and invasion in vitro. Scale bar, 50 μm. (B). mRNA levels of adhesion molecules were determined by quantitative RT–PCR in SW480‐VECTOR and SW480‐PDL1 cells. (C). Spearman's correlation analysis of EMT expression and PD‐L1 and adhesion factors performed in the TCGA dataset. (D). Functional protein binding network between PD‐L1 and adhesion factors. (E). GSEA analysis of PD‐L1 expression in TCGA‐COADREAD data showed that high PD‐L1 expression was positively correlated with ‘HALLMARK EPITHELIAL–MESENCHYMAL TRANSITION’. NES, normalized enrichment score. (F). The protein levels of PD‐L1, vimentin and β‐catenin in SW480 cells overexpressing PD‐L1. Data indicate the mean ± SD of three independent experiments. **p < 0.01, ***p < 0.001
To highlight the effect of PD‐L1/PD‐L1 on cell migration ability, we selected the two CRC cell lines with the highest expression of PD‐L1 for the knockdown. We transfected HCT15 and LoVo cells with shRNA targeting PD‐L1, and the mRNA and protein levels of PD‐L1 were significantly reduced in HCT15 and LoVo cells transfected with PD‐L1 shRNA compared to control cells (Figure 4A,B). Transwell assays showed that PD‐L1 knockdown substantially inhibited the migration and invasion of HCT15 and LoVo cells (Figure 4C). Consistently, a scratch wound‐healing assay was performed to demonstrate the same effect (Figure 4D). In summary, we demonstrated that PD‐L1/PD‐L1 regulates cell adhesion to promote cell migration.
FIGURE 4.
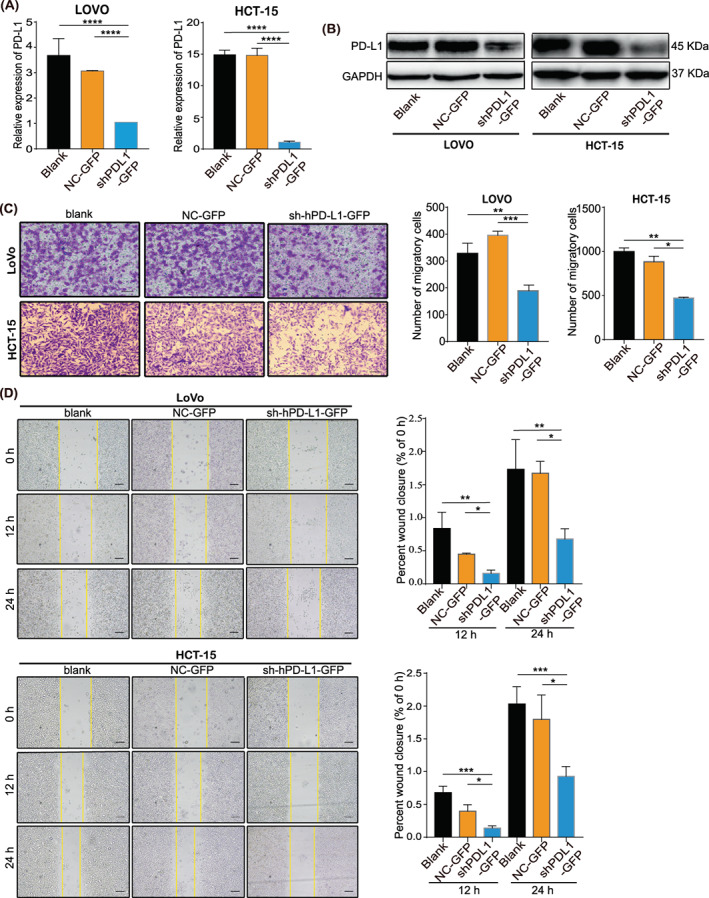
Programmed death ligand 1 (PD‐L1) promotes colorectal cancer (CRC) cells invasion and migration. (A). The RNA and (B). protein levels of PD‐L1 determined by qRT‐PCR and WB in LoVo and HCT‐15 cells with PD‐L1 knockdown. Means from three separate experiments are shown with SD error bars. (C). Transwell assays were performed to analyse the effect of PD‐L1 on LoVo and HCT‐15 cell migration and invasion in vitro. Scale bar, 50 μm. (D). A scratch wound‐healing assay was performed to analyse the effect of PD‐L1 on LoVo and HCT‐15 cell migration. The data represent the mean ± SD from 3 biological repeats. *p < 0.05, **p < 0.01, ***p < 0.001, ****p < 0.0001. Scale bar, 50 μm
2.3. PD‐L1/PD‐L1 promote cell proliferation of CRC cells
To explore the functions of PD‐L1/PD‐L1‐mediated CRC progression, MTT and EdU assays were used to detect the effect of PD‐L1 on cell proliferation. PD‐L1 knockdown inhibited the proliferation of LoVo and HCT15 cells (Figure 5A,B), which suggested that PL‐L1 promoted the growth of CRC. MTT assay results showed that blank and NC‐GFP cell lines proliferated faster (Figure 5B). During cell division, where EdU is incorporated into DNA as a thymidine analogue, PD‐L1 significantly increased the percentage of EdU‐labelled positive cells in LoVo and HCT‐15 cells (Figure 5A).
FIGURE 5.
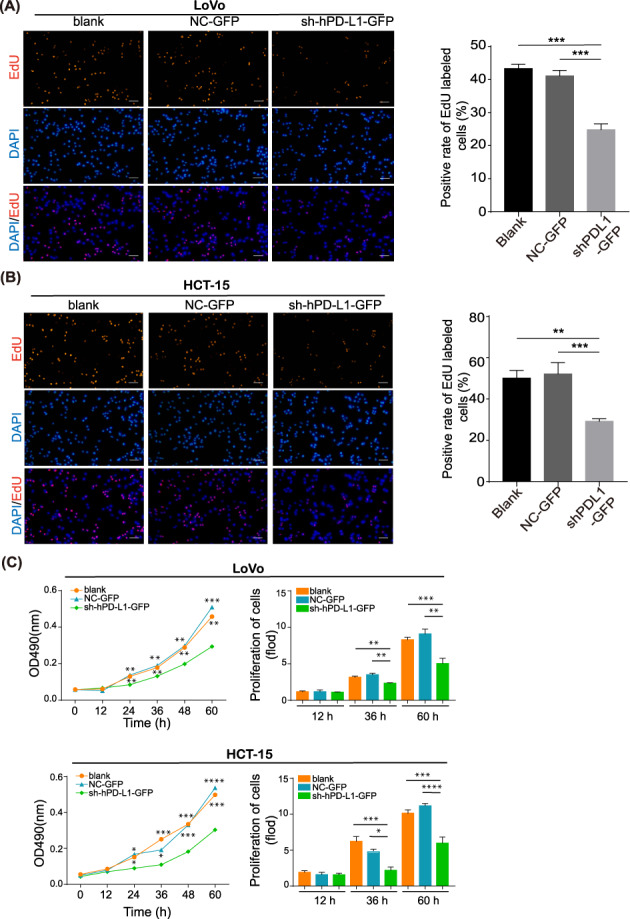
Programmed death ligand 1 (PD‐L1) promotes colorectal cancer (CRC) cells proliferative capacity. (A, B). An EdU incorporation assay was performed to analyze the proliferative capacity of LoVo and HCT‐15 cells with PD‐L1 knockdown. Magnification, 40×. (C). MTT assays were performed to analyze the effect of PD‐L1 knockdown on CRC cell proliferation in vitro. The data represent the mean ± SD from 3 biological repeats. **p < 0.01, ***p < 0.001, ****p < 0.0001
2.4. PD‐L1/PD‐L1 promotes EMT through the ERK signalling pathway rather than the AKT signalling pathway
The EMT is essential for tumour metastasis and invasion and causes cells of the epithelial phenotype to lose polarity and adhesion to become cells with mesenchymal morphological characteristics. 20 We then evaluated the effect of PD‐L1 expression on the key components involved in EMT. The mRNA and protein levels of E‐cadherin (an epithelial marker) increased, accompanied by a decrease in β‐cadherin and vimentin (mesenchymal markers) in PD‐L1‐knockdown HCT15 cells (Figure 6A,B). The AKT and ERK signalling pathways mediate a variety of cellular physiological processes, such as adhesion, migration and proliferation. Several studies have also shown their involvement in the process of regulating EMT. 21 , 22 The activation level of ERK was consistent with the protein level of PD‐L1, and the ratio of p‐ERK/t‐ERK was also significantly downregulated after cells with PD‐L1 knockdown compared with the control (figure 6C). However, the activation levels of AKT and mTOR were negatively associated with the protein levels of PD‐L1 (Figure 6D). To further confirm the role of ERK signalling in PD‐L1‐regulated migration and invasion in CRC, we performed western blotting in HCT15‐sh‐PD‐L1 cells after treatment with U0126 (an ERK inhibitor). The results showed that the treatment decreased vimentin and β‐catenin and increased E‐cadherin expression (Figure 6E). These results suggest that PD‐L1 activates EMT by selectively activating ERK and inhibiting the AKT pathway.
FIGURE 6.
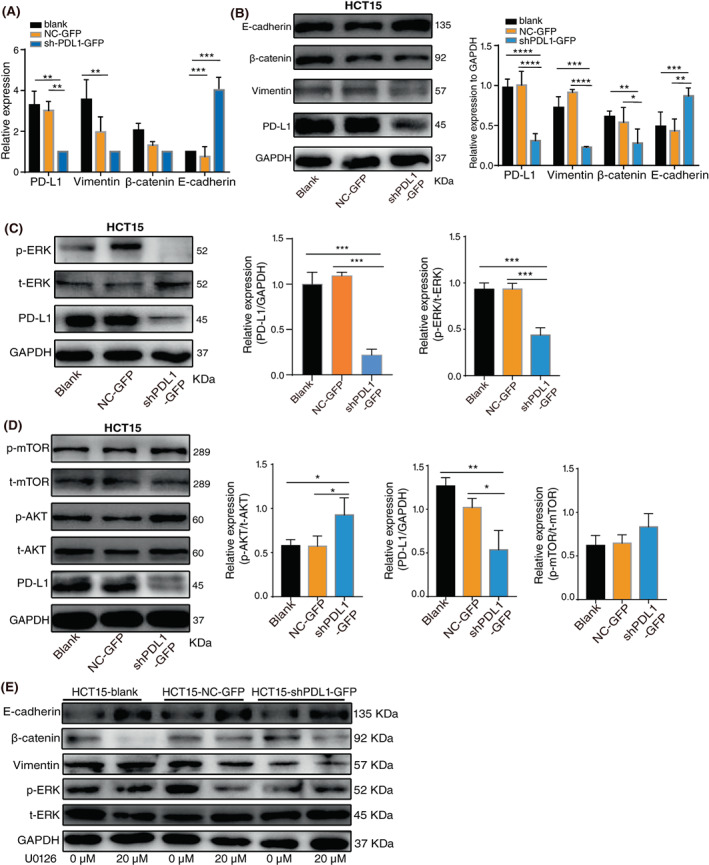
Programmed death ligand 1 (PD‐L1) promotes the EMT process by activating ERK in colorectal cancer (CRC) cells. (A). The RNA and (B) protein levels of PD‐L1, vimentin, β‐catenin, and E‐cadherin in HCT‐15 cells with PD‐L1 knockdown. (C). Western blotting analysis of p‐ERK, t‐ERK and PD‐L1 in HCT‐15 cells with PD‐L1 knockdown. (D). Western blotting analysis of p‐mTOR, t‐mTOR, p‐AKT, t‐AKT and PD‐L1 in HCT‐15 cells with PD‐L1 knockdown. (E). Cells were treated with 0 or 20 μM U0126 for 24 h, and the protein levels of E‐cadherin, β‐catenin, vimentin, p‐ERK and t‐ERK were detected by Western blotting. The data represent the mean ± SD from 3 biological repeats. *p < 0.05, **p < 0.01, ***p < 0.001, ****p < 0.0001
2.5. PD‐L1/PD‐L1 activates ERK by acting with a 1–86 aa fragment of KRAS
RAS is known as the upstream signalling protein of ERK, 23 and KRAS has a relatively high expression level in colorectal cells. 24 Immunofluorescence demonstrated that both KRAS and PD‐L1 were co‐expressed in the cytoplasm near the cell membrane in HCT15 cells (Figure 7A), suggesting the possibility of spatial interaction between the two molecules. Immunoprecipitation showed that PD‐L1 and KRAS could immunobind with the KRAS antibody and be detected in protein complexes (Figure 7B), while we found that PD‐L1 was positively correlated with KRAS (Figure 7C). This suggests that PD‐L1 can also bind KRAS to regulate RAS/MEK/ERK signalling. We further analyzed the specific binding site of KRAS binding to PD‐L1 by truncation domain. The KRAS protein is composed of a G domain (1–165 aa) and a hypervariable region (HVR, 166–188/189 aa). The former can be divided into an effector domain (1–86 aa) and an allosteric domain (87–166 aa). HCT15 with the above‐truncated domain of KRAS was constructed (Figure 7D). Immunoprecipitation results showed that domains 1–86 aa, 1–166 aa, and 1–189 aa of KRAS could bind to PD‐L1, whereas 87–165 aa could not (Figure 7E). These results identify that the effector domain (aa 1–86) of KRAS is involved in PD‐L1/PD‐L1 binding and activates the ERK pathway.
FIGURE 7.
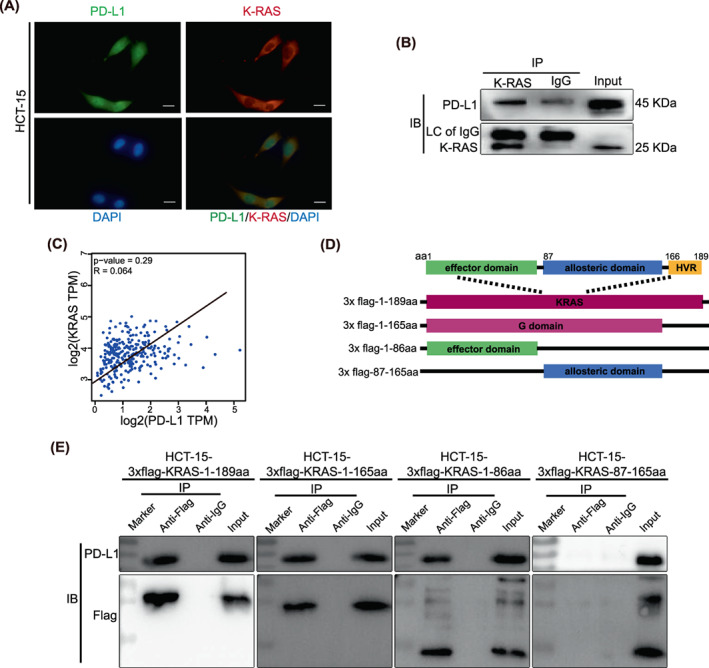
Programmed death ligand 1 (PD‐L1) binds to the 1–86aa fragment of KRAS. (A). Confocal picture showing diamidine‐phenylindole (DAPI)‐stained nuclei (blue), PD‐L1 (green), K‐RAS (red) or a merged picture. The scale bar in 400× images indicates 50 μm. (B). Co‐IP showed that the binding of PD‐L1 to K‐RAS could be detected, excluding the nonspecific binding of rabbit IgG to PD‐L1. Anti‐KRAS (produced in rabbits) immunobound with the complex and anti‐K‐RAS (produced in rabbits) and anti‐PD‐L1 (produced in mice) antibodies were used for detection. (C). Spearman's correlation analysis of KRAS expression and PD‐L1 expression performed in the TCGA dataset. (D). Schematic diagram of K‐RAS truncates with flag tags. (E). Coimmunoprecipitation showed that PD‐L1 binds to the 1–86 aa domain of KRAS. All experiments were repeated at least three times independently
3. DISCUSSION
PD‐L1, also known as B7‐H1, was initially reported to be involved in the negative regulation of cell‐mediated immune responses as a member of the B7 family 25 and was found to be one of the ligands for programmed death 1 (PD‐1). PD‐L1 is expressed on the surface of activated T cells, B cells, macrophages and dendritic cells, and on different tumour cells. The roles of PD‐1/PD‐L1 in cancer development and metastasis have attracted increasing attention. 26 , 27 In a previous study, we found that overexpression of PD‐L1 causes germ cell shedding and that PD‐L1 can bind to PD‐L1 in colorectal cancer (CRC) cells. 7 In this study, we found that PD‐L1/PD‐L1 mediates the adhesion, migration and proliferation functions of CRC cells. Therefore, unravelling the molecular mechanism of the PD‐L1/PD‐L1 interaction may provide a new theoretical basis and strategy to utilize PD‐L1 in the treatment of tumours in the future.
Colorectal cancer is the third most common tumour in the world, and nearly 2 million patients were diagnosed with CRC in 2020. 1 At present, the aetiology and pathogenesis of CRC are not well understood. Studies have confirmed that PD‐L1 is associated with poor prognosis in CRC. 28 High expression of PD‐L1 by tumour cells can promote metastasis and is a hallmark of poor tumour prognosis. 29 , 30 Overexpression of PD‐L1 can promote tumour development through signalling pathways such as PI3K/AKT/mTOR. 17 , 31 , 32 Our results also suggest that PD‐L1 self‐interaction in CRC cells can promote cell migration and proliferation. Studies have shown that PD‐L1 is highly expressed in a variety of tumour tissues, and patients with high expression of PD‐L1 have poor prognoses and poor survival. PD‐L1 is highly expressed and correlated with tumour size, pathologic grade and lymph node metastasis in several cancer types, including rectal, breast, kidney, ovarian and oesophagal cancer. 33 , 34
Upon tumour and viral infection, PD‐L1 interacts with the PD‐1 receptor on the surface of T cells and can inhibit T cell activation and proliferation and enable tumour cells to evade immune surveillance. 35 T cells need two signals to be fully activated. 36 The first signal is provided by the interaction of the antigenic peptide–MHC complex with the T cell receptor (TCR), which confers specificity to the immune response. The second is an antigen‐independent costimulatory signal that is transmitted to T cells by antigen‐presenting cells (APCs) and promotes T cell clonal proliferation, cytokine secretion, and effector function. Amongst them, activation of TCR signalling by T cells requires activation through CD28 binding to B7–1 molecules also present on the surface of APCs. PD‐1/PD‐L1 mediates downstream signalling through the PI3K‐AKT pathway and ultimately reduces the induction of cytokines (e.g., interferon‐γ) within T cells. Immunotherapy refers to enhancing the immune system, restoring cytotoxic T cell function, and achieving the process of clearing tumour cells. At present, the development of monoclonal antibody drugs targeting PD1/PD‐L1 is a research focus in cancer therapy. PD‐1 and PD‐L1 checkpoint antibodies can be divided into two main classes according to the mechanism of action against tumours: anti‐PD‐1 antibodies that bind to the T cell surface PD‐1 molecule (including nivolumab, pembrolizumab and camrelizumab) and anti‐PD‐L1 antibodies that bind to the tumour PD‐L1 receptor (including atezolizumab, avelumab, and durvalumab). Currently, anti‐PD‐1 and anti‐PD‐L1 immunotherapy is indicated for many types of tumours, especially melanoma and non‐small cell lung cancer. 37 , 38 However, there are still many tumours that are refractory to PD‐1 immunotherapy, with efficacy up to 80% in the treatment of lymphoma, but it remains ineffective in up to 70% of patients for many solid tumours. 39 Recent studies have found that some patients with tumours treated with PD‐1/PD‐L1 mAbs have an accelerated growth rate and display a highly progressive disease (HPD) pattern. 40 Based on the above poor effects of PD‐1/PD‐L1 mAb treatment, combined with our finding that PD‐L1 has a self‐interaction, this suggests that the PD‐L1/PD‐L1 interaction might counteract the effects of PD‐1/PD‐L1 mAbs. We, therefore, propose the scientific hypothesis that PD‐L1, which is highly expressed on tumour cells, interacts with PD‐L1 to enhance the ability of tumour cells to resist the attack of the immune system and is an important factor in tumour initiation, progression and metastasis (Figure 8). This suggested to us that the combination of anti‐PD‐1 and anti‐PD‐L1 antibodies might have a better effect, but there has been no related report thus far. It also provides new ideas for the clinical utilization of anti‐PD‐1 and anti‐PD‐L1 to treat tumours. Therefore, the treatment of cancer with anti‐PD‐1 and anti‐PD‐L1 antibodies needs further exploration in the future, and combination therapy with PD‐1/PD‐L1 should be studied more intensively.
FIGURE 8.
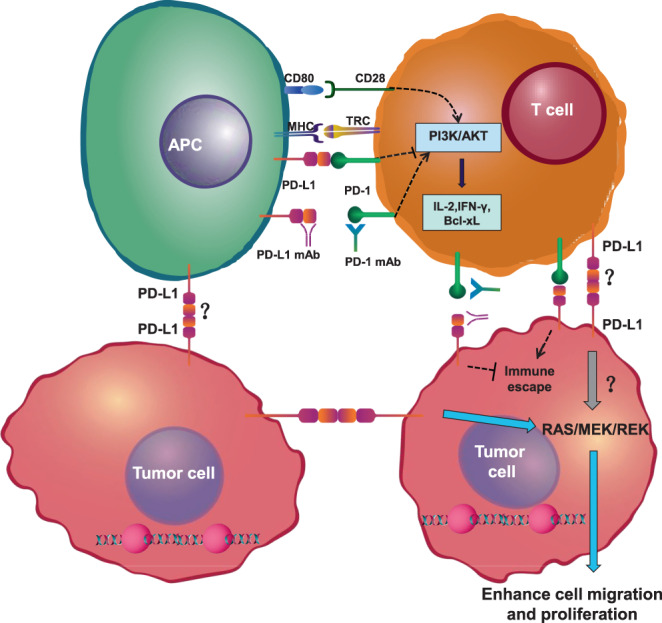
Schematic of PD‐L1 interaction with PD‐L1. PD‐1 from T cells binding to PD‐L1 on antigen‐presenting cells inhibits the PI3K/AKT pathway. PD‐1 ultimately decreases the induction of cytokines, such as IFN‐γ, and cell survival proteins, such as Bcl‐xL. T cells can recognize their target antigen peptide/MHC presented on tumour cells and initiate tumour‐cell lysis. Tumour cells can express PD‐L1, which binds to PD‐L1. APC, antigen‐presenting cell; IL‐2, interleukin 2; MHC, major histocompatibility complex; PD‐1, programmed cell‐death protein 1; PD‐L1, programmed cell death 1 ligand 1; TCR, T‐cell receptor
In this study, combined with previous studies that found that PD‐L1 can bind to PD‐L1 to cause cell detachment, 7 we investigated the clinical relevance and specific mechanisms of PD‐L1 in CRC. Our study demonstrates that PD‐L1 has self‐interaction and regulates cell adhesion through EMT and finally promotes the migration and proliferation of CRC cells. Our results will provide a new perspective on tumour‐targeted PD‐1/PD‐L1 immunotherapy theory and practise.
4. MATERIALS AND METHODS
4.1. Cell culture
The human colorectal cancer cell lines HCT‐15, LoVo, RKO, Caco‐2, LS174T, HT29, SW480 and SW620 and the human embryonic kidney 293 T cell line were purchased from ATCC (Manassas, VA, USA). The 293 T cell line was cultured in DMEM (Gibco, Waltham, MA, USA) supplemented with 10% FBS (Gibco) and 1% penicillin–streptomycin solution (Beyotime, Shanghai, China). All the other cell lines were cultured in RPM1 1640 medium (Gibco) supplemented with 10% FBS and 1% penicillin–streptomycin solution. All cell lines were cultured at 5% CO2 and 37°C.
4.2. Antibodies and pharmacological drugs
U0126 (inhibitor of MEK1/2; MCE, NJ, USA) was used at a final concentration of 10 μM. GAPDH (bs‐2188r; Bioss, Beijing, China), vimentin (10366‐1‐AP; Proteintech, Wuhan, China), β‐catenin (51067‐2‐AP; Proteintech), E‐cadherin (20874‐1‐AP; Proteintech), PD‐L1 (66248‐1‐Ig; Proteintech), PD‐L1 (ab205921; Abcam, Cambridge, UK), KRAS (12063‐1‐AP; Proteintech), HA (AB9110; Abcam) at a concentration of 1:5000, phospho‐AKT (Ser473, #9272; Cell Signaling Technology (CST), Danvers, MA, USA), total‐AKT (#4691; CST), phospho‐mTOR (Ser2448, #5536; CST), total‐mTOR (#2983; CST), phospho‐ERK (Thr202/Thr204, ab1812; Wanlei, China) at a total of 1000 (WL021, Wanlei, CST), phospho‐180 (Thr202/Thr204, IgG (WLP1512, Wanlei), with a total of 1000.
4.3. Data acquisition in TCGA COADREAD
All CRC clinical data and RNA sequencing data in TCGA COADREAD were retrieved through UCSC XENA (https://xenabrowser.net). 41 For RNA sequencing data, we used pancan‐normalized gene expression RNAseq data.
Gene‐set enrichment analysis (GSEA, http://www. broadinstitute.org/gsea/index.jsp) was used to detect any possible signal pathway sets of genes showing statistically significant differences between high and low PD‐L1 expression groups. The functional relationships between PD‐L1 and other genes were tested by two‐sided Pearson's product–moment correlation. The TCGA gene lists were used as the chip platform and the default weighted enrichment method was applied for enrichment analysis with the number of permutations for GSEA set to 1,000. q values <0.25, p value <0.05 and |NES| > 1 were considered significant enrichment. GSEA were applied by using the R language software [R‐4.1.2] with the ‘clusterProfiler’ and ‘enrichplot’ R package. Gene Ontology (GO) analysis, including molecular functions pathway enrichment was analysed with the ‘ggplot2’ R package.
4.4. Gene expression omnibus analysis
We systematically searched for colorectal cancer datasets that were publicly available and reported clinical annotations in the Gene Expression Omnibus (GEO) and downloaded the data. GEO datasets, including GSE20916, 42 GSE20842, 43 GSE5206, 44 GSE4183, 45 and GSE42284, 46 were used in this study.
4.5. Transduction of lentivirus shRNA‐coding vectors
The shPD‐L1‐GFP plasmid containing human PD‐L1 short hairpin RNA (shRNA) targeting 5’‐GGCACATCCTCCAAATGAATT‐3′ and the NC‐GFP control plasmid were purchased from GenePharma (Shanghai, China). HCT‐15 and LoVo cells were transfected with plasmids by using Lipofectamine 3000 (Thermo Fisher Scientific, Waltham, MA, USA) according to the manufacturer's instructions. HCT‐15 and LoVo cells were screened with G418 (Thermo Fisher Scientific) at concentrations of 600 μg/mL and 400 μg/mL, respectively.
4.6. Overexpressing of PD‐L1 and KRAS
Full‐length human PD‐L1‐coding cDNA with HA and FLAG labels was PCR amplified from CS‐U0767‐pIRES and CS‐U0767‐M83 (purchased from GeneCopoeia Company, Guangzhou, China). Full‐length and truncated domains of human KRAS coding cDNA were PCR amplified from LS 174 T, and the domain of 3x‐flag cDNA was PCR amplified and cloned into the pSIN‐EF‐Puro vector. Primers for PCR are in the Table S1.
All lentiviruses were packaged in 293 T cells with psPAX2 and pMD2. G, purified and concentrated using 0.45 μm syringe filters (Pall Corporation, Port Washington, NY, USA), aliquoted and stored at −80 °C. Cells were infected with concentrated lentivirus solution at a final concentration of 1/50 and screened with 3 μg/mL purinomycin (Thermo Fisher Scientific).
4.7. RNA extraction, RT–PCR and qRT‐PCR
Total RNA was extracted with TRIzol reagent (TIANGEN, Beijing, China) and transcribed into cDNA by using PrimeScript RT Master Mix (TaKaRa, Shiga, Japan) according to the manufacturer's instructions. Quantitative reverse transcriptase PCR (qRT‐PCR) assays were performed by using the SYBR® Green Premix kit (TaKaRa). GAPDH was used as an internal reference gene, and all data analyses were performed using the comparative Ct method. Primers for PCR are shown in Table S1.
4.8. Immunocytochemistry
HCT15 cells were incubated in a coverslip for subsequent experiments. The slides were fixed in 4% paraformaldehyde, treated with 1% Triton X‐100. Then, the cells were incubated with anti‐PD‐L1 antibody (1:500) overnight at 4°C, followed by incubating with fluorescein‐conjugated secondary antibodies (1:1000) at 37°C for 30 min. Cell nucleus was stained by DAPI at 37°C for 5 min. Pictures were captured by inverted fluorescence microscope.
4.9. Western blotting analysis
The cells were subjected to lysis in RIPA buffer (Beyotime) with proteinase and phosphatase inhibitors. The protein was separated by 10% sodium dodecyl sulphate polyacrylamide gel electrophoresis (SDS–PAGE) and transferred onto polyvinylidene difluoride (PVDF) membranes (Merck Millipore, Carrigtwohill, Ireland). The membranes were blotted with primary and secondary antibodies to detect the proteins of interest. GAPDH was used as a loading control.
4.10. Transwell assays
Cell migration assays were performed using Transwell chambers (3422, Corning, Corning, NY, USA). Briefly, cells (1 × 10⁵ cells per chamber) were seeded in medium with 1% FBS in the upper chamber, and 10% FBS was used as a chemoattractant at the bottom. Cells were cultured for 24 h. The migrated cells were stained with crystal violet and photographed at × 20 magnification. All measurements were performed in triplicates.
4.11. Wound‐healing assays
A wound‐healing assay was performed as reported. Briefly, 1 × 10⁶ cells/well were cultured to ensure that the cells could confluence in 6‐well plates at 5% CO2 and 37°C for 24 h. The cells were scratched with a white pipette, and the wound edges were micrographed at 0 h and every 12 h. The wound‐edge line was drawn by linking the front boundary of at least 10 cells forward to the nude area. The wound area was calculated as the area surrounded by two wound‐edge lines and the upper and lower edges of the graph by ImageJ software. The experiment was repeated three times.
4.12. Immunofluorescence analysis
Immunofluorescence was conducted as previously reported. A total of 1 × 10⁴ cells/well were cultured in 24‐well plates at 5% CO2 and 37°C for 24 h. The cells were fixed with 4% paraformaldehyde, permeabilized with 0.5% Triton X‐100, blocked with goat serum, and then incubated with primary antibodies and corresponding Alexa Fluor 488/594 secondary antibodies (Thermo Fisher Scientific). Nuclei were stained with DAPI at a concentration of 10 μg/mL. Graphs were taken under the same conditions with a fluorescence microscope (Mshot, Guangzhou, China). The experiment was repeated three times.
4.13. Co‐immunoprecipitation assay
The cells were collected by a cell scraper (Corning) with cool lysate (Beyotime) for protein extraction. The lysate was incubated with anti‐Flag antibodies (F1804; Merck, Darmstadt, Germany) or an equal amount of mouse IgG (B900620; Proteintech) on a rotating wheel overnight at 4°C and then incubated with protein A agarose beads (Beyotime) at 4°C for 10 h. Beads were collected by centrifugation, washed, boiled in 2 × PAGE loading buffers (Beyotime) and analysed by western blotting. The experiments were repeated three times.
4.14. Statistical analysis
All experiments were repeated independently at least three times. Statistical analysis was performed using GraphPad Prism Software. Quantitative data are displayed as the mean ± SEM in each experiment. Comparisons amongst multiple groups were performed through one‐way ANOVA with Newman–Keuls post test. A p < 0.05 (two‐tailed) was considered statistically significant.
AUTHOR CONTRIBUTIONS
Substantial contributions to conception and design: JW. Data acquisition, data analysis and interpretation: YC, LF, ML, JZ and YP. Drafting the article or critically revising it for important intellectual content: WYL, JS and RS. All authors read and approved the final manuscript. JZ and JW confirm the authenticity of all the raw data. All authors agreed to be accountable for all aspects of the work in ensuring that questions related to the accuracy or integrity of the work are appropriately investigated and resolved.
FUNDING INFORMATION
This study was supported by the National Science Foundation of China (31271127, 31571428).
CONFLICTS OF INTERESTS
The authors declare that they have no competing interests.
Supporting information
Table S1 Primer sets for qRT‐PCR and PCR
ACKNOWLEDGEMENTS
We thank AJE for providing us with English language‐editing service.
Cao Y, Liang W, Fang L, et al. PD‐L1/PD‐L1 signalling promotes colorectal cancer cell migration ability through RAS/MEK/ERK . Clin Exp Pharmacol Physiol. 2022;49(12):1281‐1293. doi: 10.1111/1440-1681.13717
Funding information National Natural Science Foundation of China
Contributor Information
Weiye Liang, Email: mcwaiyip285@mail.scut.edu.cn.
Jie Zhao, Email: jiezhao03@scut.edu.cn.
Jian Wang, Email: jwangsc@scut.edu.cn.
DATA AVAILABILITY STATEMENT
All data generated or analysed during this study are included in this published article.
REFERENCES
- 1. Sung H, Ferlay J, Siegel RL, et al. Global cancer statistics 2020: GLOBOCAN estimates of incidence and mortality worldwide for 36 cancers in 185 countries. CA Cancer J Clin. 2021;71(3):209‐249. [DOI] [PubMed] [Google Scholar]
- 2. Kalbasi A, Ribas A. Tumour‐intrinsic resistance to immune checkpoint blockade. Nat Rev Immunol. 2020;20(1):25‐39. [DOI] [PMC free article] [PubMed] [Google Scholar]
- 3. Topalian SL, Taube JM, Pardoll DM. Neoadjuvant checkpoint blockade for cancer immunotherapy. Science. 2020;367(6477):eaax0182. [DOI] [PMC free article] [PubMed] [Google Scholar]
- 4. Schulz D, Streller M, Piendl G, et al. Differential localization of PD‐L1 and Akt‐1 involvement in radioresistant and radiosensitive cell lines of head and neck squamous cell carcinoma. Carcinogenesis. 2020;41(7):984‐992. [DOI] [PubMed] [Google Scholar]
- 5. Escors D, Gato‐Canas M, Zuazo M, et al. The intracellular signalosome of PD‐L1 in cancer cells. Signal Transduct Target Ther. 2018;3:26. [DOI] [PMC free article] [PubMed] [Google Scholar]
- 6. Gato‐Canas M, Zuazo M, Arasanz H, et al. PDL1 signals through conserved sequence motifs to overcome interferon‐mediated cytotoxicity. Cell Rep. 2017;20(8):1818‐1829. [DOI] [PubMed] [Google Scholar]
- 7. Fang L, Feng R, Liang W, et al. Overexpression of PD‐L1 causes germ cells to slough from mouse seminiferous tubules via the PD‐L1/PD‐L1 interaction. J Cell Mol Med. 2022;26:2908‐2920. [DOI] [PMC free article] [PubMed] [Google Scholar]
- 8. Greenbaum MP, Iwamori T, Buchold GM, Matzuk MM. Germ cell intercellular bridges. Cold Spring Harb Perspect Biol. 2011;3(8):a005850. [DOI] [PMC free article] [PubMed] [Google Scholar]
- 9. Shupe J, Cheng J, Puri P, Kostereva N, Walker WH. Regulation of Sertoli‐germ cell adhesion and sperm release by FSH and nonclassical testosterone signaling. Mol Endocrinol. 2011;25(2):238‐252. [DOI] [PMC free article] [PubMed] [Google Scholar]
- 10. Beardsley A, O'Donnell L. Characterization of normal spermiation and spermiation failure induced by hormone suppression in adult rats. Biol Reprod. 2003;68(4):1299‐1307. [DOI] [PubMed] [Google Scholar]
- 11. Xia W, Cheng CY. TGF‐beta3 regulates anchoring junction dynamics in the seminiferous epithelium of the rat testis via the Ras/ERK signaling pathway: an in vivo study. Dev Biol. 2005;280(2):321‐343. [DOI] [PubMed] [Google Scholar]
- 12. Velcheti V, Schalper KA, Carvajal DE, et al. Programmed death ligand‐1 expression in non‐small cell lung cancer. Lab Invest. 2014;94(1):107‐116. [DOI] [PMC free article] [PubMed] [Google Scholar]
- 13. Eichberger J, Schulz D, Pscheidl K, et al. PD‐L1 influences cell spreading, migration and invasion in head and neck cancer cells. Int J Mol Sci. 2020;21(21):8089. [DOI] [PMC free article] [PubMed] [Google Scholar]
- 14. Song M, Chen D, Lu B, et al. PTEN loss increases PD‐L1 protein expression and affects the correlation between PD‐L1 expression and clinical parameters in colorectal cancer. PLoS One. 2013;8(6):e65821. [DOI] [PMC free article] [PubMed] [Google Scholar]
- 15. Correction: tumor‐intrinsic PD‐L1 signals regulate cell growth, pathogenesis, and autophagy in ovarian cancer and melanoma. Cancer Res. 2017;77(10):2770. [DOI] [PubMed] [Google Scholar]
- 16. Qiu XY, Hu DX, Chen WQ, et al. PD‐L1 confers glioblastoma multiforme malignancy via Ras binding and Ras/Erk/EMT activation. Biochim Biophys Acta Mol Basis Dis. 2018;1864(5 Pt A):1754‐1769. [DOI] [PubMed] [Google Scholar]
- 17. Chen RQ, Xu XH, Liu F, et al. The binding of PD‐L1 and Akt facilitates glioma cell invasion upon starvation via Akt/autophagy/F‐Actin signaling. Front Oncol. 2019;9:1347. [DOI] [PMC free article] [PubMed] [Google Scholar]
- 18. Ramaswamy S, Tamayo P, Rifkin R, et al. Multiclass cancer diagnosis using tumor gene expression signatures. Proc Natl Acad Sci U S A. 2001;98(26):15149‐15154. [DOI] [PMC free article] [PubMed] [Google Scholar]
- 19. Ramaswamy S, Ross KN, Lander ES, Golub TR. A molecular signature of metastasis in primary solid tumors. Nat Genet. 2003;33(1):49‐54. [DOI] [PubMed] [Google Scholar]
- 20. Pastushenko I, Blanpain C. EMT transition states during tumor progression and metastasis. Trends Cell Biol. 2019;29(3):212‐226. [DOI] [PubMed] [Google Scholar]
- 21. Gao L, Zhang W, Zhong WQ, et al. Tumor associated macrophages induce epithelial to mesenchymal transition via the EGFR/ERK1/2 pathway in head and neck squamous cell carcinoma. Oncol Rep. 2018;40(5):2558‐2572. [DOI] [PMC free article] [PubMed] [Google Scholar]
- 22. Yang Z, Xie H, He D, Li L. Infiltrating macrophages increase RCC epithelial mesenchymal transition (EMT) and stem cell‐like populations via AKT and mTOR signaling. Oncotarget. 2016;7(28):44478‐44491. [DOI] [PMC free article] [PubMed] [Google Scholar]
- 23. Shu L, Wang D, Saba NF, Chen ZG. A historic perspective and overview of H‐Ras structure, Oncogenicity, and targeting. Mol Cancer Ther. 2020;19(4):999‐1007. [DOI] [PubMed] [Google Scholar]
- 24. Liu P, Wang Y, Li X. Targeting the untargetable KRAS in cancer therapy. Acta Pharm Sin B. 2019;9(5):871‐879. [DOI] [PMC free article] [PubMed] [Google Scholar]
- 25. Dong H, Zhu G, Tamada K, Chen L. B7‐H1, a third member of the B7 family, co‐stimulates T‐cell proliferation and interleukin‐10 secretion. Nat Med. 1999;5(12):1365‐1369. [DOI] [PubMed] [Google Scholar]
- 26. Dammeijer F, van Gulijk M, Mulder EE, et al. The PD‐1/PD‐L1‐checkpoint restrains T cell immunity in tumor‐draining lymph nodes. Cancer Cell. 2020;38(5):685‐700 e688. [DOI] [PubMed] [Google Scholar]
- 27. Diskin B, Adam S, Cassini MF, et al. PD‐L1 engagement on T cells promotes self‐tolerance and suppression of neighboring macrophages and effector T cells in cancer. Nat Immunol. 2020;21(4):442‐454. [DOI] [PubMed] [Google Scholar]
- 28. Shi SJ, Wang LJ, Wang GD, et al. B7‐H1 expression is associated with poor prognosis in colorectal carcinoma and regulates the proliferation and invasion of HCT116 colorectal cancer cells. PLoS One. 2013;8(10):e76012. [DOI] [PMC free article] [PubMed] [Google Scholar]
- 29. Chen L, Gibbons DL, Goswami S, et al. Metastasis is regulated via microRNA‐200/ZEB1 axis control of tumour cell PD‐L1 expression and intratumoral immunosuppression. Nat Commun. 2014;5:5241. [DOI] [PMC free article] [PubMed] [Google Scholar]
- 30. Clark CA, Gupta HB, Sareddy G, et al. Tumor‐intrinsic PD‐L1 signals regulate cell growth, pathogenesis, and autophagy in ovarian cancer and melanoma. Cancer Res. 2016;76(23):6964‐6974. [DOI] [PMC free article] [PubMed] [Google Scholar]
- 31. Liu H, Kuang X, Zhang Y, et al. ADORA1 inhibition promotes tumor immune evasion by regulating the ATF3‐PD‐L1 Axis. Cancer Cell. 2020;37(3):324‐339 e328. [DOI] [PubMed] [Google Scholar]
- 32. Chen J, Jiang CC, Jin L, Zhang XD. Regulation of PD‐L1: a novel role of pro‐survival signalling in cancer. Ann Oncol. 2016;27(3):409‐416. [DOI] [PubMed] [Google Scholar]
- 33. Wolchok JD, Chan TA. Cancer: antitumour immunity gets a boost. Nature. 2014;515(7528):496‐498. [DOI] [PMC free article] [PubMed] [Google Scholar]
- 34. Waugh KA, Leach SM, Slansky JE. Targeting transcriptional regulators of CD8+ T cell dysfunction to boost anti‐tumor immunity. Vaccines. 2015;3(3):771‐802. [DOI] [PMC free article] [PubMed] [Google Scholar]
- 35. Freeman GJ, Long AJ, Iwai Y, et al. Engagement of the PD‐1 immunoinhibitory receptor by a novel B7 family member leads to negative regulation of lymphocyte activation. J Exp Med. 2000;192(7):1027‐1034. [DOI] [PMC free article] [PubMed] [Google Scholar]
- 36. Lafferty KJ, Cunningham AJ. A new analysis of allogeneic interactions. Aust J Exp Biol Med Sci. 1975;53(1):27‐42. [DOI] [PubMed] [Google Scholar]
- 37. Robert C, Ribas A, Schachter J, et al. Pembrolizumab versus ipilimumab in advanced melanoma (KEYNOTE‐006): post‐hoc 5‐year results from an open‐label, multicentre, randomised, controlled, phase 3 study. Lancet Oncol. 2019;20(9):1239‐1251. [DOI] [PubMed] [Google Scholar]
- 38. Rittmeyer A, Barlesi F, Waterkamp D, et al. Atezolizumab versus docetaxel in patients with previously treated non‐small‐cell lung cancer (OAK): a phase 3, open‐label, multicentre randomised controlled trial. Lancet. 2017;389(10066):255‐265. [DOI] [PMC free article] [PubMed] [Google Scholar]
- 39. Baxi S, Yang A, Gennarelli RL, et al. Immune‐related adverse events for anti‐PD‐1 and anti‐PD‐L1 drugs: systematic review and meta‐analysis. BMJ. 2018;360:k793. [DOI] [PMC free article] [PubMed] [Google Scholar]
- 40. Champiat S, Dercle L, Ammari S, et al. Hyperprogressive disease is a new pattern of progression in cancer patients treated by anti‐PD‐1/PD‐L1. Clin Cancer Res. 2017;23(8):1920‐1928. [DOI] [PubMed] [Google Scholar]
- 41. Goldman MJ, Craft B, Hastie M, et al. Visualizing and interpreting cancer genomics data via the Xena platform. Nat Biotechnol. 2020;38(6):675‐678. [DOI] [PMC free article] [PubMed] [Google Scholar]
- 42. Skrzypczak M, Goryca K, Rubel T, et al. Modeling oncogenic signaling in colon tumors by multidirectional analyses of microarray data directed for maximization of analytical reliability. PLoS One. 2010;5(10):e13091. [DOI] [PMC free article] [PubMed] [Google Scholar]
- 43. Gaedcke J, Grade M, Jung K, et al. Mutated KRAS results in overexpression of DUSP4, a MAP‐kinase phosphatase, and SMYD3, a histone methyltransferase, in rectal carcinomas. Genes Chromosomes Cancer. 2010;49(11):1024‐1034. [DOI] [PMC free article] [PubMed] [Google Scholar]
- 44. Kaiser S, Park YK, Franklin JL, et al. Transcriptional recapitulation and subversion of embryonic colon development by mouse colon tumor models and human colon cancer. Genome Biol. 2007;8(7):R131. [DOI] [PMC free article] [PubMed] [Google Scholar]
- 45. Galamb O, Gyorffy B, Sipos F, et al. Inflammation, adenoma and cancer: objective classification of colon biopsy specimens with gene expression signature. Dis Markers. 2008;25(1):1‐16. [DOI] [PMC free article] [PubMed] [Google Scholar]
- 46. Roepman P, Schlicker A, Tabernero J, et al. Colorectal cancer intrinsic subtypes predict chemotherapy benefit, deficient mismatch repair and epithelial‐to‐mesenchymal transition. Int J Cancer. 2014;134(3):552‐562. [DOI] [PMC free article] [PubMed] [Google Scholar]
Associated Data
This section collects any data citations, data availability statements, or supplementary materials included in this article.
Supplementary Materials
Table S1 Primer sets for qRT‐PCR and PCR
Data Availability Statement
All data generated or analysed during this study are included in this published article.


