

Abstract
Purpose
Positron emission tomography‐computed tomography (PET‐CT) using prostate‐specific membrane antigen (PSMA) ligands is a method for imaging prostate cancer. A recent tracer, 18F‐PSMA‐1007, offers advantages concerning production and biokinetics compared to the standard tracer (68Ga‐PSMA‐11). Until now, radiation dosimetry data for this ligand was limited to the material of three healthy volunteers. The purpose of this study is to study the biokinetics and dosimetry of 18F‐PSMA‐1007.
Methods
Twelve patients with prostate cancer were injected with 4 MBq/kg 18F‐PSMA‐1007. Eight PET‐CT scans with concomitant blood sampling were performed up to 330 min after injection. Urine was collected until the following morning. Volumes of interest for radiation‐sensitive organs and organs with high uptake of 18F‐PSMA‐1007 were drawn in the PET images. A biokinetic compartment model was developed using activity data from PET images and blood and urine samples. Time‐activity curves and time‐integrated activity coefficients for all delineated organs were calculated. The software IDAC‐dose 2.1 was used to calculate the absorbed and effective doses.
Results
High concentrations of activity were noted in the liver, kidneys, parts of the small intestine, spleen, salivary glands, and lacrimal glands. The elimination through urine was 8% of injected activity in 20 h. The highest absorbed doses coefficients were in the lacrimal glands, kidneys, salivary glands, liver, and spleen (98–66 µGy/MBq). The effective dose coefficient was 25 µSv/MBq.
Conclusion
The effective dose of 18F‐PSMA‐1007 is 6.0–8.0 mSv for a typical patient weighing 80 kg injected with 3–4 MBq/kg.
Keywords: biodistribution, dosimetry, prostate cancer, PSMA, PSMA‐1007
1. INTRODUCTION
Prostate cancer is, together with lung cancer, the most common cancer form and the fifth leading cause of cancer death in men worldwide (Sung et al., 2021). Imaging is important for correct primary staging and for the detection of sites of biochemical recurrence. Recently, positron emission tomography (PET) radiopharmaceuticals have been developed from ligands to the extracellular domain of the membrane‐bound protein prostate‐specific membrane antigen (PSMA), which is overexpressed in prostate cancer cells (Leek et al., 1995). The most commonly used radioligand is 68Ga‐PSMA‐11 which has been validated against conventional imaging in the primary staging of prostate cancer and in the setting of biochemical recurrence after radical treatment (Fendler et al., 2019; Herlemann et al., 2016; Hofman et al., 2020; Maurer et al., 2016; Perera et al., 2016). Another PSMA ligand, PSMA‐1007, offers possible advantages over PSMA‐11. It can be labelled with 18F enabling high‐quantity production, a more convenient half‐life, and potentially higher spatial image resolution compared with 68Ga. In addition, its low excretion in urine facilitates visualization of pathological uptake in the pelvic region (Giesel et al., 2017). Clinical studies suggest performance similar to or better than 68Ga‐PSMA‐11 (Giesel et al., 2019; Liu et al., 2020; Sprute et al., 2021; Trägårdh et al., 2021; Watabe et al., 2021).
The biodistribution and radiation dosimetry of 18F‐PSMA‐1007 has been studied in three healthy volunteers (Giesel et al., 2017). The volunteers underwent multiple 18F‐PSMA‐1007 PET‐computed tomography (CT) scans up to 6 h postinjection, and blood‐ and urine samples were obtained. The effective dose coefficient was 22 µSv/MBq, similar to other PSMA‐targeting PET tracers. A comprehensive dosimetry study is needed as the tracer is increasingly being used in clinical practice. This study aimed to investigate the whole body distribution and radiation dosimetry of 18F‐PSMA‐1007.
2. MATERIALS AND METHODS
2.1. Patients
Twelve patients referred for clinical 18F‐PSMA‐1007 PET‐CT at Skåne University Hospital in Malmö and Lund, Sweden, were included. They were all >50 years of age and deemed able to undergo repeated PET scans up to 6 h after injection of 18F‐PSMA‐1007.
This study was conducted following the Helsinki declaration and approved by the Regional Ethical Review Board (#2020‐00689). All patients provided written informed consent.
2.2. 18F‐PSMA‐1007
18F‐PSMA‐1007 was produced at Skåne University Hospital, Lund, using precursor, reagents, and hardware kits supplied by ABX advanced biochemical compounds. All methods followed good manufacturing practices according to the Eudralex vol. 4. The protocol activity was 4.0 MBq/kg 18F‐PSMA‐1007 through intravenous bolus injection. The mean administrated activity was 4.0 MBq/kg (range 3.8–4.2 MBq) as measured from the syringe pre‐ and postinjection.
2.3. PET‐CT system
Two GE Discovery MI PET‐CT systems (Discovery MI; GE Healthcare) were used for the examinations. The axial field of view (FOV) of the PET camera is 20 cm. Multi‐FOV acquisitions were performed with 24% axial overlap. The PET‐CT systems are calibrated quarterly following the protocol recommended by GE Healthcare. The same dose calibrator (Capintec CRC‐15R; Capintec Inc.) is used for measuring syringe 18F‐activity both for the calibration phantom and for the patient doses. The dose calibrator is cross calibrated to a Fidelis secondary standard dose calibrator (Southern Scientific). The scanner calibration is validated monthly using a homogenous phantom with known activity concentration.
The Q.Clear (Ross, 2014) reconstruction algorithm was used, including time‐of‐flight, point spread function, and CT‐based attenuation correction with a 256 × 256 matrix (pixel size 2.7 × 2.7 mm2, slice thickness 2.8 mm). The noise‐regularization parameter (β) was set to 800 (Tragardh, Minarik, et al., 2020). PET images were decay corrected to the start of each scan. The PET/CT system has a 128‐slice CT. An adaptive statistical iterative reconstruction technique was used for the CT images.
2.4. PET‐CT image acquisition
Eight knee‐to‐head PET‐CT scans were acquired. The first started 3 min after injection, followed by scans at 10, 20, 30, 60, 120, 210, and 330 min postinjection. Patients levelled their arms at their sides except for the 60‐ and 120‐min scans, which were performed hands up to achieve diagnostic quality (imaging at 120 min is our clinical routine, a planned study will compare 60 and 120 min uptake time). The hands were not included in these scans. In 5 out of the total of 96 scans the top of the skull, part of the brain, and, in two cases, the lacrimal glands were accidentally not included. Figure 1 summarizes the PET and CT protocols.
Figure 1.

PET and CT protocol for a typical patient. The number of bed positions varied from 9 to 10, and the patient was scanned in a cranial direction. CT, computed tomography; PET, positron emission tomography.
2.5. Blood and urine sampling
Venous blood samples were drawn before injection (to make sure activity in the blood = 0) of 18F‐PSMA‐1007 and immediately after each PET scan. The activity concentration in 2‐ml whole blood samples was determined using a gamma counter (HIDEX AMG; Hidex Oy).
All urine was collected until the morning after 18F‐PSMA‐1007 administration. While at the clinic patients voided in sampling bottles that were labelled with a collection time. When going home, the patients were equipped with two bottles and instructed to switch bottles at bedtime. Bottles were collected the next morning. An average of 5.5 bottles per patient were collected (range 3–7 bottles) with a mean total collection time of 20 h and 12 min (range 19 h 02 min to 21 h 38 min). The net contents of the bottles were determined by weighing. The activity concentration of a 2‐ml sample from each bottle was determined in the abovementioned gamma counter.
All measurements and analyses of blood and urine samples were performed in duplicate to identify inconsistencies. The calibration factor for the gamma counter was determined using an equal amount (2 ml) of the same 18F‐PSMA‐1007 preparation as administered to the patient and measured in an identical geometry as the blood and urine samples (after the activity had decayed to a level suitable for measurements with the gamma counter, avoiding dead time effects).
2.6. Image analysis
The Research Consortium for Medical Image Analysis (RECOMIA) platform (www.recomia.org; Trägårdh, Borrelli, et al., 2020) was used for the segmentation of volumes of interest (VOIs) in the eight image series for each patient. In this platform, VOIs are mapped onto the CT data; they were later resampled to match the voxel size of the PET data. The initial segmentation was done by RECOMIA's artificial intelligence with additional segmentation by a biomedical scientist. CT images were used for anatomical guidance. A physician with 5 years' clinical experience in PET/CT controlled all VOIs to ensure proper delineation. Extensive manual adjustment of the CT‐based artificial intelligence segmentation was necessary, particularly in mobile organs. VOIs were created for the left adrenal gland, colon (left, right, rectosigmoid), gallbladder, heart, kidneys, lacrimal glands, liver, lungs, gluteal muscle, pancreas, prostate, salivary glands (parotid, submandibular and sublingual), skeleton, small intestine, spleen, testes, thyroid, urinary bladder, and gastric ventricle. The right adrenal gland could not be delineated due to high activity in the liver, the same activity as the left gland was assumed.
The activity of the delineated organs was calculated by multiplying the mean activity concentration (Bq/ml) in the VOI with the VOI volume (ml). The normalized and decay‐corrected activity as a percentage of injected activity (%IA DC) was then calculated:
where is the injected activity at , is the calculated VOI activity at time , is the PET scan start time relative to , and is the decay constant for 18F (=109.8 min).
2.7. Biokinetics
Using MATLAB (MathWorks), a whole‐body compartment model was constructed to model the biokinetics of 18F‐PSMA‐1007. The model input data were the organ activities from PET image measurements (%IA DC), whole‐blood activity concentration (%IA/ml DC), and the cumulated activity excreted to urine (%IA DC), all corrected for decay. Decay‐correction simplified keeping track of activity over time (activity should add up to 1 when corrected). Also, without decay correction, late measurements would effectively be disregarded in the model due to decay and some other form of scaling to relative units would be necessary. At t = 0, all activity was assumed to be evenly distributed in the total blood volume. The start time for the PET scan was used as a time point for the organ activity measurements (neglecting scan duration). For blood, the activity concentration from each blood sample was entered with a time point corresponding to the time of drawing blood. For urine, activity for each collected bottle was entered with a time point corresponding to bottle collection. Additional urine activity data was entered for each PET scan performed before the first voiding of urine for each patient. For this, the total activity in the VOI of the bladder was assumed to be in the urine. The activity from the gluteal muscle VOI was extrapolated into total muscle activity using mass values from International Commission on Radiological Protection (ICRP) Publication 133 (Bolch et al., 2016). Decay‐corrected activity data for “rest‐of‐body” at the time points for PET imaging was calculated assuming biological elimination by urinary bladder voiding only. This was supported by the calculation of the combined activity in PET images at 5.5 h and activity in urine bottles collected at the clinic, the mean was 101%IA DC (range 96%–105%).
For most organs, a two‐tissue compartment model was assumed with a bidirectional flow of activity between blood and the first tissue compartment, and an irreversible uptake from the first to the second tissue compartment. All organs were, thus, indirectly linked through the blood volume. The small and large intestines had additional compartments for content representing bile transfer from the liver and gallbladder to the small intestine and from the small intestine to the colon. Voiding of urine was assumed every 1.9 h (the average voiding interval during the stay at our clinic). This will give a lower dose, mainly to the bladder, than the 3.5‐h interval recommended by ICRP Publication 128 (Mattsson et al., 2015) but we considered this value truer for our population. Figure 2 summarizes the compartment model.
Figure 2.
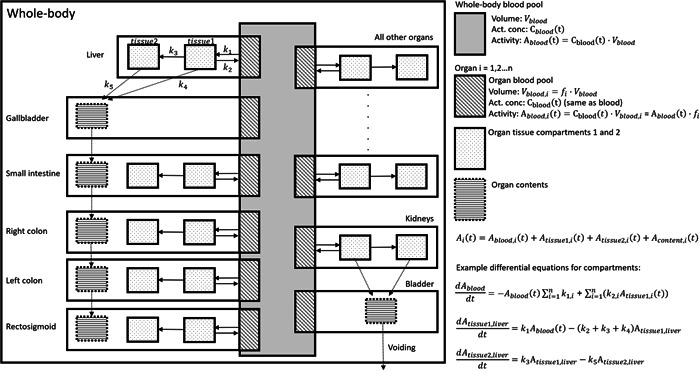
A whole‐body compartment model for the biokinetics of 18F‐PSMA‐1007. For activity in each compartment, a differential equation was specified, exemplified in the figure by the equations for the compartment of the whole‐body blood pool and tissue compartments of the liver. The system of equations was then solved iteratively as specified in the text. PSMA, prostate‐specific membrane antigen.
The unknown variables of the system were the transfer rate constants between compartments, the total blood volume (for converting blood activity concentration to total blood activity), and blood volume in each organ. The model activity in each organ as a function of time was the sum of the activity contributions from organ blood, tissue, and content compartments. A single global fit of the kinetic model was performed by iteratively solving the differential equations of the system to minimize the sum of squared deviations between measured and calculated data (i.e., one datum for each organ at each time point in each patient). Thus, there was no need to calculate average activity concentrations per patient or per organ. This was particularly useful for urine data where there was a considerable variation in the time points for urine collection, and, therefore, no obvious approach on how to average data. The model, thus, rendered time‐activity data for each compartment and values for total and organ blood volumes. For reader replication, a biexponential fitting of the blood curve was derived in Matlab.
Activity in both the urinary and gallbladder walls was assumed to be negligible and not calculated (i.e., they were not assigned tissue compartments). The gallbladder wall was generally not possible to delineate due to concentrated activity in liver and gallbladder content. When visible it contained negligible activity. The urinary bladder wall was not visualized as a separate structure.
An estimation of activity excreted in bile was made using the compartment model. Excretion at specific time points was calculated by adding the activity in the contents of the gallbladder and large and small intestines as determined by the model. This value was assumed to represent total excreted activity in bile.
2.8. Dosimetry
Time‐activity curves (TACs) and time‐integrated activity coefficients (TIACs) were derived for each organ using the biokinetic model (separate curves for blood, tissue, and content). The TAC for skeletal tissue was assumed to represent bone marrow. Absorbed doses and effective doses according to ICRP Publication 103 (ICRP, 2007) were calculated using the software IDAC‐Dose 2.1 (Andersson et al., 2017). The lacrimal glands are neither included as source organs in ICRP publication 110 nor as contributing to an effective dose in ICRP Publication 103 (ICRP, 2007; Menzel et al., 2009). The absorbed dose was calculated using the IDAC‐Dose 2.1 spheres module assuming a volume of 0.7 ml (Bingham et al., 2013).
3. RESULTS
3.1. Patients
The indication was a primary staging of biopsy‐verified high‐risk prostate cancer (n = 5 with mean PSA 13 µg/L, range 3.7–27 µg/L) or biochemical recurrence radically treated prostate cancer (n = 7 with mean PSA 1.4 µg/L, range 0.16–5.4 µg/L). The mean age was 63 years (range 53–77 years), mean weight 81 kg (range 68–96 kg), and mean body mass index 25 (range 21–30). Visually, all patients had a low tumour burden, limited to the prostate/prostate bed, and at most 1–2 suspected lymph node metastases.
3.2. Biokinetics
Figure 3 shows the activity distribution in the body, describing serial maximum intensity projection images of one patient. There is a high concentration of activity in the liver, kidneys, parts of the small intestine, spleen, salivary glands, and lacrimal glands. All these organs show an increasing concentration over time with decay‐corrected TACs reaching or approaching a plateau at the final imaging session at 5.5 h (Figure 4). Figure 5 shows activity in the blood from 0 to 8 h as determined by the biokinetic model and the biexponential fit ( where a is %IA DC/ml in blood t hours after injection).
Figure 3.

Maximum intensity projections of positron emission tomography scans 3, 10, 20, 30, 60, 120, 210, and 330 min post injection.
Figure 4.

Time‐activity curves (showing percentage of injected activity, corrected for physical decay) as determined by the compartment model (all segmented organs not displayed). Patient averages are included for comparison.
Figure 5.

Time‐activity curve data for blood. The equation for the bi‐exponential model is given in the text.
The mean urinary excretion as measured in collected urine was 8.1% 20 h after injection (range 5.2%–10.1%). Excretion determined by the compartment model was 3.1% and 7.8% at 5.5 and 20 h, respectively. The excretion through bile was estimated to be 5.9% and 15.0% at the same time points.
3.3. Radiation dosimetry
TIACs and blood volume fractions for segmented organs, derived from the biokinetic compartment model, are shown in Table 1. Table 2 shows estimated absorbed and effective dose coefficients. Reported dose coefficients are from calculations made without the prostate as a source organ. When calculations were made with the prostate as a source organ the absorbed dose coefficient to the prostate was 55 µGy/MBq. Other dose coefficients, including effective dose, were unchanged to one decimal point. The highest absorbed dose coefficients are obtained for the lacrimal glands, kidneys, salivary glands, liver, and spleen (98–66 µGy/MBq). The effective dose coefficient determined using the tissue weighting factors of ICRP 103 is 25 µSv/MBq. This translates to 4.5–10 mSv for patients weighing 60–100 kg injected with 3–4 MBq/kg. The full output file from IDAC‐Dose 2.1, which includes estimated doses for women, is available from the authors on request.
Table 1.
Time‐integrated activity coefficient and blood volume (BV) fractions from the compartment model
| Organ | Vascular | Tissue | Content | Total | BV% | BV%a |
|---|---|---|---|---|---|---|
| Blood | 4.4E−01 | b | b | 4.4E−01 | 5.6 Lc | 5.3 L c |
| Heart | 2.4E−02 | 1.4E−02 | b | 3.8E−02 | 5.5 | 10.0 |
| Brain | 3.7E−03 | 2.6E−03 | b | 6.3E−03 | 0.8 | 1.2 |
| Lungs | 3.3E−02 | 5.3E−02 | b | 8.6E−02 | 7.4 | 10.5 |
| Liver | 2.7E−02 | 5.9E−01 | b | 6.2E−01 | 6.1 | 10.0 |
| Kidneys | 6.8E−03 | 1.5E−01 | b | 1.6E−01 | 1.5 | 2.0 |
| Spleen | 6.1E−03 | 6.5E−02 | b | 7.1E−02 | 1.4 | 1.4 |
| Small intestine | 6.6E−03 | 9.3E−02 | 6.0E−02 | 1.6E−01 | 1.5 | 3.8 |
| Colon right | 2.1E−03 | 1.1E−02 | 9.8E−03 | 2.2E−02 | 0.5 | |
| Colon left | 1.7E−03 | 6.3E−03 | 3.7E−03 | 1.2E−02 | 0.4 | |
| Colon rectosigmoid | 1.3E−03 | 4.6E−03 | 4.0E−03 | 9.9E−03 | 0.3 | 2.2 |
| Salivary glands | 1.2E−03 | 4.6E−02 | b | 4.7E−02 | 0.3 | d |
| Lacrimal glands | 1.6E−05 | 9.7E−04 | b | 9.9E−04 | <0.01 | d |
| Adrenal glands | 1.0E−04 | 3.6E−04 | b | 4.6E−04 | 0.02 | 0.1 |
| Prostate | 8.3E−04 | 5.5E−03 | b | 6.4E−03 | 0.2 | d |
| Pancreas | 4.9E−04 | 9.2E−03 | b | 9.7E−03 | 0.1 | 6.0 |
| Ventricle | 6.7E−04 | 1.3E−02 | b | 1.4E−02 | 0.2 | 1.0 |
| Testis | 1.1E−04 | 1.3E−03 | b | 1.4E−03 | 0.03 | 0.04 |
| Thyroid | 1.6E−04 | 4.7E−04 | b | 6.3E−04 | 0.04 | 0.1 |
| Skeleton | 3.2E−02 | 1.1E−01 | b | 1.4E−01 | 7.3 | 7.0 |
| Skeletal muscle | 9.3E−02 | 3.7E−01 | b | 4.6E−01 | 21.1 | 14.0 |
| Gallbladder | 0 | b | 9.6E−03 | 9.6E−03 | <0.01 | d |
| Urinary bladder | 5.5E−04 | b | 1.5E−02 | 1.5E−02 | 0.1 | 0.02 |
| Rest‐of‐body | 2.0E−01 | 0.5E−01 | b | 7.2E−01 | 45.5 | d |
Abbreviation: ICRP, International Commission on Radiological Protection.
Values from ICRP Publication 89 (ICRP, 2002).
Not used in model.
Total blood volume in litres.
Not available.
Table 2.
Absorbed and effective dose (ED) coefficients
| Organ | This study | Giesel et al. (2017) |
|---|---|---|
| Adrenals | 37.7 | 19.4 |
| Brain | 3.40 | 7.20 |
| Breast | 10.6 | 8.06 |
| Gallbladder wall | 44.7 | 22.2 |
| Heart wall | 25.6 | 25.1 |
| Kidneys | 84.5 | 170 |
| Lacrimal glands | 97.6 | a |
| Left colon | 20.6 | a |
| Liver | 70.4 | 60.2 |
| Lungs | 23.3 | 11.1 |
| Muscle | 7.44 | 10.0 |
| Pancreas | 38.0 | 19.2 |
| Prostate | 9.09 | a |
| Recto‐sigmoid colon | 17.1 | a |
| Red marrow | 21.6 | 13.3 |
| Right colon | 26.9 | a |
| Salivary glands | 82.9 | a |
| Skin | 6.50 | 7.30 |
| Small intestine | 31.8 | 15.6 |
| Spleen | 66.2 | 73.9 |
| Stomach | 29.1 | 14.2 |
| Testes | 9.42 | 8.37 |
| Thymus | 10.0 | 9.90 |
| Thyroid | 11.0 | 8.50 |
| Urinary bladder wall | 11.6 | 18.7 |
| ED (ICRP 60) | 22.0 | 22.0 |
| ED (ICRP 103) | 24.9 | a |
Note: The data are for men only.
Data are in µGy/MBq except for the ED which is in µSv/MBq.
Abbreviation: ICRP, International Commission on Radiological Protection.
Comparison data are not available.
4. DISCUSSION
In this paper, we present biokinetic and dosimetry data obtained from 12 patients with prostate cancer who underwent 18F‐PSMA‐1007 PET‐CT. The radiopharmaceutical 18F‐PSMA‐1007 has the potential of becoming a widely used tracer and it is, therefore, important to confirm preliminary dosimetry results. The effective dose coefficient (25 µSv/MBq) is close to previous findings from three healthy subjects (Giesel et al., 2017) and to the dose coefficient for 68Ga‐PSMA of 20 µSv/MBq. While optimal injected activity has not been established for either radiopharmaceutical, published studies generally use a higher injected activity for 18F‐PSMA‐1007 (3.0–4.0 vs. 1.8–2.2 MBq/kg). The main advantage of 18F‐PSMA‐1007 is the possibility of large‐scale production in a cyclotron. Low excretion in urine compared to 68Ga‐PSMA is theoretically advantageous but clinical superiority has not been established, possibly due to a higher number of unspecific findings (primarily in bone) (Awenat et al., 2021; Fendler et al., 2017; Ferrari & Treglia, 2021).
When comparing organ absorbed doses between this study and the findings of Giesel et al., the variations are larger (up to a factor of 2, Table 2). The differences cannot be readily explained on a per organ basis, but our study has some advantages: the higher number of patients included (12 vs. 3), more organs segmented for dosimetry (19 vs. 7), and our use of updated software for dosimetry calculations (IDAC‐Dose 2.1 vs OLINDA 1.1). IDAC‐Dose 2.1 uses more realistic voxel phantoms and more recent data for specific absorbed fractions and tissue weighting factors (Andersson et al., 2017).
Determining the dose for the radiation‐sensitive red bone marrow can be difficult. A commonly used method through venous blood sampling assumes that no binding to red bone marrow occurs (Sgouros, 1993). The rising TAC of skeletal tissue (Figure 4) and the concentration of skeletal activity to bone marrow‐containing spaces in PET images show that this method is not valid for 18F‐PSMA‐1007. An alternative method is assuming all skeletal activity is in the bone marrow and extrapolating from parts of the spine (Shen et al., 2002). Having segmented the entire skeleton, we instead assumed the TAC for skeletal tissue to represent bone marrow to avoid extrapolation. We deemed this the most correct method, even if it entails a slight overestimation of the red marrow activity (since a small fraction [≈1%] of the injected activity is free 18F, which accumulates in cortical bone).
We used a whole‐body compartment model to derive TACs for organs. Organ TACs can, thus, interact, indirectly through the blood pool and directly through various routes of excretion/transport. The main advantage of this approach is the simultaneous derivation of all TACs, “keeping track” of all injected activity. This contrasts with the method of curve fitting to mean patient TACs where each organ is considered a separate entity. The model also obtains separate blood TACs for each organ. The derived TACs generally display an excellent fit to the mean activity of patients. Some slight deviations from patient data were seen at late time points, for example, in the kidneys (Figure 4). The downwards turn of the TAC, not seen in patient means, is due to the model allowing excretion of activity from the kidneys into the urine. The effect on dosimetry is small, however, due to physical decay. It should be noted that the purpose of the model is to obtain TACs by fitting time‐activity data for multiple organs in a coherent system. Except for comparing blood fractions to reference values (Table 1), its physiological accuracy has not been evaluated.
Our estimation of the hepatobiliary excretion of 18F‐PSMA‐1007 should, therefore, be considered a rough estimate. The data suggest that urine excretion is minor (8% after 20 h as measured in urine) but not negligible compared to that through bile (15% after 20 h according to the model). The latter value is likely an overestimation. The separation of intestinal activity into tissue uptake and content is highly theoretical. The TAC of tissue activity in the small intestine turns downward after 2 h unlike other tissue curves, which generally rise steadily before reaching a plateau (Figure 4). This suggests an overestimation of the activity in the content of the small intestine which was part of the basis for our estimation of bile elimination. Overall elimination is slow, and the biological half‐time of PSMA‐1007 would far exceed the nuclear half‐life of 18F.
The input into the biokinetic model represents activity at a specific time point. The activity is, however, measured during a time interval, between 4 and 4.5 min (depending on patient length) in the early scans and 27–31 min in the late scans. The activity decay during this time interval is corrected but the redistribution of activity is unknown. This introduces a slight uncertainty in the position of the activity points on the time axis. Late scans have longer scan times but slower redistribution. The integral of the resulting TAC which the absorbed dose depends on should not be significantly affected.
18F‐PSMA‐1007 PET/CT is used clinically only in prostate cancer which limits our material to this patient group. To perform a dosimetric study on patients with cancer introduces the risk of a “sink effect” with high tumour uptake affecting the biodistribution. Activity in the prostate peaked at 0.25% IA. The extraprostatic disease was not quantified but was limited to at most 1–2 lymph nodes. We believe this precludes any significant sink effect in these patients. The most common indication for 18F‐PSMA‐1007 PET/CT is biochemical recurrence after prostatectomy (7/12 patients in this study). We, therefore, calculated dose coefficients without using the prostate as a source organ.
Feet and (for two out of eight scans per patient) hands were not included in the scan protocols. In addition, the top of the skull was accidentally not included in a few scans. The expected activity in these regions is low and would not contribute significantly to the absorbed and effective doses.
To summarize, this study presents dosimetry data for the PET radiotracer 18F‐PSMA‐1007. Previously available data was based on only three subjects. We confirm an acceptable radiation dose for patients using 12 subjects and updated dosimetric models.
CONFLICT OF INTEREST
The authors declare no conflict of interest.
ACKNOWLEDGMENTS
The authors would like to acknowledge Camilla Olofsson, Berit Olsson, and the staff at the Department of Clinical Physiology and Nuclear Medicine, Skåne University Hospital, for their help with patient recruitment and logistics. This study was funded by the Knut and Alice Wallenberg Foundation, the Medical Faculty at Lund University, Region Skåne, The Cancer Research Foundation at the Department of Oncology, Malmö University Hospital, and the Swedish Prostate Cancer Federation.
Hvittfeldt, E. , Bjöersdorff, M. , Brolin, G. , Minarik, D. , Svegborn, S.L. , Oddstig, J. , et al. (2022) Biokinetics and dosimetry of 18F‐PSMA‐1007 in patients with prostate cancer. Clinical Physiology and Functional Imaging, 42, 443–452. 10.1111/cpf.12785
DATA AVAILABILITY STATEMENT
The data that support the findings of this study are available from the corresponding author, Erland Hvittfeldt, upon reasonable request.
REFERENCES
- Andersson, M. , Johansson, L. , Eckerman, K. & Mattsson, S. (2017) IDAC‐Dose 2.1, an internal dosimetry program for diagnostic nuclear medicine based on the ICRP adult reference voxel phantoms. EJNMMI Research, 7, 88. [DOI] [PMC free article] [PubMed] [Google Scholar]
- Awenat, S. , Piccardo, A. , Carvoeiras, P. , Signore, G. , Giovanella, L. & Prior, J.O. et al. (2021) Diagnostic role of 18F‐PSMA‐1007 PET/CT in prostate cancer staging: a systematic review. Diagnostics, 11, 552. [DOI] [PMC free article] [PubMed] [Google Scholar]
- Bingham, C.M. , Castro, A. , Realini, T. , Nguyen, J. , Hogg, J.P. & Sivak‐Callcott, J.A. (2013) Calculated CT volumes of lacrimal glands in normal Caucasian orbits. Ophthalmic Plastic & Reconstructive Surgery, 29, 157–159. [DOI] [PubMed] [Google Scholar]
- Bolch, W.E. , Jokisch, D. , Zankl, M. , Eckerman, K.F. , Fell, T. , Manger, R. et al. (2016) ICRP Publication 133: the ICRP computational framework for internal dose assessment for reference adults: specific absorbed fractions. Annals of the ICRP, 45, 5–73. [DOI] [PubMed] [Google Scholar]
- Fendler, W.P. , Calais, J. , Eiber, M. , Flavell, R.R. , Mishoe, A. & Feng, F.Y. et al. (2019) Assessment of 68Ga‐PSMA‐11 PET accuracy in localizing recurrent prostate cancer: a prospective single‐arm clinical trial. JAMA Oncology, 5, 856–863. [DOI] [PMC free article] [PubMed] [Google Scholar]
- Fendler, W.P. , Eiber, M. , Beheshti, M. , Bomanji, J. , Ceci, F. & Cho, S. et al. (2017) (68)Ga‐PSMA PET/CT: Joint EANM and SNMMI procedure guideline for prostate cancer imaging: version 1.0, European Journal of Nuclear Medicine and Molecular Imaging, 44, pp. 1014–1024. [DOI] [PubMed] [Google Scholar]
- Ferrari, M. & Treglia, G. (2021) 18F‐PSMA‐1007 PET in biochemical recurrent prostate cancer: an updated meta‐analysis. Contrast Media & Molecular Imaging, 2021, 3502389. [DOI] [PMC free article] [PubMed] [Google Scholar]
- Giesel, F.L. , Hadaschik, B. , Cardinale, J. , Radtke, J. , Vinsensia, M. , Lehnert, W. et al. (2017) F‐18 labelled PSMA‐1007: biodistribution, radiation dosimetry and histopathological validation of tumor lesions in prostate cancer patients. European Journal of Nuclear Medicine and Molecular Imaging, 44, 678–688. [DOI] [PMC free article] [PubMed] [Google Scholar]
- Giesel, F.L. , Knorr, K. , Spohn, F. , Will, L. , Maurer, T. , Flechsig, P. et al. (2019) Detection efficacy of 18F‐PSMA‐1007 PET/CT in 251 patients with biochemical recurrence of prostate cancer after radical prostatectomy. Journal of Nuclear Medicine, 60, 362–368. [DOI] [PMC free article] [PubMed] [Google Scholar]
- Herlemann, A. , Wenter, V. , Kretschmer, A. , Thierfelder, K.M. , Bartenstein, P. , Faber, C. et al. (2016) 68Ga‐PSMA positron emission tomography/computed tomography provides accurate staging of lymph node regions prior to lymph node dissection in patients with prostate cancer. European Urology, 70, 553–557. [DOI] [PubMed] [Google Scholar]
- Hofman, M.S. , Lawrentschuk, N. , Francis, R.J. , Tang, C. , Vela, I. , Thomas, P. et al. (2020) Prostate‐specific membrane antigen PET‐CT in patients with high‐risk prostate cancer before curative‐intent surgery or radiotherapy (proPSMA): a prospective, randomised, multicentre study. Lancet, 395, 1208–1216. [DOI] [PubMed] [Google Scholar]
- ICRP . (2002) Basic anatomical and physiological data for use in radiological protection: reference values. A report of age‐ and gender‐related differences in the anatomical and physiological characteristics of reference individuals. ICRP Publication 89. Annals of the ICRP, 32, 5–265. [PubMed] [Google Scholar]
- ICRP . (2007) The 2007 recommendations of the International Commission on Radiological Protection. ICRP Publication 103. Annals of the ICRP, 37, 1–332. [DOI] [PubMed] [Google Scholar]
- Leek, J. , Lench, N. , Maraj, B. , Bailey, A. , Carr, I.M. , Andersen, S. et al. (1995) Prostate‐specific membrane antigen: evidence for the existence of a second related human gene. British Journal of Cancer, 72, 583–588. [DOI] [PMC free article] [PubMed] [Google Scholar]
- Liu, A. , Zhang, M. , Huang, H. , Zhang, C. , Ruan, X. & Lin, W. et al. (2020) Clinical utility of 18F‐PSMA‐1007 positron emission tomography/magnetic resonance imaging in prostate cancer: a single‐center experience. Frontiers in Oncology, 10, 612701. [DOI] [PMC free article] [PubMed] [Google Scholar]
- Mattsson, S. , Johansson, L. , Leide Svegborn, S. , Liniecki, J. , Noßke, D. , Riklund, K.Å. et al. (2015) Radiation dose to patients from radiopharmaceuticals: a compendium of current information related to frequently used substances. Annals of the ICRP, 44, 7–321. [DOI] [PubMed] [Google Scholar]
- Maurer, T. , Gschwend, J.E. , Rauscher, I. , Souvatzoglou, M. , Haller, B. , Weirich, G. et al. (2016) Diagnostic efficacy of (68)gallium‐PSMA positron emission tomography compared to conventional imaging for lymph node staging of 130 consecutive patients with intermediate to high risk prostate cancer. Journal of Urology, 195, 1436–1443. [DOI] [PubMed] [Google Scholar]
- Menzel, H.G. , Clement, C. & DeLuca, P. (2009) ICRP publication 110. realistic reference phantoms: an ICRP/ICRU joint effort. A report of adult reference computational phantoms. Annals of the ICRP, 39, 1–164. [DOI] [PubMed] [Google Scholar]
- Perera, M. , Papa, N. , Christidis, D. , Wetherell, D. , Hofman, M.S. , Murphy, D.G. et al. (2016) Sensitivity, specificity, and predictors of positive (68)Ga‐prostate‐specific membrane antigen positron emission tomography in advanced prostate cancer: a systematic review and meta‐analysis. European Urology, 70, 926–937. [DOI] [PubMed] [Google Scholar]
- Ross, S. (2014) Q.Clear white paper. Waukesha: GE Healthcare.
- Sgouros, G. (1993) Bone marrow dosimetry for radioimmunotherapy: theoretical considerations. Journal of Nuclear Medicine, 34, 689–694. [PubMed] [Google Scholar]
- Shen, S. , Meredith, R.F. , Duan, J. , Macey, D.J. , Khazaeli, M.B. , Robert, F. et al. (2002) Improved prediction of myelotoxicity using a patient‐specific imaging dose estimate for non‐marrow‐targeting (90)Y‐antibody therapy. Journal of Nuclear Medicine, 43, 1245–1253. [PubMed] [Google Scholar]
- Sprute, K. , Kramer, V. , Koerber, S.A. , Meneses, M. , Fernandez, R. , Soza‐Ried, C. et al. (2021) Diagnostic accuracy of 18F‐PSMA‐1007 PET/CT imaging for lymph node staging of prostate carcinoma in primary and biochemical recurrence. Journal of Nuclear Medicine, 62, 208–213. [DOI] [PMC free article] [PubMed] [Google Scholar]
- Sung, H. , Ferlay, J. , Siegel, R.L. , Laversanne, M. , Soerjomataram, I. , Jemal, A. et al. (2021) Global cancer statistics 2020: GLOBOCAN estimates of incidence and mortality worldwide for 36 cancers in 185 countries. CA: A Cancer Journal for Clinicians, 71, 209–249. [DOI] [PubMed] [Google Scholar]
- Trägårdh, E. , Borrelli, P. , Kaboteh, R. , Gillberg, T. , Ulén, J. , Enqvist, O. et al. (2020) RECOMIA—a cloud‐based platform for artificial intelligence research in nuclear medicine and radiology. EJNMMI Physics, 7, 51. [DOI] [PMC free article] [PubMed] [Google Scholar]
- Trägårdh, E. , Minarik, D. , Brolin, G. , Bitzen, U. , Olsson, B. & Oddstig, J. (2020) Optimization of [18F]PSMA‐1007 PET‐CT using regularized reconstruction in patients with prostate cancer. EJNMMI Physics, 7, 31. [DOI] [PMC free article] [PubMed] [Google Scholar]
- Trägårdh, E. , Simoulis, A. , Bjartell, A. & Jogi, J. (2021) Tumor detection of 18F‐PSMA‐1007 in the prostate gland in patients with prostate cancer using prostatectomy specimens as reference method. Journal of Nuclear Medicine, 62, 1735–1740. [DOI] [PMC free article] [PubMed] [Google Scholar]
- Watabe, T. , Uemura, M. , Soeda, F. , Naka, S. , Ujike, T. , Hatano, K. et al. (2021) High detection rate in [18F]PSMA‐1007 PET: interim results focusing on biochemical recurrence in prostate cancer patients. Annals of Nuclear Medicine, 35, 523–528. [DOI] [PMC free article] [PubMed] [Google Scholar]
Associated Data
This section collects any data citations, data availability statements, or supplementary materials included in this article.
Data Availability Statement
The data that support the findings of this study are available from the corresponding author, Erland Hvittfeldt, upon reasonable request.