

Abstract
There has been an increasing trend towards the use of complexity analysis in quantifying neural activity measured by electroencephalography (EEG) signals. On top of revealing complex neuronal processes of the brain that may not be possible with linear approaches, EEG complexity measures have also demonstrated their potential as biomarkers of psychopathology such as depression and schizophrenia. Unfortunately, the opacity of algorithms and descriptions originating from mathematical concepts have made it difficult to understand what complexity is and how to draw consistent conclusions when applied within psychology and neuropsychiatry research. In this review, we provide an overview and entry‐level explanation of existing EEG complexity measures, which can be broadly categorized as measures of predictability and regularity. We then synthesize complexity findings across different areas of psychological science, namely, in consciousness research, mood and anxiety disorders, schizophrenia, neurodevelopmental and neurodegenerative disorders, as well as changes across the lifespan, while addressing some theoretical and methodological issues underlying the discrepancies in the data. Finally, we present important considerations when choosing and interpreting these metrics.
Keywords: complexity, EEG, entropy, fractal dimension, psychopathology
In light of the increasing popularity of complexity analysis in quantifying neural activity measured by electroencephalography (EEG) signals, we provide an overview of existing EEG complexity measures, broadly categorized as measures of predictability and regularity. We also synthesize complexity findings across different areas of psychological science (e.g., neuropsychiatric disorders and consciousness research), addressing theoretical and methodological issues underlying discrepancies in data.
Abbreviations
- ApEn
approximate entropy
- CD
correlation dimension
- DFA
detrended fluctuation analysis
- FD
fractal dimension
- FuzzyEn
fuzzy entropy
- HE
Hurst exponent
- HFD
Higuchi fractal dimension
- KFD
Katz's fractal dimension
- KSE
Kolmogorov–Sinai entropy
- L1
largest Lyapunov exponent
- LE
Lyapunov exponent
- LZC
Lempel–Ziv complexity
- MF‐DFA
multifractal detrended fluctuation analysis
- MFE
multiscale fuzzy entropy
- MMSE
modified multiscale entropy
- MPE
multiscale permutation entropy
- MSE
multiscale entropy
- Multivariate MSE
multivariate multiscale entropy
- R/S analysis
rescaled range analysis
- SampEn
sample entropy
1. INTRODUCTION
Complexity science is an umbrella term encompassing the study and characterization of ‘complex’ systems—systems consisting of multiple interdependent components that operate and interact at different levels (Fernandez et al., 2013). Such complex systems typically exhibit ‘chaotic’ behaviour. Rather than referring to a state of disorder or confusion, a chaotic system is characterized by unpredictability and irregularities, often the result of a multitude of nonlinear interactions (Faure & Korn, 2001). As such, small changes in the system can lead to exponential changes (a property popularized as the ‘butterfly effect’). For instance, the Earth's atmosphere at any point in time and space is the result of a (virtually infinite) number of variables (e.g., temperature, particle composition and cloud density) interacting together, rendering any long‐term projections challenging. Nevertheless, the overarching idea of complexity science is not necessarily to establish methods for making exact predictions, but rather to provide some insights into the characterization of the long‐term trajectory of a given complex system (Faure & Korn, 2001). These principles have its roots in a branch of mathematics called chaos theory (see Thietart & Forgues, 1995 for an overview), which has led several disciplines (e.g., environmental science, meteorology and biology) to adopt the framework of complex dynamical systems (Burggren & Monticino, 2005; Kiel & Elliott, 1996).
The application of complexity science to nonlinear systems, referred to as ‘nonlinear dynamics’, is an emerging approach gaining traction in the study of human physiology and pathology (Ehlers, 1995). The theoretical conceptualization of the human physiological system as complex is warranted given that it is made up of multiple constituent subsystems (be it anatomical components or physiological processes) that are constantly interacting between themselves at different levels (i.e., from molecules to organs), as well as with the external environment to maintain homeostasis (Faure & Korn, 2001). The underlying assumptions are that physiological systems are inherently complex (Golbeter, 1996) and that pathological states (or ‘dynamical diseases’, see Mackey & Glass, 1977) can be characterized by disrupted or abnormal dynamic processes. One of the seminal works that contributed to this perspective was Lipsitz and Goldberger (1992), who demonstrated that aging and disease are associated with a generalized loss of physiological complexity due to functional and/or structural alteration in the underlying organization of the physiological system (see Vaillancourt & Newell, 2002 for a schematic illustration of this idea).
2. PHYSIOLOGICAL COMPLEXITY
The applications of complexity science have been largely centred on electrophysiological signals (Goldberger et al., 1985), as they confer sufficiently high temporal resolution for sensitive characterization of the chaotic nature of biological activity (Bornas, 2017; Fernandez et al., 2013). These research efforts initially focused on quantifying physical diseases, such as using the complexity of heart rate variability (HRV, Pham et al., 2021) to predict cardiovascular complications (Acharya et al., 2015; Khandoker et al., 2009; Song et al., 2014; Tang et al., 2015). Adherents of complexity science subsequently argued for its utility in the context of neuropsychiatric diseases and mental states characterization (An der Heiden, 2006; Tretter et al., 2011). While there are mixed results regarding the direction of change in neural complexity in diseased states, diminished complexity has been typically observed in the physiological states of individuals with psychopathological illnesses (e.g., lower HRV complexity observed in depression, Leistedt et al., 2011; Schulz et al., 2010; schizophrenia, Bar et al., 2007; and bipolar disorders, Henry et al., 2010), as well as in their associated symptoms (e.g., greater predictability in cognitive tasks, Paulus et al., 1996; mood fluctuations, Gottschalk et al., 1995; and psychotic symptoms, Paulus & Braff, 2003).
Propelled by mathematical innovations facilitating complexity analyses for multichannel signals (i.e., magneto/electroencephalography [M/EEG]), the evidence of ‘chaotic’ patterns has been since demonstrated beyond the behavioural and peripheral levels to include the neurophysiological level. In particular, the use of EEG for understanding the brain's complex dynamics has been growing in popularity. Indeed, there has been an acceleration in the number of studies attempting to delineate maladaptive psychopathological mechanisms by investigating EEG complexity in various experimental conditions, from sleeping (e.g., Chouvarda et al., 2010) and anaesthetic states (e.g., Zhang et al., 2001), to tasks that involve responding to emotional stimuli (e.g., Aftanas, Lotova, Koshkarov, Popov, & Makhnev, 1997) and mental arithmetic (e.g., Mohammadi et al., 2016). Complexity measures of EEG signals may supplement, if not provide greater utility and sensitivity than conventional EEG analysis techniques (such as event‐related potentials or time/frequency analysis) in detecting changes in psychopathological states (Sohn et al., 2010) and potentially expediting diagnosis of diseases (Czigler et al., 2008). However, there is currently a mismatch between the rapid growth of such applications and the presence of comprehensive reviews needed to guide psychological researchers in the use of EEG complexity measures.
Despite the potential of neurophysiological complexity analysis in studying normal and abnormal psychological states and mechanisms, several limitations hinder its development. First, the strong mathematical nature of the field often makes methodologies and findings opaque to most psychology and neuroscience researchers (Yang & Tsai, 2013). Second, although most findings in physical diseases support the idea that a loss of complexity signifies deficient (or unhealthy) states and/or systems (Mackey & Glass, 1977), this notion does not fully concur with the existing literature. Based on existing reviews of complexity findings in several neuropsychiatric conditions (de Aguiar Neto & Rosa, 2019; Fernandez et al., 2013; Sun et al., 2020), researchers have not unanimously found a decrease in brain complexity across different psychiatric populations (Yang & Tsai, 2013). Hence, the aim of this paper is twofold: (1) to provide an entry‐level explanation of the complexity measures and (2) to synthesize findings on EEG complexity across different areas of psychology and neuropsychiatry, highlighting methodological issues that may contribute to the existing discrepancies in the literature. Rather than providing an exhaustive list of complexity metrics (an endless endeavour given that new indices are developed on a regular basis), the focus of this paper is to summarize and provide a framework for understanding the main concepts and findings of EEG complexity to foster future advancements in this area.
3. QUANTIFYING COMPLEXITY
Complexity metrics can be conceptualized as reflecting two aspects of the dynamics of a system, namely, (1) predictability and (2) regularity. Though these two terms have often been used interchangeably in the literature, predictability and regularity are, at the coarse‐grain level, two distinct characteristics of a chaotic system. Predictability of a dynamical system describes the temporal evolution of the system states whereas regularity describes the general amount of repetitions of patterns in the system's trajectory. Predictability can be thought of focusing on the process underlying the chaotic system while regularity corresponds to the product of that process. While we discuss the complexity metrics according to these two categories to facilitate conceptual understanding, readers should keep in mind that the two concepts remain strongly related in practice.
3.1. Predictability
Methods that primarily capture the predictability of a dynamical system focus on evaluating the correlation present in the temporal evolution of its associated time series. Based on their algorithms, these methods can be further categorized into two subgroups (see Figure 1): (A) Spatial dimensionality requires a reconstruction of the ‘state space’ (see below) of the time series before estimating its predictability, and (B) temporal dimensionality characterizes the predictability of a dynamical system directly from the signal time series. In the context of EEG signals, these methods allow for the extraction of information underlying their cortical dynamics, where lower complexity of these dynamics (i.e., more predictable) may be driven by factors like a loss of neural connectivity and less activations of neural networks in diseased states like neurodegeneration (Jeong, 2002).
FIGURE 1.
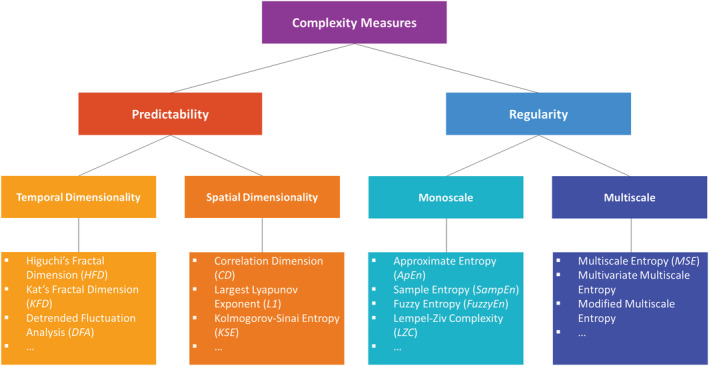
Complexity measures can be structured broadly into indices of predictability and regularity. Measures of predictability capture either spatial or temporal dimensionality of the dynamical system, and measures of regularity reflect the complexity of the system's output either on single scales or multiscales.
3.2. Spatial dimensionality
Complex systems can be mathematically modelled by a set of differential equations, referred to as dynamic variables. These variables can be represented in a coordinate system called the state space where each isolated point in the space (a state vector) represents a system state. As it is beyond the scope of this paper to describe the reconstruction of the state space from the time series, readers can find these details in Deyle and Sugihara (2011). Extending from the concept of state space, the phase space is another coordinate system that captures the evolution of the states over time. Each point of the phase space represents a system state at a given time instant. If the dynamical system being modelled is a real‐world signal (e.g., biological signal), after a long enough time, the evolution of the dynamic variables will reach an equilibrium where the dynamical system is bounded by a subset of the states with physical significance called the attractor (see Figure 2). The geometry of the attractor constructed from a biological signal captures the unique information about the dynamic nature of the underlying physiological system, beyond what traditional signal analysis in time and frequency domains can describe. As such, most of the spatial dimensionality indices described below actually refer to characterizations of the geometric shape of the reconstructed attractor (hence the ‘spatial dimensionality’ denomination).
FIGURE 2.
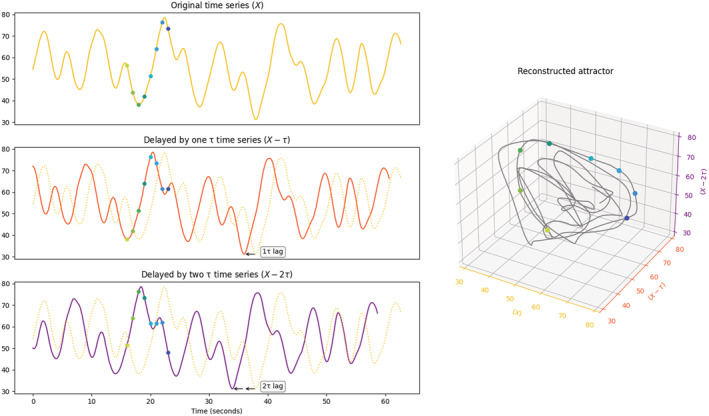
Time‐delay embedding method to reconstruct an attractor in the phase space with delay (τ) = 2 and number of dimensions (m) = 3. The top left panel shows an example of a simulated signal. The middle left panel is the time series but delayed by 1 τ of 2 s. the bottom left panel is the time series delayed by 2 τ. the three time series are projected to a 3D space where each state vector (solid point) is plotted with the coordinates provided by the respective time series, forming an attractor (see plot on the right).
One of the important geometric features of an attractor is its dimensionality (referred to as fractal dimensionality), which is different and more informative than the usual concept of (topological) dimensionality. Mathematically, fractal dimensions (FDs) define the minimum number of coordinates needed to locate any point within the phase space and can be interpreted as a measure of the structural complexity of a dynamical system. Correlation dimension (CD, also referred to as D2) is one such FD index (Grebogi et al., 1986). By estimating the probability of any two pairs of points on the attractor separated by a distance smaller than a predefined value, CD sets the lower bound to the actual number of dimensions of the attractor, which in turn indicates the number of independent variables needed to model the system (Ding et al., 1993; Grebogi et al., 1986). Generally, the larger the CD of a biological signal, the more complex the dynamics of the underlying physiological system.
The complexity of a system can also be measured by a set of Lyapunov exponents (LEs) which describe the system's predictability and stability. Mathematically, LE is quantified as the rate of exponential separation with time of two initially neighbouring points on the attractor (Wolf et al., 1985). Positive and negative values of LE correspond to whether the trajectories of the states exponentially diverge or converge over time. Visually, it characterizes the stretching and shrinking of the phase space respectively. While a system can have multiple LEs, the predictability of the system is mainly determined by the largest LE value (L1). Similar to CD, a larger L1 is suggestive of a more complex signal.
Another important measure also derived from the quantification of the reconstructed attractor is the Kolmogorov–Sinai entropy (KSE, Sinai, 1959). Although originating from information theory (which will be discussed later), KSE can be defined, with respect to the spatial dimensionality perspective, as the rate at which two points that were initially close in the phase space move apart. This definition strongly aligns with that of LE since both measures seek to quantify the changes in volume (stretching/shrinking) of the phase space over time (Kamizawa et al., 2014). In fact, KSE is related to the sum of all positive LEs, which intuitively translates to the total amount of divergence of the temporal trajectories of the states (Pesin, 1977). Generally, a more positive KSE reflects a less predictable system.
3.3. Temporal dimensionality
While the methods under the spatial dimensionality group estimate the complexity of the signals by quantifying the characteristics of the attractor, the methods under the temporal dimensionality group directly treat the time series itself as a geometric figure.
For instance, the Higuchi's fractal dimension (HFD) is another common FD index. However, unlike CD, which approximates the FD of a physiological system indirectly from the phase‐space reconstruction, HFD calculates the FD directly from the time series (Higuchi, 1988) and is therefore faster and more efficient. Additionally, contrary to other indices such as CD, that assumes signal stationarity (a condition usually not fulfilled by neurophysiological signals), HFD, which does not share this assumption, provides in this context a more accurate estimation of FD (Accardo et al., 1997; Spasic et al., 2011).
Similar to HFD, Katz's fractal dimension (KFD) also estimates FD directly from the time series. In various comparisons of their performances, HFD generally has a higher accuracy, while KFD tends to underestimate the true value of the FD of a system (Castiglioni, 2010; Esteller et al., 2001; Shi, 2018). While both methods are equally efficient for short recording lengths, HFD becomes increasingly more efficient than KFD as the length increases (Esteller et al., 2001). Nevertheless, KFD is shown to be less sensitive to noise and more consistent at discriminating different states of brain function or different fractal features (Esteller et al., 2001; Shi, 2018). In other words, for short recording lengths, and/or when estimating changes in FD is more important than its exact quantification, KFD is considered as a more desirable method as compared with HFD.
A phenomenon that is closely related to FD is the Hurst exponent (HE, Hurst, 1951; Mandelbrot & Wallis, 1969). Both FD and HE seek to approximate the temporal correlation properties of a system. However, while FD represents the structural complexity of the dynamical structure over shorter periods, HE is a measure of the complexity over longer periods (Gneiting & Schlather, 2004). The two most popular estimators of HE are the rescaled range (R/S) analysis (Bassingthwaighte & Raymond, 1994; Hurst, 1951) and the Detrended Fluctuation Analysis (DFA, Peng et al., 1995). As DFA measures the fluctuations of the trends rather than of the signal ranges, it is naturally more sensitive to non‐stationarity (i.e., local trends) than the R/S analysis and thus more suitable and commonly used for the analysis of biological signals (Grech & Mazur, 2004; Krivstoufek, 2010). In essence, DFA derives a single scaling exponent, , that describes how signal fluctuations in short windows of time are related to the fluctuations observed in larger windows of time. The details about its computational steps can be found in Peng et al. (1995) and Hardstone et al. (2012). In general, for a biological signal and for , the closer the value of DFA exponent to 1, the more complex the dynamical system. For , the higher the DFA exponent value, the less complex the dynamical system.
DFA was originally formulated as a monofractal index where a single scaling exponent is computed to characterize a time series and which assumes that the DFA exponent is homogeneous over the entire time series. However, mounting evidence has suggested that our biological dynamics are, in fact, multifractal (Racz et al., 2018; Sassi et al., 2009; Suckling et al., 2008; Xue & Bogdan, 2017), rendering a single scaling exponent inadequate to capture their true dynamical nature (Ihlen & Vereijken, 2010). Therefore, DFA has been extended under the term multifractal DFA (MF‐DFA), in which multiple exponents (i.e., multifractal exponents) are computed (Ihlen, 2012; Ihlen & Vereijken, 2010; Kantelhardt et al., 2002). The degree of multifractality of a time series can be quantified with statistical metrics such as the mean or range of the exponent value (mean or max–min ) (Vergotte et al., 2018; Zorick & Mandelkern, 2013). A higher degree of multifractality is often associated with a greater number of interacting underlying networks or mechanisms (Torre et al., 2019; Vergotte et al., 2018).
3.4. Regularity
Methods that capture the regularity of a dynamical system focus on evaluating the presence of repetitive patterns in the time series. Most of the common metrics categorized under this group belong to a family of statistics called entropy, which corresponds to the amount of uncertainty present in a system (Cover & Thomas, 2006). As such, the regularity indices describe the regularity of a dynamical system by approximating the amount of (un)certainty present in the inference about the trajectory of an entire system, such as that of chaotic neuronal firing. For instance, greater magnitudes of these indices assessed from EEG signals of schizophrenia patients have been taken to imply a higher level of uncertainty (and hence, lower regularity), or in more technical terms, an increase in the probability that new time series patterns are generated in the brain (Xiang et al., 2019). One of the first application of entropy into the study of complexity resulted in the formulation of KSE (Sinai, 1959), described above. Nevertheless, unlike other entropy indices, KSE is not categorized as a regularity index since its theoretical foundation is more akin to that of the aforementioned indices in the predictability group.
While KSE or other spatial dimensionality measures such as CD and LE require a full reconstruction of the attractor, approximate entropy (ApEn) can work with a lower resolution of phase space, trading off details for robustness; the sacrifice of resolution allows ApEn to be applicable to time series that are noisier, or of smaller sizes—those for which KSE could not be reliably computed (Delgado‐Bonal & Marshak, 2019; Pincus, 1995; Pincus & Goldberger, 1994). Generally, higher ApEn values indicate more independence between the data points, that is, a lower number of repetitive patterns (lower regularity), and thus a higher level of complexity. However, regardless of its robustness, ApEn's tendency to overestimate the level of regularity in the signal (Al‐Angari & Sahakian, 2007; Delgado‐Bonal & Marshak, 2019; Xie et al., 2008) has led to the proposal of another regularity index, sample entropy (SampEn, Richman & Moorman, 2000). SampEn can be interpreted in a similar fashion as ApEn, but is formulated differently so that not only does it address the root cause of ApEn's bias, it is also less affected by the length of the time series (Henriques et al., 2020).
However, as both ApEn and SampEn rely on a single constant parameter to evaluate the repetitiveness of the patterns present in the signals, both indices have been shown to be significantly sensitive to the value of the chosen parameters used to compute them (Castiglioni & Di Rienzo, 2008; Liu et al., 2010). An alternative way of measuring repetitiveness was proposed where an exponential function (i.e., fuzzy function, Zadeh, 1996) was used instead of a fixed constant, leading to the formulation of another entropy‐based measure named Fuzzy entropy (FuzzyEn, W. Chen et al., 2009). Generally, FuzzyEn has been shown to outperform SampEn in its stability and ability to discriminate physiological systems with hypothesized differences in complexity (Simons et al., 2018; Tibdewal et al., 2017).
A common characteristic of ApEn, SampEn and FuzzyEn is that they infer the level of complexity from the regularity of the signal at the original time scale (single‐scale based). Though relatively efficient, critics believe that this single‐scale approach might prevent them from thoroughly capturing the complex nature of biological systems, as their signals hold different meanings at various spatial and temporal scales (Busa & van Emmerik, 2016; Costa et al., 2002, 2005; Yakovleva et al., 2020). Thus, to accurately estimate the multiscale spatiotemporal complexity of physiological signals, Costa et al. (2002) introduced a new entropy‐based measure called multiscale entropy (MSE). This index is obtained from computing SampEn on multiple scales that are derived from the original signal through the means of coarse graining (i.e., downsampling). Recognizing the appropriateness of the multiple‐scale approach in the study of physiological signals, newer MSE‐based indices have also been proposed. Some examples include the multiscale permutation entropy (MPE) where permutation entropy is used instead of SampEn (Aziz & Arif, 2005; Davalos et al., 2019), multiscale fuzzy entropy (MFE, Zheng et al., 2014), refined MSE where time scales are defined more rigorously (Valencia et al., 2009), multivariate MSE which is more appropriate for multichannel signals such as EEG (Ahmed & Mandic, 2011; Azami et al., 2017) and modified MSE (MMSE) where the variance, instead of the mean, is used in the coarse graining process (Costa & Goldberger, 2015). This multiscale approach has also been incorporated into the MF‐DFA algorithm (Gieraltowski et al., 2012) to improve its validity. Even though new multiscale‐based indices are continually introduced, each attempting to address limitations of previous indices, their relative performance has not yet been formally investigated.
Another regularity index that is popular in the examination of biological dynamical systems is the Lempel–Ziv complexity (LZC, Lempel & Ziv, 1976). Unlike the other indices under this category, LZC is not based on entropy but originates from a family of techniques that maps time series into sequences of symbolic representations. Simply put, the regularity of the signal is determined through scanning the symbolic sequences for new patterns, increasing the complexity count every time a new sequence is detected. As compared with other complexity measures, LZC is relatively less computationally expensive, easy to implement and can be applied directly on biological signals without any preprocessing steps (Aiordachioaie & Popescu, 2020; Zhang et al., 2001). Therefore, even though the performance of LZC relative to other indices remains indeterminate (Aiordachioaie & Popescu, 2020; Fathillah et al., 2017; Ibanez‐Molina et al., 2015), it has been applied extensively in various fields. The next section summarizes and discusses the quantification of brain dynamical complexity in the fields of psychology and neuroscience.
4. BRAIN COMPLEXITY IN PSYCHOLOGY AND NEUROSCIENCE
One important distinction when it comes to the application of complexity analysis to biological systems is the distinction between complexity and randomness (see Figure 3). While both complex and random systems can generate ‘seemingly’ unpredictable and irregular outputs (indexed by different complexity measures), Grassberger (2012) and other researchers emphasized the importance of the meaningfulness that underlies a complex system, which is absent from a random system (Goldberger et al., 2002; Yang & Tsai, 2013). However, given our current understanding of the physical meaning of different complexity measures, the distinction between pure measures of randomness and meaningful measures of complexity remains fuzzy at best, especially in the context of physiological systems. This may partly explain the contradictory findings in the literature, as higher values of complexity indices could indicate either a more complex system, or a more random system (de la Torre‐Luque et al., 2016).
FIGURE 3.
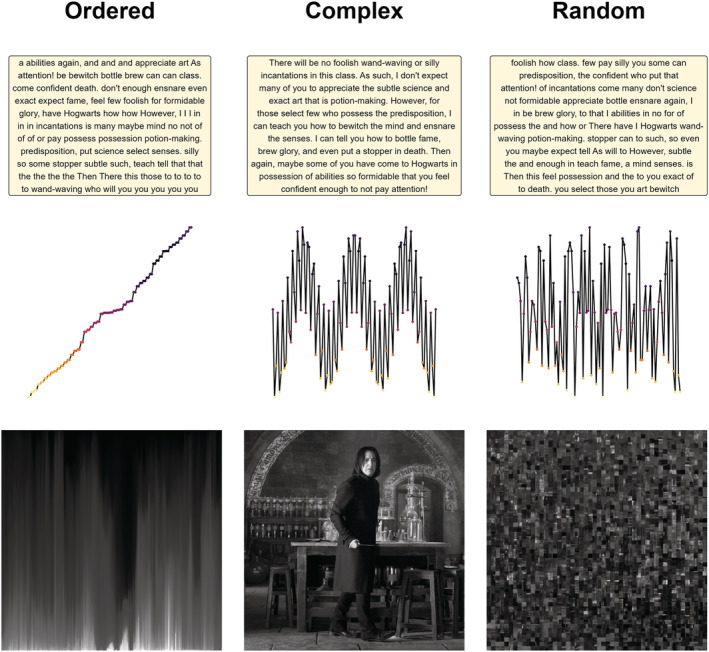
Illustrations of the difference between complexity, order and randomness, using various examples, namely, text, signal and pictorial examples. In the text example, words are arranged in alphabetical order in the ordered output, indiscriminately arranged in the random output and structured according to semantic and syntactic rules in the complex output. In the signal example, the ordered signal contains data points sorted according to amplitude, the random signal consists of data points sampled at random and the complex signal is a mixture of signals of multiple frequencies. In the pictorial example, pixels are vertically ordered by luminance in the ordered output, scrambled in the random output, and the complex arrangement of pixels creates a meaningful picture. The aim is to show that complex is not synonymous with random, an important conceptual distinction in complexity science.
4.1. Schizophrenia
Of all psychopathological disorders, schizophrenia has been the most widely studied in terms of brain complexity (Yang & Tsai, 2013)—unsurprisingly—as the wide range of positive and negative symptoms resulting in multifaceted manifestations makes schizophrenia an ideal candidate for complexity investigations (Yang & Tsai, 2013). Researchers have expected altered brain dynamics in schizophrenia as a consequence of abnormal fluctuations in dopamine levels (An der Heiden, 2006). Interestingly, both increases and decreases in neural complexity have been frequently reported in schizophrenia populations. Diminished EEG complexity has been observed with several measures (see Table 1). This decrease in complexity, especially in the frontal areas of the brain (Akar, Kara, Latifoglu, & Bilgic, 2015a, 2015b; Jeong, Kim, Chae, et al., 1998; Kim et al., 2000; Raghavendra et al., 2009) may be interpreted as a reduction in information processing and inflexible neural networks (Kim et al., 2000). This is consistent with previous neuroimaging findings regarding hypofrontality (i.e., abnormal underactivation of frontal regions, Gattaz et al., 1992) in schizophrenia patients, which has been linked to the severity of negative symptoms, such as blunted affect, abulia and asociality (Wolkin et al., 1992). On the other hand, there is also an equally large number of studies indicating increased EEG complexity in schizophrenia, demonstrated through L1 during REM sleep (Roschke et al., 1995), MSE during resting state (Takahashi et al., 2010) and various other measures during different mental tasks (see Table 1).
TABLE 1.
List of EEG complexity measures used in schizophrenia research
| Psychological state/condition | EEG complexity | Measures |
|---|---|---|
| Schizophrenia | Healthy controls > schizophrenia |
L1 (Akar, Kara, Latifoglu, & Bilgic, 2015a; Kim et al., 2000; Kutepov et al., 2020; Rockstroh et al., 1997) HFD (Raghavendra et al., 2009; Sabeti et al., 2009) KFD (Akar, Kara, Latifoglu, & Bilgic, 2015b) LZC (Sabeti et al., 2009) |
| Schizophrenia > healthy controls |
L1 (Roschke et al., 1995) MSE (Takahashi et al., 2010) LZC (Y. Li et al., 2008, Ibanez‐Molina et al., 2018) ApEn (Thilakvathi et al., 2017) |
|
| Severe and acute > mild schizophrenia | CD (Koukkou et al., 1993) |
One hypothesis to explain these contradictory results was put forth by S.‐H. Lee et al. (2008), who observed that increased complexity was more typically reported in patients with a more recent onset of schizophrenia, that were also younger, pre‐medicated and with more positive symptoms. This was corroborated by Raghavendra et al. (2009) who underscored symptomatology as an important factor, demonstrating that individuals with positive symptoms exhibited similar or greater HFD values than healthy controls, whereas those with negative symptoms had lower complexity scores. At first glance, this finding may seem contrary to the idea that healthy physiological systems are always indexed by greater complexity (Lipsitz & Goldberger, 1992). However, as mentioned above, this unidirectional view of physiology cannot be accommodated by existing measures of complexity, which can generate equally high indices from both random and complex systems (such as LZC, discussed in later sections). In the case of schizophrenia, extremely high values of complexity could be indicative of greater polyrhythmic, disorganized brain activity, particularly in patients with active psychosis (Fingelkurts et al., 2006), which can be interpreted as greater randomness (de la Torre‐Luque et al., 2016). This thus suggests a breakdown in the functional integration of schizophrenia brains (see disconnection syndrome hypothesis, Friston, 2002) with cortical desynchronization manifesting as positive symptoms (e.g., hallucinations and delusions). Consistent with this, Koukkou et al. (1993) reported that schizophrenia patients who were in remission and were free from antipsychotic medication had lower CD values than first‐episode, pre‐medication acute patients. Another important aspect of schizophrenia research is investigating task‐related changes in neural complexity. A few studies have made progress in this, showing that schizophrenia patients exhibit less complexity change than healthy controls in response to stimulus presentation, indicating lower reactivity during information processing in patients (FuzzyEn, Bachiller et al., 2015; LZC, Ibanez‐Molina et al., 2018; Spectral Entropy, Xiang et al., 2019). Further research using event‐related paradigms may provide further insight on the mechanisms underlying abnormal cognition in schizophrenia and their relationship with neural complexity.
Overall, while it is certain that neural complexity levels in schizophrenia differ from healthy controls, the direction of change is modulated by several factors, such as positive symptoms that increase complexity and antipsychotic agents that attenuate complexity level.
4.2. Mood and anxiety disorders
Relatedly, several researchers have long underscored the association between enhanced cortical dynamics, healthy cognitive functioning and emotional regulation (Aftanas, Lotova, Koshkarov, Pokrovskaja, et al., 1997; Aftanas, Lotova, Koshkarov, Popov, & Makhnev, 1997; Carlino et al., 2012; Gregson et al., 1993; Lamberts et al., 2000; Martinez‐Rodrigo et al., 2019; McIntosh et al., 2008). As cognitive and emotional dysregulation are transdiagnostic markers of mood and anxiety disorders (Holtzheimer & Mayberg, 2011), one might expect lower neural complexity in these patient populations as compared with their healthy counterparts. However, as with the literature on schizophrenia, conflicting trends in mood and anxiety disorders also appear to challenge the unidirectional notion of complexity as being adaptive.
Depression is a disorder characterized by dysthymia and anhedonia, reinforced by inflexible cognitive patterns manifesting primarily as negative ruminations (Holtzheimer & Mayberg, 2011). Studies have reported overall lower values of complexity in the EEG signals of individuals with depression as compared with healthy controls (see Table 2). This may be explained by maladaptive emotion regulation (ER) styles (e.g., self‐blaming and rumination, Bornas et al., 2013) and a tendency to fixate on negative emotional states (Holtzheimer & Mayberg, 2011), both of which have been associated with lower EEG complexity.
TABLE 2.
List of EEG complexity measures used in mood and anxiety disorders research
| Psychological state/condition | EEG complexity | Measures |
|---|---|---|
| Post‐traumatic stress disorder (PTSD) | Healthy controls > PTSD | CD (Chae et al., 2004) |
| Depression | Healthy controls > depression |
LZC (Kalev et al., 2015) DFA (values close to .5, Bachmann et al., 2017) |
| Depression > healthy controls |
KFD (Akar, Kara, Agambayev, & Bilgic, 2015) HFD (Akar, Kara, Agambayev, & Bilgic, 2015; Bachmann et al., 2018; Cukic et al., 2020; Mahato & Paul, 2019) DFA (values close to 1, Lee et al., 2007) SampEn (Cukic et al., 2020) LZC (Akar, Kara, Agambayev, & Bilgic, 2015; Bachmann et al., 2015; Li et al., 2008) |
|
| Severe > mild depression |
DFA (values close to 1, Lee et al., 2007) LZC (Mohammadi & Moradi, 2021) FuzzyEn (Mohammadi & Moradi, 2021) KSE (Thomasson et al., 2000) |
|
| Bipolar mood disorders | BMD > healthy controls | HFD (Bahrami et al., 2005) |
| Anxiety disorders | Anxiety disorders > healthy controls |
CD (Wang et al., 2016) L1 (Bob et al., 2006) |
However, several other studies report an opposite trend (see Table 2) across different paradigms such as resting state (Bachmann et al., 2015), mental arithmetic tasks (Li et al., 2008) and emotional stimuli tasks (Akar, Kara, Agambayev, & Bilgic, 2015). Positive relationships between the severity of depressive symptoms and various EEG complexity indices have also been reported (see Table 2), with treatment associated with greater complexity reductions (Thomasson et al., 2000). Moreover, Mendez et al. (2012) demonstrated that antidepressant treatment reduced LZC (MEG signals) in unmedicated depressed patients (who had higher pre‐treatment LZC scores than healthy controls) and that these complexity reductions were correlated with the extent of symptom remissions. With regard to this, Mohammadi and Moradi (2021) hypothesized that more severe depressive symptoms are associated with lower connectivity across different brain regions, in turn giving rise to greater randomness in brain activity. Nevertheless, the attempts to explain conflicting findings in the complexity literature do not sufficiently account for factors like symptomatology and severity, which may be critical in understanding the discrepancies.
These contradictory findings have also been observed in other mood and anxiety disorders which have received significantly less attention in the field of EEG complexity. For instance, under resting state, generalized anxiety disorder (GAD) was found to be associated with higher CD values (Wang et al., 2016), but post‐traumatic stress disorder (PTSD) was conversely associated with globally diminished CD (Chae et al., 2004). A mechanistic interpretation based on different modes of information processing may help to clarify this inconsistency (Molle et al., 1999). Indeed, the dominant mode of cognitive processing in GAD patients may be more akin to mind wandering and divergent thinking (e.g., catastrophizing, Schoenberg, 2020) whereas in PTSD, where individuals are under a state of hyperarousal, and excessively focused on traumatic memories, information processing may be more rigid (Chae et al., 2004). However, it is important to note that these interpretations may be specific to the neural complexity during resting state, which entails spontaneous information processing (Bob & Svetlak, 2011), as some evidence indicates that being under active states of anxiety, such as during the processing of stressful memories, results in greater neural complexity than at rest (L1 in panic disorder patients, Bob et al., 2006).
Given the prevalence of comorbidities and heterogeneity of mood and anxiety disorders, inconsistency in the literature may be partially due to the classification of disorders as specific diagnostic entities. One starting point may be to distinguish between episodes of the disorder (e.g., Cukic et al., 2020). For example, some preliminary evidence shows that in bipolar mood disorder, manic episodes are higher in EEG complexity than depressive episodes (Bahrami et al., 2005; Thomasson et al., 2002). Alternatively, a transdiagnostic approach may be more useful in understanding how EEG complexity relates to different psychopathological symptoms (Dalgleish et al., 2020). As a complex interplay of biopsychosocial processes underlie these disorders, investigating neural complexity based on their common factors and processes (whether psychological, environmental or biological), rather than traditional diagnostic boundaries, may help us better understand the relationship between complexity and mental health difficulties. Currently, there is no existing study relating EEG complexity to transdiagnostic markers of mood and anxiety disorders. The EEG complexity literature insofar has largely focused on depression more than any other affective/anxiety disorder. The scarce results from these other disorders, on top of the different interpretations put forth by authors for conflicting findings, means that it is still premature to conclude what this means about the brain's adaptation to environmental changes in mood and anxiety disorders.
4.3. Neurodevelopmental and neurodegenerative disorders
There are also reasons to suspect a reduction in EEG complexity in autistic spectrum disorder (ASD), a disorder characterized by a repertoire of unvaried behaviours, stereotyped thoughts and interests. Initial evidence for this comes from investigations using MMSE, which was found to be reduced in adults with ASD during a mental task (Catarino et al., 2011), and in infants at high risk of developing ASD during resting‐state EEG (Bosl et al., 2011) as compared with control subjects. MSE was also able to discriminate mild from severe ASD, with the latter displaying lower entropy levels (Hadoush et al., 2019). Recently, Kang et al. (2019) demonstrated diminished patterns of several entropy measures (see Table 3) in frontal, temporal and central regions in ASD children, pointing to possible neural underconnectivity and dysfunctional integration in these areas, which have been reported by other studies using EEG power spectrum and coherence analyses (Coben et al., 2008; Murias et al., 2007).
TABLE 3.
List of EEG complexity measures used in neurodevelopmental and neurodegenerative disorders research
| Psychological state/condition | EEG complexity | Measures |
|---|---|---|
| Autistic spectrum disorder (ASD) | Healthy controls > ASD |
MMSE (Bosl et al., 2011; Catarino et al., 2011) SampEn, FuzzyEn (Kang et al., 2019) |
| Mild > severe ASD | MSE (Hadoush et al., 2019) | |
| Attention deficit hyperactivity disorder (ADHD) | Healthy controls > ADHD |
ApEn (Chen et al., 2019; Khoshnoud et al., 2018; Sohn et al., 2010) SampEn (Chen et al., 2019) |
| ADHD > healthy controls |
ApEn (Mohammadi et al., 2016) HFD (Mohammadi et al., 2016) LZC (Zarafshan et al., 2016) |
|
| Alzheimer's disease (AD) | Healthy controls > AD |
L1 (Jeong et al., 2001; Jeong, Kim, & Han, 1998; Stam et al., 1995) CD (Besthorn et al., 1995; Jeong, Kim, & Han, 1998; Pritchard et al., 1991; Stam et al., 1995) LZC (Abasolo et al., 2006) HFD (Nobukawa et al., 2019; Smits et al., 2016) MSE (Ando et al., 2021; Mizuno et al., 2010; Park et al., 2007) |
| Mild > moderate > severe AD | MSE (Fan et al., 2018; Yang et al., 2013) |
As for attention deficit hyperactivity disorder (ADHD), the few studies that employed complexity measures show that children with ADHD exhibit lower EEG entropy during resting relative to healthy controls (see Table 3), with some disagreements regarding which regions of the brain elicit the greatest differences (ApEn in frontal regions, Fernandez et al., 2009; Khoshnoud et al., 2018; Sohn et al., 2010; vs. ApEn and SampEn in occipital regions, Chen et al., 2019). Other indices like LZC (Fernandez et al., 2009) and FuzzyEn (Monge et al., 2015) are also reportedly lower in ADHD when applied to resting‐state MEG signals, but no similar results have been found with EEG yet. In light of this, proponents have suggested that a deficit in the allocation of attentional resources (i.e., poor sustained attention, Robertson et al., 1997) leads to insufficient levels of cortical activation, subsequently resulting in diminished neural complexity (Clarke et al., 2001; Sohn et al., 2010). However, findings are less clear when ADHD children are placed under conditions of various cognitive tasks. It has been reported that during auditory attentional tasks, ADHD children display lower neural complexity than healthy controls in right frontal regions, while other studies show an opposite trend of greater complexity in ADHD groups across different brain regions during visual and arithmetic processing (see Table 3 ). These discrepancies may be attributed to specific task requirements and the brain region of interest (such as those responsible for higher order planning vs. pure attentional deficits). Given the heterogeneity of ADHD dysfunctions, it may be important to delineate between ADHD subtypes and their common co‐occurring neurodevelopmental conditions. The first attempt to do so came from a recent study by Tor et al. (2021), who found several entropy measures (including MMSE) to be higher in children with conduct disorder (i.e., rule breaking, violent and antisocial behaviour), though there seemed to be little differences between the ADHD‐only group and the group with ADHD and conduct disorder comorbidities, a pattern that makes it difficult to draw any clear interpretations. That being said, distinguishing between different neurodevelopmental disorders (many of which have shared behavioural symptoms) with complexity measures is still in its beginning stages, and the mechanisms underlying any potential differences in neural complexity remain unclear (H. Chen et al., 2019). In sum, although resting‐state EEG complexity is commonly attenuated in ADHD children relative to healthy controls, task‐based paradigms have generated mixed results and the sources of these conflicts are still unclear.
To our knowledge, comprehensive reviews on EEG complexity in dementia have not been conducted since nearly two decades ago (Jeong, 2002). Nevertheless, the literature on Alzheimer's disease (AD) is significantly less equivocal than that of depression or schizophrenia, with most studies showing that AD is typically associated with a loss of EEG complexity (see Table 3). In particular, MSE has been shown to be sensitive to the severity of AD symptoms (Fan et al., 2018; Yang et al., 2013), with entropy significantly declining from moderate to severe AD stages, and early‐stage AD being nearly indistinguishable from healthy controls (Fan et al., 2018). These complexity decrements may suggest information processing deficits and/or diminished brain dynamics in response to external stimuli (Pritchard et al., 1991). Some possible candidate explanations also include neuronal death and a loss of functional connectivity (Abasolo et al., 2006). Although the precise mechanism underlying complexity reductions remains contentious, more insights may be obtained through comparisons with other dementia pathologies such as Parkinson's disease (associated with lower CD, Stam et al., 1995) and vascular dementia (associated with lower L1, Jeong et al., 2001). Overall, the studies reviewed here agree on the finding that AD is associated with lower levels of complexity. To corroborate this, future research could expand beyond the conventional use of CD and MSE to include other newer measures of entropy for investigating complexity in AD.
4.4. Changes across lifespan
Interestingly, EEG complexity in healthy populations appears to follow an inverse U‐shaped pattern, increasing during early years of life (MSE during auditory and visual tasks, Lippe et al., 2009), early and late adolescence (MSE in resting state, van Noordt & Willoughby, 2021; and cognitive tasks, McIntosh et al., 2014; McIntosh et al., 2008), adulthood (HFD in resting‐state EEG,Smits et al., 2016; Zappasodi et al., 2015) and declining in old age (HFD in resting‐state EEG, Smits et al., 2016; Zappasodi et al., 2015; MSE in cognitive tasks, A. McIntosh et al., 2014). Results from other brain measures also echo this inverted U‐shaped trajectory, such as in the connectivity of neural circuitry responsible for cognitive and motor functioning (Bo et al., 2014). Moreover, van Noordt and Willoughby (2021) recently revealed that the largest increases in neural complexity are between late childhood and adolescence in fronto‐central regions, reflecting maturational changes towards more sophisticated cognitive‐behavioural processes. The subsequent decrease in neural complexity with normal ageing could be due to a multitude of deficiencies across different levels, such as neurotransmission (Backman et al., 2006), and/or structural and functional connectivity (Grady et al., 2010). This is also in agreement with Goldberger et al.'s (2002) seminal findings demonstrating reduced fractal dynamics of HRV and gait in older adults. Although most of the evidence supports the idea of an age‐related complexity loss, there are a few contradictory findings (see Table 4, inverse relationship between age and SampEn, Hogan et al., 2012; and CD, Anokhin et al., 1996) yet to be resolved. Similar to the state of the literature in patient populations, this may potentially be due to the choice of algorithm that inherently presents some interpretational ambiguity (since CD and SampEn can hardly differentiate between randomness and complexity). Additionally, some evidence indicates that complexity reductions in old age occur in regions underlying cognitive abilities rather than those responsible for ER (i.e., insula and temporal lobe); while this has been found using resting‐state fMRI signals (Dong et al., 2018), this dissociation has not yet been thoroughly investigated using EEG complexity measures that could provide more refined temporal information.
TABLE 4.
List of EEG complexity measures used in developmental and aging research
| Psychological state/condition | EEG complexity | Measures |
|---|---|---|
| Early years of life | Increase with adolescence and adulthood |
MSE (Lippe et al., 2009; McIntosh et al., 2014; McIntosh et al., 2008; van Noordt & Willoughby, 2021) |
| Old age | Decrease with normal aging |
MSE (McIntosh et al., 2014) |
| Increase with normal aging |
SampEn (Hogan et al., 2012) CD (Anokhin et al., 1996) |
In general, EEG complexity research conducted in healthy populations demonstrates a largely consistent trend of increasing complexity from young age to adulthood and decreasing complexity with healthy aging, suggestive of neurodevelopmental and network changes across the lifespan.
4.5. Consciousness
Finally, one of the most popular applications of complexity science is in quantifying human awareness and consciousness levels, and in particular, on how normal waking consciousness differs from states of reduced consciousness (Carhart‐Harris et al., 2014; Seth et al., 2011), with a general consensus that the latter displays lower neural complexity. Several consciousness theories converge on the idea that complex neuronal interactions occur when receiving multiple rich sensory signals in alert states (Miller, 2015) and that these brain activities become less complex and more periodic at reduced consciousness (e.g., greater sleep depth) due to the lower need for information processing (Hou et al., 2021). For instance, several studies that used EEG complexity agree that levels of complexity are higher during wake and REM (rapid eye movement) sleep, but lower during deep sleep (i.e., slow wave sleep) using various complexity measures (see Table 5). The particular exception of REM sleep has been attributed to its association with dreaming, which tends to be characterized by vivid phenomenological experiences (Mateos et al., 2018). Apart from sleep stages (for a comprehensive review, see Ma et al., 2018), there is also convincing evidence showing reduced EEG complexity in other states of relative ‘loss’ of consciousness (see Table 5), including anaesthetized states (Schartner et al., 2015; Zhang et al., 2001), seizures (Kannathal et al., 2005; Krystal et al., 1996) and disorders of consciousness (i.e., vegetative and minimally conscious states, see Perturbational Complexity Index [PCI], Casali et al., 2013).
TABLE 5.
List of EEG complexity measures used in consciousness research
| Psychological state/condition | EEG complexity | Measures |
|---|---|---|
| Sleep stages | REM and wake states > shallow sleep stages > deep sleep |
LZC (Li & Wang, 2010; Aamodt et al., 2021; M. M. Schartner, Pigorini, et al., 2017) HFD (Chouvarda et al., 2010) SampEn (Chouvarda et al., 2010) ApEn (Acharya et al., 2005; Burioka et al., 2005; He et al., 2006; Lee et al., 2013) MSE (Mariani et al., 2016; Shi et al., 2017) CD (Achermann et al., 1994; Fell et al., 1996; Kobayashi et al., 2000, 2001) |
| Anaesthetized states | Wake states > anaesthetized states | LZC (M. Schartner et al., 2015; Zhang et al., 2001) |
| Seizures | Wake states > seizures |
L1 (Krystal et al., 1996) ApEn (Kannathal et al., 2005) KSE (Kannathal et al., 2005) |
More recently, researchers have attempted to understand the other end of the consciousness spectrum—‘expanded consciousness’—states that include REM sleep, psychedelic states and onset phases for psychosis (based on a modern perspective of neuroscience and pharmacology, see Carhart‐Harris et al., 2014; Carhart‐Harris, 2018), which are said to be more complex than normal waking consciousness. Some preliminary evidence demonstrates that subjects under psychedelic‐induced states have elevated levels of neural complexity and report increasingly intense subjective experiences, suggesting that these states are characterized by rich conscious experiences, although these findings have mostly been derived from MRI (Atasoy et al., 2017) and MEG signals (Schartner, Carhart‐Harris, et al., 2017).
As compared with findings from other areas of complexity research (e.g., schizophrenia and depression), consciousness research has been the most robust in demonstrating a consistent link, that is, that higher levels of neural complexity are associated with enhanced consciousness. This area of research has also gained significant attention in the last decade, in part because of its potential for generating insights for treating mental health disorders (Carhart‐Harris, 2018).
4.6. Clinical interventions
Apart from being studied as potential biomarkers for different pathological conditions, complexity measures may be important in the context of promising clinical interventions. In particular, the use of psychedelics (which has recently faced a resurgence of interest in mental health) has been posited to expand consciousness, with potential benefits for the treatment of pathological conditions (based on the ‘entropic brain hypothesis’, Carhart‐Harris, 2018). In the case of psychopathological disorders such as depression, more complex states are thought to facilitate psychological insight in terms of ideas, emotions and behaviours. This is in line with research indicating that neural complexity is positively correlated with the ability to adapt to changes in environmental demands (Kloosterman et al., 2020). Increasing brain entropy would thus be expected to lead to meaningful and long‐lasting changes in perspective and behaviours (Carbonaro et al., 2018; Carhart‐Harris, 2018). In addition, the treatment of consciousness disorders may also be possible by enhancing levels of consciousness with psychedelics (Carhart‐Harris, 2018). In light of this literature, complexity science could provide a framework to shape and validate experimental paradigms and clinical interventions for a wide range of conditions.
5. DISCUSSION
Taken together, researchers need to exercise caution in interpreting the direction of change in these metrics and what it means in terms of the health status of a physiological system. Given that an ideal biological system is assumed to convey a rich amount of information, both extremely ordered outputs (i.e., repetitive, stereotyped behaviours and perseveration) and random‐like variability (i.e., impulsivity, irrational behaviours and confabulation) are undesirable (de la Torre‐Luque et al., 2016; Yang & Tsai, 2013). With regard to the latter, increases in complexity values may be wrongly misunderstood as enhanced complexity in the system when in fact the nature of the system is random. For distinguishing true dynamical complexity from randomness, MSE and DFA exponents, which can account for the scale‐invariant nature of physiological signals (i.e., similar properties at different time scales), may be more sensitive relative to other measures (Bornas, 2017). For instance, with MSE, randomness can be identified when high entropy at short time scales decreases at larger time scales (Ma et al., 2018). de la Torre‐Luque et al. (2016) elegantly proposed that rather than considering the absolute increase or decrease in complexity, deviations from optimum variability (Bornas & de la Torre‐Luque, 2016; Guastello, 2015; Schuldberg, 2015) may provide greater insights for clinical applications. However, the notion of an ‘optimally variable’ system is still relatively unexplored in existing literature. Moving forward, the utility of complexity metrics as biomarkers of disease may be reinforced through identifying ranges of normal and abnormal complexity values (i.e., normative data) unique to each pathological condition.
Many of these complexity indices can be computed using free open‐source software such as NeuroKit2 (Makowski et al., 2021) and antropy (Vallat, 2021). To further aid researchers in selecting a suitable EEG complexity measure, studies have also employed machine learning algorithms to assess the predictive power of each measure at classifying different psychopathological disorders or states. These studies have been conducted in schizophrenia (Akar et al., 2016; Sabeti et al., 2009), depression (Bachmann et al., 2017; Bornas, 2017; Cai et al., 2016; de Aguiar Neto & Rosa, 2019; Hosseinifard et al., 2013), ASD (Bosl et al., 2011), AD (Fan et al., 2018), ADHD (Boroujeni et al., 2019; Ghassemi et al., 2012) and in healthy and pathological ageing (Smits et al., 2016). However, the generalizability of the findings beyond the scope of their comparison is hard to assess, and inferences about the general utility of any given index should be avoided.
5.1. Practical considerations
Other crucial considerations when choosing a complexity metric include the length of the time series and the signal‐to‐noise ratio (Bravi et al., 2011). For instance, it may be difficult to achieve reliable complexity estimates with CD and L1 due to their underlying assumptions of noise‐free and lengthy data (for reconstructing the phase space), as these assumptions are not realistic in clinical applications. On the other hand, LZC may be more robust for short and noisy data (Fernandez et al., 2013). As for HFD, while it has been said to be more accurate for measuring FD as compared with other algorithms and is computationally simpler and faster, its values may be positively skewed by the amount of noise in data (Fernandez et al., 2013). In fact, LZC and HFD have been frequently used as measures of anaesthesia and sedation depth due to their reliability in assessing short data segments, thus making it appropriate for real‐time monitoring of patient outcomes (Ferenets et al., 2006; Zhang et al., 2001). In general, it is recommended that researchers report the length of the recordings, as well as the sampling rate (both of which determine the number of data points) to facilitate reproducibility and comparisons of complexity analyses.
Regarding entropy measures, it is important to note that ApEn and SampEn (which are essentially irregularity statistics) have been criticized to be unreflective of a system's complexity. Although MSE was proposed to address this specific limitation (Costa et al., 2002), it requires a substantially longer time series to be accurate. Instead, other versions of MSE (e.g., MMSE) have been proposed to work better with short‐term signals (Karmakar et al., 2020), but their performances have not yet been established with physiological signals. Additionally, while entropy‐based indices such as ApEn and SampEn are among the most common indices, their sensitivity to the selection of computational parameters have prompted development of more robust approaches, such as FuzzyEn, which uses a fuzzy function instead of a single value of parameter, as well as entropy profiling where variations of parameter values are used to capture the complete profile of entropy (Karmakar et al., 2020; Udhayakumar et al., 2017). Note, however, that entropy profiling has not yet been investigated in the context of EEG signals.
5.2. Conclusions
With the constant introduction of new complexity estimators (Tripathy et al., 2017) and modified versions of existing ones (Bai et al., 2015), it has become increasingly difficult for researchers to choose an optimal measure specific to the psychological state of interest. It may seem convenient to use a wide range of them, but this is a practice fraught with issues such as results fishing, cherry‐picking and biased interpretations. By enhancing the ease for researchers in navigating the plethora of complexity measures and clarifying their underlying theoretical meanings and their differences, we hope to facilitate new developments in the field. Apart from the inexplicit boundaries between measures of randomness and meaningful complexity, rigorous investigations that consider key factors such as experimental task demands and symptom trajectories are important for well‐grounded conclusions to be made about neural complexity. Future meta‐analyses of EEG complexity data could be useful in understanding the source of the discrepancies in existing literature and determine the reliability of change in neural complexity with pathology, healthy aging or consciousness states. We may also gain some clarity by investigating complexity‐based approaches in relationship with other EEG analysis approaches, such as time/frequency or connectivity analysis. In summary, as witnessed by the recent rise in related publications, the complexity analysis of EEG signals offers encouraging prospects for both research and clinical endeavours to further our understanding of normal and abnormal neurophysiological functioning.
CONFLICT OF INTEREST
The authors declare that the research was conducted in the absence of any commercial or financial relationships that could be construed as a potential conflict of interest.
AUTHOR CONTRIBUTIONS
D.M. conceived the study. Z.J.L. and T.P. coordinated the study and drafted the manuscript. D.M. and S.H.A.C. performed a critical review of the manuscript. All authors have read and agreed to the published version of the manuscript.
PEER REVIEW
The peer review history for this article is available at https://publons.com/publon/10.1111/ejn.15800.
ACKNOWLEDGEMENT
We would like to acknowledge Udo of Aachen.
Lau, Z. J. , Pham, T. , Chen, S. H. A. , & Makowski, D. (2022). Brain entropy, fractal dimensions and predictability: A review of complexity measures for EEG in healthy and neuropsychiatric populations. European Journal of Neuroscience, 56(7), 5047–5069. 10.1111/ejn.15800
Zen J. Lau and Tam Pham contributed equally to the study.
Funding information The authors did not receive support from any organization for the submitted work.
Edited by: Yoland Smith
Contributor Information
Zen J. Lau, Email: lauzenjuen@gmail.com.
Tam Pham, Email: phamttam17@gmail.com.
S. H. Annabel Chen, Email: annabelchen@ntu.edu.sg.
Dominique Makowski, Email: dom.makowski@gmail.com.
DATA AVAILABILITY STATEMENT
No datasets were generated or analysed in the present study.
REFERENCES
- Aamodt, A. , Nilsen, A. S. , Thürer, B. , Moghadam, F. H. , Kauppi, N. , Juel, B. E. , & Storm, J. F. (2021). EEG signal diversity varies with sleep stage and aspects of dream experience. Frontiers in Psychology, 12, 655884. [DOI] [PMC free article] [PubMed] [Google Scholar]
- Abasolo, D. , Hornero, R. , Gomez, C. , Garcia, M. , & Lopez, M. (2006). Analysis of EEG background activity in Alzheimer's disease patients with Lempel–Ziv complexity and central tendency measure. Medical Engineering & Physics, 28(4), 315–322. [DOI] [PubMed] [Google Scholar]
- Accardo, A. , Affinito, M. , Carrozzi, M. , & Bouquet, F. (1997). Use of the fractal dimension for the analysis of electroencephalographic time series. Biological Cybernetics, 77(5), 339–350. [DOI] [PubMed] [Google Scholar]
- Acharya, R. , Faust, O. , Kannathal, N. , Chua, T. , & Laxminarayan, S. (2005). Non‐linear analysis of EEG signals at various sleep stages. Computer Methods and Programs in Biomedicine, 80(1), 37–45. [DOI] [PubMed] [Google Scholar]
- Acharya, R. , Fujita, H. , Sudarshan, V. K. , Ghista, D. N. , Lim, W. J. E. , & Koh, J. E. (2015). Automated prediction of sudden cardiac death risk using Kolmogorov complexity and recurrence quantification analysis features extracted from HRV signals. In 2015 IEEE international conference on systems, man, and cybernetics (pp. 1110–1115). IEEE. [Google Scholar]
- Achermann, P. , Hartmann, R. , Gunzinger, A. , Guggenbuh, W. , & Borbely, A. A. (1994). Correlation dimension of the human sleep electroencephalogram: Cyclic changes in the course of the night. European Journal of Neuroscience, 6(3), 497–500. [DOI] [PubMed] [Google Scholar]
- Aftanas, L. I. , Lotova, N. V. , Koshkarov, V. I. , Pokrovskaja, V. L. , Popov, S. A. , & Makhnev, V. P. (1997). Non‐linear analysis of emotion EEG: Calculation of Kolmogorov entropy and the principal Lyapunov exponent. Neuroscience Letters, 226(1), 13–16. [DOI] [PubMed] [Google Scholar]
- Aftanas, L. I. , Lotova, N. V. , Koshkarov, V. I. , Popov, S. A. , & Makhnev, V. P. (1997). Nonlinear forecasting measurements of the human EEG during evoked emotions. Brain Topography, 10(2), 155–162. [DOI] [PubMed] [Google Scholar]
- Ahmed, M. U. , & Mandic, D. P. (2011). Multivariate multiscale entropy analysis. IEEE Signal Processing Letters, 19(2), 91–94. [Google Scholar]
- Aiordachioaie, D. , & Popescu, T. D. (2020). Aspects of time series analysis with entropies and complexity measures. In 2020 international symposium on electronics and telecommunications (ISETC) (pp. 1–4). IEEE. [Google Scholar]
- Akar, S. A. , Kara, S. , Agambayev, S. , & Bilgic, V. (2015). Nonlinear analysis of EEGs of patients with major depression during different emotional states. Computers in Biology and Medicine, 67, 49–60. [DOI] [PubMed] [Google Scholar]
- Akar, S. A. , Kara, S. , Latifoglu, F. , & Bilgic, V. (2015a). Estimation of nonlinear measures of schizophrenia patients' EEG in emotional states. IRBM, 36(4), 250–258. [Google Scholar]
- Akar, S. A. , Kara, S. , Latifoglu, F. , & Bilgic, V. (2015b). Investigation of the noise effect on fractal dimension of EEG in schizophrenia patients using wavelet and SSA‐based approaches. Biomedical Signal Processing and Control, 18, 42–48. [Google Scholar]
- Akar, S. A. , Kara, S. , Latifoglu, F. , & Bilgic, V. (2016). Analysis of the complexity measures in the EEG of schizophrenia patients. International Journal of Neural Systems, 26(02), 1650008. [DOI] [PubMed] [Google Scholar]
- Al‐Angari, H. M. , & Sahakian, A. V. (2007). Use of sample entropy approach to study heart rate variability in obstructive sleep apnea syndrome. IEEE Transactions on Biomedical Engineering, 54(10), 1900–1904. [DOI] [PubMed] [Google Scholar]
- An der Heiden, U. (2006). Schizophrenia as a dynamical disease. Pharmacopsychiatry, 39(S 1), 36–42. [DOI] [PubMed] [Google Scholar]
- Ando, M. , Nobukawa, S. , Kikuchi, M. , & Takahashi, T. (2021). Identification of electroencephalogram signals in Alzheimer's disease by multifractal and multiscale entropy analysis. Frontiers in Neuroscience, 15, 667614. [DOI] [PMC free article] [PubMed] [Google Scholar]
- Anokhin, A. P. , Birbaumer, N. , Lutzenberger, W. , Nikolaev, A. , & Vogel, F. (1996). Age increases brain complexity. Electroencephalography and Clinical Neurophysiology, 99(1), 63–68. [DOI] [PubMed] [Google Scholar]
- Atasoy, S. , Roseman, L. , Kaelen, M. , Kringelbach, M. L. , Deco, G. , & Carhart‐Harris, R. L. (2017). Connectome‐harmonic decomposition of human brain activity reveals dynamical repertoire re‐organization under LSD. Scientific Reports, 7(1), 1–18. [DOI] [PMC free article] [PubMed] [Google Scholar]
- Azami, H. , Abasolo, D. , Simons, S. , & Escudero, J. (2017). Univariate and multivariate generalized multiscale entropy to characterise EEG signals in Alzheimer's disease. Entropy, 19(1), 31. [Google Scholar]
- Aziz, W. , & Arif, M. (2005). Multiscale permutation entropy of physiological time series. 2005 Pakistan Section Multitopic Conference, IEEE. 1–6.
- Bachiller, A. , Lubeiro, A. , Díez, Á. , Suazo, V. , Domínguez, C. , Blanco, J. A. , Ayuso, M. , Hornero, R. , Poza, J. , & Molina, V. (2015). Decreased entropy modulation of EEG response to novelty and relevance in schizophrenia during a P300 task. European Archives of Psychiatry and Clinical Neuroscience, 265(6), 525–535. [DOI] [PubMed] [Google Scholar]
- Bachmann, M. , Kalev, K. , Suhhova, A. , Lass, J. , & Hinrikus, H. (2015). Lempel Ziv complexity of EEG in depression. In 6th European conference of the International Federation for Medical and Biological Engineering (pp. 58–61). Springer. [DOI] [PubMed] [Google Scholar]
- Bachmann, M. , Lass, J. , & Hinrikus, H. (2017). Single channel EEG analysis for detection of depression. Biomedical Signal Processing and Control, 31, 391–397. [Google Scholar]
- Bachmann, M. , Paeske, L. , Kalev, K. , Aarma, K. , Lehtmets, A. , Oopik, P. , Lass, J. , & Hinrikus, H. (2018). Methods for classifying depression in single channel EEG using linear and nonlinear signal analysis. Computer Methods and Programs in Biomedicine, 155, 11–17. [DOI] [PubMed] [Google Scholar]
- Backman, L. , Nyberg, L. , Lindenberger, U. , Li, S.‐C. , & Farde, L. (2006). The correlative triad among aging, dopamine, and cognition: Current status and future prospects. Neuroscience & Biobehavioral Reviews, 30(6), 791–807. [DOI] [PubMed] [Google Scholar]
- Bahrami, B. , Seyedsadjadi, R. , Babadi, B. , & Noroozian, M. (2005). Brain complexity increases in mania. Neuroreport, 16(2), 187–191. [DOI] [PubMed] [Google Scholar]
- Bai, Y. , Liang, Z. , & Li, X. (2015). A permutation Lempel‐Ziv complexity measure for EEG analysis. Biomedical Signal Processing and Control, 19, 102–114. [Google Scholar]
- Bar, K.‐J. , Boettger, M. K. , Koschke, M. , Schulz, S. , Chokka, P. , Yeragani, V. K. , & Voss, A. (2007). Non‐linear complexity measures of heart rate variability in acute schizophrenia. Clinical Neurophysiology, 118(9), 2009–2015. [DOI] [PubMed] [Google Scholar]
- Bassingthwaighte, J. B. , & Raymond, G. M. (1994). Evaluating rescaled range analysis for time series. Annals of Biomedical Engineering, 22(4), 432–444. [DOI] [PubMed] [Google Scholar]
- Besthorn, C. , Sattel, H. , Geiger‐Kabisch, C. , Zerfass, R. , & Forstl, H. (1995). Parameters of EEG dimensional complexity in Alzheimer's disease. Electroencephalography and Clinical Neurophysiology, 95(2), 84–89. [DOI] [PubMed] [Google Scholar]
- Bo, J. , Lee, C.‐M. , Kwak, Y. , Peltier, S. J. , Bernard, J. A. , Buschkuehl, M. , Jaeggi, S. M. , Wiggins, J. L. , Jonides, J. , Monk, C. S. , & Seidler, R. D. (2014). Lifespan differences in cortico‐striatal resting state connectivity. Brain Connectivity, 4(3), 166–180. [DOI] [PMC free article] [PubMed] [Google Scholar]
- Bob, P. , Kukleta, M. , Riecansky, I. , Susta, M. , Kukumberg, P. , & Jagla, F. (2006). Chaotic EEG patterns during recall of stressful memory related to panic attack. Physiological Research, 55(Suppl. 1), S113–S119. [DOI] [PubMed] [Google Scholar]
- Bob, P. , & Svetlak, M. (2011). Dissociative states and neural complexity. Brain and Cognition, 75(2), 188–195. [DOI] [PubMed] [Google Scholar]
- Bornas, X. (2017). Complexity and irregularity in the brain oscillations of depressive patients: A systematic review. Neuropsychiatry, 7(5), 466–477. [Google Scholar]
- Bornas, X. , & de la Torre‐Luque, A. (2016). The thin line between health and disease: A matter of dynamical variability. Fractal Geometry and Nonlinear Analysis in Medicine and Biology, 1(2). 10.15761/FGNAMB.1000128 [DOI] [Google Scholar]
- Bornas, X. , Tortella‐Feliu, M. , Balle, M. , & Llabres, J. (2013). Self‐focused cognitive emotion regulation style as associated with widespread diminished EEG fractal dimension. International Journal of Psychology, 48(4), 695–703. [DOI] [PubMed] [Google Scholar]
- Boroujeni, Y. K. , Rastegari, A. A. , & Khodadadi, H. (2019). Diagnosis of attention deficit hyperactivity disorder using non‐linear analysis of the EEG signal. IET Systems Biology, 13(5), 260–266. [DOI] [PMC free article] [PubMed] [Google Scholar]
- Bosl, W. , Tierney, A. , Tager‐Flusberg, H. , & Nelson, C. (2011). EEG complexity as a biomarker for autism spectrum disorder risk. BMC Medicine, 9(1), 1–16. [DOI] [PMC free article] [PubMed] [Google Scholar]
- Bravi, A. , Longtin, A. , & Seely, A. J. (2011). Review and classification of variability analysis techniques with clinical applications. Biomedical Engineering Online, 10(1), 1–27. [DOI] [PMC free article] [PubMed] [Google Scholar]
- Burggren, W. , & Monticino, M. (2005). Assessing physiological complexity. Journal of Experimental Biology, 208(17), 3221–3232. [DOI] [PubMed] [Google Scholar]
- Burioka, N. , Miyata, M. , Cornelissen, G. , Halberg, F. , Takeshima, T. , Kaplan, D. T. , Suyama, H. , Endo, M. , Maegaki, Y. , Nomura, T. , Tomita, Y. , Nakashima, K. , & Shimizu, E. (2005). Approximate entropy in the electroencephalogram during wake and sleep. Clinical EEG and Neuroscience, 36(1), 21–24. [DOI] [PMC free article] [PubMed] [Google Scholar]
- Busa, M. A. , & van Emmerik, R. E. (2016). Multiscale entropy: A tool for understanding the complexity of postural control. Journal of Sport and Health Science, 5(1), 44–51. [DOI] [PMC free article] [PubMed] [Google Scholar]
- Cai, H. , Sha, X. , Han, X. , Wei, S. , & Hu, B. (2016). Pervasive EEG diagnosis of depression using deep belief network with three‐electrodes EEG collector. In 2016 IEEE international conference on bioinformatics and biomedicine (BIBM) (pp. 1239–1246). IEEE. [Google Scholar]
- Carbonaro, T. M. , Johnson, M. W. , Hurwitz, E. , & Griffiths, R. R. (2018). Double‐blind comparison of the two hallucinogens psilocybin and dextromethorphan: Similarities and differences in subjective experiences. Psychopharmacology, 235(2), 521–534. [DOI] [PMC free article] [PubMed] [Google Scholar]
- Carhart‐Harris, R. L. (2018). The entropic brain‐revisited. Neuropharmacology, 142, 167–178. [DOI] [PubMed] [Google Scholar]
- Carhart‐Harris, R. L. , Leech, R. , Hellyer, P. J. , Shanahan, M. , Feilding, A. , Tagliazucchi, E. , Chialvo, D. R. , & Nutt, D. (2014). The entropic brain: A theory of conscious states informed by neuroimaging research with psychedelic drugs. Frontiers in Human Neuroscience, 8, 20. [DOI] [PMC free article] [PubMed] [Google Scholar]
- Carlino, E. , Sigaudo, M. , Pollo, A. , Benedetti, F. , Mongini, T. , Castagna, F. , Vighetti, S. , & Rocca, P. (2012). Nonlinear analysis of electroencephalogram at rest and during cognitive tasks in patients with schizophrenia. Journal of Psychiatry & Neuroscience: JPN, 37(4), 259. [DOI] [PMC free article] [PubMed] [Google Scholar]
- Casali, A. G. , Gosseries, O. , Rosanova, M. , Boly, M. , Sarasso, S. , Casali, K. R. , Casarotto, S. , Bruno, M.‐A. , Laureys, S. , Tononi, G. , & Massimini, M. (2013). A theoretically based index of consciousness independent of sensory processing and behavior. Science Translational Medicine, 5(198), 198ra105. [DOI] [PubMed] [Google Scholar]
- Castiglioni, P. (2010). Letter to the editor: What is wrong in Katz's method? Comments on: “A note on fractal dimensions of biomedical waveforms”. Computers in Biology and Medicine, 40(11–12), 950–952. [DOI] [PubMed] [Google Scholar]
- Castiglioni, P. , & Di Rienzo, M. (2008). How the threshold “r” influences approximate entropy analysis of heart‐rate variability. In 2008 computers in cardiology (pp. 561–564). IEEE. [Google Scholar]
- Catarino, A. , Churches, O. , Baron‐Cohen, S. , Andrade, A. , & Ring, H. (2011). Atypical EEG complexity in autism spectrum conditions: A multiscale entropy analysis. Clinical Neurophysiology, 122(12), 2375–2383. [DOI] [PubMed] [Google Scholar]
- Chae, J.‐H. , Jeong, J. , Peterson, B. S. , Kim, D.‐J. , Bahk, W.‐M. , Jun, T.‐Y. , Kim, S.‐Y. , & Kim, K.‐S. (2004). Dimensional complexity of the EEG in patients with posttraumatic stress disorder. Psychiatry Research: Neuroimaging, 131(1), 79–89. [DOI] [PubMed] [Google Scholar]
- Chen, H. , Chen, W. , Song, Y. , Sun, L. , & Li, X. (2019). EEG characteristics of children with attention‐deficit/hyperactivity disorder. Neuroscience, 406, 444–456. [DOI] [PubMed] [Google Scholar]
- Chen, W. , Zhuang, J. , Yu, W. , & Wang, Z. (2009). Measuring complexity using fuzzyen, apen, and sampen. Medical Engineering & Physics, 31(1), 61–68. [DOI] [PubMed] [Google Scholar]
- Chouvarda, I. , Rosso, V. , Mendez, M. , Bianchi, A. M. , Parrino, L. , Grassi, A. , Terzano, M. , Cerutti, S. , & Maglaveras, N. (2010). EEG complexity during sleep: On the effect of micro and macro sleep structure. In 2010 annual international conference of the IEEE engineering in medicine and biology (pp. 5959–5962). IEEE. [DOI] [PubMed] [Google Scholar]
- Clarke, A. R. , Barry, R. J. , McCARTHY, R. , & Selikowitz, M. (2001). Electroencephalogram differences in two subtypes of attention‐deficit/hyperactivity disorder. Psychophysiology, 38(2), 212–221. [PubMed] [Google Scholar]
- Coben, R. , Clarke, A. R. , Hudspeth, W. , & Barry, R. J. (2008). EEG power and coherence in autistic spectrum disorder. Clinical Neurophysiology, 119(5), 1002–1009. [DOI] [PubMed] [Google Scholar]
- Costa, M. D. , & Goldberger, A. L. (2015). Generalized multiscale entropy analysis: Application to quantifying the complex volatility of human heartbeat time series. Entropy, 17(3), 1197–1203. [DOI] [PMC free article] [PubMed] [Google Scholar]
- Costa, M. D. , Goldberger, A. L. , & Peng, C.‐K. (2002). Multiscale entropy analysis of complex physiologic time series. Physical Review Letters, 89(6), 068102. [DOI] [PubMed] [Google Scholar]
- Costa, M. D. , Goldberger, A. L. , & Peng, C.‐K. (2005). Multiscale entropy analysis of biological signals. Physical Review E, 71(2), 021906. [DOI] [PubMed] [Google Scholar]
- Cover, T. M. , & Thomas, J. A. (2006). Elements of information theory second edition solutions to problems. Internet Access, 19–20. [Google Scholar]
- Cukic, M. , Stokic, M. , Radenkovic, S. , Ljubisavljevic, M. , Simic, S. , & Savic, D. (2020). Nonlinear analysis of EEG complexity in episode and remission phase of recurrent depression. International Journal of Methods in Psychiatric Research, 29(2), e1816. [DOI] [PMC free article] [PubMed] [Google Scholar]
- Czigler, B. , Csikos, D. , Hidasi, Z. , Gaal, Z. A. , Csibri, E. , Kiss, E. , Salacz, P. , & Molnar, M. (2008). Quantitative EEG in early Alzheimer's disease patients—Power spectrum and complexity features. International Journal of Psychophysiology, 68(1), 75–80. [DOI] [PubMed] [Google Scholar]
- Dalgleish, T. , Black, M. , Johnston, D. , & Bevan, A. (2020). Transdiagnostic approaches to mental health problems: Current status and future directions. Journal of Consulting and Clinical Psychology, 88(3), 179. [DOI] [PMC free article] [PubMed] [Google Scholar]
- Davalos, A. , Jabloun, M. , Ravier, P. , & Buttelli, O. (2019). On the statistical properties of multiscale permutation entropy: Characterization of the estimator's variance. Entropy, 21(5), 450. [DOI] [PMC free article] [PubMed] [Google Scholar]
- de Aguiar Neto, F. S. , & Rosa, J. L. G. (2019). Depression biomarkers using non‐invasive EEG: A review. Neuroscience & Biobehavioral Reviews, 105, 83–93. [DOI] [PubMed] [Google Scholar]
- de la Torre‐Luque, A. , Bornas, X. , Balle, M. , & Fiol‐Veny, A. (2016). Complexity and nonlinear biomarkers in emotional disorders: A meta‐analytic study. Neuroscience & Biobehavioral Reviews, 68, 410–422. [DOI] [PubMed] [Google Scholar]
- Delgado‐Bonal, A. , & Marshak, A. (2019). Approximate entropy and sample entropy: A comprehensive tutorial. Entropy, 21(6), 541. [DOI] [PMC free article] [PubMed] [Google Scholar]
- Deyle, E. R. , & Sugihara, G. (2011). Generalized theorems for nonlinear state space reconstruction. PLoS ONE, 6(3), e18295. [DOI] [PMC free article] [PubMed] [Google Scholar]
- Ding, M. , Grebogi, C. , Ott, E. , Sauer, T. , & Yorke, J. A. (1993). Estimating correlation dimension from a chaotic time series: When does plateau onset occur? Physica D: Nonlinear Phenomena, 69(3–4), 404–424. [Google Scholar]
- Dong, J. , Jing, B. , Ma, X. , Liu, H. , Mo, X. , & Li, H. (2018). Hurst exponent analysis of resting‐state fMRI signal complexity across the adult lifespan. Frontiers in Neuroscience, 12, 34. [DOI] [PMC free article] [PubMed] [Google Scholar]
- Ehlers, C. L. (1995). Chaos and complexity: Can it help us to understand mood and behavior? Archives of General Psychiatry, 52(11), 960–964. [DOI] [PubMed] [Google Scholar]
- Esteller, R. , Vachtsevanos, G. , Echauz, J. , & Litt, B. (2001). A comparison of waveform fractal dimension algorithms. IEEE Transactions on Circuits and Systems I: Fundamental Theory and Applications, 48(2), 177–183. [Google Scholar]
- Fan, M. , Yang, A. C. , Fuh, J.‐L. , & Chou, C.‐A. (2018). Topological pattern recognition of severe Alzheimer's disease via regularized supervised learning of EEG complexity. Frontiers in Neuroscience, 12, 685. [DOI] [PMC free article] [PubMed] [Google Scholar]
- Fathillah, M. , Jaafar, R. , Chellappan, K. , Remli, R. , & Zainal, W. (2017). Complexity analysis on EEG signal via Lempel‐Ziv and approximate entropy: Effect of multiresolution analysis. International Medical Device and Technology Conference, 2017, 6–7. [Google Scholar]
- Faure, P. , & Korn, H. (2001). Is there chaos in the brain? I. concepts of nonlinear dynamics and methods of investigation. Comptes Rendus de l'Academie des Sciences‐Series III‐Sciences de La Vie, 324(9), 773–793. [DOI] [PubMed] [Google Scholar]
- Fell, J. , Roschke, J. , Mann, K. , & Schaffner, C. (1996). Discrimination of sleep stages: A comparison between spectral and nonlinear EEG measures. Electroencephalography and Clinical Neurophysiology, 98(5), 401–410. [DOI] [PubMed] [Google Scholar]
- Ferenets, R. , Lipping, T. , Anier, A. , Jantti, V. , Melto, S. , & Hovilehto, S. (2006). Comparison of entropy and complexity measures for the assessment of depth of sedation. IEEE Transactions on Biomedical Engineering, 53(6), 1067–1077. [DOI] [PubMed] [Google Scholar]
- Fernandez, A. , Gomez, C. , Hornero, R. , & Lopez‐Ibor, J. J. (2013). Complexity and schizophrenia. Progress in Neuro‐Psychopharmacology and Biological Psychiatry, 45, 267–276. [DOI] [PubMed] [Google Scholar]
- Fernandez, A. , Quintero, J. , Hornero, R. , Zuluaga, P. , Navas, M. , Gomez, C. , Escudero, J. , Garcia‐Campos, N. , Biederman, J. , & Ortiz, T. (2009). Complexity analysis of spontaneous brain activity in attention‐deficit/hyperactivity disorder: Diagnostic implications. Biological Psychiatry, 65(7), 571–577. [DOI] [PubMed] [Google Scholar]
- Fingelkurts, A. A. , Fingelkurts, A. A. , Rytsala, H. , Suominen, K. , Isometsa, E. , & Kahkonen, S. (2006). Composition of brain oscillations in ongoing EEG during major depression disorder. Neuroscience Research, 56(2), 133–144. [DOI] [PubMed] [Google Scholar]
- Friston, K. J. (2002). Dysfunctional connectivity in schizophrenia. World Psychiatry, 1(2), 66. [PMC free article] [PubMed] [Google Scholar]
- Gattaz, W. F. , Mayer, S. , Ziegler, P. , Platz, M. , & Gasser, T. (1992). Hypofrontality on topographic EEG in schizophrenia. European Archives of Psychiatry and Clinical Neuroscience, 241(6), 328–332. [DOI] [PubMed] [Google Scholar]
- Ghassemi, F. , Hassan Moradi, M. , Tehrani‐Doost, M. , & Abootalebi, V. (2012). Using non‐linear features of EEG for ADHD/normal participants' classification. Procedia‐Social and Behavioral Sciences, 32, 148–152. [Google Scholar]
- Gieraltowski, J. , Zebrowski, J. , & Baranowski, R. (2012). Multiscale multifractal analysis of heart rate variability recordings with a large number of occurrences of arrhythmia. Physical Review E, 85(2), 021915. [DOI] [PubMed] [Google Scholar]
- Gneiting, T. , & Schlather, M. (2004). Stochastic models that separate fractal dimension and the Hurst effect. SIAM Review, 46(2), 269–282. [Google Scholar]
- Golbeter, A. (1996). Biochemical oscillations and cellular rhythms. The molecular bases of periodic and chaotic behavior. Cambridge University Press. [Google Scholar]
- Goldberger, A. L. , Amaral, L. A. , Hausdorff, J. M. , Ivanov, P. C. , Peng, C.‐K. , & Stanley, H. E. (2002). Fractal dynamics in physiology: Alterations with disease and aging. Proceedings of the National Academy of Sciences, 99(Suppl 1), 2466–2472. [DOI] [PMC free article] [PubMed] [Google Scholar]
- Goldberger, A. L. , Bhargava, V. , West, B. J. , & Mandell, A. J. (1985). On a mechanism of cardiac electrical stability. The Fractal Hypothesis. Biophysical Journal, 48(3), 525–528. [DOI] [PMC free article] [PubMed] [Google Scholar]
- Gottschalk, A. , Bauer, M. S. , & Whybrow, P. C. (1995). Evidence of chaotic mood variation in bipolar disorder. Archives of General Psychiatry, 52(11), 947–959. [DOI] [PubMed] [Google Scholar]
- Grady, C. L. , Protzner, A. B. , Kovacevic, N. , Strother, S. C. , Afshin‐Pour, B. , Wojtowicz, M. , Anderson, J. A. , Churchill, N. , & McIntosh, A. R. (2010). A multivariate analysis of age‐related differences in default mode and task‐positive networks across multiple cognitive domains. Cerebral Cortex, 20(6), 1432–1447. [DOI] [PMC free article] [PubMed] [Google Scholar]
- Grassberger, P. (2012). Randomness, information, and complexity. arXiv Preprint arXiv:1208.3459. [Google Scholar]
- Grebogi, C. , Ott, E. , & Yorke, J. A. (1986). Critical exponent of chaotic transients in nonlinear dynamical systems. Physical Review Letters, 57(11), 1284. [DOI] [PubMed] [Google Scholar]
- Grech, D. , & Mazur, Z. (2004). Can one make any crash prediction in finance using the local Hurst exponent idea? Physica a: Statistical Mechanics and its Applications, 336(1‐2), 133–145. [Google Scholar]
- Gregson, R. A. , Campbell, E. A. , & Gates, G. R. (1993). Cognitive load as a determinant of the dimensionality of the electroencephalogram: A replication study. Biological Psychology, 35(2), 165–178. [DOI] [PubMed] [Google Scholar]
- Guastello, S. J. (2015). The complexity of the psychological self and the principle of optimum variability. Nonlinear Dynamics, Psychology, and Life Sciences, 19(4), 511–527. [PubMed] [Google Scholar]
- Hadoush, H. , Alafeef, M. , & Abdulhay, E. (2019). Brain complexity in children with mild and severe autism spectrum disorders: Analysis of multiscale entropy in EEG. Brain Topography, 32(5), 914–921. [DOI] [PubMed] [Google Scholar]
- Hardstone, R. , Poil, S.‐S. , Schiavone, G. , Jansen, R. , Nikulin, V. V. , Mansvelder, H. D. , & Linkenkaer‐Hansen, K. (2012). Detrended fluctuation analysis: A scale‐free view on neuronal oscillations. Frontiers in Physiology, 3, 450. [DOI] [PMC free article] [PubMed] [Google Scholar]
- He, W.‐X. , Yan, X.‐G. , Chen, X.‐P. , & Liu, H. (2006). Nonlinear feature extraction of sleeping EEG signals. In 2005 IEEE engineering in medicine and biology 27th annual conference (pp. 4614–4617). IEEE. [DOI] [PubMed] [Google Scholar]
- Henriques, T. , Ribeiro, M. , Teixeira, A. , Castro, L. , Antunes, L. , & Costa‐Santos, C. (2020). Nonlinear methods most applied to heart‐rate time series: A review. Entropy, 22(3), 309. [DOI] [PMC free article] [PubMed] [Google Scholar]
- Henry, B. L. , Minassian, A. , Paulus, M. P. , Geyer, M. A. , & Perry, W. (2010). Heart rate variability in bipolar mania and schizophrenia. Journal of Psychiatric Research, 44(3), 168–176. [DOI] [PMC free article] [PubMed] [Google Scholar]
- Higuchi, T. (1988). Approach to an irregular time series on the basis of the fractal theory. Physica D: Nonlinear Phenomena, 31(2), 277–283. [Google Scholar]
- Hogan, M. J. , Kilmartin, L. , Keane, M. , Collins, P. , Staff, R. T. , Kaiser, J. , Lai, R. , & Upton, N. (2012). Electrophysiological entropy in younger adults, older controls and older cognitively declined adults. Brain Research, 1445, 1–10. [DOI] [PubMed] [Google Scholar]
- Holtzheimer, P. E. , & Mayberg, H. S. (2011). Stuck in a rut: Rethinking depression and its treatment. Trends in Neurosciences, 34(1), 1–9. [DOI] [PMC free article] [PubMed] [Google Scholar]
- Hosseinifard, B. , Moradi, M. H. , & Rostami, R. (2013). Classifying depression patients and normal subjects using machine learning techniques and nonlinear features from EEG signal. Computer Methods and Programs in Biomedicine, 109(3), 339–345. [DOI] [PubMed] [Google Scholar]
- Hou, F. , Zhang, L. , Qin, B. , Gaggioni, G. , Liu, X. , & Vandewalle, G. (2021). Changes in EEG permutation entropy in the evening and in the transition from wake to sleep. Sleep, 44(4), zsaa226. [DOI] [PMC free article] [PubMed] [Google Scholar]
- Hurst, H. E. (1951). Long‐term storage capacity of reservoirs. Transactions of the American Society of Civil Engineers, 116(1), 770–799. [Google Scholar]
- Ibanez‐Molina, A. J. , Iglesias‐Parro, S. , Soriano, M. F. , & Aznarte, J. I. (2015). Multiscale Lempel–Ziv complexity for EEG measures. Clinical Neurophysiology, 126(3), 541–548. [DOI] [PubMed] [Google Scholar]
- Ibanez‐Molina, A. J. , Lozano, V. , Soriano, M. F. , Aznarte, J. I. , Gómez‐Ariza, C. J. , & Bajo, M. T. (2018). EEG multiscale complexity in schizophrenia during picture naming. Frontiers in Physiology, 9, 1213. [DOI] [PMC free article] [PubMed] [Google Scholar]
- Ihlen, E. A. (2012). Introduction to multifractal detrended fluctuation analysis in matlab. Frontiers in Physiology, 3, 141. [DOI] [PMC free article] [PubMed] [Google Scholar]
- Ihlen, E. A. , & Vereijken, B. (2010). Interaction‐dominant dynamics in human cognition: Beyond 1/ƒα fluctuation. Journal of Experimental Psychology: General, 139(3), 436‐463. [DOI] [PubMed] [Google Scholar]
- Jeong, J. (2002). Nonlinear dynamics of EEG in Alzheimer's disease. Drug Development Research, 56(2), 57–66. [Google Scholar]
- Jeong, J. , Chae, J. , Kim, S. Y. , & Han, S. (2001). Nonlinear dynamic analysis of the EEG in patients with Alzheimer's disease and vascular dementia. Journal of Clinical Neurophysiology, 18(1), 58–67. [DOI] [PubMed] [Google Scholar]
- Jeong, J. , Kim, D.‐J. , Chae, J.‐H. , Kim, S. Y. , Ko, H.‐J. , & Paik, I.‐H. (1998). Nonlinear analysis of the EEG of schizophrenics with optimal embedding dimension. Medical Engineering & Physics, 20(9), 669–676. [DOI] [PubMed] [Google Scholar]
- Jeong, J. , Kim, S. Y. , & Han, S.‐H. (1998). Non‐linear dynamical analysis of the EEG in Alzheimer's disease with optimal embedding dimension. Electroencephalography and Clinical Neurophysiology, 106(3), 220–228. [DOI] [PubMed] [Google Scholar]
- Jin, S.‐H. , Na, S. H. , Kim, S. Y. , Ham, B.‐J. , Lee, D. H. , Lee, J. H. , & Lee, H. (2003). Hemispheric laterality and dimensional complexity in schizophrenia under sound and light stimulation. International Journal of Psychophysiology, 49(1), 1–15. [DOI] [PubMed] [Google Scholar]
- Kalev, K. , Bachmann, M. , Orgo, L. , Lass, J. , & Hinrikus, H. (2015). Lempel‐Ziv and multiscale Lempel‐Ziv complexity in depression. In 2015 37th annual international conference of the IEEE engineering in medicine and biology society (EMBC) (pp. 4158–4161). IEEE. [DOI] [PubMed] [Google Scholar]
- Kamizawa, T. , Hara, T. , & Ohya, M. (2014). On relations among the entropic chaos degree, the Kolmogorov‐Sinai entropy and the lyapunov exponent. Journal of Mathematical Physics, 55(3), 032702. [Google Scholar]
- Kang, J. , Chen, H. , Li, X. , & Li, X. (2019). EEG entropy analysis in autistic children. Journal of Clinical Neuroscience, 62, 199–206. [DOI] [PubMed] [Google Scholar]
- Kannathal, N. , Choo, M. L. , Acharya, U. R. , & Sadasivan, P. (2005). Entropies for detection of epilepsy in EEG. Computer Methods and Programs in Biomedicine, 80(3), 187–194. [DOI] [PubMed] [Google Scholar]
- Kantelhardt, J. W. , Zschiegner, S. A. , Koscielny‐Bunde, E. , Havlin, S. , Bunde, A. , & Stanley, H. E. (2002). Multifractal detrended fluctuation analysis of nonstationary time series. Physica a: Statistical Mechanics and its Applications, 316(1–4), 87–114. [Google Scholar]
- Karmakar, C. , Udhayakumar, R. , & Palaniswami, M. (2020). Entropy profiling: A reduced—Parametric measure of Kolmogorov—Sinai entropy from short‐term HRV signal. Entropy, 22(12), 1396. [DOI] [PMC free article] [PubMed] [Google Scholar]
- Khandoker, A. H. , Jelinek, H. F. , & Palaniswami, M. (2009). Identifying diabetic patients with cardiac autonomic neuropathy by heart rate complexity analysis. Biomedical Engineering Online, 8(1), 1–12. [DOI] [PMC free article] [PubMed] [Google Scholar]
- Khoshnoud, S. , Nazari, M. A. , & Shamsi, M. (2018). Functional brain dynamic analysis of ADHD and control children using nonlinear dynamical features of EEG signals. Journal of Integrative Neuroscience, 17(1), 17–30. [DOI] [PubMed] [Google Scholar]
- Kiel, L. D. , & Elliott, E. W. (1996). Chaos theory in the social sciences: Foundations and applications. University of Michigan Press. [Google Scholar]
- Kim, D.‐J. , Jeong, J. , Chae, J.‐H. , Park, S. , Kim, S. Y. , Go, H. J. , Paik, I.‐H. , Kim, K.‐S. , & Choi, B. (2000). An estimation of the first positive lyapunov exponent of the EEG in patients with schizophrenia. Psychiatry Research: Neuroimaging, 98(3), 177–189. [DOI] [PubMed] [Google Scholar]
- Kloosterman, N. A. , Kosciessa, J. Q. , Lindenberger, U. , Fahrenfort, J. J. , & Garrett, D. D. (2020). Boosts in brain signal variability track liberal shifts in decision bias. eLife, 9, e54201. [DOI] [PMC free article] [PubMed] [Google Scholar]
- Kobayashi, T. , Madokoro, S. , Wada, Y. , Misaki, K. , & Nakagawa, H. (2001). Human sleep EEG analysis using the correlation dimension. Clinical Electroencephalography, 32(3), 112–118. [DOI] [PubMed] [Google Scholar]
- Kobayashi, T. , Misaki, K. , Nakagawa, H. , Madokoro, S. , Ota, T. , Ihara, H. , Tsuda, K. , Umezawa, Y. , Murayama, J. , & Isaki, K. (2000). Correlation dimension of the human sleep electroencephalogram. Psychiatry and Clinical Neurosciences, 54(1), 11–16. [DOI] [PubMed] [Google Scholar]
- Koukkou, M. , Lehmann, D. , Wackermann, J. , Dvorak, I. , & Henggeler, B. (1993). Dimensional complexity of EEG brain mechanisms in untreated schizophrenia. Biological Psychiatry, 33(6), 397–407. [DOI] [PubMed] [Google Scholar]
- Krivstoufek, L. (2010). Rescaled range analysis and detrended fluctuation analysis: Finite sample properties and confidence intervals. Czech Economic Review, 4(03), 315–329. [Google Scholar]
- Krystal, A. D. , Greenside, H. S. , Weiner, R. D. , & Gassert, D. (1996). A comparison of EEG signal dynamics in waking, after anesthesia induction and during electroconvulsive therapy seizures. Electroencephalography and Clinical Neurophysiology, 99(2), 129–140. [DOI] [PubMed] [Google Scholar]
- Kutepov, I. E. , Dobriyan, V. V. , Zhigalov, M. V. , Stepanov, M. F. , Krysko, A. V. , Yakovleva, T. V. , & Krysko, V. A. (2020). EEG analysis in patients with schizophrenia based on Lyapunov exponents. Informatics in Medicine Unlocked, 18, 100289. [Google Scholar]
- Lamberts, J. , Van den Broek, P. , Bener, L. , Van Egmond, J. , Dirksen, R. , & Coenen, A. (2000). Correlation dimension of the human electroencephalogram corresponds with cognitive load. Neuropsychobiology, 41(3), 149–153. [DOI] [PubMed] [Google Scholar]
- Lee, G. M. , Fattinger, S. , Mouthon, A.‐L. , Noirhomme, Q. , & Huber, R. (2013). Electroencephalogram approximate entropy influenced by both age and sleep. Frontiers in Neuroinformatics, 7, 33. [DOI] [PMC free article] [PubMed] [Google Scholar]
- Lee, J. S. , Yang, B.‐H. , Lee, J.‐H. , Choi, J.‐H. , Choi, I.‐G. , & Kim, S.‐B. (2007). Detrended fluctuation analysis of resting EEG in depressed outpatients and healthy controls. Clinical Neurophysiology, 118(11), 2489–2496. [DOI] [PubMed] [Google Scholar]
- Lee, S.‐H. , Choo, J.‐S. , Im, W.‐Y. , & Chae, J.‐H. (2008). Nonlinear analysis of electroencephalogram in schizophrenia patients with persistent auditory hallucination. Psychiatry Investigation, 5(2), 115. [DOI] [PMC free article] [PubMed] [Google Scholar]
- Leistedt, S. J. , Linkowski, P. , Lanquart, J. P. , Mietus, J. , Davis, R. B. , Goldberger, A. L. , & Costa, M. D. (2011). Decreased neuroautonomic complexity in men during an acute major depressive episode: Analysis of heart rate dynamics. Translational Psychiatry, 1(7), e27. [DOI] [PMC free article] [PubMed] [Google Scholar]
- Lempel, A. , & Ziv, J. (1976). On the complexity of finite sequences. IEEE Transactions on Information Theory, 22(1), 75–81. [Google Scholar]
- Li, L. , & Wang, R. (2010). Complexity analysis of sleep EEG signal. In 2010 4th international conference on bioinformatics and biomedical engineering (pp. 1–3). IEEE. [Google Scholar]
- Li, Y. , Tong, S. , Liu, D. , Gai, Y. , Wang, X. , Wang, J. , Qiu, Y. , & Zhu, Y. (2008). Abnormal EEG complexity in patients with schizophrenia and depression. Clinical Neurophysiology, 119(6), 1232–1241. [DOI] [PubMed] [Google Scholar]
- Lippe, S. , Kovacevic, N. , & McIntosh, R. (2009). Differential maturation of brain signal complexity in the human auditory and visual system. Frontiers in Human Neuroscience, 3, 48. [DOI] [PMC free article] [PubMed] [Google Scholar]
- Lipsitz, L. A. , & Goldberger, A. L. (1992). Loss of ‘complexity’ and aging: Potential applications of fractals and chaos theory to senescence. JAMA, 267(13), 1806–1809. [PubMed] [Google Scholar]
- Liu, C. , Liu, C. , Shao, P. , Li, L. , Sun, X. , Wang, X. , & Liu, F. (2010). Comparison of different threshold values r for approximate entropy: Application to investigate the heart rate variability between heart failure and healthy control groups. Physiological Measurement, 32(2), 167. [DOI] [PubMed] [Google Scholar]
- Ma, Y. , Shi, W. , Peng, C.‐K. , & Yang, A. C. (2018). Nonlinear dynamical analysis of sleep electroencephalography using fractal and entropy approaches. Sleep Medicine Reviews, 37, 85–93. [DOI] [PubMed] [Google Scholar]
- Mackey, M. C. , & Glass, L. (1977). Oscillation and chaos in physiological control systems. Science, 197(4300), 287–289. [DOI] [PubMed] [Google Scholar]
- Mahato, S. , & Paul, S. (2019). Electroencephalogram (EEG) signal analysis for diagnosis of major depressive disorder (MDD): A review. In Nanoelectronics, circuits and communication systems (pp. 323–335). Springer. [Google Scholar]
- Makowski, D. , Pham, T. , Lau, Z. J. , Brammer, J. C. , Lespinasse, F. , Pham, H. , Schölzel, C. , & Chen, S. H. (2021). NeuroKit2: A Python toolbox for neurophysiological signal processing. Behavior Research Methods, 53(4), 1689–1696. [DOI] [PubMed] [Google Scholar]
- Mandelbrot, B. B. , & Wallis, J. R. (1969). Some long‐run properties of geophysical records. Water Resources Research, 5(2), 321–340. [Google Scholar]
- Mariani, S. , Borges, A. F. , Henriques, T. , Thomas, R. J. , Leistedt, S. J. , Linkowski, P. , Lanquart, J.‐P. , Goldberger, A. L. , & Costa, M. D. (2016). Analysis of the sleep EEG in the complexity domain. In 2016 38th annual international conference of the IEEE engineering in medicine and biology society (EMBC) (pp. 6429–6432). IEEE. [DOI] [PMC free article] [PubMed] [Google Scholar]
- Martinez‐Rodrigo, A. , Garcia‐Martinez, B. , Zunino, L. , Alcaraz, R. , & Fernandez‐Caballero, A. (2019). Multi‐lag analysis of symbolic entropies on EEG recordings for distress recognition. Frontiers in Neuroinformatics, 13, 40. [DOI] [PMC free article] [PubMed] [Google Scholar]
- Mateos, D. , Erra, R. G. , Wennberg, R. , & Velazquez, J. P. (2018). Measures of entropy and complexity in altered states of consciousness. Cognitive Neurodynamics, 12(1), 73–84. [DOI] [PMC free article] [PubMed] [Google Scholar]
- McIntosh, A. , Vakorin, V. , Kovacevic, N. , Wang, H. , Diaconescu, A. , & Protzner, A. (2014). Spatiotemporal dependency of age‐related changes in brain signal variability. Cerebral Cortex, 24(7), 1806–1817. [DOI] [PMC free article] [PubMed] [Google Scholar]
- McIntosh, A. R. , Kovacevic, N. , & Itier, R. J. (2008). Increased brain signal variability accompanies lower behavioral variability in development. PLoS Computational Biology, 4(7), e1000106. [DOI] [PMC free article] [PubMed] [Google Scholar]
- Mendez, M. A. , Zuluaga, P. , Hornero, R. , Gomez, C. , Escudero, J. , Rodriguez‐Palancas, A. , Ortiz, T. , & Fernandez, A. (2012). Complexity analysis of spontaneous brain activity: Effects of depression and antidepressant treatment. Journal of Psychopharmacology, 26(5), 636–643. [DOI] [PubMed] [Google Scholar]
- Miller, S. M. (2015). The constitution of phenomenal consciousness: Toward a science and theory (Vol. 92). John Benjamins Publishing Company. [Google Scholar]
- Mizuno, T. , Takahashi, T. , Cho, R. Y. , Kikuchi, M. , Murata, T. , Takahashi, K. , & Wada, Y. (2010). Assessment of EEG dynamical complexity in Alzheimer's disease using multiscale entropy. Clinical Neurophysiology, 121(9), 1438–1446. [DOI] [PMC free article] [PubMed] [Google Scholar]
- Mohammadi, M. R. , Khaleghi, A. , Nasrabadi, A. M. , Rafieivand, S. , Begol, M. , & Zarafshan, H. (2016). EEG classification of ADHD and normal children using non‐linear features and neural network. Biomedical Engineering Letters, 6(2), 66–73. [Google Scholar]
- Mohammadi, Y. , & Moradi, M. H. (2021). Prediction of depression severity scores based on functional connectivity and complexity of the EEG signal. Clinical EEG and Neuroscience, 52(1), 52–60. [DOI] [PubMed] [Google Scholar]
- Molle, M. , Marshall, L. , Wolf, B. , Fehm, H. L. , & Born, J. (1999). EEG complexity and performance measures of creative thinking. Psychophysiology, 36(1), 95–104. [DOI] [PubMed] [Google Scholar]
- Monge, J. , Gomez, C. , Poza, J. , Fernandez, A. , Quintero, J. , & Hornero, R. (2015). MEG analysis of neural dynamics in attention‐deficit/hyperactivity disorder with fuzzy entropy. Medical Engineering & Physics, 37(4), 416–423. [DOI] [PubMed] [Google Scholar]
- Murias, M. , Webb, S. J. , Greenson, J. , & Dawson, G. (2007). Resting state cortical connectivity reflected in EEG coherence in individuals with autism. Biological Psychiatry, 62(3), 270–273. [DOI] [PMC free article] [PubMed] [Google Scholar]
- Nobukawa, S. , Yamanishi, T. , Nishimura, H. , Wada, Y. , Kikuchi, M. , & Takahashi, T. (2019). Atypical temporal‐scale‐specific fractal changes in Alzheimer's disease EEG and their relevance to cognitive decline. Cognitive Neurodynamics, 13(1), 1–11. [DOI] [PMC free article] [PubMed] [Google Scholar]
- Park, J.‐H. , Kim, S. , Kim, C.‐H. , Cichocki, A. , & Kim, K. (2007). Multiscale entropy analysis of EEG from patients under different pathological conditions. Fractals, 15(04), 399–404. [Google Scholar]
- Paulus, M. P. , & Braff, D. L. (2003). Chaos and schizophrenia: Does the method fit the madness? Biological Psychiatry, 53(1), 3–11. [DOI] [PubMed] [Google Scholar]
- Paulus, M. P. , Geyer, M. A. , & Braff, D. L. (1996). Use of methods from chaos theory to quantify a fundamental dysfunction in the behavioral organization of schizophrenic patients. American Journal of Psychiatry, 153(5), 714–717. [DOI] [PubMed] [Google Scholar]
- Peng, C.‐K. , Havlin, S. , Stanley, H. E. , & Goldberger, A. L. (1995). Quantification of scaling exponents and crossover phenomena in nonstationary heartbeat time series. Chaos: An Interdisciplinary Journal of Nonlinear Science, 5(1), 82–87. [DOI] [PubMed] [Google Scholar]
- Pesin, Y. B. (1977). Characteristic lyapunov exponents and smooth ergodic theory. Uspekhi Matematicheskikh Nauk, 32(4), 55–112. [Google Scholar]
- Pham, T. , Lau, Z. J. , Chen, S. , & Makowski, D. (2021). Heart rate variability in psychology: A review of HRV indices and an analysis tutorial. Sensors, 21(12), 3998. [DOI] [PMC free article] [PubMed] [Google Scholar]
- Pincus, S. (1995). Approximate entropy (ApEn) as a complexity measure. Chaos: An Interdisciplinary Journal of Nonlinear Science, 5(1), 110–117. [DOI] [PubMed] [Google Scholar]
- Pincus, S. M. , & Goldberger, A. L. (1994). Physiological time‐series analysis: What does regularity quantify? American Journal of Physiology. Heart and Circulatory Physiology, 266(4), H1643–H1656. [DOI] [PubMed] [Google Scholar]
- Pritchard, W. S. , Duke, D. W. , & Coburn, K. L. (1991). Altered EEG dynamical responsivity associated with normal aging and probable Alzheimer's disease. Dementia and Geriatric Cognitive Disorders, 2(2), 102–105. [Google Scholar]
- Racz, F. S. , Mukli, P. , Nagy, Z. , & Eke, A. (2018). Multifractal dynamics of resting‐state functional connectivity in the prefrontal cortex. Physiological Measurement, 39(2), 024003. [DOI] [PubMed] [Google Scholar]
- Raghavendra, B. , Dutt, D. N. , Halahalli, H. N. , & John, J. P. (2009). Complexity analysis of EEG in patients with schizophrenia using fractal dimension. Physiological Measurement, 30(8), 795. [DOI] [PubMed] [Google Scholar]
- Richman, J. S. , & Moorman, J. R. (2000). Physiological time‐series analysis using approximate entropy and sample entropy. American Journal of Physiology. Heart and Circulatory Physiology, 278(6), H2039–H2049. [DOI] [PubMed] [Google Scholar]
- Robertson, I. H. , Manly, T. , Andrade, J. , Baddeley, B. T. , & Yiend, J. (1997). ‘Oops!’: Performance correlates of everyday attentional failures in traumatic brain injured and normal subjects. Neuropsychologia, 35(6), 747–758. [DOI] [PubMed] [Google Scholar]
- Rockstroh, B. , Watzl, H. , Kowalik, Z. J. , Cohen, R. , Sterr, A. , Muller, M. , & Elbert, T. (1997). Dynamical aspects of the EEG in different psychopathological states in an interview situation: A pilot study. Schizophrenia Research, 28(1), 77–85. [DOI] [PubMed] [Google Scholar]
- Roschke, J. , Fell, J. , & Beckmann, P. (1995). Nonlinear analysis of sleep EEG data in schizophrenia: Calculation of the principal lyapunov exponent. Psychiatry Research, 56(3), 257–269. [DOI] [PubMed] [Google Scholar]
- Sabeti, M. , Katebi, S. , & Boostani, R. (2009). Entropy and complexity measures for EEG signal classification of schizophrenic and control participants. Artificial Intelligence in Medicine, 47(3), 263–274. [DOI] [PubMed] [Google Scholar]
- Sassi, R. , Signorini, M. G. , & Cerutti, S. (2009). Multifractality and heart rate variability. Chaos: An Interdisciplinary Journal of Nonlinear Science, 19(2), 028507. [DOI] [PubMed] [Google Scholar]
- Schartner, M. , Seth, A. , Noirhomme, Q. , Boly, M. , Bruno, M.‐A. , Laureys, S. , & Barrett, A. (2015). Complexity of multi‐dimensional spontaneous EEG decreases during propofol induced general anaesthesia. PLoS ONE, 10(8), e0133532. [DOI] [PMC free article] [PubMed] [Google Scholar]
- Schartner, M. M. , Carhart‐Harris, R. L. , Barrett, A. B. , Seth, A. K. , & Muthukumaraswamy, S. D. (2017). Increased spontaneous MEG signal diversity for psychoactive doses of ketamine, LSD and psilocybin. Scientific Reports, 7(1), 1–12. [DOI] [PMC free article] [PubMed] [Google Scholar]
- Schartner, M. M. , Pigorini, A. , Gibbs, S. A. , Arnulfo, G. , Sarasso, S. , Barnett, L. , … Barrett, A. B. (2017). Global and local complexity of intracranial EEG decreases during NREM sleep. Neuroscience of Consciousness, 2017(1), niw022. [DOI] [PMC free article] [PubMed] [Google Scholar]
- Schoenberg, P. L. (2020). Linear and nonlinear EEG‐based functional networks in anxiety disorders. In Anxiety disorders (pp. 35–59). Springer. [DOI] [PubMed] [Google Scholar]
- Schuldberg, D. (2015). What is optimum variability? Nonlinear Dynamics, Psychology, and Life Sciences, 19(4), 553–568. [PubMed] [Google Scholar]
- Schulz, S. , Koschke, M. , Bar, K.‐J. , & Voss, A. (2010). The altered complexity of cardiovascular regulation in depressed patients. Physiological Measurement, 31(3), 303. [DOI] [PubMed] [Google Scholar]
- Seth, A. K. , Barrett, A. B. , & Barnett, L. (2011). Causal density and integrated information as measures of conscious level. Philosophical Transactions of the Royal Society a: Mathematical, Physical and Engineering Sciences, 369(1952), 3748–3767. [DOI] [PubMed] [Google Scholar]
- Shi, C. T. (2018). Signal pattern recognition based on fractal features and machine learning. Applied Sciences, 8(8), 1327. [Google Scholar]
- Shi, W. , Shang, P. , Ma, Y. , Sun, S. , & Yeh, C.‐H. (2017). A comparison study on stages of sleep: Quantifying multiscale complexity using higher moments on coarse‐graining. Communications in Nonlinear Science and Numerical Simulation, 44, 292–303. [Google Scholar]
- Simons, S. , Espino, P. , & Abásolo, D. (2018). Fuzzy entropy analysis of the electroencephalogram in patients with Alzheimer's disease: Is the method superior to sample entropy? Entropy, 20(1), 21. [DOI] [PMC free article] [PubMed] [Google Scholar]
- Sinai, Y. G. (1959). On the notion of entropy of a dynamical system. Doklady of Russian Academy of Sciences, 124, 768–771. [Google Scholar]
- Smits, F. M. , Porcaro, C. , Cottone, C. , Cancelli, A. , Rossini, P. M. , & Tecchio, F. (2016). Electroencephalographic fractal dimension in healthy ageing and Alzheimer's disease. PLoS ONE, 11(2), e0149587. [DOI] [PMC free article] [PubMed] [Google Scholar]
- Sohn, H. , Kim, I. , Lee, W. , Peterson, B. S. , Hong, H. , Chae, J.‐H. , Hong, S. , & Jeong, J. (2010). Linear and non‐linear EEG analysis of adolescents with attention‐deficit/hyperactivity disorder during a cognitive task. Clinical Neurophysiology, 121(11), 1863–1870. [DOI] [PubMed] [Google Scholar]
- Song, T. , Qu, X. F. , Zhang, Y. T. , Cao, W. , Han, B. H. , Li, Y. , Piao, J. Y. , Yin, L. L. , & Da Cheng, H. (2014). Usefulness of the heart‐rate variability complex for predicting cardiac mortality after acute myocardial infarction. BMC Cardiovascular Disorders, 14(1), 1–8. [DOI] [PMC free article] [PubMed] [Google Scholar]
- Spasic, S. , Kesic, S. , Kalauzi, A. , & Saponjic, J. (2011). Different anesthesia in rat induces distinct inter‐structure brain dynamic detected by higuchi fractal dimension. Fractals, 19(01), 113–123. [Google Scholar]
- Stam, C. , Jelles, B. , Achtereekte, H. , Rombouts, S. , Slaets, J. , & Keunen, R. (1995). Investigation of EEG non‐linearity in dementia and Parkinson's disease. Electroencephalography and Clinical Neurophysiology, 95(5), 309–317. [DOI] [PubMed] [Google Scholar]
- Suckling, J. , Wink, A. M. , Bernard, F. A. , Barnes, A. , & Bullmore, E. (2008). Endogenous multifractal brain dynamics are modulated by age, cholinergic blockade and cognitive performance. Journal of Neuroscience Methods, 174(2), 292–300. [DOI] [PMC free article] [PubMed] [Google Scholar]
- Sun, J. , Wang, B. , Niu, Y. , Tan, Y. , Fan, C. , Zhang, N. , Xue, J. , Wei, J. , & Xiang, J. (2020). Complexity analysis of EEG, MEG, and fMRI in mild cognitive impairment and Alzheimer's disease: A review. Entropy, 22(2), 239. [DOI] [PMC free article] [PubMed] [Google Scholar]
- Takahashi, T. , Cho, R. Y. , Mizuno, T. , Kikuchi, M. , Murata, T. , Takahashi, K. , & Wada, Y. (2010). Antipsychotics reverse abnormal EEG complexity in drug‐naive schizophrenia: A multiscale entropy analysis. NeuroImage, 51(1), 173–182. [DOI] [PMC free article] [PubMed] [Google Scholar]
- Tang, S.‐C. , Jen, H.‐I. , Lin, Y.‐H. , Hung, C.‐S. , Jou, W.‐J. , Huang, P.‐W. , Shieh, J.‐S. , Ho, Y.‐L. , Lai, D.‐M. , Wu, A.‐Y. , Jeng, J.‐S. , & Chen, M.‐F. (2015). Complexity of heart rate variability predicts outcome in intensive care unit admitted patients with acute stroke. Journal of Neurology, Neurosurgery & Psychiatry, 86(1), 95–100. [DOI] [PubMed] [Google Scholar]
- Thietart, R.‐A. , & Forgues, B. (1995). Chaos theory and organization. Organization Science, 6(1), 19–31. [Google Scholar]
- Thilakvathi, B. , Shenbaga Devi, S. , Bhanu, K. , & Malaippan, M. (2017). EEG signal complexity analysis for schizophrenia during rest and mental activity. Biomedical Research‐India, 28(1), 1–9. [Google Scholar]
- Thomasson, N. , Pezard, L. , Allilaire, J.‐F. , Renault, B. , & Martinerie, J. (2000). Nonlinear EEG changes associated with clinical improvement in depressed patients. Nonlinear Dynamics, Psychology, and Life Sciences, 4(3), 203–218. [Google Scholar]
- Thomasson, N. , Pezard, L. , Boyer, P. , Renault, B. , & Martinerie, J. (2002). Nonlinear EEG changes in a 48‐hour cyclic manic‐depressive patient. Nonlinear Dynamics, Psychology, and Life Sciences, 6(3), 259–267. [Google Scholar]
- Tibdewal, M. N. , Dey, H. R. , Mahadevappa, M. , Ray, A. , & Malokar, M. (2017). Multiple entropies performance measure for detection and localization of multi‐channel epileptic EEG. Biomedical Signal Processing and Control, 38, 158–167. [Google Scholar]
- Tor, H. T. , Ooi, C. P. , Lim‐Ashworth, N. S. , Wei, J. K. E. , Jahmunah, V. , Oh, S. L. , Acharya, U. R. , & Fung, D. S. S. (2021). Automated detection of conduct disorder and attention deficit hyperactivity disorder using decomposition and nonlinear techniques with EEG signals. Computer Methods and Programs in Biomedicine, 200, 105941. [DOI] [PubMed] [Google Scholar]
- Torre, K. , Vergotte, G. , Viel, E. , Perrey, S. , & Dupeyron, A. (2019). Fractal properties in sensorimotor variability unveil internal adaptations of the organism before symptomatic functional decline. Scientific Reports, 9(1), 1–11. [DOI] [PMC free article] [PubMed] [Google Scholar]
- Tretter, F. , Gebicke‐Haerter, P. , An der Heiden, U. , Rujescu, D. , Mewes, H. , & Turck, C. (2011). Affective disorders as complex dynamic diseases—A perspective from systems biology. Pharmacopsychiatry, 44(S 01), S2–S8. [DOI] [PubMed] [Google Scholar]
- Tripathy, R. K. , Deb, S. , & Dandapat, S. (2017). Analysis of physiological signals using state space correlation entropy. Healthcare Technology Letters, 4(1), 30–33. [DOI] [PMC free article] [PubMed] [Google Scholar]
- Udhayakumar, R. K. , Karmakar, C. , & Palaniswami, M. (2017). Approximate entropy profile: A novel approach to comprehend irregularity of short‐term HRV signal. Nonlinear Dynamics, 88(2), 823–837. [Google Scholar]
- Vaillancourt, D. E. , & Newell, K. M. (2002). Changing complexity in human behavior and physiology through aging and disease. Neurobiology of Aging, 23(1), 1–11. [DOI] [PubMed] [Google Scholar]
- Valencia, J. F. , Porta, A. , Vallverdu, M. , Claria, F. , Baranowski, R. , Orlowska‐Baranowska, E. , & Caminal, P. (2009). Refined multiscale entropy: Application to 24‐h holter recordings of heart period variability in healthy and aortic stenosis subjects. IEEE Transactions on Biomedical Engineering, 56(9), 2202–2213. [DOI] [PubMed] [Google Scholar]
- Vallat, R. (2021). Antropy. GitHub repository. https://github.com/raphaelvallat/antropy [Google Scholar]
- van Noordt, S. , & Willoughby, T. (2021). Cortical maturation from childhood to adolescence is reflected in resting state EEG signal complexity. Developmental Cognitive Neuroscience, 48, 100945. [DOI] [PMC free article] [PubMed] [Google Scholar]
- Vergotte, G. , Perrey, S. , Muthuraman, M. , Janaqi, S. , & Torre, K. (2018). Concurrent changes of brain functional connectivity and motor variability when adapting to task constraints. Frontiers in Physiology, 9, 909. [DOI] [PMC free article] [PubMed] [Google Scholar]
- Wang, Y. , Chai, F. , Zhang, H. , Liu, X. , Xie, P. , Zheng, L. , Yang, L. , Li, L. , & Fang, D. (2016). Cortical functional activity in patients with generalized anxiety disorder. BMC Psychiatry, 16(1), 1–7. [DOI] [PMC free article] [PubMed] [Google Scholar]
- Wolf, A. , Swift, J. B. , Swinney, H. L. , & Vastano, J. A. (1985). Determining lyapunov exponents from a time series. Physica D: Nonlinear Phenomena, 16(3), 285–317. [Google Scholar]
- Wolkin, A. , Sanfilipo, M. , Wolf, A. P. , Angrist, B. , Brodie, J. D. , & Rotrosen, J. (1992). Negative symptoms and hypofrontality in chronic schizophrenia. Archives of General Psychiatry, 49(12), 959–965. [DOI] [PubMed] [Google Scholar]
- Xiang, J. , Tian, C. , Niu, Y. , Yan, T. , Li, D. , Cao, R. , Guo, H. , Cui, X. , Cui, H. , Tan, S. , & Wang, B. (2019). Abnormal entropy modulation of the EEG signal in patients with schizophrenia during the auditory paired‐stimulus paradigm. Frontiers in Neuroinformatics, 13, 4. [DOI] [PMC free article] [PubMed] [Google Scholar]
- Xie, H.‐B. , He, W.‐X. , & Liu, H. (2008). Measuring time series regularity using nonlinear similarity‐based sample entropy. Physics Letters a, 372(48), 7140–7146. [Google Scholar]
- Xue, Y. , & Bogdan, P. (2017). Reliable multi‐fractal characterization of weighted complex networks: Algorithms and implications. Scientific Reports, 7(1), 1–22. [DOI] [PMC free article] [PubMed] [Google Scholar]
- Yakovleva, T. V. , Kutepov, I. E. , Karas, A. Y. , Yakovlev, N. M. , Dobriyan, V. V. , Papkova, I. V. , Zhigalov, M. V. , Saltykova, O. A. , Krysko, A. V. , Yaroshenko, T. Y. , Erofeev, N. P. , & Krysko, V. A. (2020). EEG analysis in structural focal epilepsy using the methods of nonlinear dynamics (Lyapunov exponents, Lempel–Ziv complexity, and multiscale entropy). The Scientific World Journal, 2020, 8407872. [DOI] [PMC free article] [PubMed] [Google Scholar]
- Yang, A. C. , & Tsai, S.‐J. (2013). Is mental illness complex? From behavior to brain. Progress in Neuro‐Psychopharmacology and Biological Psychiatry, 45, 253–257. [DOI] [PubMed] [Google Scholar]
- Yang, A. C. , Wang, S.‐J. , Lai, K.‐L. , Tsai, C.‐F. , Yang, C.‐H. , Hwang, J.‐P. , Lo, M.‐T. , Huang, N. E. , Peng, C.‐K. , & Fuh, J.‐L. (2013). Cognitive and neuropsychiatric correlates of EEG dynamic complexity in patients with Alzheimer's disease. Progress in Neuro‐Psychopharmacology and Biological Psychiatry, 47, 52–61. [DOI] [PubMed] [Google Scholar]
- Zadeh, L. A. (1996). On fuzzy algorithms, Fuzzy sets, fuzzy logic, and fuzzy systems: Selected papers by Lotfi a Zadeh (pp. 127–147). World Scientific. [Google Scholar]
- Zappasodi, F. , Marzetti, L. , Olejarczyk, E. , Tecchio, F. , & Pizzella, V. (2015). Age‐related changes in electroencephalographic signal complexity. PLoS ONE, 10(11), e0141995. [DOI] [PMC free article] [PubMed] [Google Scholar]
- Zarafshan, H. , Khaleghi, A. , Mohammadi, M. R. , Moeini, M. , & Malmir, N. (2016). Electroencephalogram complexity analysis in children with attention‐deficit/hyperactivity disorder during a visual cognitive task. Journal of Clinical and Experimental Neuropsychology, 38(3), 361–369. [DOI] [PubMed] [Google Scholar]
- Zhang, X.‐S. , Roy, R. J. , & Jensen, E. W. (2001). EEG complexity as a measure of depth of anesthesia for patients. IEEE Transactions on Biomedical Engineering, 48(12), 1424–1433. [DOI] [PubMed] [Google Scholar]
- Zheng, J. , Cheng, J. , Yang, Y. , & Luo, S. (2014). A rolling bearing fault diagnosis method based on multi‐scale fuzzy entropy and variable predictive model‐based class discrimination. Mechanism and Machine Theory, 78, 187–200. [Google Scholar]
- Zorick, T. , & Mandelkern, M. A. (2013). Multifractal detrended fluctuation analysis of human EEG: Preliminary investigation and comparison with the wavelet transform modulus maxima technique. PLoS ONE, 8(7), e68360. [DOI] [PMC free article] [PubMed] [Google Scholar]
Associated Data
This section collects any data citations, data availability statements, or supplementary materials included in this article.
Data Availability Statement
No datasets were generated or analysed in the present study.