

Abstract
Background
The aim of this review was to determine the prevalence of return to work (RTW) amongst head and neck cancer (HNC) survivors and to determine its impact on quality of life (QoL).
Methods
A literature search was conducted in PubMed, Scopus, Embase and CINAHL in March 2021. Articles were included if they reported the number of patients with HNC receiving definitive treatment who were working at the time of diagnosis and returned to work.
Results
There were 21 articles deemed eligible for inclusion. Meta‐analysis suggested that 67% of patients with HNC who were employed at diagnosis RTW (95% CI 62%–73%, I 2 = 97.53%). Patients who RTW were demonstrated to have lower levels of anxiety and depressive symptoms on the Hospital Anxiety and Depression Scale.
Conclusions
Return to work is an important clinical outcome which must be considered in the survivorship care of patients with HNC.
Keywords: head and neck, head and neck cancer, otorhinolaryngology, Quality of life, return to work
1. INTRODUCTION
Head and neck squamous cell carcinoma (HNSCC) is the sixth most common cancer worldwide and encompasses tumors of the oral cavity, larynx, pharynx and sinonasal tract. The incidence of HNSCC is expected to further increase due to the rising rates of HPV (human papillomavirus) related oropharyngeal cancers, especially in developed countries where rates of tobacco use are declining. While the median age of diagnosis of HNSCC is 66, the median age of patients with HPV related HNSCC is much lower at 53. 1 Patients with HNC frequently require treatment with a multimodal approach, consisting of various combinations of surgery, radiotherapy, or chemotherapy. 2 , 3 Procedures such as laryngectomies, neck dissections and reconstructive procedures contribute to the morbidity burden in HNC patients. 4 Treatment‐related adverse effects for these patients can include swallowing difficulties, xerostomia, and impeded speech. 5 Previous research has suggested that patients with HNC may have more difficulties returning to work than those with other solid tumors. This is thought to be due to factors such as impacts upon speaking and swallowing, receipt of multi‐modal therapy and possible disfigurement from treatment. 6 Returning to work creates a sense of return to normalcy and appreciation through mechanisms such as social participation. 7 Conversely, the inability to RTW for cancer survivors has been suggested to result in financial loss, social isolation, and reduction of self‐esteem. 8 Failure to RTW post‐cancer treatment has been shown to be a factor that contributes towards financial toxicity, which leads to a number of negative outcomes such as reduced quality of life, distress and anxiety. 9 Concerningly, a review investigating interventions to improve RTW for cancer survivors found limited studies investigating this topic and no improvement RTW rate amongst the randomized controlled studies. 10
While there have been previous studies investigating RTW rates for all cancer types, no review exists specifically focusing on the head and neck cancer population. Given the unique challenges faced by this cohort of patients, specific attention is required to identify the RTW rate in this population, as well as to consider the number of people that are required to either reduce their work hours or change their type of work. Therefore, the aim of this systematic review and meta‐analysis was to define the prevalence of RTW amongst HNC survivors and compare QoL between those who RTW and those who do not.
2. METHODS
This study was performed following the PRISMA guidelines for systematic reviews.
2.1. Eligibility criteria
Studies were included if they met the following inclusion and exclusion criteria. There were no limits on the year of publication.
2.1.1. Inclusion criteria
Included patients with HNC (oral cavity, nasopharynx, oropharynx, hypopharynx larynx, salivary glands, or paranasal sinuses) receiving any form of definitive treatment (surgery, chemotherapy, or radiotherapy).
Reported number of patients who were working at time of diagnosis that returned to any form of work after completion of HNC treatment
All types of research designs were considered eligible for inclusion (e.g., retrospective or prospective)
2.1.2. Exclusion criteria
Studies that did not report number of patients who returned to work
Studies that included all tumor types and not HNC alone
Published in a language other than English
Conference abstracts and other gray literature (e.g., book chapters)
2.1.3. Information sources and search strategy
The databases PubMed, Scopus, Embase and CINAHL were searched on the 3rd of March 2021. Searches were limited to studies published in English and those that were published up until the date of study search. The search strategy for PubMed is presented below, with appropriate alterations made for use in each individual database.
((“head and neck” OR “oral” OR nasopharyngeal OR nasopharynx OR laryngeal OR larynx OR hypopharyngeal OR hypopharynx OR oropharyngeal OR glottic OR nasopharynx OR nasopharyngeal OR “upper aerodigestive tract” OR “UADT” OR Trachea OR Tracheal or otorhinolaryngologic OR otorhinolaryngological OR “Salivary Gland” OR Salivary OR Palatal OR Mouth OR Gingival OR Neck OR Head) AND (“cancer” OR “carcinoma” OR “neoplasm” OR “neoplasms” OR “malignancy” OR “squamous cell”)) AND (“return to work” OR “work engagement” OR “employment” OR “back to work” OR “occupation” OR “work market” OR “workforce”)
2.1.4. Study selection process
The articles were screened based on their titles and abstracts by the first author who created a list of articles for full text review. These articles were then screened independently in full text by the first and second authors to assess for eligibility.
2.2. Data collection
A single reviewer (JY) extracted the data from the primary text, tables and supplementary appendices into the data extraction form. The data was then checked for accuracy by a second reviewer (JS) and third reviewer (RM).
2.3. Data items
Extracted data included information on study methodology, participant characteristics and study outcomes. The extracted data items for each study are demonstrated in Table 1. This included country of publication, study design, sample size, age exclusion criteria, age, sex, tumor location and stage, treatment received, RTW rate, percentage of people that had reduced work hours or changed employment and the quality of life assessment tools used. Instruments that measured symptoms of anxiety or depression were also included as part of the quality of life section.
TABLE 1.
Characteristics of included studies
| Author (Year) | Country | Study design | Sample size | Follow‐up time | Age exclusion criteria | Age (years) | Male (%) | Occupation (%) | Tumor location (%) | Tumor clinical stage (%) | Treatment (%) | RTW (%) | Reduced hours (%) | Changed work (%) | Notes |
|---|---|---|---|---|---|---|---|---|---|---|---|---|---|---|---|
| Vartanian et al. (2006) 27 | Brazil | Cross‐sectional | 301 | Minimum of 2 years disease free | – | 52 (median) | 78.4 | – |
Oral cavity—52.5 Oropharynx—18.3 Larynx—25.9 Hypopharynx—3.3 |
I—17.3 II—23.9 III—31.2 IV—27.6 |
Surgery—52.8 RT—11.4 Surgery + RT—32.8 Surgery + Chemo RT—3 |
67.1 | – | – | Included only patients that were employed at time of diagnosis |
| Buckwalter et al. (2007) 12 | United States | Prospective observational | 211 | Followed up to 12 months post diagnosis | – | 52.7 (mean) | 76.2 | – |
Oral cavity—33.5 Oropharynx—30.1 Hypopharynx—4.2 Larynx—19.2 Other/Unknown—13 |
I–II—33.9 III–IV—60.7 Unknown—5.4 |
Surgery—31 RT—12.6 Surgery + RT—33 Chemo RT—15 Surgery + Chemo RT—4.6 Other—1.7 Unknown—2.1 |
57.8 | – | – |
Patients completed surveys at 3, 6, 9 and 12 months post diagnosis RTW rate reported within 1 year of diagnosis |
| Verdonck‐de Leeuw et al. (2010) 26 | Netherlands | Cross‐sectional | 53 | Minimum of 2 years post curative treatment | ≥65 | 59 (median) | 64 | – |
Oral cavity/oropharynx—37 larynx—34 nasopharynx—18 other—12 |
I—38 II—17 III—19 IV—27 |
Surgery—21 Radiotherapy—32 Surgery and Radiotherapy—27 Chemo RT—20 |
83 | – | 30.2 | |
| Kjær et al. (2013) 36 | Denmark | Population based cohort study | 1808 | – | >60 | 52 (median) | 80 |
Oral cavity—22.1 Oropharynx—37.1 Larynx—32.2 Hypopharynx—8.6 |
I—18.8 II—19.8 III—20.1 IV—41.3 |
RT—92.9 Surgery + RT—5.9 Chemo RT—1.2 |
84.6 | – | – | RTW measured 1 year after diagnosis | |
| Handschel et al. (2013) 22 | Germany | Cross‐sectional | 755 | – | – | – | – |
Blue Collar—51 White Collar—49 |
– | – | – | 51 | – | 50.2 |
Demonstrated that white collar workers had a higher RTW rate (59%) compared to blue collar workers (37%) Changed employment defined as changing profession from before diagnosis |
| Koch et al. (2014) 30 | Germany | Cross‐sectional | 42 | Minimum of 2 years posttreatment | >60 |
Diagnosis‐47.3 (mean) Survey‐53 (mean) |
80 |
Blue Collar—50 White Collar – 50 |
Oral cavity—15 Oropharynx—27 Larynx—22 Hypopharynx—9 Nasopharynx—13 Paranasal sinus—6 Salivary glands—9 |
I—18 II—24 III—26 IV—33 Staged using UICC |
Surgery—94.5 RT—67.3 Chemotherapy—21.8 |
42.9 | – | – | Demographics reported for whole cohort, not for those only employed at diagnosis |
| Gallagher et al. (2015) 37 | Canada | Cross‐sectional | 98 | Minimum 1 year post treatment | – | 57.4 (mean) | 76 | – | – |
I–II—34 III—IV—59 |
Surgery—25 Surgery + RT—75 |
68.4 | – | – | Demographics reported for whole cohort, not for those only employed at diagnosis |
| Pearce et al. (2015) 24 | Ireland | Cross‐sectional | 264 | Minimum 8 months post diagnosis | – | 52 (mean) | 71.2 |
Professional—30.3 Service—15.5 Manual—39.8 Unknown—14.4 |
Pharynx—22.7 Larynx—31.8 Other—45.5 |
I—29.5 II—17.4 III—14 IV—22 Unknown—17 |
Surgery—68.6 RT—65.5 Chemotherapy—25 |
62.9 | 52 | – | |
| Baxi et al. (2016) 6 | United States | Cross‐sectional | 102 |
Minimum 12 months post diagnosis Median—23 months |
– | 57 (median) | 94.1 |
Professional—52 Officer and Manager—8.8 Executive or Senior Officer—7.8 Sales Worker—7.8 Craft Worker—5.8 Other—9.8 Not provided—7.8 |
Oropharynx (HPV +ve)—100 |
III—14.7 IVA/IVB—85.3 |
Chemo RT—96.1 Surgery + Chemo RT—3.9 |
85.3 | – | – | |
| Isaksson et al. (2016) 13 | Sweden | Prospective | 57 | All patients followed up for 24 months | – | 54.6 (mean) | 76 | – |
Oral cavity—20 Oropharynx—42 Larynx—11 Hypopharynx—2 Nasopharynx—6 Sinuses—3 Salivary Glands—9 Unknown Primary ‐ 8 |
77 |
Surgery—2 RT—32 Surgery + RT—50 Chemo RT ± Surgery—17 |
61.4 | – | – |
RTW rate at 24 months used (also reported at 6 and 12 months) Demographics reported for whole cohort, not for those only employed at diagnosis |
| Argawal et al. (2017) 25 | India | Cross‐sectional | 250 |
Minimum 6 months post treatment Median—19 months |
≥60 | 48 (median) | 87.6 | – |
Oral cavity—65.2 Oropharynx—10.8 Larynx—7.2 Hypopharynx—8.8 Other—8 |
I–II—11.2 III—19.6 IV—69.2 |
Surgery + RT—42.8 Chemo RT—24.4 Surgery + Chemo RT—32.8 |
81.2 | 44.8 | 24.1 | |
| Costa et al. (2018) 31 | Spain | Cross‐sectional | 62 | Minimum 2 years post treatment | – | 53 (mean) | 89 |
High/Intermediate Qualifications—41 Manual workers—59 |
Larynx/Hypopharynx—100 | – | – | 53.2 | – | – | All patients that had total laryngectomy |
| Guiliani et al. (2018) 5 | Canada | Cross‐sectional | 64 | No minimum follow‐up period | >65 | 56.5 (median) | 63.5 |
Oral cavity—28.1 Oropharynx—21.9 Larynx/Hypopharynx—14 Others—35.9 |
– |
Surgery—14.1 RT—7.8 Surgery + RT—50 Chemo RT—23.4 Unknown—4.7 |
67.2 | 48.4 | – | 71.2% of patients completed treatment for greater than 6 months | |
| Chen et al. (2019) 14 | Taiwan | Cross‐sectional | 174 |
Minimum 6 months post treatment Median—33 months |
>64.5 | 53.4 (mean) | – |
Unskilled/semiskilled—69.5 Skilled—25.9 Clerk, shop, farm owner—2.3 Semi‐profession—2.3 Profession—0 |
Oral cavity—100 |
I—34.5 II—21.8 III—14.9 IV—28.7 |
Surgery—52.9 Surgery + RT—11.5 Surgery + Chemo—8 Surgery + Chemo RT—27.6 |
55.2 | – | 22.9 | Patients at least 6 months post completion of treatment |
| Check et al. (2019) 16 | United States | Cross‐sectional | 675 |
Minimum 12 months post treatment Median—72 months |
– |
Diagnosis‐53.2 (mean) Survey‐60.3 (mean) |
88.1 | – | Oropharynx—100 |
I–II—5.3 III–IV—94.7 |
Surgery—0.6 RT—29.9 Surgery + RT—1 Chemo RT—67.1 Surgery + Chemo RT—1.3 |
67.7 | – | – | Patients at least 12 months post completion of treatment |
| Morales et al. (2019) 17 | Australia | Cross‐sectional | 68 |
Minimum 4 months post treatment Mean—31.2 months |
>65 |
Diagnosis‐54.1 (mean) Survey‐57 (mean) |
89.7 |
Blue Collar—32.4 White Collar—67.6 |
Oropharynx (HPV +ve)—100 |
I—7.4 II—67.6 III—25 |
RT—7.4 Surgery + RT—1.5 Chemo RT—85.3 Surgery + Chemo RT—5.9 |
85.3 | 39.7 | 19.6 | |
| Chen et al. (2020) 20 | Taiwan | Cross‐sectional | 150 |
No minimum follow‐up Mean—63.6 months |
– | 63 0.1 (mean) | 94 | – |
Oral cavity—82 Oropharynx, Hypopharynx and Larynx—18 |
I—18.7 II—28 III—17.3 IV—36 |
– | 38.7 | – | – | |
| Chen et al (2020) 15 | Taiwan | Retrospective cohort | 10 342 | 5 years | – | 49.1 (mean) | 91.6 | – | Oral cavity—100 | – |
Surgery—55.8 RT—35.1 Chemo—22.2 |
85 | – | – | 1 year RTW rate used (also reported 2, 3, 4 and 5 year RTW) |
| Granstrom et al. (2020) 18 | Sweden | Cross‐sectional | 249 | All patients completed survey 15 months post diagnosis | ≥62 | 55 (median) | 72 | – | Oropharynx—100 | 87 |
RT—35.9 Chemo RT—42 Surgery + RT—13.6 Surgery + Chemo RT—8.5 |
83.9 | – | – | Demographics reported for whole cohort, not for those only employed at diagnosis |
| So et al. (2020) 19 | Canada | Cross‐sectional | 73 |
Minimum 4 years post treatment Median—87.6 months |
≥65 | 52 (mean) | 71 |
Manager or Professional—38 Operator, laborer—25 Sales, technical or administrative—19 Service—15 Other—3 |
Nasopharynx—100 |
I—5 II—15 III—48 IVA—18 IVB—14 |
RT ± Chemo—100 | 61.6 | 31.1 | – | Included only patients greater than 4 years disease free |
| Rangabashyam et al. (2021) 21 | Singapore | Cross‐sectional mixed methods | 80 |
Minimum 6 months post treatment Median—50.9 months (RTW) Median—31.3 months (no RTW) |
>65 | 50.1 (mean) | 70 |
Blue Collar—45 White Collar—38.8 Pink Collar—16.3 |
Oral cavity—48.8 Nasopharynx—33.8 Others—17.5 |
I–II—58.8 III–IV—41.3 |
Surgery—68.8 RT—71.25 Chemo—42.5 |
56.3 | – | – |
Number of patients working at time of diagnosis.
2.4. Risk of bias assessment
Studies deemed eligible for inclusion were assessed for quality using the Joanna Briggs Institute Critical Appraisal Checklist for Analytical Cross‐Sectional Studies. 11 This critical appraisal checklist includes eight items, which are scored as Yes, No, or Unclear. A score of eight indicates that all criteria were addressed in the study. The quality assessment was completed independently by two authors, and disagreements were discussed to reach a final quality appraisal score.
2.5. Synthesis methods
A meta‐analysis was performed for the outcomes: RTW and quality of life (QoL). A pooled prevalence of the prevalence of RTW, reduced hours and changed work was calculated with 95% confidence intervals. These variables were all coded as a dichotomous variable (either yes or no). To compare differences in QoL for those that returned to work and those that did not, a meta‐analysis of mean differences in QoL scores was performed. Meta‐analysis was performed using Stata V16 and a random effects model was used given expected heterogeneity across studies. Statistical significance was defined as p < 0.05 and 95% confidence intervals were reported. Study heterogeneity was evaluated through examination of I 2 values. Possible causes of heterogeneity in results were examined using sub‐group analysis to determine if any patient, tumor, or geographical characteristics were causing variations in the results. Analyses were conducted with the subgroup variables coded as follows: oropharyngeal only versus other tumor subsites, age ≥ 55 versus age < 55 and age ≥ 60 versus age < 60, age exclusion criteria versus no age exclusion criteria, advanced stage (stages III and IV) >50% versus less than 50% and region (America, Europe, Asia, or Australia).
2.6. Risk of bias across studies
Funnel plots were created and examined to assess for the presence of publication bias.
3. RESULTS
3.1. Study selection
The initial search identified 4344 studies, with 1625 duplicates removed to leave a total of 2719 studies for abstract and title screening (Figure 1). There were 56 articles deemed suitable for full‐text analysis, from which 21 studies were eligible for inclusion.
FIGURE 1.
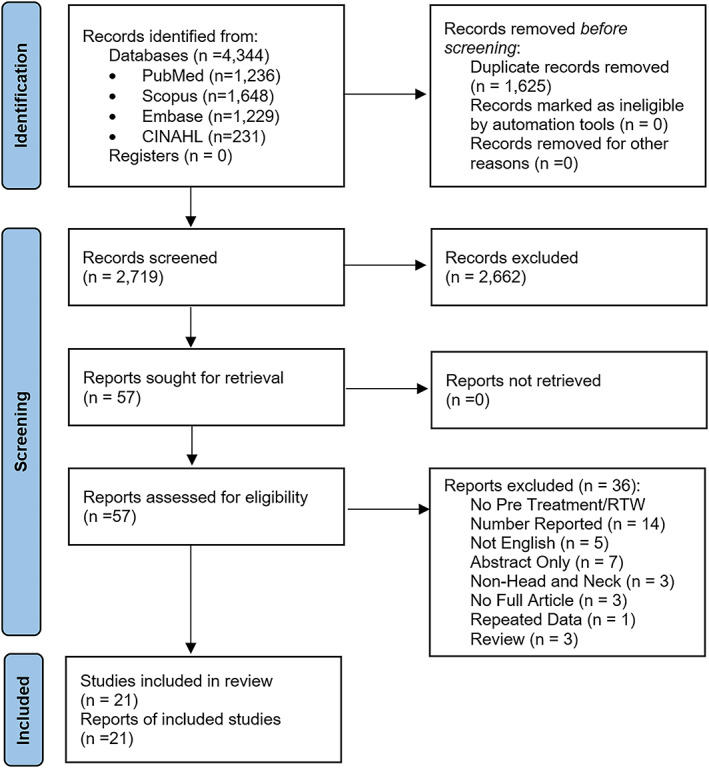
PRISMA flow diagram [Color figure can be viewed at wileyonlinelibrary.com]
3.2. Study characteristics
A summary of included study characteristics is demonstrated in Table 1. There was a total of 15 878 patients included across the 21 studies. There were two studies that involved prospective follow‐up (Buckwalter et al. 12 and Isaksson et al. 13 ), while the rest were retrospective or cross‐sectional. Studies were conducted in a variety of geographical locations such as North America, Asia, Europe and Australia. There were only 10 studies that had an upper age limit as part of their exclusion criteria for study eligibility. Most studies included patients with varying head and neck cancer subsites, but two included patients with only oral cavity tumors, 14 , 15 while three studies including only oropharyngeal tumors. 16 , 17 , 18 There was one study by So et al. 19 that included only patients with nasopharyngeal tumors. Most studies had a minimum follow‐up period of at least 6 months post treatment as part of their eligibility criteria. Some studies had longer follow‐up periods, with the study by So et al. 19 having a minimum follow‐up period of 4 years post treatment, and studies by Chen et al. 20 and Rangabashyam et al. 21 having median follow‐ups of 63.6 and 50.9 (RTW group) months, respectively.
3.3. Risk of bias in studies
The quality assessment results using the Joanna Briggs Institute Critical Appraisal Checklist for Analytical Cross‐Sectional Studies is demonstrated in Table 2. Overall, the quality of included studies was relatively high, with 11 studies meeting all the assessed criteria. There were two studies that only met 4 of the 8 criteria 6 , 22 and one that met 5 of the 8 criteria. 23
TABLE 2.
Quality assessment of included studies
| Author (year) | Were the criteria for inclusion in the sample clearly defined? | Were the study subject and the setting described in detail? | Was the exposure measured in a valid and reliable way? | Were objective, standard criteria used for measurement of the condition? | Were confounding factors identified? | Were strategies to deal with confounding factors stated? | Were the outcomes measured in a valid and reliable way? | Was appropriate statistical analysis used? | No. criteria met |
|---|---|---|---|---|---|---|---|---|---|
| Vartanian et al. (2006) 27 | Yes | Yes | Yes | Yes | Yes | Yes | Yes | Yes | 8 |
| Buckwalter et al. (2007) 12 | Yes | Yes | Yes | Yes | Yes | Yes | Yes | Yes | 8 |
| Liu et al. (2008) 23 | Yes | No | Yes | Yes | No | No | Yes | Yes | 5 |
| Verdonck‐de Leeuw et al. (2010) 26 | Yes | Yes | Yes | Yes | Yes | Yes | Yes | Yes | 8 |
| Kjær et al. (2013) 36 | Yes | Yes | Yes | Yes | Yes | Yes | Yes | Yes | 8 |
| Handshcel et al. (2013) 22 | Unclear | Yes | Yes | Yes | No | No | Yes | Unclear | 4 |
| Koch et al. (2014) 30 | Yes | Yes | Yes | Yes | Yes | Yes | Yes | Yes | 8 |
| Gallagher et al. (2015) 37 | Yes | Yes | Yes | Yes | Yes | Yes | Yes | Yes | 8 |
| Pearce et al. (2015) 24 | Yes | Yes | Yes | Yes | Yes | Yes | Yes | Yes | 8 |
| Baxi et al. (2016) 6 | Yes | No | Yes | Yes | Unclear | No | Yes | Unclear | 4 |
| Isaksson et al. (2016) 13 | Yes | Yes | Yes | Yes | Yes | Yes | Yes | Yes | 8 |
| Argawal et al. (2017) 25 | Yes | Yes | Yes | Yes | Unclear | No | Yes | Yes | 6 |
| Costa et al. (2018) 31 | Yes | Yes | Yes | Yes | Yes | Yes | Yes | Yes | 7 |
| Guiliani et al. (2018) 5 | Yes | Yes | Yes | Yes | No | No | Yes | Yes | 6 |
| Chen et al. (2019) 14 | Yes | Unclear | Yes | Yes | Yes | Yes | Yes | Yes | 7 |
| Check et al. (2019) 16 | Yes | Yes | Yes | Yes | Unclear | Unclear | Yes | Yes | 7 |
| Morales et al. (2019) 16 | Yes | Yes | Yes | Yes | Yes | Yes | Yes | Yes | 8 |
| Chen et al. (2020) 20 | Yes | Yes | Yes | Yes | No | Yes | Yes | Yes | 7 |
| Chen et al. (2020) 15 | Yes | Yes | Yes | Yes | Yes | Yes | Yes | Yes | 8 |
| So et al. (2020) 19 | Yes | Unclear | Yes | Yes | Yes | Yes | Yes | Yes | 7 |
| Granstrom et al. (2020) 31 | Yes | Yes | Yes | Yes | Unclear | Unclear | Yes | Yes | 6 |
| Rangabashyam et al. (2021) 21 | Yes | Yes | Yes | Yes | Yes | Yes | Yes | Yes | 8 |
3.4. Return to work
The meta‐analysis demonstrated that the pooled prevalence of RTW in HNC survivors was 67% (95% CI 62%–73%, I 2 = 97.53%, Figure 2). There was high heterogeneity in the reported rate of RTW between studies, as evident by the I 2 value of 97.53%. There were five studies which reported data on number of people who returned to work but had reduced hours. 5 , 17 , 19 , 24 , 25 A meta‐analysis of these studies demonstrated that 44% of HNC survivors worked a reduced number of hours (95% CI 38%–51%, I 2 = 49.62%, Figure 3). There were also five studies that reported the number of people who returned to work but had changed occupations. 14 , 17 , 22 , 25 , 26 The meta‐analysis found that 30% of HNC survivors had to change work after completion of their treatment (95% CI 15%–45%, I 2 = 95.64%, Figure 4), although there was significant heterogeneity in this finding.
FIGURE 2.

Forest plot for RTW in HNC survivors [Color figure can be viewed at wileyonlinelibrary.com]
FIGURE 3.

Forest plot for reduced work hours in HNC survivors [Color figure can be viewed at wileyonlinelibrary.com]
FIGURE 4.

Forest plot for changed work in HNC survivors [Color figure can be viewed at wileyonlinelibrary.com]
3.5. Quality of life
As demonstrated in Table 3 there were nine studies that reported QoL outcomes for a RTW and non‐RTW groups, with a wide variation in tools used. A meta‐analysis was only able to be performed for the Hospital Anxiety and Depression Scale (HADS) using three studies, which showed that patients who RTW had lower anxiety symptoms compared to patients who did not RTW with a mean difference of 1.84 (95% CI −2.89 to −0.79, p < 0.01, I 2 = 0%, Figure 5). There was also a lower level of depressive symptoms amongst patients who RTW, with a mean difference in HADS of 1.94 (95% CI −2.95 to −0.92, p < 0.01, I 2 = 0%, Figure 6). All studies reporting HADS scores had long follow‐up periods, with the study by Chen et al. 20 having a median follow‐up of 63.6 months, the study by So et al. 19 having a median follow‐up of 87.6 months and the study by Verdonck et al. 26 only included patients that were at least 2 years post treatment. The two studies reporting outcomes for UW‐QOL 14 , 27 both reported improved QoL for the RTW group. The study by Chen et al. 14 demonstrated that the RTW group had an improved physical function and social–emotional function when compared to the non‐RTW group. Studies reporting EORTC had mixed results with the RTW group found to have improved scores in various sub‐scales across different studies. For example, the study by Verdonck et al. 26 found that the RTW group had an improvement in loss of appetite, social eating, social contact, teeth, opening mouth, dry mouth and sticky saliva compared to the non RTW group. The study by Agarwal et al. 25 found a higher global QoL for the RTW group (77.5 vs. 72.3, p = 0.014), as well as a reduced symptom burden from coughing but more problems with sticky saliva. Granstrom et al. 18 reported that local pain, swallowing, appearance and trouble talking on the phone were all associated with RTW. Both studies that reported data for MDASI‐HN found that the RTW group had a lower symptom burden, with Check et al. 16 demonstrating lower total symptom, total interference, and total severity. So et al. 19 highlighted that the RTW group had a lower symptom severity score. There were two studies that investigated FACT‐HN and both found that the RTW group had a statistically significant increased total score (improved QoL). 17 , 19
TABLE 3.
Quality of life assessment tools used in included studies
| Study (Year) | Quality of life used | Findings |
|---|---|---|
| Vartanian et al. (2006) 27 | UW—QOL |
RTW: Composite Score ≥ 75%–71.6% No RTW: Composite Score ≥ 75%–28.4%, p = 0.007 |
| Verdonck‐de Leeuw et al. (2010) 26 | EORTC QLQ‐C30 & EORTC QLQ H&N35 | RTW group had statistically significant improved scores for the following domains: loss of appetite (2.38 vs. 16.67), social eating (2.98 vs. 18.4), social contact (3.33 vs. 17.92), teeth (4.76 vs. 41.67), opening mouth (15.48 vs. 58.33), dry mouth (32.14 vs. 70.83) and sticky saliva (17.86 vs. 58.33) |
| HADS (total score) |
RTW: 7.56 ± 5.48 No RTW: 11.38 ± 8.40 |
|
| Agarwal et al. (2017) 25 | EORTC‐QLQ‐C30 | RTW group had statistically significant improved scores for global QoL (77.5 vs. 72.3, p = 0.014) |
| EORTC‐QLQ‐H&N35 | RTW group had statistically significant improved scores for coughing (12.2 vs. 20.6, p = 0.001) and worse QoL for sticky saliva (27.8 vs. 16.6, p = 0.004) | |
| Chen et al. (2019) 14 | Social support scale (SSS) | RTW group needed less tangible social support (61.85 vs. 69.55, p = 0.044) and had more positive social interactions (59.38 vs. 51.28, p = 0.039) |
| UW‐QOL | RTW had statistically significant improvement in scores for physical function (71.58 vs. 59.72, p = 0.001) and social–emotional function (73.96 vs. 64.36, p = 0.001) | |
| Check et al. (2019) 19 | MDASI‐HN | RTW group had lower scores for total symptom (1.2 vs. 1.8, p < 0.001), total interference (0.8 vs. 1.5, p < 0.001) and total severity (1.2 vs. 1.7, p < 0.001) |
| Morales et al. (2019) 17 | FACT‐H&N and subscales | RTW group had higher QoL for total score (117.0 vs. 96.1, p = 0.002) and the subscales physical well‐being (23.9 vs. 18.4, p = 0.04), and functional well‐being (22.3 vs. 17.7, p = 0.01) |
| Chen et al. (2020) 20 | HADS | RTW group had lower anxiety (2.7 vs. 4.7, p = 0.006) and depression (3.8 vs. 5.7, p = 0.005) |
| Brief illness perception questionnaire | RTW group had lower scores for cognitive illness representations (25.3 vs. 29.3, p = 0.001) and higher scores for illness comprehensibility (6.3 vs. 5.3, p = 0.017) | |
| Mini‐mental adjustment to cancer | RTW group had lower scores for hopeless and helpless (3.6 vs. 6.3, p = 0.001), anxious preoccupation (7.0 vs. 9.3, p = 0.04), fatalism (7.9 vs. 9.0, p = 0.01) and higher scores for avoidance (6.4 vs. 5.0, p = 0.033) | |
| Granstrom et al. (2020) 18 | EORTC QLQ‐H&N35 | Following domains were associated with RTW on univariable analysis: local pain (OR 0.97, p < 0.001), swallowing (OR 0.96, p < 0.001), appearance (OR 0.40, p < 0.001) and trouble talking on the phone (OR 0.29, p < 0.001) |
| So et al. (2020) 19 | FACT‐H&N | RTW group had higher total score (107.8 vs. 96.1, p = 0.039) |
| MDASI‐HN | RTW group had lower symptom severity—1.9 vs. 2.8 (p = 0.041) | |
| HADS | RTW group had lower anxiety (5.7 vs. 7.4, p = 0.049) and depression (4.5 vs. 6.4, p = 0.05) scores |
FIGURE 5.

Forest plot for HADS anxiety [Color figure can be viewed at wileyonlinelibrary.com]
FIGURE 6.

Forest plot for HADS depression [Color figure can be viewed at wileyonlinelibrary.com]
3.6. Sub‐group analyses
Sub‐group analysis (Appendix A) demonstrated that studies consisting of patients with only oropharyngeal tumors had a higher RTW rate than the rest of the studies (80% vs. 64%, p = 0.01). There was no difference in RTW rate for studies with a median age greater than 55 compared with those under 55 (72% vs. 66%, p = 0.26). Only two studies had a median age over 60 16 , 20 and these had a lower RTW rate, mostly due to the effect of the Chen et al. study which had a RTW rate of 39%. The sub‐group analysis comparing studies with a higher proportion of advanced staged cancers showed a similar RTW rate to studies that had lower proportions of advanced tumors (65% vs. 71%, p = 0.42). There was no difference in RTW rate between studies with no age exclusion criteria and those with an age exclusion criteria (64% vs. 71%, p = 0.25). Additionally, there was no differences in RTW rates across differing geographical regions.
3.7. Publication bias
Visual inspect of the funnel plots for mean difference in the HADS anxiety and HADS depression scores demonstrated no evidence of publication bias (Appendix B). This was confirmed with the Egger's test which was non‐significant for both HADS anxiety (p = 0.807) and HADS depression (p = 0.988).
4. DISCUSSION
This review demonstrated that while most patients with HNC are able to return to some form of work after completion of treatment (67%), there are a still a significant number of patients who are either unable to RTW or work a reduced number of hours (44% of those that RTW). There were also a proportion of people who changed their type of work after their treatment (30%). Patients who were able to RTW had lower levels of anxiety and depression (HADS score) compared to those that did not RTW.
Similar to other meta‐analyses on RTW rates in all types of cancers, there was significant variability between studies in the reported RTW rate. For example, meta‐analyses on RTW for only European and Japanese studies involving mixed cancer patients reported ranges between 39%–77% and 53.8%–95%, respectively. 28 , 29 The wide variability in the RTW rate reported in both this meta‐analysis and the literature is likely due to a variety of sociodemographic and clinical characteristics, as well as variations in measurement of RTW between studies. Only 10 of the studies in this meta‐analysis had an upper age limit exclusion as part of the eligibility criteria, and older patients included in the other studies could have been considering retirement even before diagnosis. Additionally, some studies had long follow‐up periods, and this may have meant that patients who were employed at diagnosis could have been unemployed at the time of survey completion simply because they had retired from work. Conversely, some studies had shorter follow‐up periods and these patients may have returned to work later if they were given sufficient time. Future studies investigating RTW in the head and neck cancer population need to consider an upper age limit as part of the inclusion criteria, and exclude patients from the RTW rate if they have retired from work due to reasons unrelated to their cancer treatment, particularly in studies with long follow‐up periods. Additionally, adequate follow‐up should be allowed for patients to RTW. Prospective longitudinal studies involving regular follow‐up would be helpful to further delineate these patterns, rather than cross‐sectional studies that currently comprise the majority of the literature.
The differences in patient and clinical characteristics between included studies are another likely explanation for the significant variability in RTW rates. Head and neck cancer is a heterogenous group of cancers with wide variations in treatment dependent on location and stage of tumor, meaning there is more heterogeneity than in other types of tumors. Age is another factor that can influence RTW rate. For example, the study by Chen et al. 20 reported the lowest RTW rate of 39%, which is most likely explained by the older mean age of the patients included in the study (63 years) resulting from the lack of an upper age limit exclusion. As expected, a higher age has previously been associated with reduced RTW rates. 26 Occupation has also been identified as an important factor impacting upon RTW, with people in white collar occupations found to have improved rates of RTW (amongst Indian patients with HNC). 25 Not all studies reported occupations for participants, making it challenging to determine the effects of this factor on RTW rates in this systematic review.
Clinical factors such as late stage, higher comorbidity scores, increased treatment modalities and surgery as a modality of treatment have been associated with reduced RTW rates in HNC survivors. 12 , 26 , 27 , 30 Cancer‐related symptoms such as fatigue and oral dysfunction have also been identified as the most common barriers to RTW. 12 , 26 , 27 While all studies included in this analysis were focused on HNCs, some studies focused on specific treatment modalities or forms of HNC. For example, Costa et al. 31 focused exclusively on patients who had laryngectomies, 31 while studies by Handschel et al. 22 and Chen et al. 14 focused exclusively on oral cavity cancer survivors. 14 , 22 The sub‐group analysis suggested that patients with oropharyngeal tumors had a higher rate of RTW compared to the rest of the studies. This is likely due to the high proportion of people with HPV positive oropharyngeal cancer, who are generally younger at diagnosis and of a higher education level. Higher education attainment has been associated with an increased RTW rate in a previous study of patients with various tumor types. 3
As suggested in the meta‐analysis there were reduced depression and anxiety scores for the RTW group. Individual studies used various QoL measurement tools (e.g., FACT‐H&N, MDASI‐HN, HADS, and EORTC‐QLQ‐H&N35) and as such a meta‐analysis of QoL was not possible given that there were not three or more studies reporting the same outcome measure. However, based upon review of the results from these individual studies (Table 3) it was apparent that the group of patients who successfully RTW had higher QoL scores when compared to the non‐RTW group. The impact of RTW on QOL has also been explored in studies on breast cancer survivors. Consistent with our findings, Schmidt et al. and Zomkowski et al. demonstrated QOL‐related functions and symptoms were significantly improved amongst breast cancer survivors who RTW. 32 , 33 Whether it is the poorer QoL that prevents patients from being able to RTW or that patients not employed have a lower QoL due to factors such as social isolation remains to be elucidated. However, two studies included in this review 16 , 19 demonstrated a higher symptom burden in patients who did not RTW (measured by the MDASI‐HN), suggesting that addressing these symptoms could be an avenue for improving RTW.
Clinicians should be aware that RTW is an integral element of survivorship care for patients with head and neck cancers. This was highlighted in the American Head and Neck Society's “Head and Neck Cancer Survivorship Consensus Statement” which included RTW as a core component of survivorship care. 34 Clinicians involved in the survivorship team are encouraged to counsel patients on their medical disability rights as outlined in national laws. 34 As highlighted in a recent review article, RTW is also influenced by factors outside the healthcare setting, highlighting the importance of support from employers and co‐workers. 35 This suggests that interventions aimed to improve RTW amongst HNC survivors must be multifactorial and consider not only addressing symptoms and side effects of cancer treatment but also issues in the workplace.
The main limitation of this systematic review and meta‐analysis was the significant heterogeneity in the RTW rates due to variations in study designs and eligibility criteria. Included studies were predominantly conducted in developed, western countries with advanced healthcare systems (mainly North America and Europe). Although most of the studies looked broadly at all HNC survivors, some included studies focused on particular forms of HNC or particular treatment modalities. There were also significant differences in the exclusion criteria for age limits in studies. Similarly, while most studies determined their upper age limit by their national retirement age, many studies did not explicitly state such a cut‐off. There were significant differences in the reporting of data which may influence employment status such as HPV status, smoking status and modalities of treatment these patients received. There was also a wide variation in the QoL tools used in studies which limited the ability to perform meta‐analyses.
5. CONCLUSION
This systematic review and meta‐analysis highlights that while the majority of HNC survivors are able to RTW, there are a significant proportion that do not RTW, or have to reduce their hours or change work. Patients who are unable to RTW were found to have higher levels of anxiety and depressive symptoms and a lower quality of life. Future studies need to use consistent definitions for RTW and consider confounding factors which may influence RTW rate such as length of follow‐up and retirement.
ACKNOWLEDGMENT
Open access publishing facilitated by The University of Sydney, as part of the Wiley ‐ The University of Sydney agreement via the Council of Australian University Librarians.
Appendix A. Sub‐group analyses
Oropharyngeal tumors only versus other HNC subsites
Age >55 versus <55 (L) and age >60 versus <60 (R)
Studies with no age exclusion criteria versus those with an age exclusion criteria
Stage of cancers—greater than 50% of patients with advanced cancers versus less than 50% with advanced cancers
RTW by region (America, Europe, Asia and Australia)
Appendix B. Funnel plots
HADS anxiety—funnel plot
Yu J, Smith J, Marwah R, Edkins O. Return to work in patients with head and neck cancer: Systematic review and meta‐analysis . Head & Neck. 2022;44(12):2904‐2924. doi: 10.1002/hed.27197
DATA AVAILABILITY STATEMENT
The data that support the findings of this study are available from the corresponding author upon reasonable request.
REFERENCES
- 1. Johnson DE, Burtness B, Leemans CR, Lui VWY, Bauman JE, Grandis JR. Head and neck squamous cell carcinoma. Nat Rev Dis Primers. 2020;6(1):92. doi: 10.1038/s41572-020-00224-3 [DOI] [PMC free article] [PubMed] [Google Scholar]
- 2. Forastiere AA, Trotti A, Pfister DG, Grandis JR. Head and neck cancer: recent advances and new standards of care. J Clin Oncol. 2006;24(17):2603‐2605. [DOI] [PubMed] [Google Scholar]
- 3. Mols F, van de Poll‐Franse LV. Employment status among cancer survivors. JAMA. 2009;302(1):32‐33. doi: 10.1001/jama.2009.903 [DOI] [PubMed] [Google Scholar]
- 4. Papadakos J, McQuestion M, Gokhale A, et al. Informational needs of head and neck cancer patients. J Cancer Educ. 2018;33(4):847‐856. doi: 10.1007/s13187-017-1176-9 [DOI] [PubMed] [Google Scholar]
- 5. Giuliani M, Papadakos J, Broadhurst M, et al. The prevalence and determinants of return to work in head and neck cancer survivors. Support Care Cancer. 2019;27(2):539‐546. doi: 10.1007/s00520-018-4343-6 [DOI] [PubMed] [Google Scholar]
- 6. Baxi SS, Salz T, Xiao H, et al. Employment and return to work following chemoradiation in patient with HPV‐related oropharyngeal cancer. Cancers Head & Neck. 2016;1:4. doi: 10.1186/s41199-016-0002-0 [DOI] [PMC free article] [PubMed] [Google Scholar]
- 7. Broemer L, Friedrich M, Wichmann G, et al. Exploratory study of functional and psychological factors associated with employment status in patients with head and neck cancer. Head Neck. 2021;43:1229‐1241. doi: 10.1002/hed.26595 [DOI] [PubMed] [Google Scholar]
- 8. Spelten ER, Sprangers MA, Verbeek JH. Factors reported to influence the return to work of cancer survivors: a literature review. Psychooncology. 2002;11(2):124‐131. doi: 10.1002/pon.585 [DOI] [PubMed] [Google Scholar]
- 9. Pearce A, Tomalin B, Kaambwa B, et al. Financial toxicity is more than costs of care: the relationship between employment and financial toxicity in long‐term cancer survivors. J Cancer Surviv. 2019;13(1):10‐20. doi: 10.1007/s11764-018-0723-7 [DOI] [PubMed] [Google Scholar]
- 10. Lamore K, Dubois T, Rothe U, et al. Return to work interventions for cancer survivors: a systematic review and a methodological critique. Int J Environ Res Public Health. 2019;16(8):1343. doi: 10.3390/ijerph16081343 [DOI] [PMC free article] [PubMed] [Google Scholar]
- 11. Moola S, Munn Z, Tufanaru C, et al. Chapter 7: Systematic reviews of etiology and risk. In: Aromataris E, Munn Z, eds. JBI Manual for Evidence Synthesis. JBI; 2020. Available from https://synthesismanual.jbi.global [Google Scholar]
- 12. Buckwalter AE, Karnell LH, Smith RB, Christensen AJ, Funk GF. Patient‐reported factors associated with discontinuing employment following head and neck cancer treatment. Arch Otolaryngol Head Neck Surg. 2007;133(5):464‐470. doi: 10.1001/archotol.133.5.464 [DOI] [PubMed] [Google Scholar]
- 13. Isaksson J, Wilms T, Laurell G, Fransson P, Ehrsson YT. Meaning of work and the process of returning after head and neck cancer. Support Care Cancer. 2016;24(1):205‐213. doi: 10.1007/s00520-015-2769-7 [DOI] [PubMed] [Google Scholar]
- 14. Chen SC, Huang BS, Hung TM, Lin CY, Chang YL. Impact of physical and psychosocial dysfunction on return to work in survivors of oral cavity cancer. Psychooncology. 2019;28(9):1910‐1917. doi: 10.1002/pon.5173 [DOI] [PubMed] [Google Scholar]
- 15. Chen YY, Wang CC, Wu WT, et al. Trajectories of returning to work and its impact on survival in survivors with oral cancer: a 5‐year follow‐up study. Cancer. 2020;126(6):1225‐1234. doi: 10.1002/cncr.32643 [DOI] [PubMed] [Google Scholar]
- 16. Check DK, Hutcheson KA, Poisson LM, et al. Factors associated with employment discontinuation among older and working age survivors of oropharyngeal cancer. Head Neck. 2019;41(11):3948‐3959. doi: 10.1002/hed.25943 [DOI] [PubMed] [Google Scholar]
- 17. Morales CZ, McDowell L, Lisy K, Piper A, Jefford M. Return to work in survivors of human papillomavirus–associated oropharyngeal cancer: an Australian experience. Int J Radiat Oncol Biol Phys. 2020;106(1):146‐156. doi: 10.1016/j.ijrobp.2019.09.001 [DOI] [PubMed] [Google Scholar]
- 18. Granström B, Tiblom Ehrsson Y, Holmberg E, et al. Return to work after oropharyngeal cancer treatment‐highlighting a growing working‐age population. Head Neck. 2020;42(8):1893‐1901. doi: 10.1002/hed.26123 [DOI] [PubMed] [Google Scholar]
- 19. So N, McDowell LJ, Lu L, et al. The prevalence and determinants of return to work in nasopharyngeal carcinoma survivors. Int J Radiat Oncol Biol Phys. 2020;106(1):134‐145. doi: 10.1016/j.ijrobp.2019.09.008 [DOI] [PubMed] [Google Scholar]
- 20. Chen YJ, Lai YH, Lee YH, Tsai KY, Chen MK, Hsieh MY. Impact of illness perception, mental adjustment, and sociodemographic characteristics on return to work in patients with head and neck cancer. Support Care Cancer. 2021;29(3):1519‐1526. doi: 10.1007/s00520-020-05640-5 [DOI] [PubMed] [Google Scholar]
- 21. Rangabashyam M, Koh SQ, Sultana R, et al. Factors associated with returning to work in head and neck cancer survivors in Singapore: a preliminary exploratory mixed‐methods approach study. Head Neck. 2021;43:1451‐1464. doi: 10.1002/hed.26644 [DOI] [PubMed] [Google Scholar]
- 22. Handschel J, Gellrich NC, Bremerich A, KrüSkemper G. Return to work and quality of life after therapy and rehabilitation in oral cancer. In Vivo. 2013;27(3):401‐407. [PubMed] [Google Scholar]
- 23. Liu HE. Changes of satisfaction with appearance and working status for head and neck tumour patients. J Clin Nurs. 2008;17(14):1930‐1938. doi: 10.1111/j.1365-2702.2008.02291.x [DOI] [PubMed] [Google Scholar]
- 24. Pearce A, Timmons A, O'Sullivan E, et al. Long‐term workforce participation patterns following head and neck cancer. J Cancer Surviv. 2015;9(1):30‐39. doi: 10.1007/s11764-014-0382-2 [DOI] [PubMed] [Google Scholar]
- 25. Agarwal J, Krishnatry R, Chaturvedi P, et al. Survey of return to work of head and neck cancer survivors: a report from a tertiary cancer center in India. Head Neck. 2017;39(5):893‐899. doi: 10.1002/hed.24703 [DOI] [PubMed] [Google Scholar]
- 26. Verdonck‐de Leeuw IM, van Bleek WJ, René Leemans C, de Bree R. Employment and return to work in head and neck cancer survivors. Oral Oncol. 2010;46(1):56‐60. doi: 10.1016/j.oraloncology.2009.11.001 [DOI] [PubMed] [Google Scholar]
- 27. Vartanian JG, Carvalho AL, Toyota J, Giacometti Kowalski IS, Kowalski LP. Socioeconomic effects of and risk factors for disability in long‐term survivors of head and neck cancer. Arch Otolaryngol Head Neck Surg. 2006;132(1):32‐35. doi: 10.1001/archotol.132.1.32 [DOI] [PubMed] [Google Scholar]
- 28. Paltrinieri S, Fugazzaro S, Bertozzi L, et al. Return to work in European cancer survivors: a systematic review. Support Care Cancer. 2018;26(9):2983‐2994. doi: 10.1007/s00520-018-4270-6 [DOI] [PubMed] [Google Scholar]
- 29. Ota A, Fujisawa A, Kawada K, Yatsuya H. Recent status and methodological quality of return‐to‐work rates of cancer patients reported in Japan: a systematic review. Int J Environ Res Public Health. 2019;16(8):1461. doi: 10.3390/ijerph16081461 [DOI] [PMC free article] [PubMed] [Google Scholar]
- 30. Koch R, Wittekindt C, Altendorf‐Hofmann A, Singer S, Guntinas‐Lichius O. Employment pathways and work‐related issues in head and neck cancer survivors. Head Neck. 2015;37(4):585‐593. doi: 10.1002/hed.23640 [DOI] [PubMed] [Google Scholar]
- 31. Costa JM, López M, García J, León X, Quer M. Impact of total laryngectomy on return to work. Acta Otorrinolaringol. 2018;69(2):110‐113. doi: 10.1016/j.otorri.2017.02.006 [DOI] [PubMed] [Google Scholar]
- 32. Schmidt ME, Scherer S, Wiskemann J, Steindorf K. Return to work after breast cancer: the role of treatment‐related side effects and potential impact on quality of life. Eur J Cancer Care. 2019;28(4):e13051. doi: 10.1111/ecc.13051 [DOI] [PubMed] [Google Scholar]
- 33. Zomkowski K, Wittkopf PG, Baungarten Hugen Back B, Bergmann A, Dias M, Sperandio FF. Pain characteristics and quality of life of breast cancer survivors that return and do not return to work: an exploratory cross‐sectional study. Disabil Rehabil. 2021;43(26):3821‐3826. doi: 10.1080/09638288.2020.1759150 [DOI] [PubMed] [Google Scholar]
- 34. Goyal N, Day A, Epstein J, et al. Head and neck cancer survivorship consensus statement from the American head and neck society. Laryngoscope Investig Otolaryngol. 2022;7(1):70‐92. doi: 10.1002/lio2.702 [DOI] [PMC free article] [PubMed] [Google Scholar]
- 35. Butow P, Laidsaar‐Powell R, Konings S, Lim CYS, Koczwara B. Return to work after a cancer diagnosis: a meta‐review of reviews and a meta‐synthesis of recent qualitative studies. J Cancer Surviv. 2020;14(2):114‐134. doi: 10.1007/s11764-019-00828-z [DOI] [PubMed] [Google Scholar]
- 36.Kjær T, Bøje CR, Olsen MH, et al. Affiliation to the work market after curative treatment of head‐and‐neck cancer: A population‐based study from the DAHANCA database. Acta Oncol. 2013;52(2):430‐439. [DOI] [PubMed]
- 37.Gallagher KK, Sacco AG, Lee JSJ, et al. Association between multimodality neck treatment and work and leisure impairment: A disease‐specific measure to assess both impairment and rehabilitation after neck dissection. JAMA Otolaryngol Head Neck Surg. 2015;141(10):888‐893. [DOI] [PubMed]
Associated Data
This section collects any data citations, data availability statements, or supplementary materials included in this article.
Data Availability Statement
The data that support the findings of this study are available from the corresponding author upon reasonable request.