

Abstract
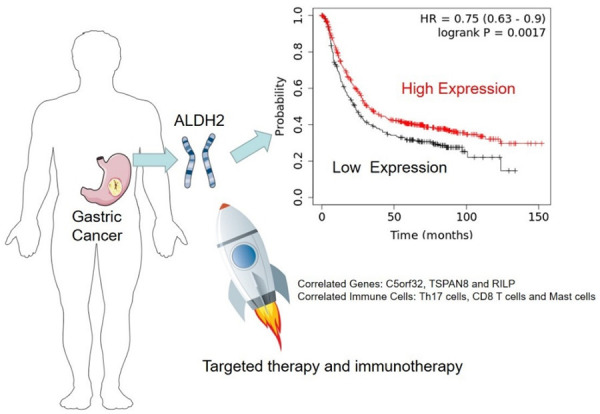
The relationship among alcohol, acetaldehyde, and gastric cancer (GC) is a very interesting research direction. Although many studies have focused on the correlation between ALDH2 polymorphism and GC, ALDH2 expression in GC and its relationship with the prognosis of GC patients remain to be fully understood. To explore these, 455 GC cases were included in this study. The relationships of ALDH2 expression with patients’ survival and clinicopathological characteristics were assessed. The immune infiltration characteristics of ALDH2 in GC were also analyzed. Furthermore, the gene regulatory network and functional pathways of ALDH2 in GC were investigated. We found that high expression of ALDH2 was associated with better prognosis in GC patients. GC patients with high ALDH2 expression had a lower degree of pathological malignancy, consistent with our hypothesis that ALDH2 may play as a tumor suppressor role in GC. Mechanistically, ALDH2 may cooperate with genes such as C5orf32, TSPAN8 and RILP to inhibit GC progression via regulating multiple signaling pathways and chemical carcinogenesis. Therefore, our study suggested that ALDH2, an important variant gene in Asians, might serve as a prognostic marker and a potential therapeutic target for patients with GC.
Keywords: Gastric cancer, ALDH2, prognosis, targeted therapy, immune infiltration
Introduction
Gastric cancer (GC) is a malignant tumor with high incidence in the world, posing a serious public health threat [1]. The risk factors of GC include alcohol, helicobacter pylori, and unhealthy lifestyle [2,3]. Since the onset of GC is relatively insidious, the patients are usually diagnosed at a late stage and are unable to receive effective radical treatment [4]. Therefore, it is imperative to identify early diagnosis and prognosis markers to improve the outcomes of patients with GC.
A cohort study from Japan found that ALDH2 genotype was closely correlated with the incidence of GC in Asian patients [5]. In fact, the relationship between ALDH2 gene and GC has been extensively explored [6-8], as almost half of Asians have a mutation in the ALDH2 gene [9]. This high frequency mutation in the ALDH2 gene has led to many studies on its impact on tumor initiation and progression.
Since cancer is a highly heterogeneous disease, it is important to specifically predict the prognosis of each patient and tailor effective personalized treatment plans by molecular typing. As ALDH2 gene mutation is common in Asian populations, its ALDH2 genotyping is significant for patient stratification. The correlation among alcohol, acetaldehyde, and GC is a very interesting research direction. In this study, instead of investigating the most common ALDH2 mutant rs671, we determined the effect of ALDH2 expression on the prognosis of GC patients.
By analyzing a large sample of GC patient data, we explored the differential expression of ALDH2 gene between GC tissues and normal tissues and evaluated the correlation of ALDH2 gene expression with pathological grade and patient prognosis. The immune infiltration and gene function regulatory network of ALDH2 in GC were also analyzed. Together, our study provided insights into the function of ALDH2 gene in the diagnosis and treatment of patients with GC.
Materials and methods
Immunohistochemistry
A tumor tissue microarray containing the GC samples and the corresponding adjacent normal tissues from 80 patients were made by the Shanghai Outdo Biotech Company. Immunohistochemistry was performed by using standard protocol. The staining intensity and positive staining number of each section were converted into specific values for the semi-quantitation of tissue staining. H-Score was used to quantify the positive intensity of ALDH2 gene expression and was calculated by the formula: H-Score = ∑ (pi × i) = (weak intensity area percentage × 1) + (moderate intensity area percentage × 2) + (strong intensity area percentage × 3). In the formula, pi stands for the percentage of positive signal pixel area, while i was the positive level. The higher the value of H-Score, the higher the expression of ALDH2 gene.
Western blot
The fresh tissue specimens from 8 patients with GC were collected in the second hospital of Anhui Medical University (Ethical Batch Number: YX2021-128-F1). These specimens were divided into cancer tissue and paracancerous tissue. After the tissue was processed, western blot was proceeded to analyze the expression of ALDH2. Primary antibodies against ALDH2 (Proteintech: 15310-1-AP) and GAPDH (Affinity: AF7021) were used in this study. HRP conjugated Goat Anti-Rabbit IgG (H+L) antibody was purchased from Elabscience (E-AB-1003).
Gene expression analysis
The TCGA-GC dataset was downloaded and analyzed using R language (3.6.3). The R package (ggplot2-3.3.3) was utilized to generate visual images. Oncomine gene expression database was applied to analyze the differential expression of ALDH2 gene in important GC data cohorts [10]. CCLE (Cancer Cell Line Encyclopedia) was used to explore ALDH2 expression in GC cells with different malignant degrees [11]. cBioportal was used to explore the genetic variation of ALDH2 in gastric cancer [12].
Survival analysis
The effect of ALDH2 expression on the prognosis of GC patients was analyzed by Kaplan Meier plotter, which is a meta-analysis based validation and discovery of survival correlated biomarkers [13]. The R package (rms6.2-0) and R package (survival3.2-10) were used to generate prognostic nomogram.
Immune infiltration analysis
The infiltration of ALDH2 in various immune-associated cells was analyzed using The TIMER database which is a comprehensive platform to programmatically analyze the immune infiltrates abundance in different cancer types [14]. The R package (GSVA1.34.0) was used to generate lollipop figure. The ssGSEA method was used to calculate immune infiltration.
Functional gene regulatory network analysis
ALDH2-related functional genes in GC were explored in the Linkedomics database [15], which is a database integrating genomics and clinical information of multiple kinds of cancers. The PINA database was used to construct a network map of ALDH2 related genes in GC [16].
Functional enrichment analysis
The R package (rms6.2-0) was used for the functional enrichment analysis of ALDH2-related genes. The GO analysis includes three categories: BP (Biological Process), MF (Molecular Function), and CC (Cellular Component). The GSEA was used for KEGG pathway analysis. The screening criteria were |correlation| >0.3 and P<0.05; Data source was TCGA-STAD; Data format was Level 3 HTSeq-FPKM-RNAseq; Data conversion mode was log2 conversion; The number of screening gene was 56,493, and the screening results were 367 genes (287 positively correlated genes and 82 negatively correlated genes).
DNA methylation analysis
MEXPRESS was used to explore the DNA methylation and clinical TCGA data of ALDH2 gene in GC [17]. The methylation of ALDH2 in GC sorted by different clinical characteristics was explored by UALCAN [18].
Statistical analysis
Data were analyzed by GraphPad Prism 5.0 and SPSS 21.0. Data were represented as mean ± SD. Statistical significance was analyzed by Chi-square test and T test. The relationship between ALDH2 expression and prognosis was demonstrated by KM survival curve. P≤0.05 was considered statistically significant.
Results
Analysis of ALDH2 gene expression and patient’s clinical information
A total of 455 GC patient samples were included in this study. The clinical characteristics of patients were summarized in Tables 1 and 2. A comprehensive analysis showed that ALDH2 gene expression was correlated with the prognosis of GC patients (Figure 1).
Table 1.
The characteristics of 80 GC patients
| N/Mean ± SD | Percentage | |
|---|---|---|
| Total number of patients | 80 | 100% |
| Age (years) | 54.8±12.51 | / |
| TNM stage | ||
| I | 5 | 6.25% |
| II | 22 | 27.5% |
| III | 46 | 57.5% |
| IV | 7 | 8.75% |
| T stage | ||
| T1 | 1 | 1.25% |
| T2 | 7 | 8.75% |
| T3 | 45 | 56.25% |
| T4 | 27 | 33.75% |
| N stage | ||
| N0 | 17 | 21.25% |
| N1 | 14 | 17.5% |
| N2 | 22 | 27.5% |
| N3 | 27 | 33.75% |
| M stage | ||
| M0 | 73 | 91.25% |
| M1 | 7 | 8.75% |
| Tumor grade | ||
| II | 41 | 51.25% |
| III | 39 | 48.75% |
Table 2.
The characteristics of 375 TCGA GC patients
| Characteristic | Levels | N | Percentage |
|---|---|---|---|
| Primary tumor (T stage) | T1 stage | 19 | 5.07% |
| T2 stage | 80 | 21.33% | |
| T3 stage | 168 | 44.80% | |
| T4 stage | 100 | 26.67% | |
| Unknown | 8 | 2.13% | |
| Regional lymph nodes (N stage) | N0 stage | 111 | 29.60% |
| N1 stage | 97 | 25.87% | |
| N2 stage | 75 | 20.00% | |
| N3 stage | 74 | 19.73% | |
| Unknown | 18 | 4.80% | |
| Distant metastasis (M stage) | M0 stage | 330 | 88.00% |
| M1 stage | 25 | 6.67% | |
| Unknown | 20 | 5.33% | |
| Pathologic stage | Stage I | 53 | 14.13% |
| Stage II | 111 | 29.60% | |
| Stage III | 150 | 40.00% | |
| Stage IV | 38 | 10.13% | |
| Unknown | 23 | 6.14% | |
| Race | Asian | 74 | 19.73% |
| Black or African American | 11 | 2.93% | |
| White | 238 | 63.47% | |
| Unknown | 52 | 13.87% | |
| Age (years) | ≤65 | 164 | 43.73% |
| >65 | 207 | 55.20% | |
| Unknown | 4 | 1.07% |
Figure 1.
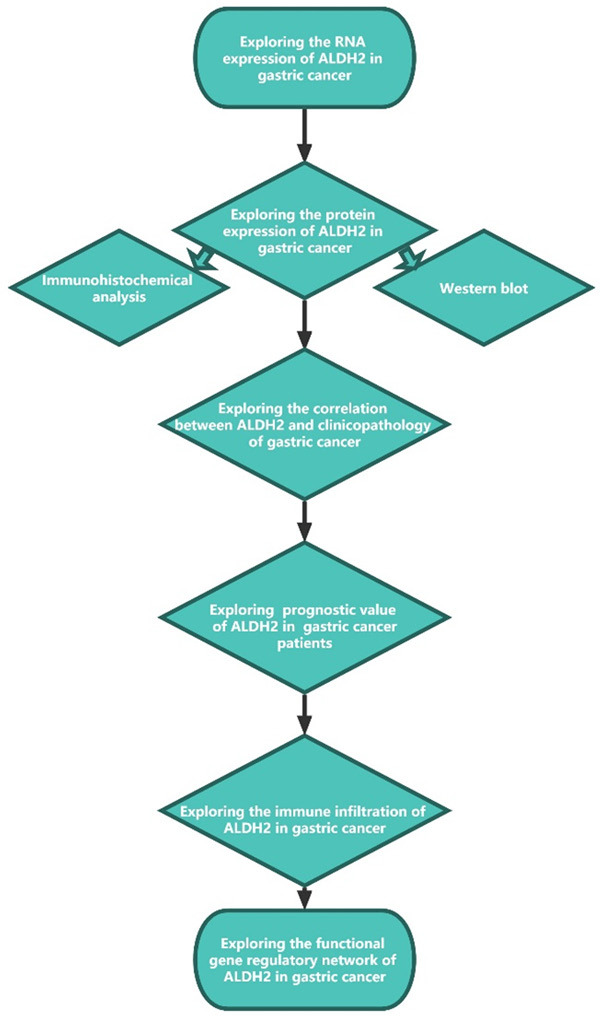
Graphical view of the research flow chart.
ALDH2 transcription in GC and the corresponding normal tissues
The expression of ALDH2 in a variety of cancers was explored in TCGA pancancer, and the results indicated that ALDH2 expression was noticeably lower in various cancer tissues than in the corresponding normal tissues (Figure 2A). The differential expression of ALDH2 was more evident in digestive tumors (STAD, HNSC, ESCA, COAD and LIHC). Analysis of three GC datasets from the GEO database further supported the conclusion that ALDH2 expression was reduced in cancer tissues (Figure 2B-D). Furthermore, the area under the curve (AUC) was used to assess the accuracy of group classification between tumor and normal. AUC of ALDH2 in GC was 0.743, suggesting the higher accuracy of prognostic prediction by ALDH2 (Figure 2E).
Figure 2.
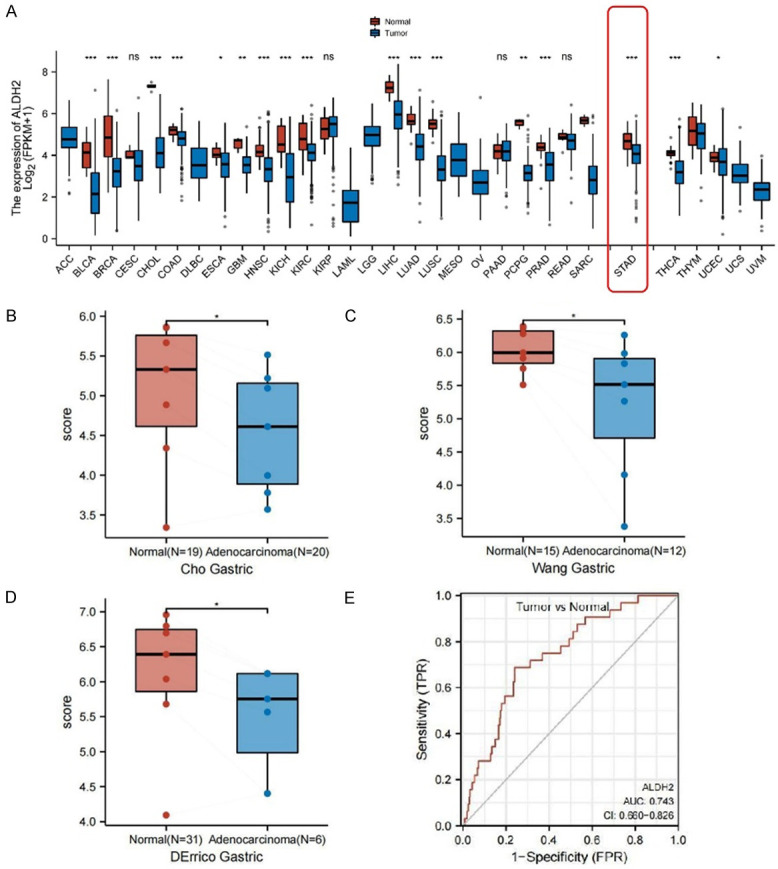
An overview of ALDH2 gene expression in GC. A. ALDH2 expression in different TCGA cancer types. B. Differential expression of ALDH2 between GC tissues and normal tissues in Cho Gastric data source. C. Differential expression of ALDH2 between GC tissues and normal tissues in Wang Gastric data source. D. Differential expression of ALDH2 between GC tissues and normal tissues in DErrico Gastric data source. E. ROC curve analysis of ALDH2 predictive value in TCGA-STAD cohorts. *, P<0.05. **, P<0.01. ***, P<0.001.
ALDH2 protein level in GC and the corresponding normal tissues
We collected the paracancerous tissue and cancer tissue specimens removed during surgery from 8 GC patients, and ALDH2 protein level in these tissues was analyzed by Western blotting (Figure 3). The results indicated that ALDH2 protein level in the paracancerous tissue was distinctly higher than that in the corresponding cancer tissue.
Figure 3.
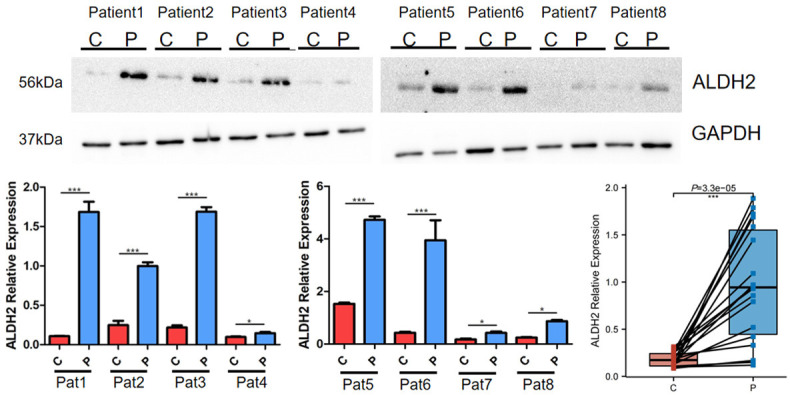
Differential expression of ALDH2 in GC and normal tissues detected by western blot. Pat, Patient. C, Cancer tissue. P, Paracancerous tissue. *, P<0.05. **, P<0.01. ***, P<0.001.
Furthermore, a tumor tissues microarray containing samples from 80 GC patients was also used to examine ALDH2 protein level by immunohistochemical analysis. We found that the H-score of the paracancerous tissue was markedly higher than that of the cancerous tissue (Figure 4A). Interestingly, the expression of ALDH2 in GC patients with low pathological malignancy was significantly higher than that in GC patients with high pathological malignancy (Figure 4B). Moreover, the frequency of ALDH2 gene alteration was different among different types of GC. For example, mucinous stomach adenocarcinoma harbored 4.76% ALDH2 gene alteration, while the percentage of ALDH2 gene alteration in stomach adenocarcinoma, diffuse type stomach adenocarcinoma, and tubular stomach adenocarcinoma was 3.64%, 2.78%, and 2.53%, respectively (Figure 4C). We also assessed the expression of ALDH2 gene in different GC cell lines and found that the higher the malignant degree of GC cells, the lower the ALDH2 expression (Figure 4D).
Figure 4.

The expression of ALDH2 gene in GC cells and GC tissues. A. The expression of ALDH2 in gastric cancer tissues of different pathological grades. B. Quantitative analysis of ALDH2 expression in Grade II and Grade III by H-Score. C. The mutation frequency of ALDH2 in different types of GC. D. The expression of ALDH2 gene in different GC cells. *, P<0.05. **, P<0.01. ***, P<0.001.
Correlation analysis of ALDH2 expression with the malignancy of GC
When analyzing the tumor samples we collected, we found that ALDH2 might be differentially expressed in tissues with different pathological malignancies. To further validate this result, we expanded the sample size by analyzing 375 GC patients in the TCGA-STAD dataset (Figure 5). Consistently, in both non-paired and paired samples of GC, the expression of ALDH2 was significantly lower in tumor tissues than in normal tissues (Figure 5A, 5B). The expression of ALDH2 was also correlated with pathologic stage, T stage, N stage, and M stage. The later stage, the lower expression of ALDH2 (Figure 5C-F), suggesting that ALDH2 might play a inhibitory role in the malignant progression of GC. It was worth noting that the expression of ALDH2 was also different in different residual tumor and race (Figure 5G, 5H).
Figure 5.
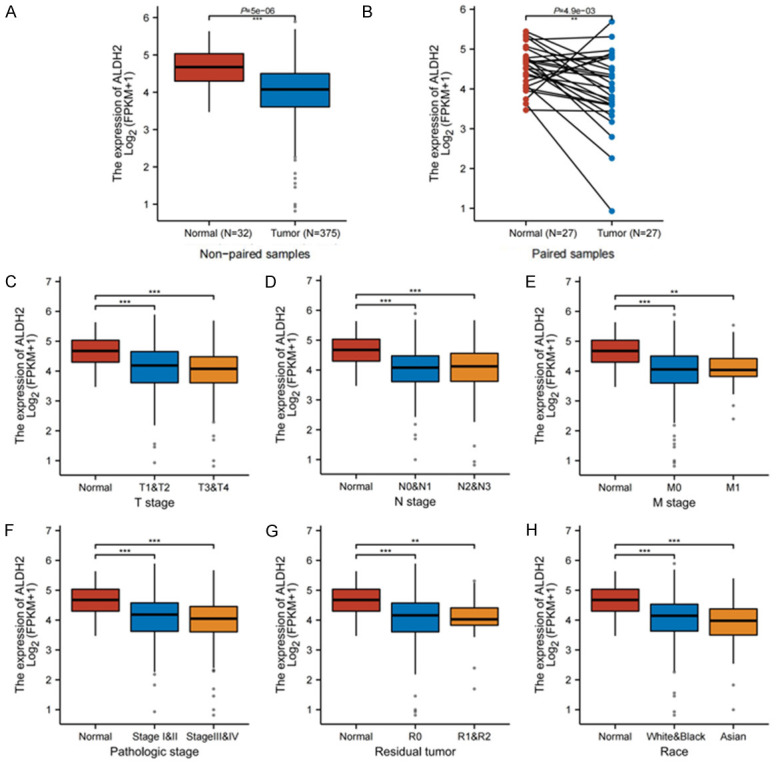
Correlation between ALDH2 and pathological indicators of gastric cancer. A. Differential expression between GC and normal tissues in unpaired samples. B. Differential expression between GC and normal tissues in paired samples. C. ALDH2 gene expression in different T stages. D. ALDH2 gene expression in different N stages. E. ALDH2 gene expression in different M stages. F. ALDH2 gene expression in different pathologic stages. G. ALDH2 gene expression in different residual tumor. H. ALDH2 gene expression in different race. *, P<0.05. **, P<0.01. ***, P<0.001.
ALDH2 expression could predict the prognosis of GC patients
Through survival analysis, we found that the prognosis of GC patients with high ALDH2 expression, including overall survival (OS), progression free survival (PFS) and progression post survival (PPS), was obviously better than that of patients with low ALDH2 expression (Figure 6A-C). In addition, by using the univariable analysis (Supplementary Table 1) and multivariable Cox proportional hazard model (Supplementary Figure 3) to explore important covariates, we found that stage (P<0.05) and age (P<0.001) were important survival predictive factors (Figure 6D). Furthermore, we constructed a ALDH2-based nomogram to predict the prognosis of GC patients (Figure 7).
Figure 6.
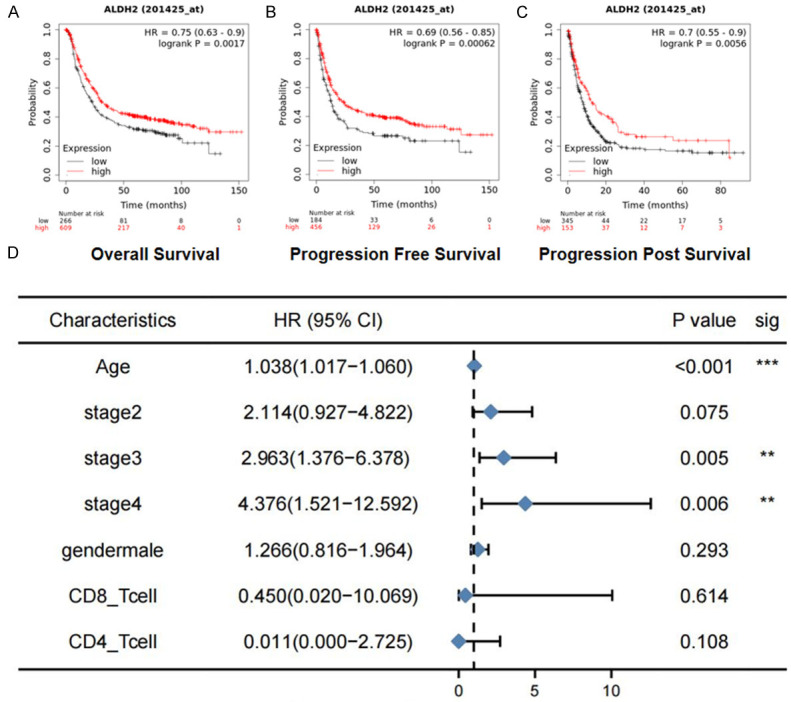
The effect of ALDH2 expression on patient survival. A. Longer OS (overall survival) in GC patients with high ALDH2 expression. B. Longer PFS (progression free survival) in GC patients with high ALDH2 expression. C. Longer PPS (progression post survival) survival in GC patients with high ALDH2 expression. D. The multivariable Cox proportional hazard model of ALDH2 in survival. *, P<0.05. **, P<0.01. ***, P<0.001.
Figure 7.
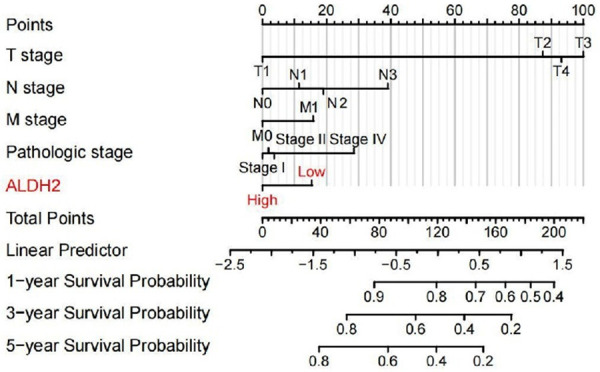
The nomogram of ALDH2 gene used to predict the prognosis of GC patients.
Immune infiltration of ALDH2 gene in GC tissue
Moreover, the correlation of ALDH2 gene with various immune cells in GC was analyzed. The results showed that Th17 cells, CD8 T cells and Mast cells positively, while Tcm and Tgd cells, negatively associated with ALDH2 gene expression (Figure 8A). Consistently, when wee divided the patients into ALDH2 low- and high-expression group, we found that CD8 T cells, Th17 cells and NK CD56bright cells were enriched in the ALDH2 high-expression group (Figure 8B). We also specifically analyzed the correlation between ALDH2 gene expression and B cells, CD8+ T cells, and CD4+ T cells, which was displayed by scatter plots (Figure 8C).
Figure 8.

Immune infiltration of ALDH2 in gastric cancer. A. Lollipop diagram of the association between ALDH2 and various immune cells. B. According to the high and low enrichment scores of immune cells, the expression of ALDH2 gene in different groups was analyzed. C. Correlation of ALDH2 gene infiltration in different immune cells. *, P<0.05. **, P<0.01. ***, P<0.001.
Analysis of ALDH2-correlated genes and their biological functions in GC
We used volcano plot to exhibit the genes that were highly associated with ALDH2, among which C5orf32, TSPAN8 and RILP had a high positive correlation with ALDH2 (Supplementary Figure 4), while SLC39A1, KIAA1467 and C2orf44 had a high negative correlation with ALDH2 (Figure 9A). Highly correlated genes were also analyzed using a cluster heatmap (Figure 9B). Furthermore, ALDH2-associated genes that were correlated with either better or poor prognosis were analyzed by network graph (Figure 9C). Moreover, we used scatter plot to specifically analyze the correlation of C5orf32, TSPAN8, KIAA1467, C2orf44 with ALDH2 (Figure 9D).
Figure 9.

Gene regulatory network of ALDH2 gene in GC. A. Volcano plot showing genes highly correlated with ALDH2 in GC. B. Heatmap showing genes highly associated with ALDH2 in gastric cancer. C. Related gene network map of ALDH2 gene in GC. D. Scatter plot showing genes that were highly correlated with ALDH2 gene.
The biological functions of genes highly related to ALDH2 were analyzed by GO (Gene Ontology) and KEGG (Kyoto Encyclopaedia of Gene and Genome) enrichment. The GO analysis included three categories: BP (Biological Process), MF (Molecular Function), and CC (Cellular Component). The results showed that ALDH2 was widely involved in chemical carcinogenesis, xenobiotic metabolic process, DNA helicase activity, and other biological processes in GC (Figure 10A and 10B). Additionally, we performed GSEA (Gene Set Enrichment Analysis) to analyze the functional pathways involved in ALDH2 and GC and that ALDH2 was widely involved in gastric acid secretion, NF-kappa B signaling pathway, Death Receptor Signaling, and TNF signaling pathways in GC (Figure 10C and 10D).
Figure 10.
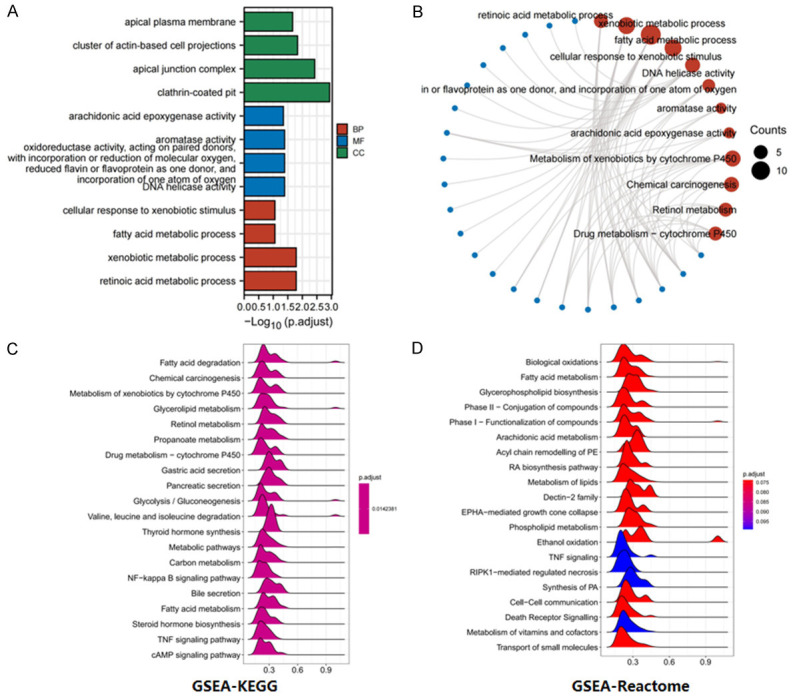
Analysis of the biological function pathway of ALDH2 gene in gastric cancer. A. BP (Biological Process), MF (Molecular Function), and CC (Cellular Component) analysis. B. Weight-circle diagram of functional pathways. C. GSEA-KEGG functional pathway analysis. D. GSEA-Reactome functional pathway analysis.
Discussion
The role of ALDH2 gene in digestive tract malignancies has received increasing attention [19]. Particularly, the study of ALDH2 in GC has important implications for Asian patients [5]. Previous studies on ALDH2 and GC have focused on ALDH2 gene polymorphisms. Thus, the significance of ALDH2 expression in GC remains to be explored [8]. Here, we analyzed the clinical significance of ALDH2 gene by using samples from TCGA database and collected by ourselves. Our findings from this study indicated ALDH2 as a prognostic prediction marker and a potential immunotherapeutic target for patients with GC.
First, we found that ALDH2 gene expression was lower in GC tissues than in the corresponding normal tissues, suggesting the possibility of ALDH2 as a tumor suppressor gene, which was consistent with the findings of Hou and Zhang et al [7,20]. We next explored the relationship between ALDH2 and the pathological grades of GC patients and revealed that the lower the expression of ALDH2, the higher the degree of pathological malignancy. In addition, through survival analysis, we found that patients with high ALDH2 expression tended to have better prognosis, consistent with the study by Hou et al [20]. Therefore, the high expression of ALDH2 is a good prognostic indicator for GC patients. Although the results showed that high expression of ALDH2 was associated with better prognosis for GC patients, including overall survival, progression free survival and progression post survival, it is interesting that ALDH2 had no significant correlation with the prognosis of GC patients in multivariable Cox proportional hazard model, which might be explained that ALDH2 had a weaker effect on survival than on stages. In future studies, if confounding factors can be excluded, it will be very meaningful to explore the mechanisms by which high ALDH2 expression improves the prognosis of GC through cell-based and animal model experiments.
Furthermore, we investigated the potential mechanisms underlying the function of ALDH2. The relationship between ALDH2 and the immune system has been important research area, and previous studies have confirmed that ALDH2 mediates alcohol-induced colorectal cancer immune escape through stabilizing PD-L1 expression [21]. In this study, when analyzing ALDH2 and immune infiltration in GC, we found that ALDH2 showed a high positive correlation with CD8 T cells and Th17 cells. It has been reported that the elevation of CD8 T cells play an important role in PD-1 therapy resistance in cervical cancer [22]. In addition, many studies have indicated that cytokines secreted by Th17 cells are related with tumor microenvironment and cancer stem cells [23]. Taken together, these results suggest that ALDH2 may play an important role in the immune response of GC, and its high expression may improve the ability of immune resistance to cancer progression.
Moreover, our analysis on the regulatory network of ALDH2 gene suggested the potential biological function of ALDH2 in GC. We found that C5orf32, TSPAN8 and RILP had a high positive correlation with ALDH2. Previous studies have indicated that TSPAN8 plays an important role in pancreatic cancer and epithelial cancer through regulating the STAT3-mediated transcription pathway [24-26]. Methylation of RILP in lung cancer also promotes cancer cell invasion and proliferation [27]. In addition, RILP can also inhibit the invasion of breast cancer cells by regulating the activity of RalA [28]. The regulatory relationships between ALDH2 and these three genes in GC should be further experimentally explored. This study also identified genes that are highly negatively correlated with ALDH2 such as SLC39A1 and KIAA1467 which have been reported to play an important role in hepatocellular carcinoma [29]. We found these genes were associated with ALDH2 in predicting the survival of gastric cancer patients, hence, these genes might be used to build predictive models for the prognosis of GC patients in the future.
DNA methylation has been known to play an important role in silencing tumor suppressor genes, thereby accelerating tumorigenesis and tumor progression. The DNA methylation and the expression of ALDH2 in GC was explored in this study (Supplementary Figure 1) [17]. Our results showed that the methylation level of ALDH2 in Grade 3 tissues was higher than that in Grade 2 (P<0.05), suggesting the differential methylation degree of ALDH2 gene in different malignant degree of GC (Supplementary Figure 2). However, further experiments are needed to validate the role of ALDH2 gene methylation in GC progression.
ALDH2 has been implicated as a gene that inhibits cancer progression [30]. In this study, we explored the biological functions ALDH2 might be involved and found that ALDH2 was involved in gastric acid secretion. It is well known that the dysregulation of gastric acid-base homeostasis was associated with gastric mucosal damage and eventually cause GC [31], which might be the potential mechanism by which ALDH2 functions in GC. ALDH2 also plays an important role in TNF signaling pathways, and the TNF-α/TNFR2 pathway has been shown to regulate the microenvironment and progression of GC [32,33]. Our comprehensive analysis also suggested a key role of ALDH2 in chemical carcinogenesis. Since ALDH2 play a tumor suppressor role through DNA damage and anti-tumor immunity [34], and it is closely related to immune cell infiltration in GC, the function of ALDH2 in regulating the immune system warrants future exploration (Figure 11).
Figure 11.
Future prospects of ALDH2 research related to its function in tumorigenesis.
Conclusions
Our results indicated the significance of ALDH2 expression in predicting the prognosis of GC patients. The overall results were consistent with our hypothesis that ALDH2 might play an important role in suppressing GC. As a frequently mutated gene in Asians, ALDH2 might be used as prognostic marker of GC patients and serve as an potential anticancer therapeutic target in the future.
Acknowledgements
We thank the patients for their cooperation in this study. We thank the reviewers for their valuable comments. Funding was supplied by The National Natural Science Foundation of China (No. 81872504; 81372487).
Disclosure of conflict of interest
None.
Supporting Information
References
- 1.Siegel RL, Miller KD, Fuchs HE, Jemal A. Cancer statistics, 2021. CA Cancer J Clin. 2021;71:7–33. doi: 10.3322/caac.21654. [DOI] [PubMed] [Google Scholar]
- 2.Alexander SM, Retnakumar RJ, Chouhan D, Devi TNB, Dharmaseelan S, Devadas K, Thapa N, Tamang JP, Lamtha SC, Chattopadhyay S. Helicobacter pylori in human stomach: the inconsistencies in clinical outcomes and the probable causes. Front Microbiol. 2021;12:713955. doi: 10.3389/fmicb.2021.713955. [DOI] [PMC free article] [PubMed] [Google Scholar]
- 3.Wang XF, Hu C, Mo SW, Xu JL, Liu Y, Xu HD, Yuan L, Huang L, Yu JF, Cheng XD, Xu ZY. GPR30 activation promotes the progression of gastric cancer and plays a significant role in the anti-GC effect of huaier. J Oncol. 2022;2022:2410530. doi: 10.1155/2022/2410530. [DOI] [PMC free article] [PubMed] [Google Scholar]
- 4.Lin Y, Zheng Y, Wang HL, Wu J. Global patterns and trends in gastric cancer incidence rates (1988-2012) and predictions to 2030. Gastroenterology. 2021;161:116–127. e118. doi: 10.1053/j.gastro.2021.03.023. [DOI] [PubMed] [Google Scholar]
- 5.Suzuki A, Katoh H, Komura D, Kakiuchi M, Tagashira A, Yamamoto S, Tatsuno K, Ueda H, Nagae G, Fukuda S, Umeda T, Totoki Y, Abe H, Ushiku T, Matsuura T, Sakai E, Ohshima T, Nomura S, Seto Y, Shibata T, Rino Y, Nakajima A, Fukayama M, Ishikawa S, Aburatani H. Defined lifestyle and germline factors predispose Asian populations to gastric cancer. Sci Adv. 2020;6:eaav9778. doi: 10.1126/sciadv.aav9778. [DOI] [PMC free article] [PubMed] [Google Scholar]
- 6.Im PK, Yang L, Kartsonaki C, Chen Y, Guo Y, Du H, Lin K, Kerosi R, Hacker A, Liu J, Yu C, Lv J, Walters RG, Li L, Chen Z, Millwood IY China Kadoorie Biobank (CKB) Collaborative Group. Alcohol metabolism genes and risks of site-specific cancers in Chinese adults: an 11-year prospective study. Int J Cancer. 2022;150:1627–1639. doi: 10.1002/ijc.33917. [DOI] [PMC free article] [PubMed] [Google Scholar]
- 7.Zhang H, Fu L. The role of ALDH2 in tumorigenesis and tumor progression: targeting ALDH2 as a potential cancer treatment. Acta Pharm Sin B. 2021;11:1400–1411. doi: 10.1016/j.apsb.2021.02.008. [DOI] [PMC free article] [PubMed] [Google Scholar]
- 8.Joo Kang S, Shin CM, Sung J, Kim N. Association between ALDH2 polymorphism and gastric cancer risk in terms of alcohol consumption: a meta-analysis. Alcohol Clin Exp Res. 2021;45:6–14. doi: 10.1111/acer.14508. [DOI] [PubMed] [Google Scholar]
- 9.Sawada G, Niida A, Uchi R, Hirata H, Shimamura T, Suzuki Y, Shiraishi Y, Chiba K, Imoto S, Takahashi Y, Iwaya T, Sudo T, Hayashi T, Takai H, Kawasaki Y, Matsukawa T, Eguchi H, Sugimachi K, Tanaka F, Suzuki H, Yamamoto K, Ishii H, Shimizu M, Yamazaki H, Yamazaki M, Tachimori Y, Kajiyama Y, Natsugoe S, Fujita H, Mafune K, Tanaka Y, Kelsell DP, Scott CA, Tsuji S, Yachida S, Shibata T, Sugano S, Doki Y, Akiyama T, Aburatani H, Ogawa S, Miyano S, Mori M, Mimori K. Genomic landscape of esophageal squamous cell carcinoma in a Japanese population. Gastroenterology. 2016;150:1171–1182. doi: 10.1053/j.gastro.2016.01.035. [DOI] [PubMed] [Google Scholar]
- 10.Rhodes DR, Yu J, Shanker K, Deshpande N, Varambally R, Ghosh D, Barrette T, Pandey A, Chinnaiyan AM. ONCOMINE: a cancer microarray database and integrated data-mining platform. Neoplasia. 2004;6:1–6. doi: 10.1016/s1476-5586(04)80047-2. [DOI] [PMC free article] [PubMed] [Google Scholar]
- 11.Nusinow DP, Szpyt J, Ghandi M, Rose CM, McDonald ER 3rd, Kalocsay M, Jané-Valbuena J, Gelfand E, Schweppe DK, Jedrychowski M, Golji J, Porter DA, Rejtar T, Wang YK, Kryukov GV, Stegmeier F, Erickson BK, Garraway LA, Sellers WR, Gygi SP. Quantitative proteomics of the cancer cell line encyclopedia. Cell. 2020;180:387–402. e316. doi: 10.1016/j.cell.2019.12.023. [DOI] [PMC free article] [PubMed] [Google Scholar]
- 12.Cerami E, Gao J, Dogrusoz U, Gross BE, Sumer SO, Aksoy BA, Jacobsen A, Byrne CJ, Heuer ML, Larsson E, Antipin Y, Reva B, Goldberg AP, Sander C, Schultz N. The cBio cancer genomics portal: an open platform for exploring multidimensional cancer genomics data. Cancer Discov. 2012;2:401–404. doi: 10.1158/2159-8290.CD-12-0095. [DOI] [PMC free article] [PubMed] [Google Scholar]
- 13.Nagy Á, Munkácsy G, Győrffy B. Pancancer survival analysis of cancer hallmark genes. Sci Rep. 2021;11:6047. doi: 10.1038/s41598-021-84787-5. [DOI] [PMC free article] [PubMed] [Google Scholar]
- 14.Li T, Fan J, Wang B, Traugh N, Chen Q, Liu JS, Li B, Liu XS. TIMER: a web server for comprehensive analysis of tumor-infiltrating immune cells. Cancer Res. 2017;77:e108–e110. doi: 10.1158/0008-5472.CAN-17-0307. [DOI] [PMC free article] [PubMed] [Google Scholar]
- 15.Vasaikar S, Straub P, Wang J, Zhang B. LinkedOmics: analyzing multi-omics data within and across 32 cancer types. Nucleic Acids Res. 2018;46:D956–D963. doi: 10.1093/nar/gkx1090. [DOI] [PMC free article] [PubMed] [Google Scholar]
- 16.Du Y, Cai M, Xing X, Ji J, Yang E, Wu J. PINA 3.0: mining cancer interactome. Nucleic Acids Res. 2021;49:D1351–D1357. doi: 10.1093/nar/gkaa1075. [DOI] [PMC free article] [PubMed] [Google Scholar]
- 17.Koch A, De Meyer T, Jeschke J, Van Criekinge W. MEXPRESS: visualizing expression, DNA methylation and clinical TCGA data. BMC Genomics. 2015;16:636. doi: 10.1186/s12864-015-1847-z. [DOI] [PMC free article] [PubMed] [Google Scholar]
- 18.Chandrashekar D, Bashel B, Balasubramanya S, Creighton C, Ponce-Rodriguez I, Chakravarthi B, Varambally S. UALCAN: a portal for facilitating tumor subgroup gene expression and survival analyses. Neoplasia. 2017;19:649–658. doi: 10.1016/j.neo.2017.05.002. [DOI] [PMC free article] [PubMed] [Google Scholar]
- 19.Montel RA, Munoz-Zuluaga C, Stiles KM, Crystal RG. Can gene therapy be used to prevent cancer? Gene therapy for aldehyde dehydrogenase 2 deficiency. Cancer Gene Ther. 2022;29:889–896. doi: 10.1038/s41417-021-00399-1. [DOI] [PMC free article] [PubMed] [Google Scholar]
- 20.Hou G, Chen L, Liu G, Li L, Yang Y, Yan HX, Zhang HL, Tang J, Yang YC, Lin X, Chen X, Luo GJ, Zhu Y, Tang S, Zhang J, Liu H, Gu Q, Zhao LH, Li Y, Liu L, Zhou W, Wang H. Aldehyde dehydrogenase-2 (ALDH2) opposes hepatocellular carcinoma progression by regulating AMP-activated protein kinase signaling in mice. Hepatology. 2017;65:1628–1644. doi: 10.1002/hep.29006. [DOI] [PubMed] [Google Scholar]
- 21.Zhang H, Xia Y, Wang F, Luo M, Yang K, Liang S, An S, Wu S, Yang C, Chen D, Xu M, Cai M, To KKW, Fu L. Aldehyde dehydrogenase 2 mediates alcohol-induced colorectal cancer immune escape through stabilizing PD-L1 expression. Adv Sci (Weinh) 2021;8:2003404. doi: 10.1002/advs.202003404. [DOI] [PMC free article] [PubMed] [Google Scholar]
- 22.Wang Y, Wang C, Qiu J, Qu X, Peng J, Lu C, Zhang M, Zhang M, Qi X, Li G, Hua K. Targeting CD96 overcomes PD-1 blockade resistance by enhancing CD8+ TIL function in cervical cancer. J Immunother Cancer. 2022;10:e003667. doi: 10.1136/jitc-2021-003667. [DOI] [PMC free article] [PubMed] [Google Scholar]
- 23.Karpisheh V, Ahmadi M, Abbaszadeh-Goudarzi K, Mohammadpour Saray M, Barshidi A, Mohammadi H, Yousefi M, Jadidi-Niaragh F. The role of Th17 cells in the pathogenesis and treatment of breast cancer. Cancer Cell Int. 2022;22:108. doi: 10.1186/s12935-022-02528-8. [DOI] [PMC free article] [PubMed] [Google Scholar]
- 24.Lu X, An L, Fan G, Zang L, Huang W, Li J, Liu J, Ge W, Huang Y, Xu J, Du S, Cao Y, Zhou T, Yin H, Yu L, Jiao S, Wang H. EGFR signaling promotes nuclear translocation of plasma membrane protein TSPAN8 to enhance tumor progression via STAT3-mediated transcription. Cell Res. 2022;32:359–374. doi: 10.1038/s41422-022-00628-8. [DOI] [PMC free article] [PubMed] [Google Scholar]
- 25.Wang T, Wang X, Wang H, Li L, Zhang C, Xiang R, Tan X, Li Z, Jiang C, Zheng L, Xiao L, Yue S. High TSPAN8 expression in epithelial cancer cell-derived small extracellular vesicles promote confined diffusion and pronounced uptake. J Extracell Vesicles. 2021;10:e12167. doi: 10.1002/jev2.12167. [DOI] [PMC free article] [PubMed] [Google Scholar]
- 26.Li J, Chen X, Zhu L, Lao Z, Zhou T, Zang L, Ge W, Jiang M, Xu J, Cao Y, Du S, Yu Y, Fan G, Wang H. SOX9 is a critical regulator of TSPAN8-mediated metastasis in pancreatic cancer. Oncogene. 2021;40:4884–4893. doi: 10.1038/s41388-021-01864-9. [DOI] [PMC free article] [PubMed] [Google Scholar]
- 27.Lin J, Zhuo Y, Yin Y, Qiu L, Li X, Lai F. Methylation of RILP in lung cancer promotes tumor cell proliferation and invasion. Mol Cell Biochem. 2021;476:853–861. doi: 10.1007/s11010-020-03950-0. [DOI] [PubMed] [Google Scholar]
- 28.Wang Z, Zhou Y, Hu X, Chen W, Lin X, Sun L, Xu X, Hong W, Wang T. RILP suppresses invasion of breast cancer cells by modulating the activity of RalA through interaction with RalGDS. Cell Death Dis. 2015;6:e1923. doi: 10.1038/cddis.2015.266. [DOI] [PMC free article] [PubMed] [Google Scholar]
- 29.Ma X, Zhuang H, Wang Q, Yang L, Xie Z, Zhang Z, Tan W, Tang C, Chen Y, Shang C. SLC39A1 overexpression is associated with immune infiltration in hepatocellular carcinoma and promotes its malignant progression. J Hepatocell Carcinoma. 2022;9:83–98. doi: 10.2147/JHC.S349966. [DOI] [PMC free article] [PubMed] [Google Scholar]
- 30.Li K, Guo W, Li Z, Wang Y, Sun B, Xu D, Ling J, Song H, Liao Y, Wang T, Jing B, Hu M, Kuang Y, Wang Q, Yao F, Sun A, Zhu L, Wang L, Deng J. ALDH2 repression promotes lung tumor progression via accumulated acetaldehyde and DNA damage. Neoplasia. 2019;21:602–614. doi: 10.1016/j.neo.2019.03.008. [DOI] [PMC free article] [PubMed] [Google Scholar]
- 31.Zhao Y, Deng Z, Ma Z, Zhang M, Wang H, Tuo B, Li T, Liu X. Expression alteration and dysfunction of ion channels/transporters in the parietal cells induces gastric diffused mucosal injury. Biomed Pharmacother. 2022;148:112660. doi: 10.1016/j.biopha.2022.112660. [DOI] [PubMed] [Google Scholar]
- 32.Qu Y, Wang X, Bai S, Niu L, Zhao G, Yao Y, Li B, Li H. The effects of TNF-α/TNFR2 in regulatory T cells on the microenvironment and progression of gastric cancer. Int J Cancer. 2022;150:1373–1391. doi: 10.1002/ijc.33873. [DOI] [PMC free article] [PubMed] [Google Scholar]
- 33.Tyciakova S, Valova V, Svitkova B, Matuskova M. Overexpression of TNFα induces senescence, autophagy and mitochondrial dysfunctions in melanoma cells. BMC Cancer. 2021;21:507. doi: 10.1186/s12885-021-08237-1. [DOI] [PMC free article] [PubMed] [Google Scholar]
- 34.Lou S, Wang Y, Zhang J, Yin X, Zhang Y, Wang Y, Xue Y. Patient-level DNA damage repair pathway profiles and anti-tumor immunity for gastric cancer. Front Immunol. 2021;12:806324. doi: 10.3389/fimmu.2021.806324. [DOI] [PMC free article] [PubMed] [Google Scholar]
Associated Data
This section collects any data citations, data availability statements, or supplementary materials included in this article.