

Abstract
Fibroblast growth factor 9 (FGF9) modulates cell proliferation, differentiation and motility for development and tissue repair in normal cells. Growing evidence shows that abnormal activation of FGF9 signaling is associated with tumor malignancy. We have previously reported that FGF9 increases MA-10 mouse Leydig tumor cell proliferation, in vitro, and tumor growth, in vivo. Also, FGF9 promotes the tumor growth and liver metastasis of mouse Lewis lung cancer cells, in vivo. However, the effects of FGF9 in the early stage of tumorigenesis remains elusive. In this study, TM3 mouse Leydig progenitor cells, that are not tumorigenic in immunocompromised mice, were used as a model cell line to investigate the role of FGF9 in tumorigenesis. The results demonstrated that FGF9 significantly induced cell proliferation and activated the MAPK, PI3K and PLCγ signaling pathways in TM3 cells. The percentage of the cell number in G1 phase was reduced and that in S and G2/M phases was increased after FGF9 stimulation in TM3 cells. Cyclin D1, cyclin A1, CDK2, CDK1, and p21 expressions and the phosphorylation level of Rb were all induced in FGF9-treated TM3 cells. In addition, FGF9 increased the expression of FGF receptor 1-4 in TM3 cells, suggesting the positive feedback loop between FGF9 and FGFRs. Furthermore, in the allograft mouse model, FGF9 promoted the tumorigenesis of TM3 cells characterized by higher expression of tumor markers, such as tumor necrosis factor alpha (TNFα) and α-fetoprotein (AFP), in the subcutaneously inoculated TM3 cell tissue. Conclusively, FGF9 induced cell cycle to increase cell proliferation of TM3 cells through FAK, MAPK, PI3K/Akt and PLCγ signaling pathways, in vitro, and promoted the tumorigenesis of TM3 cell allograft tissue, in vivo, which is a potential marker for tumor as well as a target for cancer therapeutic strategies.
Keywords: FGF9, TM3 Leydig progenitor cells, cell proliferation, tumorigenesis, cell cycle, PI3K/Akt, MAPK
Introduction
Fibroblast growth factor 9 (FGF9) is a member of the large FGF family which has at least 24 members, and it was first isolated from the culture supernatant of a human glioma cell line [1,2]. FGF9 expresses in a wide variety of tissues and organs, and exerts multiple physiological functions, such as mitogenesis, organ development and repair, angiogenesis, embryogenesis, differentiation, proliferation, migration, and wound healing [3,4]. In embryonic stage, FGF9 was demonstrated to participate in palate formation, sex determination, and lung development [5-7]. In adult normal physical condition, FGF9 is expressed at low level in few organs [2,8].
In general, FGFs activate signal cascades through FGF receptors (FGFRs), a subgroup of the family of tyrosine kinase receptors, which regulate a variety of cell biological behaviors and functions [9-11]. There are four tyrosine kinase FGF receptors (FGFR1-4), which undergo alternative splicing to generate isoforms that have distinct ligand-binding specificities to different FGFs [12]. The main signaling pathways associated with FGFR activation include: 1. phosphatidylinositol-4,5-bisphosphate 3-kinase (PI3K)/protein kinase B (Akt) pathway, 2. mitogen-activated protein kinases (MAPK) pathway, and 3. phospholipase C gamma (PLCγ)/Ca2+ pathway [12,13]. In PI3K pathway, Akt is the first receiver from PI3K and transduces the signals to the downstream molecules. FGF-mediated FGFR activation could induce Akt phosphorylation and subsequently promote cell proliferation in non-small cell lung cancer and nasopharyngeal carcinoma [14,15]. The MAPK signal pathway mainly consists three signals: extracellular signal regulated kinases (ERK), c-Jun N-terminal kinases (JNK) and p38. In normal chondrocyte and pancreatic cancer cells, activation of FGFRs could induce cell proliferation through ERK phosphorylation [16,17]. In hepatocellular carcinoma, FGFR-mediated ERK and JNK activations increase the carcinogenesis and metastasis [18]. The p38 activation is involved in high glucose induced mesangial cell proliferation and gelsolin induced osteosarcoma proliferation [19,20]. In PLCγ pathway, the activated FGFR kinase recruits and activates PLCγ, and subsequently produces diacylglycerol (DAG) and inositol 1,4,5-triphosphate (IP3) by hydrolysis of the phospholipid phosphatidylinositol 4,5-bisphosphate (PI4,5P2) [21]. IP3 induces calcium ion (Ca2+) release from intracellular Ca2+ stores and regulates a wide range of cellular responses. DAG activates protein kinase C (PKC) and its downstream signaling pathways. It has been reported that FGFs activate PLCγ1 to induce cell proliferation and migration in keratinocyte and vascular smooth muscle cells [22,23].
Aberrant activation of FGF9/FGFR signaling pathways is frequently found associated with different kinds of diseases, developmental disorders and cancers [24-28]. It has been reported that FGF9 exerts oncogenic activity and is involved in the progression of several malignant diseases, such as lung cancer [29], gastric cancer [30], colon cancer [31], testicular cancer [24] and ovarian cancer [32]. It has been demonstrated that FGF9 promotes epithelium and mesenchyme proliferation in lung [6]. Also, FGF9 enhances cell proliferation and invasive ability of prostate cancer cells [33] and ovarian cancer [32]. Overexpression of FGF9 can promote tumor growth and liver metastasis of mouse Lewis lung carcinoma via EMT induction [29]. Furthermore, FGF9 can be reduced by miR-26a and MiRNA-140-5p, and then decrease the tumor growth and metastasis in gastric cancer and liver cancer, respectively [34,35]. In addition, elevated FGF9 expression is associated with poor prognosis in patients who have non-small cell lung cancer (NSCLC) [36].
The Leydig progenitor/stem cells are essential for the testis development and maturation. In embryonic stage, testosterone and dihydrotestosterone that produced by Sertoli cells and Leydig cells, respectively, are important for the development of mesonephric duct and external genitalia [37,38]. In postnatal stage, the testis produces the largest amount of testosterone by Leydig cells to maintain reproductive function. Not originated from the fetal Leydig cells, the adult Leydig cells are differentiated from the mesenchymal-like cells in the testis. The stem Leydig cells present from 7 day after birth, differentiate into progenitor Leydig cells, and subsequently give rise to immature Leydig cells. In order to set up enough Leydig cells before the age of puberty, the progenitor Leydig cells exert a high proliferation ability [39]. In addition, FGF9 is continuously expressed by Leydig cells in testis development for normal male sex determination [39]. FGF9 has the highest expression in the interstitial region at 17-18 days post coitum (dpc) and in the spermatocytes, spermatids and Leydig cells at 35-65 postnatal days (pnd) [40]. Furthermore, FGFR2 and FGFR3, the possible FGF9 receptors, are widely expressed in seminiferous tubules and in interstitial regions, respectively, during the embryonic testis development, whereas FGFR2 is extensively expressed by spermatids and Leydig cells, and FGFR3 is widely expressed in the whole testis in postnatal stage [40]. Recently, we have reported that FGF9 interacts with FGFR2 to activate ERK1/2, Rb/E2F1 and cell cycle pathways to promote mouse Leydig tumor cell proliferation in vitro and tumor growth in vivo [24]. However, the oncogenic effects of FGF9 on the initiation stage of testicular tumorigenesis remain elusive.
To elucidate the tumorigenic effects and its underlying mechanism of FGF9 on testicular cancer, a mouse Leydig progenitor cell line, TM3 cells were used. TM3 cells are a highly proliferative and immortalized Leydig cell line derived from 11-13 day mouse testis, however, they are not tumorigenic in immunocompromised mice [41-43]. Our results showed that FGF9 promoted TM3 cell proliferation by activating AKT, MAPK and cell cycle pathways, and induced the expression of the FGFR1, R2 and R4. Furthermore, in a severe combined immunodeficiency mouse allograft model, FGF9 promoted the tumorigenesis of TM3 cells characterized by higher expression of tumor markers, such as tumor necrosis factor alpha (TNFα) and α-fetoprotein (AFP), in the subcutaneously injected TM3 tissues.
Materials and methods
Cell line
TM3 mouse Leydig progenitor cell line (BCRC No. 60475; ATCC® CRL-1714™) was purchased from Bioresource Collection and Research Center (BCRC) of the Food Industry Research and Development Institute (Hsinchu, Taiwan), which was originally obtained from American Type Culture Collection (ATCC) (Rockville, CT, USA). TM3 cells were cultured in a 1:1 mixture of Dulbecco’s modified Eagle’s medium and Ham’s F12 medium (DMEM/F12) containing 2.5 mM L-glutamine, 0.5 mM sodium pyruvate, 1.2 g/L sodium bicarbonate and 15 mM HEPES, and supplemented with 5% horse serum and 2.5% fetal bovine serum at 37°C in a humidified atmosphere containing 5% CO2. 100 μg/mL streptomycin and 100 I.U./mL penicillin were added. All information of chemicals and materials used in this study are listed in Table S1.
Cell proliferation assay
TM3 cells were seeded in 96-well plates containing 6,000 cells with 100 μl culture medium per well. After 19 hours of serum-free starvation, the cells were treated with 0 (control), 1, 5, 25, 50 and 100 ng/ml recombinant human FGF9 in the medium containing 1% FBS for 24, 48 and 72 hours, respectively. 3-(4, 5-dimethylthiazol-2-yl)-2,5-diphenyltetrazolium bromide (MTT) (0.5 mg/ml) was added at different time points and incubated at 37°C for 4 hours. The medium was discarded and 50 μl DMSO was added per well to dissolve the crystals by shaking the plate for 20 minutes in the dark. The OD values in each treatment were determined using an ELISA reader at 570 nm (Molecular Devices, San Jose, CA, USA).
Cell cycle analysis
Treated TM3 cells were harvested by trypsin digestion, washed by isotone II, and fixed by 70% ethanol for at least 2 hours at -20°C. After fixation, cells were washed with cold isotone II and then collected by centrifugation. Cell suspensions were mixed with 100 μg/ml RNase and stained with 40 μg/ml propidium iodine (PI) for 30 minutes. The stained cells were analyzed at λ = 488 nm excitation using >600 nm band pass filter for PI detection by FACScan flow cytometer (Becton-Dickinson, Mountain View, CA, USA).
Western blotting
After 19 hours of serum-free starvation, TM3 cells were treated with 0 or 50 ng/ml FGF9 in the medium containing 1% FBS for 0, 0.25, 0.5, 1, 3 and 6 hours. At each time point, treated cells were washed by ice-cold PBS and lysed by ice-cold 70 μl lysis buffer (20 mM Tris pH7.5, 150 mM NaCl, 1 mM EGTA, 1 mM EDTA, 1% Triton X-100, 2.5 mM sodium pyrophosphate and 1 mM sodium orthovanadate). After centrifugation at 12,000×g for 15 minutes at 4°C, supernatants were collected and stored at -20°C. 25 μg total protein was separated by 12.5% SDS-PAGE and transferred onto polyvinylidence difluoride (PVDF) membranes. The PVDF membranes with transferred protein were blocked with 5% non-fat milk for 1 hour, and then incubated with the primary antibody in TBS buffer (20 mM Tris and 150 mM NaCl) with 3% BSA for 16-18 hours at 4°C. After washed with TBST buffer (TBS buffer with 0.1% Tween 20), the signal was detected with horseradish peroxidase-conjugated secondary antibody and visualized with chemiluminescence HRP substrate. The target proteins were quantitated by a computer-assisted image analysis system (UVP BioImage system software, UVP Inc., CA, USA). Protein level was quantitated by using ImageJ software (NIH, Bethesda, MD, USA) and the amount of β-actin in each lane was detected as an internal control. All information of antibodies used in this study are listed in Table S2.
Animal experiment
12 weeks old NOD/SCID (NOD.CB17-Prkdcscid/NcrCrl) male mice were purchased from National Laboratory Animal Center (Taipei, Taiwan). 1 × 10⁷ TM3 cells were subcutaneously (s.c.) injected into the right flanks of NOD/SCID mice. After 10 days, tumor-bearing mice were randomly assigned to 3 groups (4 mice per group): control (no treatment), FGF9 (treatment), or BSA (vehicle control). Then 50 ng/mL FGF9 in 100 μL PBS containing 0.00125% BSA was administrated into s.c. tumors by intra-tumor injection daily for 45 days. Body weight and tumor size were measured daily. Tumor volumes were calculated by the formula: (length × width2 × 3.14)/6. All experiments were undertaken in accordance with relevant guidelines and regulations, which were approved by the Institutional Animal Care and Use Committee of National Cheng Kung University (approval no. 110096).
Immunohistochemistry assay
Formalin-fixed paraffin-embedded tumor tissue sections were dewaxed by gently immersing in xylene, dehydrated through increasing concentrations of ethanol, and then washed in PBS. Endogenous peroxidase activity was blocked by incubation with 0.3% H2O2 and followed by washing with PBS. Sodium citrate buffer was used for the antigen retrieval and autoclaved at 120°C for 50 min. The sections were blocked with 2% nonfat milk for 1 h and then incubated overnight at 4°C with primary antibodies. Signal was visualized using HRP-conjugated secondary antibody and the chromogenic substrate 3,3’-diaminobenzidine. The sections were then counterstained with hematoxylin, dehydrated with a graded ethanol series, cleared in xylene, and mounted with coverslip using mounting solution. Negative controls were performed in each IHC assay by replacing the primary antibodies with a corresponding non-specific IgG.
Statistical analysis
Data were expressed as mean ± SEM from ≥3 separate experiments. Statistical significance between treatment and control groups was examined by one-way ANOVA followed by Tukey’s multiple comparisons post-test or Student’s t test with GraphPad Prism 9 software (GraphPad Software, Inc.). P < 0.05 was considered to indicate a statistically significant difference.
Results
FGF9 promoted cell proliferation in TM3 cells
To investigate the proliferation effect of FGF9 in TM3 mouse Leydig progenitor cells, different doses (0, 1, 10, 25, 50 and 100 ng/ml) of FGF9 were used to treat TM3 cells for 24, 48 and 72 hours, respectively. The proliferative effect of FGF9 in TM3 cells was detected by 3-(4, 5-dimethylthiazol-2-yl)-2,5-diphenyltetrazolium bromide (MTT). The results showed that FGF9 (10~100 ng/ml) significantly and dose-dependently enhanced TM3 cell proliferation at 24, 48 and 72 hours after treatment (Figure 1A). In the morphological observations, characteristics of cell death, such as cell rounding or floating, were not observed in 50 ng/ml FGF9-treated TM3 cells, and the cell numbers were higher in FGF9-treated groups at 48 hours compared to control groups (Figure 1B). In addition to MTT assay, western blotting assay was performed to detect the expression of the proliferation markers, Ki-67 and proliferating cell nuclear antigen (PCNA), related to the transcription rate of replicative DNA polymerase [44]. The results showed that the expressions of Ki-67 and PCNA were significantly up-regulated by FGF9 (50 ng/ml) in TM3 cells for 12 and 48 hours, respectively (Figure 1C). These findings indicate that FGF9 significantly induced cell proliferation of TM3 mouse Leydig progenitor cells.
Figure 1.

FGF9 induced Leydig cell proliferation in TM3 mouse Leydig progenitor cells. (A) After 19 hours of serum-free starvation, TM3 cells were treated with different concentrations of FGF9 [0 (control), 1, 10, 25, 50, and 100 ng/ml] for 24, 48 and 72 hours, respectively. The MTT assay was performed to evaluate the cell viability of FGF9-treated TM3 cells. (B) Cell morphology and growth were examined under light microscope 48 hours after 50 ng/ml FGF9 treatment. (C) PCNA and (D) Ki-67 in TM3 cells treated with 0 or 50 ng/ml FGF9 after 12, 24, 48 and 72 hours, respectively, were analyzed by Western blot assay. Results are mean ± standard error with at least three independent experiments. One-way ANOVA with Tukey’s multiple comparisons post-tests in (A) or Student’s t test in (C) and (D), respectively, were used to determine the statistical difference; *P < 0.05 vs. control group.
FGF9 activated PI3K, MAPK and PLCγ signaling pathways in TM3 cells
We previously reported that FGF9 interacts with FGFR2 to activate ERK1/2, Rb/E2F1 and cell cycle pathways to induce MA-10 cell proliferation [24]. Here, we also examined the mechanism underlying FGF9-activated cell proliferation in TM3 cells. Western blotting results showed that phosphoryrated (p)-Akt (Thr 308) was up-regulated after 0.25 hour of FGF9 stimulation and p-Akt (Ser 473) was up-regulated after 0.5 and 1 hour of FGF9 stimulation in TM3 cells, respectively (Figure 2A). The phosphorylation of Thr 308 is a prerequisite for kinase activation, whereas the phosphorylation of Ser 473 seems to further increase the Akt activity [45]. However, FGF9 had no effect on the expression and phosphorylation of mTOR, one of the downstream molecules of Akt, in TM3 cells (Figure 2B).
Figure 2.
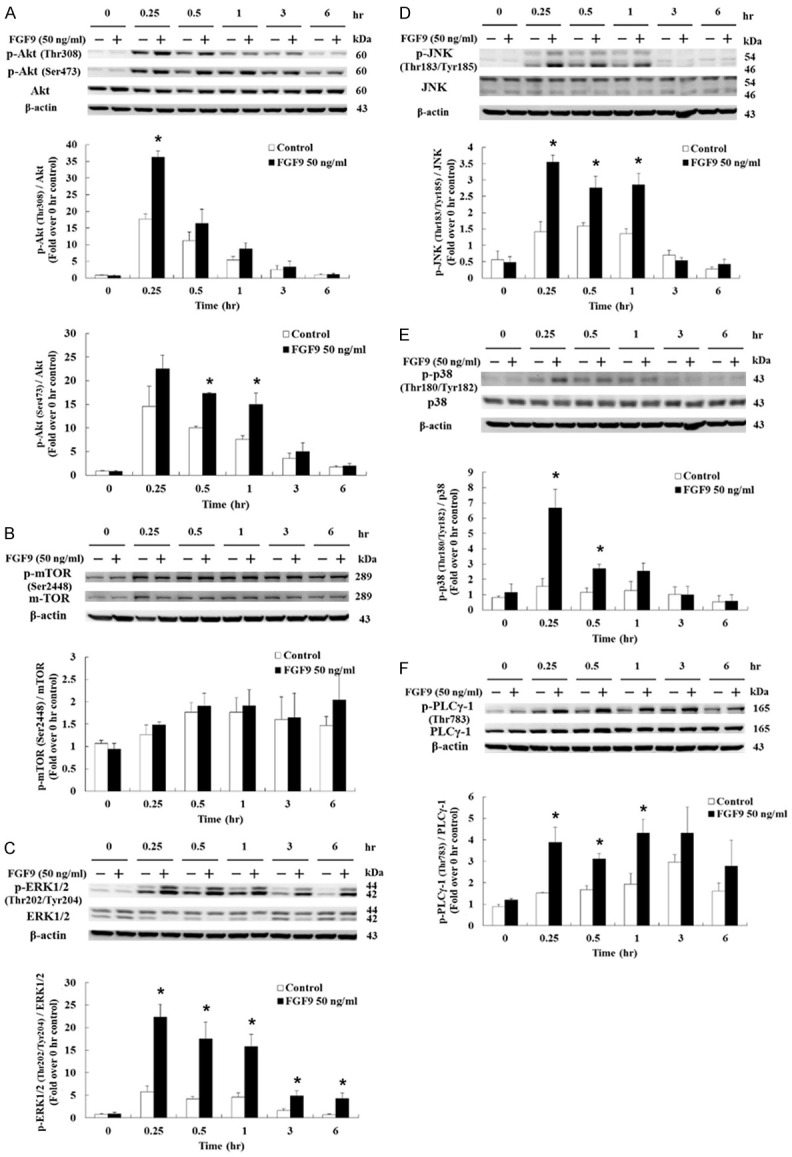
FGF9 activated PI3K/Akt and MAPK pathways in TM3 cells. (A) p-Akt (Thr308), p-Akt (Ser 473) and total Akt, (B) p-mTOR and total mTOR, (C) p-ERK1/2 and total ERK1/2, (D) p-JNK and total JNK, (E) p-p38 and total p38, and (F) phosphor-PLCγ1 and total PLCγ1 in TM3 cells treated with 0 or 50 ng/ml FGF9 for 0, 0.25, 0.5, 1, 3, and 6 hours, respectively, were analyzed by Western blot assay. Results are mean ± standard error with at least three independent experiments. Student’s t test was used to determine the statistical difference; *P < 0.05 vs. control group.
Next, we investigated the effects of FGF9 on MAPK signaling pathway in TM3 cells upon the phosphorylation level of three downstream signal molecules, which share the same Ras/MAPK upstream signal: ERK1/2, JNK and p38 [46]. Results demonstrated that p-ERK1/2, p-JNK and p-p38 were up-regulated. The p-ERK1/2 was up-regulated after 0.25, 0.5, 1, 3 and 6 hours of FGF9 treatment (Figure 2C); p-JNK was up-regulated after 0.25, 0.5 and 1 hour of FGF9 treatment (Figure 2D); and p-p38 was up-regulated after 0.25 and 0.5 hr of FGF9 treatment in TM3 cells, respectively (Figure 2E). Moreover, the phosphorylation of PLCγ-1 was increased in TM3 cells at 0.25 and 1 hour after FGF9 exposure (Figure 2F). Taken together, these data indicate that FGF9 could activate the PI3K, MAPK and PLCγ pathways to promote cell proliferation in TM3 cells.
FGF9 regulated cell cycle distribution in TM3 cells
In the suitable environment for growth, a cell will duplicate its genomic DNA and protein components to divide into two daughter cells [47]. The cycle of duplication and division is called the cell cycle. The speed of cell cycle represents the proliferation rate of cells [48]. Here, we used flow cytometry to detect the changes of cell distribution in G1, S and G2/M phases at different times with FGF9 stimulation. Results showed that 50 ng/ml FGF9 at 12, 16, 24 and 36 hours significantly reduced G1 phase cell number in TM3 cells (Figure 3A and 3B). However, 50 ng/ml FGF9 at 12, 16, 24 and 36 hours significantly increased S phase cell number (Figure 3A and 3C). In G2/M phase, significant increases in cell number compared to control were observed at 16, 20 and 36 hours after a 50 ng/ml FGF9 treatment (Figure 3A and 3D). These data demonstrated that FGF9 significantly promoted cell proliferation, which was highly correlated to cell cycle progressions in TM3 cells.
Figure 3.
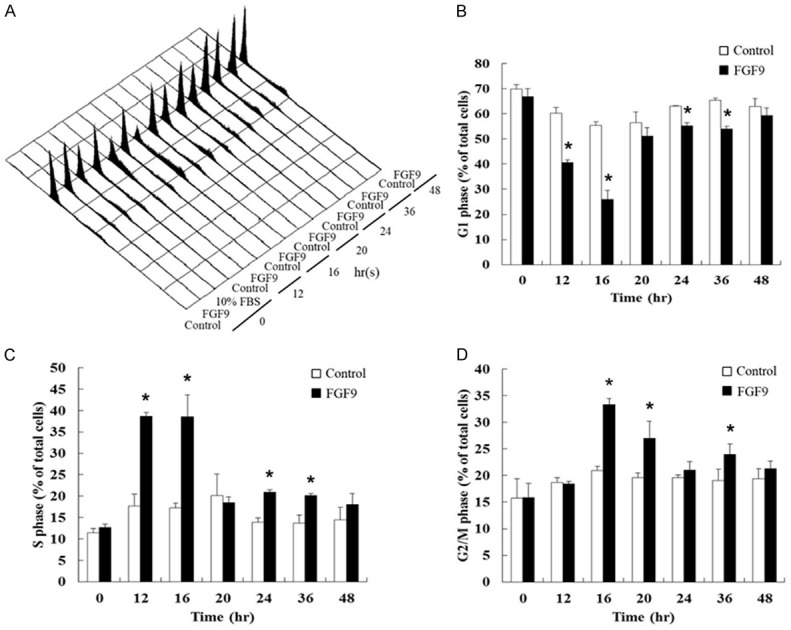
FGF9 regulated cell cycle distribution in Leydig cell lines. (A) Representative flow cytometric histograms of cell cycle analysis of TM3 cells after treatment with 0 (Control) or 50 ng/ml FGF9 for 0-48 hours. Cell cycle redistribution of PI-stained TM3 cells was analyzed using a FACScan flow cytometer. (B-D) Bar graphs show the cell cycle distributions in percentage of (B) G1, (C) S, and (D) G2/M phase in TM3 cells treated with/without FGF9 (50 ng/ml). Results are mean ± standard error with at least three independent experiments. Student’s t test was used to determine the statistical difference; *P < 0.05 vs. control group.
FGF9 induced cell cycle protein expressions in TM3 cells
The cell cycle controlling system depends on cyclically activated cyclin-dependent protein kinases (CDKs) and the activities of CDKs, which are regulated by different cyclins undergoing a cycle of synthesis and degradation in each cell cycle [49]. The western blotting assay was carried out to determine various protein expressions. Results showed that the expression of cyclin D1 was up-regulated from 12 to 48 hours by 50 ng/ml FGF9 in TM3 cells (Figure 4A). However, the expression of CDK4 was not changed after FGF9 treatment in TM3 cells (Figure 4B). The expressions of cell cycle related proteins at S/G2/M phase were also examined. The expression of cyclin E showed no significant change after FGF9 treatment in TM3 cells (Figure 4C). However, the expression of CDK2 was up-regulated at 24 and 48 hours by 50 ng/ml FGF9 in TM3 cells (Figure 4D). In addition, cyclin A was up-regulated at 48 hours (Figure 4E), and CDK1 was up-regulated at 24 and 48 hours by 50 ng/ml FGF9 in TM3 cells (Figure 4F), respec-tively. Taken together, these data imply that FGF9 induced TM3 cell proliferation by increasing the expressions of cyclins and CDKs to promote the cell cycle progression.
Figure 4.
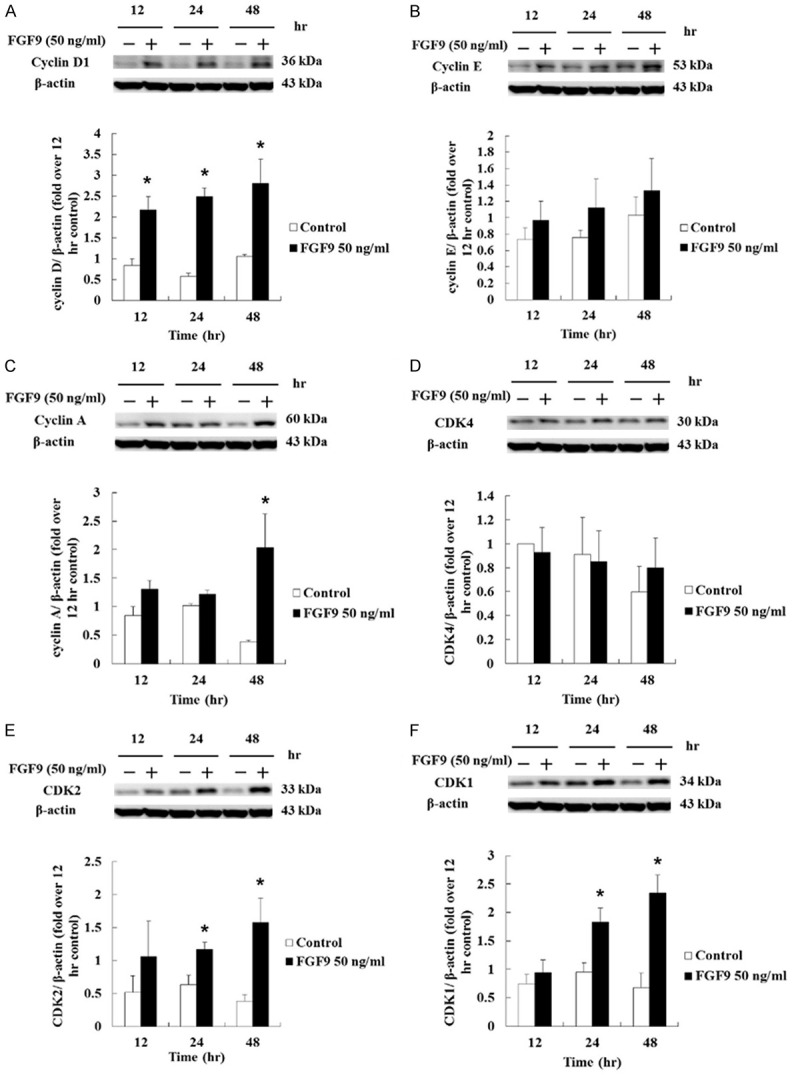
FGF9 induced the cell cycle-related proteins in TM3 cells. (A) cyclin D1, (B) cyclin E, (C) cyclin A, (D) CDK4, (E) CDK2, and (F) CDK1 in TM3 cells treated with 0 (Control) or 50 ng/ml FGF9 for 12, 24 and 48 hours, respectively, were analyzed by Western blot assay. Results are mean ± standard error with at least three independent experiments. Student’s t test was used to determine the statistical difference; *P < 0.05 vs. control group.
FGF9 increased the expression of p21 and phosphorylated Rb in TM3 cells
The cell cycle progression is controlled by cyclins and CDKs. When cells stop dividing, the key regulation proteins, such as p53, p21 and p27, are turned on to slow or stop the cell cycle progression [50,51]. The p53 is one of the critical proteins to regulate cell cycle, which could be activated by different stress signals, such as DNA strand break, hypoxia, heat shock and hyperproliferation. The phosphorylated p53 could consequently activate its downstream molecules, p21 and p27, that mediate the cyclin/CDK complex inhibition [50,51]. Thus, the expressions and/or phosphorylation of p53, p21 and p27 were determined by western blotting assay. Results showed that FGF9 increased the phosphorylation and expression of p53 in TM3 cells, but the ratios of phosphorylated-p53 at serine 15 to total p53 in FGF9-treated TM3 cells were not significantly different as compared to control group (Figure 5A). However, the expression of p21 was increased at 12, 24 and 48 hours by 50 ng/ml FGF9, and the highest expression of p21 was observed at 24 hours after FGF9 exposure in TM3 cells (Figure 5B). Although FGF9 decreased the phosphorylation and expression of p27, the ratios of phosphorylated-p27 to total p27 in FGF9-treated TM3 cells were not significantly different as compared to control group in TM3 cells (Figure 5C). Moreover, the phosphorylation of retinoblastoma protein (Rb), a tumor suppressor which prevents abnormal cell growth by inhibiting cell cycle progression at G1/S check point [52], significantly increased at 24 and 48 hours after FGF9 treatment in TM3 cells (Figure 5D). Taken together, that the increased phosphorylation of Rb and expression of p21 related to the cell cycle progression in TM3 mouse Leydig progenitor cells induced by FGF9 could be the essential cause of tumorigenesis.
Figure 5.
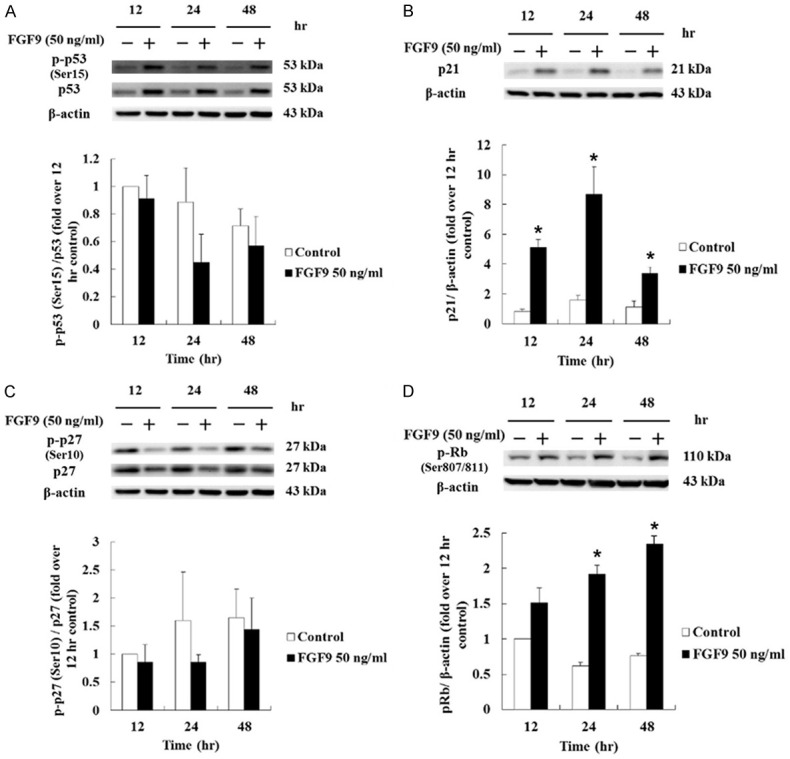
FGF9 induced cell cycle regulated protein in TM3 cells. (A) p-p53 and total p53, (B) p21, (C) p-p27 and total p27, and (D) p-Rb in TM3 cells treated with 0 (Control) or 50 ng/ml FGF9 for 12, 24 and 48 hours, respectively, were analyzed by Western blot assay. Results are mean ± standard error with at least three independent experiments. Student’s t test was used to determine the statistical difference; *P < 0.05 vs. control group.
FGF9 induced FGFR1-4 expressions in TM3 cells
FGFs act through binding and activation of FGFRs to regulate a variety of cell biological functions [9,11]. We, therefore, further investigated whether FGF9 could positively and/or negatively regulate the expression of FGFRs to amplify the effect of FGF9 in TM3 mouse Leydig progenitor cells related to tumorigenesis. Western blotting assay results showed that FGF9 at 50 ng/ml significantly increased FGFR1 expression after 12 and 24 hours exposure (Figure 6A). FGFR2 expression was elevated at 12 hours after FGF9 treatment (Figure 6B), whereas FGFR3 was not induced by FGF9 treatment (Figure 6C). FGFR4 was also up-regulated by 50 ng/ml FGF9 after 12 and 48 hours exposure (Figure 6D). These data illustrate that FGF9 increased the expressions of FGFR1, 2 and 4 in TM3 cells, indicating that FGF9 might be able to enhance the signals forming a positive loop in TM3 mouse Leydig progenitor cells for possible tumorigenesis.
Figure 6.
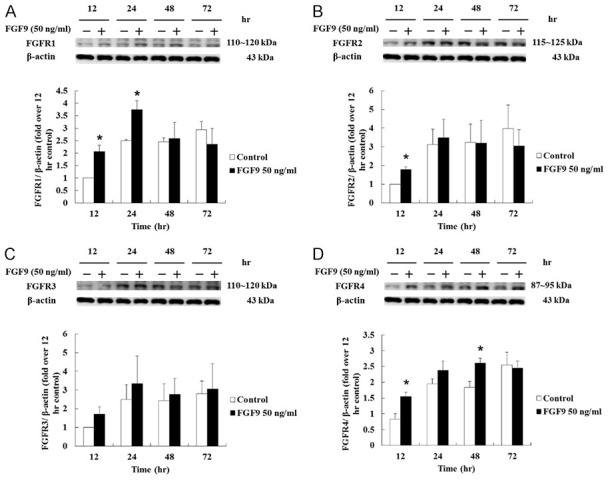
FGF9 induced the expression of FGFRs in TM3 cells. (A) FGFR1, (B) FGFR2, (C) FGFR3 and (D) FGFR4 in TM3 cells treated with 0 (Control) or 50 ng/ml FGF9 for 12, 24, 48 and 72 hours, respectively, were analyzed by Western blot assay. Results are mean ± standard error with at least three independent experiments. Student’s t test was used to determine the statistical difference; *P < 0.05 vs. control group.
Inhibitors suppressed FGF9-induced Akt, ERK1/2, JNK and/or p38 signals in TM3 cells
To further confirm whether FGF9 signaling was PI3K and/or MAPK pathway dependent, TM3 cells were pretreated with Wortmannin (Akt inhibitor), U0126 (ERK inhibitor), SP600125 (JNK inhibitor), and/or p38 inhibitor for 1 hour before FGF9 stimulation. Then, inhibitors and FGF9 were added together in TM3 cells for 15 minutes. Since it has been reported that focal adhesion kinase (FAK) is an important component in growth factor activation of MAP kinase [53], the inhibition of FAK in FGF9-treated TM3 cells was also investigated. Western blotting results showed that 20 µM PF573228, a FAK inhibitor, abrogated FGF9-induced p-ERK, p-JNK, p-p38 and p-Akt in TM3 cells (Fi-gure 7A and 7B), indicating that FGF9-induced activation of MAPK and Akt pathways were in a FAK-dependent manner. Moreover, wortmannin (Akt inhibitor) reduced FGF9-induced p-Akt in TM3 cells (Figures 7A, 7B and S1), but did not affect the expression of p-ERK, p-JNK and p-p38. In addition, complete inhibition of the ERK with MEK inhibitor U0126 suppressed the expression of p-JNK and p-p38, but not p-Akt in TM3 cells (Figures 7A, 7B and S1). These data indicated that ERK was not associated with the regulation on Akt pathway under FGF9 stimulation. Moreover, when p-JNK was suppressed by JNK inhibitor (SP600125), the expression of p-ERK, p-Akt and p-p38 was inhibited in TM3 cells (Figures 7A, 7B and S1), indicating that JNK could positively regulate MERK and Akt pathways. Surprisingly, treat-ment with p38 inhibitor did not suppress the phosphorylation of p38 in FGF9-induced TM3 cells (Figure 7A and 7B). There might be unknown downstream pathways of JNK cascade other than that of p38 inhibitor in FGF9-induced TM3 cells. According to these data, the Akt, ERK1/2, JNK, and p-38 pathways were activated after FGF9 stimulation. Akt and ERK pathways could possibly act independently, whereas JNK regulated Akt, ERK and p38 pathways upon FGF9 induction.
Figure 7.
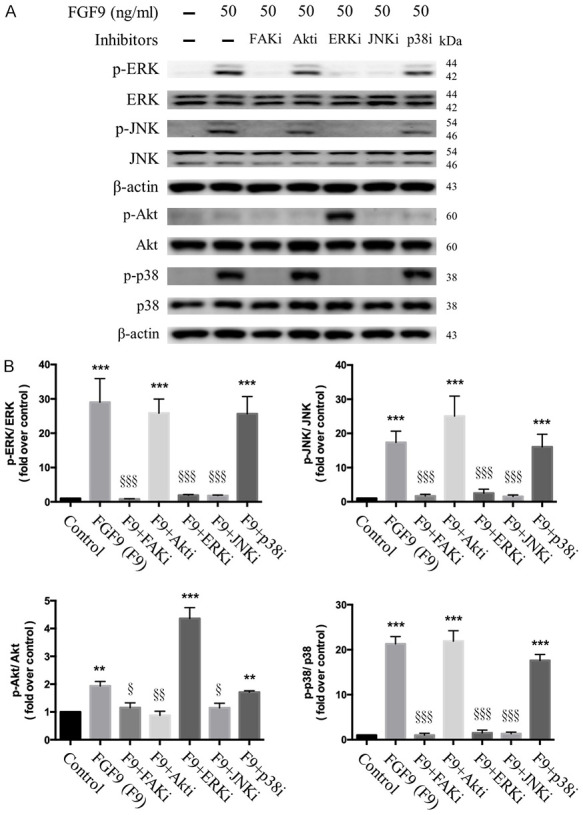
Inhibitor effect of FGF9-induced Akt and MAPK activation in TM3 cells. After 19 hours of serum-free starvation, TM3 cells were pretreated with 20 µM PF573228 (FAK inhibitor), 175 nM Wortmannin (Akt inhibitor), 30 µM U0126 (ERK inhibitor), 25 µM SP600125 (JNK inhibitor) or 1 µM SB203580 (p38 inhibitor) for 1 hour, respectively. Then, cells were treated with 50 ng/ml FGF9 (F9) and an inhibitor as indicated for 15 minutes. A. Expressions of p-ERK1/2, total ERK1/2, p-JNK, total JNK, p-Akt, total Akt, p-p38, and total p38 without or within 50 ng/ml FGF9 plus FAK, Akt, ERK, JNK, or p38 inhibitors, respectively, were analyzed by Western blot assay in TM3 cells. B. Bar charts show the quantified protein bands of p-ERK1/2, p-JNK, p-Akt, and p-p38 normalized against total ERK1/2, JNK, Akt and p38, respectively, which is presented as fold of control. Results are mean ± standard error with at least three independent experiments. One-way ANOVA with Tukey’s multiple comparisons post-tests were used to determine the statistical difference; **P < 0.01 and ***P < 0.001 vs. control group; and §P < 0.05, §§P < 0.01, and §§§P < 0.001 vs. FGF9-treated group.
FGF9 promoted tumor growth and tumorigenesis of TM3 allograft model
Since FGF9 promoted TM3 cell proliferation in vitro, the oncogenic effect of FGF9 was further investigated in vivo by subcutaneously (s.c.) inoculat-ing TM3 cells into the right flank of male NOD-SCID mice. After 10 days, mice were given daily s.c. injections of 5 ng FGF9 or BSA (vehicle) for 45 days. Results showed that the TM3 cell tissue volumes of the FGF9-treated group were significantly higher than that of BSA (vehicle) and control (no treatment) groups (Figure 8A). Also, the tumor weights significantly increased with FGF9 administration (FGF9-treated group, 0.668 ± 0.08 g: vehicle group, 0.37 ± 0.10 g; and control group, 0.435 ± 0.10 g) (Figure 8B and 8C).
Figure 8.
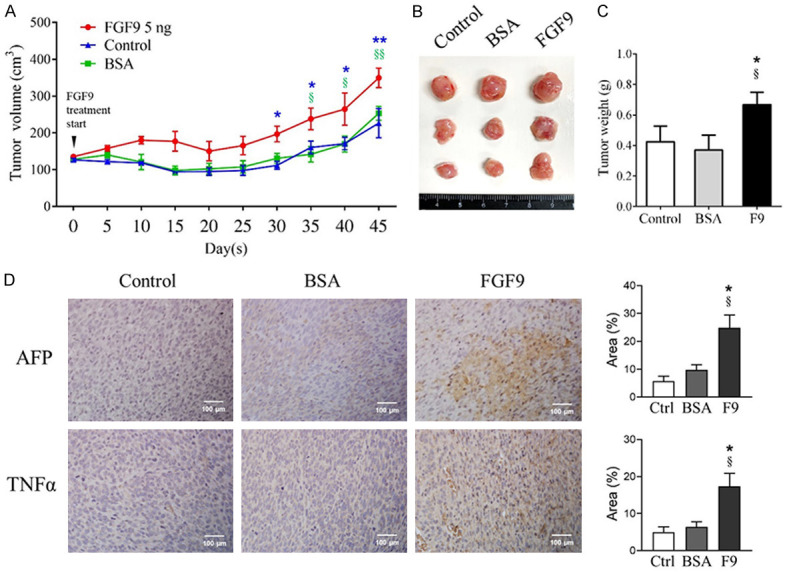
FGF9 promoted the tissue growth and the expression of tumor markers in subcutaneous TM3 nodules in the NOD-SCID mouse model. TM3 cell subcutaneously (s.c.) inoculated NOD-SCID mice were treated with 5 ng FGF9 or 0.00125% BSA (vehicle control) once daily for 45 days. Mice in Control (Ctrl) group with s.c. inoculated TM3 cells received no treatment. (A) Tumor growth curves were plotted against time. (B) Tumor morphology and (C) weights of excised subcutaneous TM3 cell tumors from the Control, BSA and FGF9 group mice are illustrated, respectively. (D) Immunohistochemistry (IHC) assay for α-fetoprotein (AFP) and tumor necrosis factor alpha (TNFα), tumor markers, expressions in TM3 cell tumors (original magnification: × 200; scale bar, 100 μm). Values are represented as the mean ± SEM; n = 4 in BSA and FGF9 groups, and n = 3 in Control group. The data were analyzed by Two-way ANOVA with Sidak’s multiple comparisons post-test in (A) or one-way ANOVA with Tukey’s multiple comparisons post-test in (C) and (D), respectively; *P < 0.05 and **P < 0.01 vs. Control group; and §P < 0.05 and §§P < 0.01 vs. BSA group.
Tumor necrosis factor alpha (TNFα) and α-fetoprotein (AFP) are common biomarkers for diagnosis and follow-up in hepatocellular carcinoma, breast cancer, lung cancer, and germ cell tumors [54-56]. Clinical and laboratory investigations have also reported that AFP and TNFα are useful biomarkers in diagnosis and detection for recurrence of testicular cancer [57,58]. To further investigate the tumor promoting properties of FGF9, we examined the expressions of AFP and TNFα expressions in s.c. inoculated TM3 cell tissues. Immunohistochemistry (IHC) staining results showed that the s.c. inoculated TM3 cell tissue expressed higher level of AFP and TNFα upon FGF9 stimulation (Figure 8D). The data suggested that FGF9 exerted tumorigenic abilities.
Discussion
In this study, we demonstrated that FGF9 promoted cell proliferation in TM3 mouse Leydig progenitor cells through FAK, PI3K/Akt, MAPK and PLCγ pathways. FGF9 also induced cell cycle progression by increasing the expressions of p-Rb, cyclins and CDKs (Figure 9). These results, along with our previous reports on the FGF9-increased cell proliferation and tumor growth of MA-10 mouse Leydig tumor cells [24,59], suggest that FGF9 is an important regulator of cell proliferation in both Leydig progenitor and tumor cells.
Figure 9.
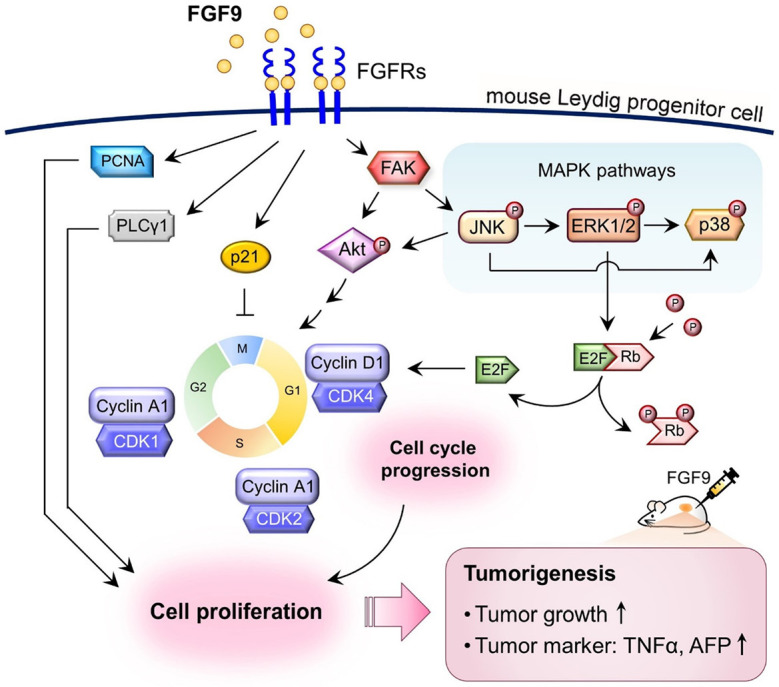
Schematic representation of the possible pathways activated by FGF9 to promote cell proliferation in TM3 mouse Leydig progenitor cells. FGF9 interacts with FGFRs to stimulate the phosphorylation of Akt, MAPK (ERK1/2, JNK and p38), PLCγ and Rb, and subsequently induces the expressions of cell cycle related proteins, cyclins and CDKs, to increase cell cycle progression, which finally promotes TM3 cell proliferation. In NOD-SCID allograft model, FGF9 promotes TM3 tumorigenesis by increasing TM3 tumor growth and enhancing the AFP and TNFα expressions in TM3 allograft tissues.
In the present study, we have used TM3 cell lines as a model system to investigate the effect of FGF9 in Leydig progenitor cells. TM3 cell line was derived from primary culture of mouse Leydig cell enriched preparations from normal testis of 11- to 13-day-old BALB/c mice [41]. Unlike isolated primary Leydig cells, TM3 cells have proliferation ability in culture condition, but do not form tumors when inoculated in BALB/c-nu/nu mice subcutaneously [41]. In hormone production test, TM3 cells respond to LH or hCG but not to FSH with an increased cyclic AMP production. According to these characteristics, many studies consider that TM3 is a normal mouse cells [60,61]. Based on the non-tumorigenic ability and cell proliferation ability, TM3 cell line may be defined as a progenitor cell line [43].
In our results, we demonstrated the activation profile of PI3K, MAPK and PLCγ signaling pathways in FGF9-treated TM3 mouse Leydig progenitor cells. Compared to our previous results, FGF9 could induce Akt phosphorylation as soon as at 0.25 hour in TM3 cells (Figure 2A), whereas Akt phosphorylation was induced at 3 hours in FGF9-treated MA-10 cells [59]. However, no changes were observed in the expression of p-mTOR after FGF9 stimulation. In addition to Akt, PKC and MAPK signaling path-ways were demonstrated to regulate the activity of mTOR complex [62,63]. Other studies have also shown that FGF9-mediated mTOR activation promoted stromal cell proliferation was not through PI3K/Akt signal. These evidences indicate that there is no direct link between Akt and mTOR signal, which could match with our results.
In MAPK signaling pathway, FGF9 could only induce ERK1/2 phosphorylation in MA-10 cells [24,59], but JNK, ERK1/2 and p38 phosphorylation in TM3 cells, respectively (Figure 2). It has been reported that the gastric cancer growth, migration and invasion were regulated through JNK/cJun/AP-1 signaling [64,65]. ERK activation was demonstrated to promote gastric cancer growth, endometrial carcinoma tumorigenesis, and breast cancer proliferation [66,67]. p38 was reported to involve in bone mesenchymal stem cell and hepatic stellate cell proliferation [68,69]. Additionally, PLCγ was involved in cell proliferation, migration, survival and death [70]. According to these literatures, we speculate that FGF9 does contribute to cell proliferation in TM3 cells.
In flow cytometry experiments, we noticed that FGF9 reduced cell number in G1 phase, but increased cell number in S and G2/M phase in TM3 cells after 12-hour exposure, respectively. The protein level of cyclin D1 was up-regulated by FGF9 from 12 to 48 hours, and CDK2, cyclin A and CDK1 were also up-regulated by FGF9 at 24 and 48 hours in TM3 cells, respectively. It is interesting that cyclin D1, the specific protein expressed in G1 phase, also significantly expressed in S/G2/M phase in TM3 cells. Kaplon and his colleague have demonstrated that cyclin D-CDK4/6 complex did increase at early G1 phase and decreased at S phase. However, cyclin D-CDK4/6 complex had secondary peak after the increase of cyclin A-CDK1/2 complex in G2/M phase [49]. Thus, it is possible the elevated cyclin D at 48 hours is the secondary peak in S and G2/M phase during FGF9 stimulation in TM3 cells.
In the cell cycle inhibitory protein, the phosphorylation and expression level of p53 were up-regulated and p27 were down-regulated during FGF9 stimulation in TM3 cells. However, the quantification ratio of the phosphorylated protein to it’s total protein did not show significant difference between control and FGF9-treated group. We speculate that the inhibitory effect of p53 and p27 may be normalized by the higher expression of total p53 and p27. In addition, FGF9 increased the expression level of p21 from 12 to 48 hours. Except for the inhibitory effect, p21 was also demonstrated to be up-regulated by growth factors in p53 independent manner [71]. Different from the inhibitory effect of p21 in the nucleus, the cytosolic p21 could mediate the assembly and import of cyclin D-CDK4/6 complex [72,73]. Moreover, cyclin A-CDK2 or cyclin D-CDK4 complexes have been reported to be active even in presence of abundant p21 protein [74]. According to these studies, it needs more studies to identify the effect of p21 in FGF9-treated TM3 cells.
In the inhibitor treatments, we showed that the MAPK inhibitor (SB203580, PD98059 and SP600125) increased the expression of p-Akt in TM3 cells. Numerous studies have been reported that there were crosstalk and compensation between MAPK and PI3K-Akt signaling pathways, which can negatively regulate each other’s activity [75-77]. In many types of cells, the cross-talk effects depend on the EGF levels and the stimulation time. Low EGF doses activate PI3K-Akt pathway and suppress Ras-ERK pathway, whereas high EGF doses negatively influence the ERK pathway on the Akt pathway [76]. Moreover, VEGF signaling consists of two downstream components with opposite effects in artery-vein specification of endothelial progenitor cells. It has been shown that ERK1/2 signaling promotes the arterial cell fate, whereas PI3K-Akt signaling has an opposite effect to promote vein cell differentiation by blocking ERK activation [77]. These studies and our observation indicate that the cross-talk of cellular signaling pathways occurs under certain environmental signals and/or stimulations.
In animal experiment, results showed that FGF9 significantly induced TM3 tumor growth (Figure 8A-C), although the TM3 cell tissue size at 45 days after FGF9 induction is much less than MA-10 tumors with only 9 days after FGF9 stimulation (control group, 3.08 ± 0.27 g; and FGF9-treated group, 4.62 ± 0.54 g) [24]. In addition, we indeed observed that both of AFP and TNFα, tumor biomarkers, expression levels were increased by FGF9. However, the M1/M2 macrophages were not present in the FGF9-treated TM3 nodules (data not shown). These findings imply that FGF9-stimulated TM3 cell tissue was still at the early stage of tumorigenesis without the ability to recruit monocyte infiltrations, the key factors in tumor environment associated with immune tole-rance, angiogenesis and metastasis.
In summary, we demonstrated that FGF9 could promote cell proliferation in both Leydig progenitor cells (Figure 1) and tumor cells [24]. The FGF9-induced receptor expressions, signal activation and cell cycle redistribution provide the possible route of FGF9-induced cell proliferation in Leydig cells. It is suggested that FGF9 is required for tissue development, and also involved in tumorigenesis and tumor progressions in testis, which is a potential marker for tumor diagnosis and a target for cancer treatment.
Acknowledgements
This work was supported by grants from National Science and Technology Conceal, Taiwan, Republic of China (grant number MOST110-2320-B-006-025 to BMH; grant number: NSTC111-2320-B-006-069-MY2 to MMC), and from National Cheng Kung University Hospital (NCKUH-11002006 to HYW and BMH). We thank the technical services provide by the Bio-image Core Facility of the National Core Facility Program for Biotechnology, Ministry of Science and Technology, Taiwan, ROC.
Disclosure of conflict of interest
None.
Supporting Information
References
- 1.Naruo K, Seko C, Kuroshima K, Matsutani E, Sasada R, Kondo T, Kurokawa T. Novel secretory heparin-binding factors from human glioma cells (glia-activating factors) involved in glial cell growth. Purification and biological properties. J Biol Chem. 1993;268:2857–2864. [PubMed] [Google Scholar]
- 2.Miyamoto M, Naruo K, Seko C, Matsumoto S, Kondo T, Kurokawa T. Molecular cloning of a novel cytokine cDNA encoding the ninth member of the fibroblast growth factor family, which has a unique secretion property. Mol Cell Biol. 1993;13:4251–4259. doi: 10.1128/mcb.13.7.4251. [DOI] [PMC free article] [PubMed] [Google Scholar]
- 3.Clayton NS, Wilson AS, Laurent EP, Grose RP, Carter EP. Fibroblast growth factor-mediated crosstalk in cancer etiology and treatment. Dev Dyn. 2017;246:493–501. doi: 10.1002/dvdy.24514. [DOI] [PubMed] [Google Scholar]
- 4.Ornitz DM, Itoh N. Fibroblast growth factors. Genome Biol. 2001;2:REVIEWS3005. doi: 10.1186/gb-2001-2-3-reviews3005. [DOI] [PMC free article] [PubMed] [Google Scholar]
- 5.Iwata J, Tung L, Urata M, Hacia JG, Pelikan R, Suzuki A, Ramenzoni L, Chaudhry O, Parada C, Sanchez-Lara PA, Chai Y. Fibroblast growth factor 9 (FGF9)-pituitary homeobox 2 (PITX2) pathway mediates transforming growth factor beta (TGFbeta) signaling to regulate cell proliferation in palatal mesenchyme during mouse palatogenesis. J Biol Chem. 2012;287:2353–2363. doi: 10.1074/jbc.M111.280974. [DOI] [PMC free article] [PubMed] [Google Scholar]
- 6.Yin YJ, Wang F, Ornitz DM. Mesothelial- and epithelial-derived FGF9 have distinct functions in the regulation of lung development. Development. 2011;138:3169–3177. doi: 10.1242/dev.065110. [DOI] [PMC free article] [PubMed] [Google Scholar]
- 7.Colvin JS, Green RP, Schmahl J, Capel B, Ornitz DM. Male-to-female sex reversal in mice lacking fibroblast growth factor 9. Cell. 2001;104:875–889. doi: 10.1016/s0092-8674(01)00284-7. [DOI] [PubMed] [Google Scholar]
- 8.Tsai SJ, Wu MH, Chen HM, Chuang PC, Wing LY. Fibroblast growth factor-9 is an endometrial stromal growth factor. Endocrinology. 2002;143:2715–2721. doi: 10.1210/endo.143.7.8900. [DOI] [PubMed] [Google Scholar]
- 9.Padrissa-Altes S, Bachofner M, Bogorad RL, Pohlmeier L, Rossolini T, Bohm F, Liebisch G, Hellerbrand C, Koteliansky V, Speicher T, Werner S. Control of hepatocyte proliferation and survival by Fgf receptors is essential for liver regeneration in mice. Gut. 2015;64:1444–1453. doi: 10.1136/gutjnl-2014-307874. [DOI] [PubMed] [Google Scholar]
- 10.Lu H, Shi X, Wu G, Zhu J, Song C, Zhang Q, Yang G. FGF13 regulates proliferation and differentiation of skeletal muscle by down-regulating Spry1. Cell Prolif. 2015;48:550–560. doi: 10.1111/cpr.12200. [DOI] [PMC free article] [PubMed] [Google Scholar]
- 11.Chen YJ, Zhang JX, Shen L, Qi Q, Cheng XX, Zhong ZR, Jiang ZQ, Wang R, Lu HZ, Hu JG. Schwann cells induce proliferation and migration of oligodendrocyte precursor cells through secretion of PDGF-AA and FGF-2. J Mol Neurosci. 2015;56:999–1008. doi: 10.1007/s12031-015-0570-1. [DOI] [PubMed] [Google Scholar]
- 12.Touat M, Ileana E, Postel-Vinay S, Andre F, Soria JC. Targeting FGFR signaling in cancer. Clin Cancer Res. 2015;21:2684–2694. doi: 10.1158/1078-0432.CCR-14-2329. [DOI] [PubMed] [Google Scholar]
- 13.Hierro C, Rodon J, Tabernero J. Fibroblast growth factor (FGF) receptor/FGF Inhibitors: novel targets and strategies for optimization of response of solid tumors. Semin Oncol. 2015;42:801–819. doi: 10.1053/j.seminoncol.2015.09.027. [DOI] [PubMed] [Google Scholar]
- 14.Hu F, Liu H, Xie X, Mei J, Wang M. Activated cdc42-associated kinase is up-regulated in non-small-cell lung cancer and necessary for FGFR-mediated AKT activation. Mol Carcinog. 2016;55:853–863. doi: 10.1002/mc.22327. [DOI] [PubMed] [Google Scholar]
- 15.He Q, Ren X, Chen J, Li Y, Tang X, Wen X, Yang X, Zhang J, Wang Y, Ma J, Liu N. miR-16 targets fibroblast growth factor 2 to inhibit NPC cell proliferation and invasion via PI3K/AKT and MAPK signaling pathways. Oncotarget. 2016;7:3047–58. doi: 10.18632/oncotarget.6504. [DOI] [PMC free article] [PubMed] [Google Scholar]
- 16.Matsuda Y, Yoshimura H, Suzuki T, Uchida E, Naito Z, Ishiwata T. Inhibition of fibroblast growth factor receptor 2 attenuates proliferation and invasion of pancreatic cancer. Cancer Sci. 2014;105:1212–1219. doi: 10.1111/cas.12470. [DOI] [PMC free article] [PubMed] [Google Scholar]
- 17.Bradley EW, Carpio LR, Newton AC, Westendorf JJ. Deletion of the PH-domain and leucine-rich repeat protein phosphatase 1 (Phlpp1) increases fibroblast growth factor (Fgf) 18 expression and promotes chondrocyte proliferation. J Biol Chem. 2015;290:16272–16280. doi: 10.1074/jbc.M114.612937. [DOI] [PMC free article] [PubMed] [Google Scholar]
- 18.Wang J, Su H, Han X, Xu K. Inhibition of fibroblast growth factor receptor signaling impairs metastasis of hepatocellular carcinoma. Tumour Biol. 2014;35:11005–11011. doi: 10.1007/s13277-014-2384-0. [DOI] [PubMed] [Google Scholar]
- 19.Ma X, Sun W, Shen J, Hua Y, Yin F, Sun M, Cai Z. Gelsolin promotes cell growth and invasion through the upregulation of p-AKT and p-P38 pathway in osteosarcoma. Tumour Biol. 2016;37:7165–7174. doi: 10.1007/s13277-015-4565-x. [DOI] [PubMed] [Google Scholar]
- 20.Wang X, Shi L, Han Z, Liu B. Follistatin-like 3 suppresses cell proliferation and fibronectin expression via p38MAPK pathway in rat mesangial cells cultured under high glucose. Int J Clin Exp Med. 2015;8:15214–15221. [PMC free article] [PubMed] [Google Scholar]
- 21.Sekiya F, Poulin B, Kim YJ, Rhee SG. Mechanism of tyrosine phosphorylation and activation of phospholipase C-gamma 1. Tyrosine 783 phosphorylation is not sufficient for lipase activation. J Biol Chem. 2004;279:32181–32190. doi: 10.1074/jbc.M405116200. [DOI] [PubMed] [Google Scholar]
- 22.Caglayan E, Vantler M, Leppanen O, Gerhardt F, Mustafov L, Ten Freyhaus H, Kappert K, Odenthal M, Zimmermann WH, Tallquist MD, Rosenkranz S. Disruption of platelet-derived growth factor-dependent phosphatidylinositol 3-kinase and phospholipase C gamma 1 activity abolishes vascular smooth muscle cell proliferation and migration and attenuates neointima formation in vivo. J Am Coll Cardiol. 2011;57:2527–2538. doi: 10.1016/j.jacc.2011.02.037. [DOI] [PMC free article] [PubMed] [Google Scholar]
- 23.Peltzer N, Bigliardi P, Widmann C. UV-B induces cytoplasmic survivin expression in mouse epidermis. J Dermatol Sci. 2012;67:196–199. doi: 10.1016/j.jdermsci.2012.05.007. [DOI] [PubMed] [Google Scholar]
- 24.Chang MM, Lai MS, Hong SY, Pan BS, Huang H, Yang SH, Wu CC, Sun HS, Chuang JI, Wang CY, Huang BM. FGF9/FGFR2 increase cell proliferation by activating ERK1/2, Rb/E2F1, and cell cycle pathways in mouse Leydig tumor cells. Cancer Sci. 2018;109:3503–3518. doi: 10.1111/cas.13793. [DOI] [PMC free article] [PubMed] [Google Scholar]
- 25.Arai D, Hegab AE, Soejima K, Kuroda A, Ishioka K, Yasuda H, Naoki K, Kagawa S, Hamamoto J, Yin Y, Ornitz DM, Betsuyaku T. Characterization of the cell of origin and propagation potential of the fibroblast growth factor 9-induced mouse model of lung adenocarcinoma. J Pathol. 2015;235:593–605. doi: 10.1002/path.4486. [DOI] [PMC free article] [PubMed] [Google Scholar]
- 26.Huang Y, Jin C, Hamana T, Liu J, Wang C, An L, McKeehan WL, Wang F. Overexpression of FGF9 in prostate epithelial cells augments reactive stroma formation and promotes prostate cancer progression. Int J Biol Sci. 2015;11:948–960. doi: 10.7150/ijbs.12468. [DOI] [PMC free article] [PubMed] [Google Scholar]
- 27.Sun C, Fukui H, Hara K, Zhang X, Kitayama Y, Eda H, Tomita T, Oshima T, Kikuchi S, Watari J, Sasako M, Miwa H. FGF9 from cancer-associated fibroblasts is a possible mediator of invasion and anti-apoptosis of gastric cancer cells. BMC Cancer. 2015;15:333. doi: 10.1186/s12885-015-1353-3. [DOI] [PMC free article] [PubMed] [Google Scholar]
- 28.Chen TM, Shih YH, Tseng JT, Lai MC, Wu CH, Li YH, Tsai SJ, Sun HS. Overexpression of FGF9 in colon cancer cells is mediated by hypoxia-induced translational activation. Nucleic Acids Res. 2014;42:2932–2944. doi: 10.1093/nar/gkt1286. [DOI] [PMC free article] [PubMed] [Google Scholar]
- 29.Chang MM, Wu SZ, Yang SH, Wu CC, Wang CY, Huang BM. FGF9/FGFR1 promotes cell proliferation, epithelial-mesenchymal transition, M2 macrophage infiltration and liver metastasis of lung cancer. Transl Oncol. 2021;14:101208. doi: 10.1016/j.tranon.2021.101208. [DOI] [PMC free article] [PubMed] [Google Scholar]
- 30.Ren C, Chen H, Han C, Fu D, Wang F, Wang D, Ma L, Zhou L, Han D. The anti-apoptotic and prognostic value of fibroblast growth factor 9 in gastric cancer. Oncotarget. 2016;7:36655–36665. doi: 10.18632/oncotarget.9131. [DOI] [PMC free article] [PubMed] [Google Scholar]
- 31.Gan J, Hu CE. MicroRNA-486-5p targets FGF9 and inhibits colorectal cancer proliferation, migration and invasion. Int J Clin Exp Pathol. 2016;9:5258–5266. [Google Scholar]
- 32.Bhattacharya R, Ray Chaudhuri S, Roy SS. FGF9-induced ovarian cancer cell invasion involves VEGF-A/VEGFR2 augmentation by virtue of ETS1 upregulation and metabolic reprogramming. J Cell Biochem. 2018;119:8174–8189. doi: 10.1002/jcb.26820. [DOI] [PubMed] [Google Scholar]
- 33.Teishima J, Shoji K, Hayashi T, Miyamoto K, Ohara S, Matsubara A. Relationship between the localization of fibroblast growth factor 9 in prostate cancer cells and postoperative recurrence. Prostate Cancer Prostatic Dis. 2012;15:8–14. doi: 10.1038/pcan.2011.48. [DOI] [PubMed] [Google Scholar]
- 34.Deng M, Tang HL, Lu XH, Liu MY, Lu XM, Gu YX, Liu JF, He ZM. miR-26a suppresses tumor growth and metastasis by targeting FGF9 in gastric cancer. PLoS One. 2013;8:e72662. doi: 10.1371/journal.pone.0072662. [DOI] [PMC free article] [PubMed] [Google Scholar]
- 35.Yang H, Fang F, Chang R, Yang L. MicroRNA-140-5p suppresses tumor growth and metastasis by targeting transforming growth factor beta receptor 1 and fibroblast growth factor 9 in hepatocellular carcinoma. Hepatology. 2013;58:205–217. doi: 10.1002/hep.26315. [DOI] [PubMed] [Google Scholar]
- 36.Ohgino K, Soejima K, Yasuda H, Hayashi Y, Hamamoto J, Naoki K, Arai D, Ishioka K, Sato T, Terai H, Ikemura S, Yoda S, Tani T, Kuroda A, Betsuyaku T. Expression of fibroblast growth factor 9 is associated with poor prognosis in patients with resected non-small cell lung cancer. Lung Cancer. 2014;83:90–96. doi: 10.1016/j.lungcan.2013.10.016. [DOI] [PubMed] [Google Scholar]
- 37.Willerton L, Smith RA, Russell D, Mackay S. Effects of FGF9 on embryonic Sertoli cell proliferation and testicular cord formation in the mouse. Int J Dev Biol. 2004;48:637–643. doi: 10.1387/ijdb.031778lw. [DOI] [PubMed] [Google Scholar]
- 38.Sajjad Y. Development of the genital ducts and external genitalia in the early human embryo. J Obstet Gynaecol Res. 2010;36:929–937. doi: 10.1111/j.1447-0756.2010.01272.x. [DOI] [PubMed] [Google Scholar]
- 39.Chen H, Ge RS, Zirkin BR. Leydig cells: from stem cells to aging. Mol Cell Endocrinol. 2009;306:9–16. doi: 10.1016/j.mce.2009.01.023. [DOI] [PMC free article] [PubMed] [Google Scholar]
- 40.Lai MS, Wang CY, Yang SH, Wu CC, Sun HS, Tsai SJ, Chuang JI, Chen YC, Huang BM. The expression profiles of fibroblast growth factor 9 and its receptors in developing mice testes. Organogenesis. 2016;12:61–77. doi: 10.1080/15476278.2016.1171448. [DOI] [PMC free article] [PubMed] [Google Scholar]
- 41.Mather JP. Establishment and characterization of two distinct mouse testicular epithelial cell lines. Biol Reprod. 1980;23:243–252. doi: 10.1095/biolreprod23.1.243. [DOI] [PubMed] [Google Scholar]
- 42.Lee W, Mason AJ, Schwall R, Szonyi E, Mather JP. Secretion of activin by interstitial cells in the testis. Science. 1989;243:396–398. doi: 10.1126/science.2492117. [DOI] [PubMed] [Google Scholar]
- 43.Geigerseder C, Doepner RF, Thalhammer A, Krieger A, Mayerhofer A. Stimulation of TM3 Leydig cell proliferation via GABA(A) receptors: a new role for testicular GABA. Reprod Biol Endocrinol. 2004;2:13. doi: 10.1186/1477-7827-2-13. [DOI] [PMC free article] [PubMed] [Google Scholar]
- 44.Dieckman LM, Freudenthal BD, Washington MT. PCNA structure and function: insights from structures of PCNA complexes and post-translationally modified PCNA. Subcell Biochem. 2012;62:281–299. doi: 10.1007/978-94-007-4572-8_15. [DOI] [PMC free article] [PubMed] [Google Scholar]
- 45.Manning BD, Cantley LC. AKT/PKB signaling: navigating downstream. Cell. 2007;129:1261–1274. doi: 10.1016/j.cell.2007.06.009. [DOI] [PMC free article] [PubMed] [Google Scholar]
- 46.Lei YY, Wang WJ, Mei JH, Wang CL. Mitogen-activated protein kinase signal transduction in solid tumors. Asian Pac J Cancer Prev. 2014;15:8539–8548. doi: 10.7314/apjcp.2014.15.20.8539. [DOI] [PubMed] [Google Scholar]
- 47.Piccolo S, Batlle E. Editorial overview: cell cycle, differentiation and disease. Curr Opin Cell Biol. 2014;31:v–vi. doi: 10.1016/j.ceb.2014.10.003. [DOI] [PubMed] [Google Scholar]
- 48.Goranov AI, Cook M, Ricicova M, Ben-Ari G, Gonzalez C, Hansen C, Tyers M, Amon A. The rate of cell growth is governed by cell cycle stage. Genes Dev. 2009;23:1408–1422. doi: 10.1101/gad.1777309. [DOI] [PMC free article] [PubMed] [Google Scholar]
- 49.Kaplon J, van Dam L, Peeper D. Two-way communication between the metabolic and cell cycle machineries: the molecular basis. Cell Cycle. 2015;14:2022–2032. doi: 10.1080/15384101.2015.1044172. [DOI] [PMC free article] [PubMed] [Google Scholar]
- 50.Nam EJ, Kim YT. Alteration of cell-cycle regulation in epithelial ovarian cancer. Int J Gynecol Cancer. 2008;18:1169–1182. doi: 10.1111/j.1525-1438.2008.01191.x. [DOI] [PubMed] [Google Scholar]
- 51.Meek DW. Regulation of the p53 response and its relationship to cancer. Biochem J. 2015;469:325–346. doi: 10.1042/BJ20150517. [DOI] [PubMed] [Google Scholar]
- 52.Nemajerova A, Talos F, Moll UM, Petrenko O. Rb function is required for E1A-induced S-phase checkpoint activation. Cell Death Differ. 2008;15:1440–1449. doi: 10.1038/cdd.2008.66. [DOI] [PubMed] [Google Scholar]
- 53.Renshaw MW, Price LS, Schwartz MA. Focal adhesion kinase mediates the integrin signaling requirement for growth factor activation of MAP kinase. J Cell Biol. 1999;147:611–618. doi: 10.1083/jcb.147.3.611. [DOI] [PMC free article] [PubMed] [Google Scholar]
- 54.Sadighbayan D, Sadighbayan K, Tohid-kia MR, Khosroushahi AY, Hasanzadeh M. Development of electrochemical biosensors for tumor marker determination towards cancer diagnosis: recent progress. Trends Analyt Chem. 2019;118:73–88. [Google Scholar]
- 55.Liu H, Xu Y, Xiang J, Long L, Green S, Yang Z, Zimdahl B, Lu J, Cheng N, Horan LH, Liu B, Yan S, Wang P, Diaz J, Jin L, Nakano Y, Morales JF, Zhang P, Liu LX, Staley BK, Priceman SJ, Brown CE, Forman SJ, Chan VW, Liu C. Targeting alpha-fetoprotein (AFP)-MHC complex with CAR T-Cell therapy for liver cancer. Clin Cancer Res. 2017;23:478–488. doi: 10.1158/1078-0432.CCR-16-1203. [DOI] [PubMed] [Google Scholar]
- 56.Milose JC, Filson CP, Weizer AZ, Hafez KS, Montgomery JS. Role of biochemical markers in testicular cancer: diagnosis, staging, and surveillance. Open Access J Urol. 2011;4:1–8. doi: 10.2147/OAJU.S15063. [DOI] [PMC free article] [PubMed] [Google Scholar]
- 57.Cheng L, Albers P, Berney DM, Feldman DR, Daugaard G, Gilligan T, Looijenga LHJ. Testicular cancer. Nat Rev Dis Primers. 2018;4:29. doi: 10.1038/s41572-018-0029-0. [DOI] [PubMed] [Google Scholar]
- 58.Kalavska K, Schmidtova S, Chovanec M, Mego M. Immunotherapy in testicular germ cell tumors. Front Oncol. 2020;10:573977. doi: 10.3389/fonc.2020.573977. [DOI] [PMC free article] [PubMed] [Google Scholar]
- 59.Lai MS, Cheng YS, Chen PR, Tsai SJ, Huang BM. Fibroblast growth factor 9 activates akt and MAPK pathways to stimulate steroidogenesis in mouse leydig cells. PLoS One. 2014;9:e90243. doi: 10.1371/journal.pone.0090243. [DOI] [PMC free article] [PubMed] [Google Scholar]
- 60.Chung JY, Kim JY, Kim YJ, Jung SJ, Park JE, Lee SG, Kim JT, Oh S, Lee CJ, Yoon YD, Yoo YH, Kim JM. Cellular defense mechanisms against benzo[a]pyrene in testicular Leydig cells: implications of p53, aryl-hydrocarbon receptor, and cytochrome P450 1A1 status. Endocrinology. 2007;148:6134–6144. doi: 10.1210/en.2007-0006. [DOI] [PubMed] [Google Scholar]
- 61.Tong X, Han X, Yu B, Yu M, Jiang G, Ji J, Dong S. Role of gap junction intercellular communication in testicular leydig cell apoptosis induced by oxaliplatin via the mitochondrial pathway. Oncol Rep. 2015;33:207–14. doi: 10.3892/or.2014.3571. [DOI] [PubMed] [Google Scholar]
- 62.Populo H, Lopes JM, Soares P. The mTOR signalling pathway in human cancer. Int J Mol Sci. 2012;13:1886–1918. doi: 10.3390/ijms13021886. [DOI] [PMC free article] [PubMed] [Google Scholar]
- 63.Moschetta M, Reale A, Marasco C, Vacca A, Carratu MR. Therapeutic targeting of the mTOR-signalling pathway in cancer: benefits and limitations. Br J Pharmacol. 2014;171:3801–3813. doi: 10.1111/bph.12749. [DOI] [PMC free article] [PubMed] [Google Scholar]
- 64.Ji J, Jia S, Jia Y, Ji K, Hargest R, Jiang WG. WISP-2 in human gastric cancer and its potential metastatic suppressor role in gastric cancer cells mediated by JNK and PLC-gamma pathways. Br J Cancer. 2015;113:921–933. doi: 10.1038/bjc.2015.285. [DOI] [PMC free article] [PubMed] [Google Scholar]
- 65.Li X, Liang Q, Liu W, Zhang N, Xu L, Zhang X, Zhang J, Sung JJ, Yu J. Ras association domain family member 10 suppresses gastric cancer growth by cooperating with GSTP1 to regulate JNK/c-Jun/AP-1 pathway. Oncogene. 2016;35:2453–2464. doi: 10.1038/onc.2015.300. [DOI] [PubMed] [Google Scholar]
- 66.Li YR, Jia YH, Che Q, Zhou Q, Wang K, Wan XP. AMF/PGI-mediated tumorigenesis through MAPK-ERK signaling in endometrial carcinoma. Oncotarget. 2015;6:26373–26387. doi: 10.18632/oncotarget.4708. [DOI] [PMC free article] [PubMed] [Google Scholar]
- 67.Wei L, Li Y, Suo Z. TSPAN8 promotes gastric cancer growth and metastasis via ERK MAPK pathway. Int J Clin Exp Med. 2015;8:8599–8607. [PMC free article] [PubMed] [Google Scholar]
- 68.Qin S, Zhou W, Liu S, Chen P, Wu H. Icariin stimulates the proliferation of rat bone mesenchymal stem cells via ERK and p38 MAPK signaling. Int J Clin Exp Med. 2015;8:7125–7133. [PMC free article] [PubMed] [Google Scholar]
- 69.Wang YG, Xu L, Wang T, Wei J, Meng WY, Wang N, Shi M. Givinostat inhibition of hepatic stellate cell proliferation and protein acetylation. World J Gastroenterol. 2015;21:8326–8339. doi: 10.3748/wjg.v21.i27.8326. [DOI] [PMC free article] [PubMed] [Google Scholar]
- 70.Lattanzio R, Piantelli M, Falasca M. Role of phospholipase C in cell invasion and metastasis. Adv Biol Regul. 2013;53:309–318. doi: 10.1016/j.jbior.2013.07.006. [DOI] [PubMed] [Google Scholar]
- 71.Cordon-Cardo C. Mutations of cell cycle regulators. Biological and clinical implications for human neoplasia. Am J Pathol. 1995;147:545–560. [PMC free article] [PubMed] [Google Scholar]
- 72.Cheng MG, Olivier P, Diehl JA, Fero M, Roussel MF, Roberts JM, Sherr CJ. The p21(Cip1) and p27(Kip1) CDK ‘inhibitors’ are essential activators of cyclin D-dependent kinases in murine fibroblasts. Embo Journal. 1999;18:1571–1583. doi: 10.1093/emboj/18.6.1571. [DOI] [PMC free article] [PubMed] [Google Scholar]
- 73.Alt JR, Gladden AB, Diehl JA. P21(Cip1) Promotes cyclin D1 nuclear accumulation via direct inhibition of nuclear export. J Biol Chem. 2002;277:8517–8523. doi: 10.1074/jbc.M108867200. [DOI] [PubMed] [Google Scholar]
- 74.Zhang H, Hannon GJ, Beach D. P21-containing cyclin kinases exist in both active and inactive states. Genes Dev. 1994;8:1750–1758. doi: 10.1101/gad.8.15.1750. [DOI] [PubMed] [Google Scholar]
- 75.Mendoza MC, Er EE, Blenis J. The Ras-ERK and PI3K-mTOR pathways: cross-talk and compensation. Trends Biochem Sci. 2011;36:320–328. doi: 10.1016/j.tibs.2011.03.006. [DOI] [PMC free article] [PubMed] [Google Scholar]
- 76.Aksamitiene E, Kiyatkin A, Kholodenko BN. Cross-talk between mitogenic Ras/MAPK and survival PI3K/Akt pathways: a fine balance. Biochem Soc Trans. 2012;40:139–146. doi: 10.1042/BST20110609. [DOI] [PubMed] [Google Scholar]
- 77.Hong CC, Kume T, Peterson RT. Role of crosstalk between phosphatidylinositol 3-kinase and extracellular signal-regulated kinase/mitogen-activated protein kinase pathways in artery-vein specification. Circ Res. 2008;103:573–579. doi: 10.1161/CIRCRESAHA.108.180745. [DOI] [PMC free article] [PubMed] [Google Scholar]
Associated Data
This section collects any data citations, data availability statements, or supplementary materials included in this article.