Abstract
Despite decrease in mortality caused by colorectal cancer (CRC), there remains no effective therapeutic method for patients with CRC. We attempted to screen biomarkers with therapeutic values in CRC. Proteomic analysis was performed on tumor, tumor-adjacent, and normal tissues derived from five patients with colon adenocarcinoma (COAD) via label-free proteome profiling. Differentially expressed proteins (DEPs) were identified, and functional annotation was performed based on the gene ontology (GO) and Kyoto Encyclopedia of Genes and Genomes (KEGG) databases. The effect of marker proteins on CRC was determined via cell function experiments and using tumor organoid models. The localization of the marker proteins was determined via immunofluorescence. A total of 126 DEPs were identified in COAD tissues compared with normal tissues, of which Peptide YY (PYY) overlapped among the tumor, adjacent, and normal groups. DEPs in the cancer group vs. normal group were enriched in the regulation of cell cycle checkpoint, developmental process, focal adhesion, and apoptosis-related pathways. The low expression of PYY in CRC tissues was verified via qRT-PCR, western blotting, and immunohistochemistry. Overexpression of PYY promoted apoptosis and inhibited the proliferation, migration, and invasion of HCT116 and HT29 cells. Furthermore, PYY was secreted by neurons and its supplementation suppressed tumor organoid growth in a dose-dependent manner. In conclusion, PYY exerted inhibitory action on CRC and could be a therapeutic target for CRC.
Keywords: Colorectal cancer, proteomic analysis, label-free proteome profiling, differentially expressed proteins, gain-of-function experiments
Introduction
Colorectal cancer (CRC), also known as colon cancer, is the third most common malignancy and second most common cause of cancer-related deaths [1]. It is estimated that in 2018 there were 1.09 million people newly diagnosed with CRC and 551,000 CRC-related deaths worldwide [2]. Colon adenocarcinoma (COAD) is the most common type of CRC and is characterized by high aggression and recurrence rate [3]. Recently, the prevalence of COAD is increasing [4]. Despite advances in treatment management, 50% of CRC cases undergo metastasis and recurrence, leading to a relatively poor prognosis [5]. CRC has increased the global clinical and economic burden; therefore, it is imperative to advance our understanding of CRC pathogenesis and discover novel biomarkers for CRC treatment.
The initiation and progression of cancers are multistep processes involving molecular alterations at different levels, including genetic and proteomic alterations [6]. In the past decades, increasing attention has been given to the genetic changes underlying colonic neoplasia development. Next-generation sequencing facilitates an understanding of the genetic characterization of CRCs [7]. Genetic mutations have been found to contribute to the development of CRC. Jauhri studied the genetic alterations in CRC through next-generation sequencing and reported that KDR, PTEN, FBXW7, and SMAD4 are the most frequently mutated genes in 112 CRC tumor samples, with a frequency of more than 10%; thus, could be considered as biomarkers for CRC [8]. Some studies have used transcriptomic data as potential CRC biomarkers. NEK2 is overexpressed in tumor tissues, which predicts poor prognosis of patients with CRC [9]. Downregulated miRNA let-7e has been shown to exert tumor-suppressive effects on CRC [10]. However, the use of these biomarkers is limited by their sensitivity and specificity.
Protein dysregulation plays a crucial role in cancer development [6]. The development of quantitative proteomics based on mass spectrometry (MS) technology provides attractive insights into the proteogenomic characterization of cancers, including CRC [11]. Recent advances in proteomics have facilitated the identification of proteins in cells and tissues, thereby contributing to biomarker discovery [12]. Several studies have screened for potential biomarkers for CRC via proteomics. Through liquid chromatography-mass tandem mass spectrometry (LC-MS/MS), Quesada-Calvo et al. suggested the differential expression of OLFM4 and KNG1 as biomarkers for the early stages of CRC [13]. Yu et al. examined 127 CRC samples and 90 healthy controls via MALDI-TOF proteomic analysis and identified MST1 as a biomarker with predictive performance for distant metastasis in CRC [14]. However, only a few biomarkers have been successfully translated into diagnostic markers and therapeutic targets in clinical practice.
Therefore, in the current study, we applied label-free proteomics to screen reliable biomarkers for CRC treatment and validated them in functional experiments for future applications in personalized treatment for CRC. By comparing the protein profiles of CRC tumor tissues and normal controls, 126 differentially expressed proteins were identified, of which peptide YY (PYY) was expressed at low levels in tumor tissues and may be a tumor suppressor protein in CRC.
Materials and methods
Tissue sampling
A total of 84 patients diagnosed with CRC were recruited from Nanfang Hospital, Southern Medical University, between January 2010 and December 2021 (cohort I). None of the patients presented with infectious diseases and received any treatment before surgery. Immunohistochemistry (IHC) was performed on the tumor tissues of all enrolled cases. In addition, tumor and normal tissues (>5 cm away from the tumor) collected from 14 patients with CRC (between June 2020 and July 2021, cohort II) were used for validation (qRT-PCR, western blot, and IHC). Tumor tissues, tumor-associated adjacent tissues, and normal tissues (>5 cm away from the tumor) collected from five patients with COAD (between June 2020 and July 2021, cohort III) were used for proteomic analysis. The clinical characteristics of the enrolled patients in the different cohorts are shown in Table 1. Approval was obtained from the Ethics Committee of the Nanfang Hospital, Southern Medical University. Human tissue-related studies were performed in compliance with the Declaration of Helsinki.
Table 1.
Clinical characteristics of patients with CRC in different cohorts
| Cohort I (n = 84) | Cohort II (n = 14) | Cohort III (n = 5) | |
|---|---|---|---|
| Gender | |||
| Male | 45 (53.6%) | 7 (50.0%) | 2 (40.0%) |
| Female | 39 (46.4%) | 7 (50.0%) | 3 (60.0%) |
| Median age (range) | |||
| <65 | 63 (75.0%) | 6 (42.9%) | 1 (20.0%) |
| ≥65 | 21 (25.0%) | 8 (57.1%) | 4 (80.0%) |
| T stage | |||
| T1 | 5 (6.0%) | 0 (0.0%) | 0 (0.0%) |
| T2 | 16 (19.0%) | 0 (0.0%) | 0 (0.0%) |
| T3 | 49 (58.3%) | 9 (64.3%) | 2 (40.0%) |
| T4 | 14 (16.7%) | 5 (35.7%) | 3 (60.0%) |
| N stage | |||
| N0 | 58 (69.0%) | 8 (57.1%) | 2 (40.0%) |
| N+ | 26 (31.0%) | 6 (42.9%) | 3 (60.0%) |
| M stage | |||
| M0 | 70 (83.3%) | 12 (85.7%) | 5 (100.0%) |
| M1 | 14 (16.7%) | 2 (14.3%) | 0 (0.0%) |
| Stage | |||
| I | 17 (20.2%) | 0 (0.0%) | 0 (0.0%) |
| II | 35 (41.7%) | 7 (50.0%) | 2 (40.0%) |
| III | 18 (21.4%) | 5 (35.7%) | 3 (60.0%) |
| IV | 14 (16.7%) | 2 (14.3%) | 0 (0.0%) |
| Location | |||
| Colon | 36 (42.9%) | 9 (64.3%) | 5 (100.0%) |
| Colon/Rectum | 48 (57.1%) | 5 (35.7%) | 0 (0.0%) |
Cohort 3 ⊆ Cohort 2 ⊆ Cohort 1.
Proteomic analysis
Tumor tissues, tumor-associated adjacent tissues, and normal tissues in cohort III (n = 5) were blocked and lysed with SDT buffer containing 4% SDS, 100 mM Tris-HCl, and 1 mM DTT, and subsequently subjected to protein extraction. After BCA kit analysis, eligible protein samples were digested with trypsin. Proteins (20 µg) from each sample were separated via SDS-PAGE (12.5% gel). The peptides were analyzed via LC-MS/MS using Q Exactive Mass Spectrometer (Thermo Scientific, Cambridge, MA, USA) in the positive ion mode. The raw MS data were searched against the human protein database, and protein identification and quantitation were performed using MaxQuant 1.5.3.17 software.
Bioinformatic and function enrichment analyses
Compared with normal colon tissues, the differentially expressed proteins (DEPs) in COAD tumor tissues and tumor-associated adjacent tissues were analyzed via one-sample t-test. DEPs were identified with a cutoff value of P<0.05 and log2 fold-change (FC) ≥1.5 or ≤2/3. The DEPs were subsequently annotated with gene ontology (GO) terms in the biological process (BP), cellular component (CC), and molecular function (MF) categories. GO enrichment was performed using GOATOOLS version 0.5.9. The Kyoto Encyclopedia of Genes and Genomes (KEGG) pathway closely related to the DEPs was identified using KOBAS version 3.0 [15]. Significant GO terms and pathways were mined at P<0.05.
qRT-PCR analysis
Total RNA was extracted from cohort II tissues and cells using TRIzol reagent (Invitrogen, Carlsbad, CA, USA). RNA quality was determined via spectrophotometric absorbance ratio of 260/280 nm, and cDNA was synthesized using a commercial reverse transcriptase kit (Takara, Shanghai, China). Real-time PCR analysis was performed using real-time PCR Kit (Solarbio, Beijing, China) according to the manufacturer’s protocols. The primers used for ABLIM2, SULT2B1, NPM1, SST, PYY, and CNTN1 are listed in Table 2.
Table 2.
The primer sequences used in qRT-PCR analysis
| Genes | Forward | Reverse |
|---|---|---|
| ABLIM2 | 5’-CGGAGGAAACAGGACAGATTAG-3’ | 5’-AACTGGGTAGGACCAGAGTTA-3’ |
| SULT2B1 | 5’-GTTGCCAGGTGAATACTTCCG-3’ | 5’-CCCGCACATCTTGGGTGTT-3’ |
| NPM1 | 5’-ACCATTTCCATGTCTGAGCACC-3’ | 5’-ATCAATTATGTGAAGAATTGATTAC-3’ |
| SST | 5’-CTCTGCATCGTCCTGGCTT-3’ | 5’-GGGGCCAGGAGTTAAGGAAG-3’ |
| PYY | 5’-ACGGTCGCAATGCTGCTAAT-3’ | 5’-AAGGGGAGGTTCTCGCTGTC-3’ |
| CNTN1 | 5’-GCCCATGACAAAGAAGAAGC-3’ | 5’-CGACATGATCCCAGGTGATT-3’ |
| GAPDH | 5’-ACTTTGTCAAGCTCATTTCC-3’ | 5’-TGCAGCGAACTTTATTGATG-3’ |
IHC
IHC was performed in the tumor tissues of cohort I and normal tissues of cohort II. Antibodies against PYY diluted at 1:800 (24294-1, Proteintech) were used, and the immune staining was visualized as previously described and quantitatively analyzed using QuantCenter software [16].
Cell culture and transfection
Human CRC cell lines, HCT116 and HT29, and a normal colorectal mucosa cell line, FHC (ATCC, Manassas, VA, USA), were used in the current study. The cells were cultured in McCoy’s 5A medium (Procell, Wuhan, China) supplemented with 10% FBS and 1% penicillin/streptomycin. Routine cell culture was performed at 37°C in a humidified incubator with 5% CO2.
Full-length PYY cDNA was obtained via PCR and inserted into the pcDNA vector. The recombinant vectors pcDNA-PYY and empty control (pcDNA-NC) were transfected into HCT116 and HT29 cells using Lipofectamine 2000 (Invitrogen) according to the manufacturer’s instructions.
Cell counting kit-8 (CCK-8) assay
After 48 h of transfection, the cell suspension (2 × 10⁴ cells/mL) was seeded into 96-well plates (100 µL/well). The cell viability assay was performed according to the instructions of a commercial CCK-8 assay kit (Abcam, China). The proliferation curve of the transfected cells was drawn based on the optical density (OD) values at 0, 24, 48, 72, and 96 h.
Cell apoptosis analysis
Cells were collected 48 h post-transfection, and cell suspensions were prepared. Cells (100 µL/well) were incubated with 5 µL AnnexinV-FITC at 4°C for 30 min in the dark. Subsequently, the rate of apoptosis was monitored via flow cytometry.
Wound healing assay
The scratch wound assay is a simple cell migration assay. In the present study, we performed a wound healing assay to monitor changes in the migration capability of CRC cells after pcDNA-PYY transfection. Cells (3 × 10⁵ cells/well) were seeded in a 6-well plate and maintained overnight to 90% confluence. The confluent monolayer of cells attached to the plate was scratched in a straight line using a pipette tip. After washing with PBS, the cells were maintained in a fresh serum-free medium for 24 h. The cell scratches at 0 and 24 h were captured, and the wound healing rate was calculated using the ImageJ software.
Cell invasion assay
We performed a transwell assay to detect the invasion capability of CRC cells post-transfection. Corning Transwell plates were used, in which the upper and lower chambers were separated by a polycarbonate membrane with 8.0 μm-diameter pores. The Matrigel-precoated upper compartments were supplemented with cells suspended in a serum-free medium. The complete medium containing 10% FBS was added to the lower compartments. After culturing for 24 h, cells were fixed and stained with 0.1% crystal violet. Invasive cells were counted under a microscope in five random fields.
Immunofluorescent staining
Consecutive sections of the tumor and normal tissues were prepared. The sections were dewaxed using xylene and rehydrated using graded concentrations of alcohol. For antigen retrieval, the sections were labeled with mouse anti-NEUN (1:500; Abcam), mouse anti-neurofilament (NF) (Abcam, 1:300), rabbit anti-Ki67 (Abcam, 1:1000), and rabbit anti-PYY (1:800; Proteintech) primary antibodies. Secondary antibodies against IgG (goat anti-mouse or goat anti-rabbit; Abcam, Cambridge, UK; 1:800) were subsequently used. Cells were counterstained using DAPI. Finally, immunolabeling images were captured under a fluorescence microscope (Olympus) equipped with a camera.
Western blot
Total protein was extracted from the tissue samples of cohort II through lysis using a RIPA buffer, and the protein concentration was measured using BCA Protein Assay Kit (Thermo Fisher Scientific, Waltham, MA, USA). Proteins were separated via 10% SDS-PAGE and transferred onto PVDF membranes. The membrane was blocked with 5% non-fat milk, incubated with anti-PYY (1:1000; Proteintech) for 12 h at 4°C, and further incubated with HRP-conjugated IgG (1:2000; Abcam) for 1 h at 25°C. After visualization using ECL Kit (Thermo Fisher Scientific), the blots were captured and analyzed using Gel Imaging System (Media Cybernetics, Silver Spring, MD, USA).
Human tumor organoid culture and treatment
Human CRC organoids were cultured as described previously [17]. The organoids derived from patients with CRC were plated in 96-well plates and maintained for 24 h. Organoid cultures were supplemented with 0, 1, and 2 μM PYY. On days 1, 4, and 8 post-PYY treatment, the surviving CRC organoids were observed and photographed under a microscope.
Statistical analysis
SPSS 19.0 and GraphPad Prism 8.0 were used for analyzing data expressed as mean ± standard deviation (SD) or number (percentage). The categorical data analysis was performed using the chi-square test. For the measurement data, differences between the two groups were estimated using a paired t-test. Statistical differences were considered significant at P<0.05.
Results
Identification of DEPs in COAD tissues
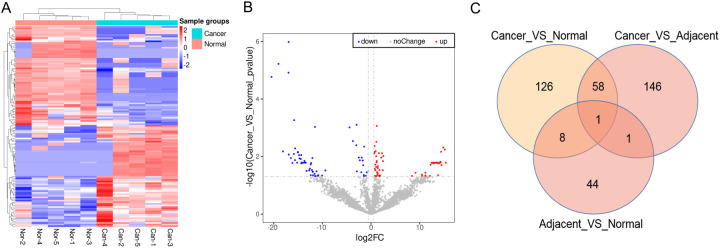
Based on proteomic analysis, 126 DEPs were identified in COAD tumor tissues, including 64 upregulated and 62 downregulated DEPs. The differential expression of DEPs clearly distinguished between COAD and normal tissues (Figure 1A). The distribution of DEPs based on p-values against FCs is shown in Figure 1B. Furthermore, we identified DEPs in tumor tissues vs. adjacent normal tissues and adjacent normal tissues vs. normal colon tissues. Results showed that there were 146 DEPs in the tumor vs. adjacent group and 44 in the adjacent vs. normal group. The Venn diagram illustrates that one DEP (PYY) overlaps among the three groups (Figure 1C). PYY was one of the top 10 downregulated proteins (log2FC = -18.12, P = 0.01) in COAD tumor tissues compared with normal tissues (Table 3). Thus, PYY was selected as the candidate biomarker for COAD.
Figure 1.
Differentially expressed proteins (DEPs) in normal and COAD tissues (N = 5). A. A heatmap of DEPs in normal and COAD tissues was visualized by Pheatmap package in R. B. A volcano plot of DEPs was visualized by ggplots2 software in R. C. A Venn image for the overlapped DEPs in cancer vs. normal, cancer vs. adjacent, and adjacent vs. normal.
Table 3.
Top 10 up-regulated and top 10 down-regulated DEPs between tumor and normal tissues
| PG. Genes | Descriptions | log2fc | P value | Adjacent_p adjust | Up/Down |
|---|---|---|---|---|---|
| CA9 | Carbonic anhydrase 9 | 15.38 | 0.02 | 0.88 | Up |
| NIT2 | Omega-amidase NIT2 | 15.17 | 0.01 | 0.88 | Up |
| MRPL1 | 39S ribosomal protein L1, mitochondrial | 14.87 | 0.00 | 0.88 | Up |
| PNO1 | RNA-binding protein PNO1 | 14.49 | 0.02 | 0.88 | Up |
| CCDC174 | Coiled-coil domain-containing protein 174 | 14.41 | 0.01 | 0.88 | Up |
| FABP5 | Fatty acid-binding protein 5 | 14.33 | 0.02 | 0.88 | Up |
| NPM1 | Nucleophosmin (Fragment) | 14.26 | 0.02 | 0.88 | Up |
| FKBP10 | Peptidyl-prolyl cis-trans isomerase FKBP10 | 14.16 | 0.02 | 0.88 | Up |
| XIAP | E3 ubiquitin-protein ligase XIAP | 13.96 | 0.02 | 0.88 | Up |
| DDX18 | ATP-dependent RNA helicase DDX18 | 13.95 | 0.02 | 0.88 | Up |
| SST | Somatostatin | -20.47 | 0.00 | 0.03 | Down |
| CDH19 | Cadherin-19 (Fragment); Cadherin-19; Cadherin-19 | -19.03 | 0.00 | 0.02 | Down |
| PYY | Peptide YY | -18.12 | 0.01 | 0.88 | Down |
| MYEF2 | Myelin expression factor 2, isoform CRA_b; Myelin expression factor 2 | -16.98 | 0.00 | 0.02 | Down |
| DCLK1 | Serine/threonine-protein kinase DCLK1 | -16.94 | 0.00 | 0.01 | Down |
| ASPN | Asporin | -16.92 | 0.01 | 0.88 | Down |
| MRPS36 | 28S ribosomal protein S36, mitochondrial | -16.48 | 0.01 | 0.88 | Down |
| GAL | Galanin peptides | -16.16 | 0.02 | 0.88 | Down |
| MUSTN1 | Musculoskeletal embryonic nuclear protein 1 | -15.87 | 0.01 | 0.88 | Down |
| CNTN1 | Contactin-1 | -15.82 | 0.00 | 0.65 | Down |
Functions and pathways involved with DEPs
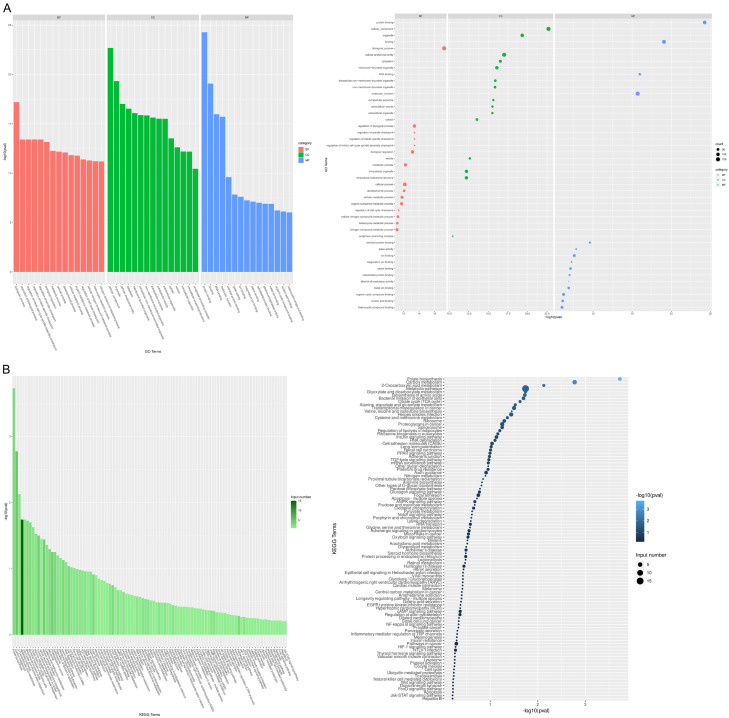
To dissect the biological functions of DEPs in COAD tumor tissues, function and pathway enrichment analyses were performed using the GO and KEGG databases. As depicted in Figure 2A, DEPs were annotated under the BP category with regulation of cell cycle checkpoint, developmental process, and metabolic process. Additionally, DEPs were closely related to focal adhesion, apoptosis, NF-kappa B signaling pathway, and Wnt signaling pathway (Figure 2B).
Figure 2.
Function enrichment analysis of DEPs in COAD tissues. A. Top 15 GO terms enriched by DEPs in biological process (BP), cellular component (CC) and molecular function (MF). Left, bar graph; right, bubble chart. B. KEGG pathways enriched by DEPs. Left, bar graph; right, bubble chart.
qRT-PCR validation of DEPs
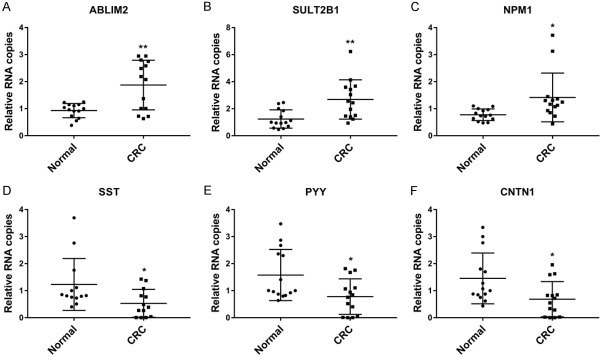
The differential expression of the DEPs of interest was determined in the tumor tissues via qRT-PCR analysis. Compared with normal tissues, ABLIM2, SULT2B1, and NPM1 were overexpressed in tumor tissues, while SST, PYY, and CNTN1 were de-expressed (all P<0.05, Figure 3).
Figure 3.
The expression of candidate proteins in CRC tissues (N = 14). The mRNA expression of ABLIM2 (A), SULT2B1 (B), NPM1 (C), SST (D), PYY (E), and CNTN1 (F) in normal and tumor tissues were measured by qRT-PCR. *P<0.05, **P<0.01 compared with normal controls.
Correlation between PYY expression and clinical characteristics
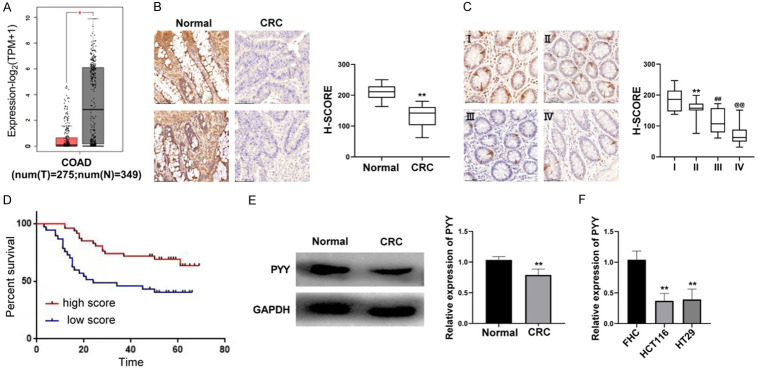
To explore the clinical significance of PYY in CRC, we determined the expression profile of PYY in CRC tumor tissues. Using the Gene Expression Profiling Interactive Analysis (GEPIA) database (http://gepia.cancer-pku.cn/), the expression level of PYY was found to be significantly lower in tumor tissues than in normal controls (P<0.05, Figure 4A). Both western blotting and IHC revealed a significantly lower protein expression of PYY in tumor tissues than in normal controls (P<0.01, Figure 4B and 4E). IHC also showed a downward trend in PYY expression in tumor tissues with increasing stage (P<0.01, Figure 4C). Based on the median PYY score, 84 CRC patients were divided into high- and low-expression groups. As shown in Table 4, PYY expression was correlated with TNM and AJCC cancer stages (all P<0.05). Survival analysis indicated that patients with high PYY scores had longer survival times than those with low scores (Figure 4D). Furthermore, there was significantly lower mRNA expression of PYY in CRC cell lines (HCT116 and HT29) than in a normal human colorectal mucosa cell line (FHC) (P<0.01, Figure 4F).
Figure 4.
Identification of low expression of PYY in CRC patients. A. The expression of PYY in normal and tumor tissues was determined by GEPIA analysis. B. The protein expression of PYY in normal and tumor tissues was detected by IHC (N = 14). **P<0.01 compared with normal controls. C. The protein expression of PYY in tumor tissues at different stages was detected by IHC (N = 84). **P<0.01 compared with stage I; ##P<0.01 compared with stage II; @@P<0.01 compared with stage III. D. Survival curves of patients with high and low PYY score. E. The protein expression of PYY in normal and tumor tissues was detected by Western blot (N = 14). **P<0.01 compared with normal controls. F. The mRNA expression of PYY in CRC cell lines (HCT116 and HT29) and a normal human colorectal mucosa cell line (FHC) was detected by qRT-PCR. **P<0.01 compared with FHC cells.
Table 4.
Correlations between PYY expression with clinical characteristics of 84 patients with CRC
| No. Patient, % | Score high | Score low | P value |
|---|---|---|---|
| Gender | 0.337 | ||
| Male | 23 (49%) | 22 (59.4%) | |
| Female | 24 (51%) | 15 (40.6%) | |
| Age (years) | 0.526 | ||
| <65 | 34 (72.3%) | 29 (78.4%) | |
| ≥65 | 13 (27.7%) | 8 (21.6%) | |
| T stage | 0.036 | ||
| T1 | 3 (6.4%) | 2 (5.4%) | |
| T2 | 9 (19.1%) | 7 (19%) | |
| T3 | 32 (68.1%) | 17 (45.9%) | |
| T4 | 3 (6.4%) | 11 (29.7%) | |
| N stage | 0.008 | ||
| N0 | 38 (80.8%) | 20 (54%) | |
| N+ | 9 (19.2%) | 17 (46%) | |
| M stage | 0.001 | ||
| M0 | 45 (95.7) | 25 (67.5%) | |
| M1 | 2 (4.3%) | 12 (32.5%) | |
| Location | 0.341 | ||
| Colon | 18 (38.2%) | 18 (48.6%) | |
| Colon/Rectum | 29 (61.8%) | 19 (51.4%) | |
| AJCC cancer stage | <0.001 | ||
| I | 11 (23.4%) | 6 (16.2%) | |
| II | 27 (57.4%) | 8 (21.6%) | |
| III | 7 (14.9%) | 11 (29.7%) | |
| IV | 2 (4.3%) | 12 (32.4%) |
PYY overexpression repressed proliferation and promoted apoptosis of CRC cells
To determine the function of PYY in CRC cell lines, HCT116 and HT29 cells were transfected with the pcDNA-PYY vector. Cells without treatment were used as blank controls. PYY overexpression significantly inhibited the viability of both HCT116 and HT29 cells (P<0.01, Figure 5A). In addition, the apoptosis rate of CRC cells was significantly higher in pcDNA-PYY-transfected cells than in the controls (P<0.01, Figure 5B). These results suggest that PYY overexpression reduces cell proliferation and accelerates cell apoptosis in CRC in vitro.
Figure 5.
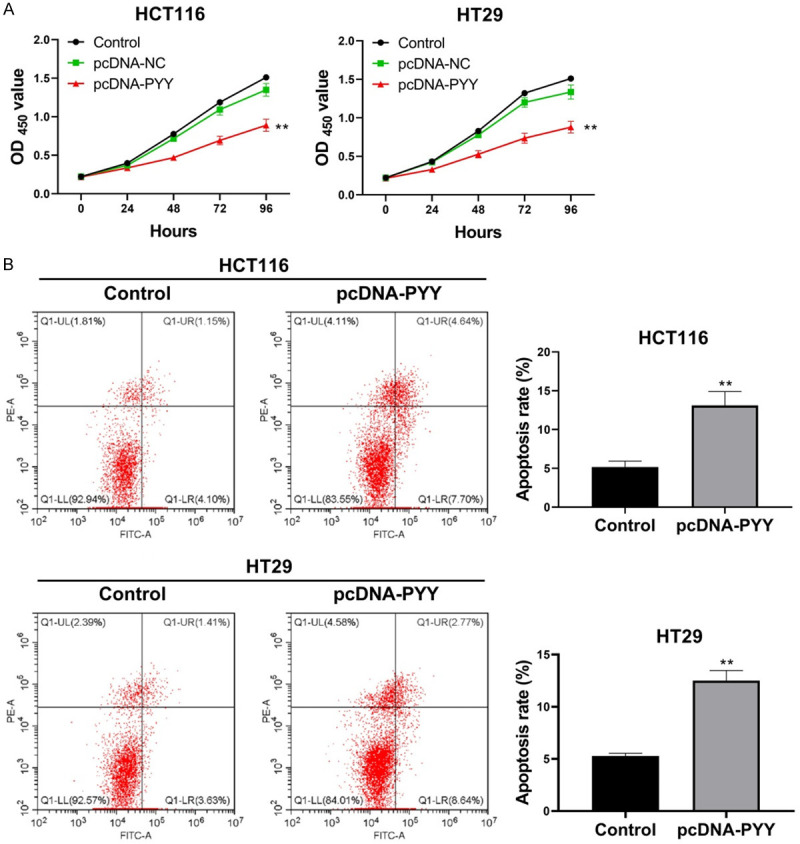
Effects of PYY overexpression on cell proliferation and apoptosis. HCT116 and HT29 cells were transfected with pcDNA-PYY and pcDNA-NC for 48 h. A. The viability of HCT116 and HT29 cells was detected by CCK-8 assay. B. The apoptosis of HCT116 and HT29 cells was detected by Flow cytometry. **P<0.01 compared with normal controls.
PYY overexpression inhibited the migration and invasion of CRC cells
The impact of PYY overexpression on the migration and invasion ability of CRC cells was evaluated via wound healing and transwell invasion assays. As shown in Figure 6A, the wound healing rates of HCT116 and HT29 cells were significantly reduced after pcDNA-PYY transfection (P<0.01). Meanwhile, the number of invasive cells was significantly decreased in comparison with that in the controls (P<0.01, Figure 6B).
Figure 6.
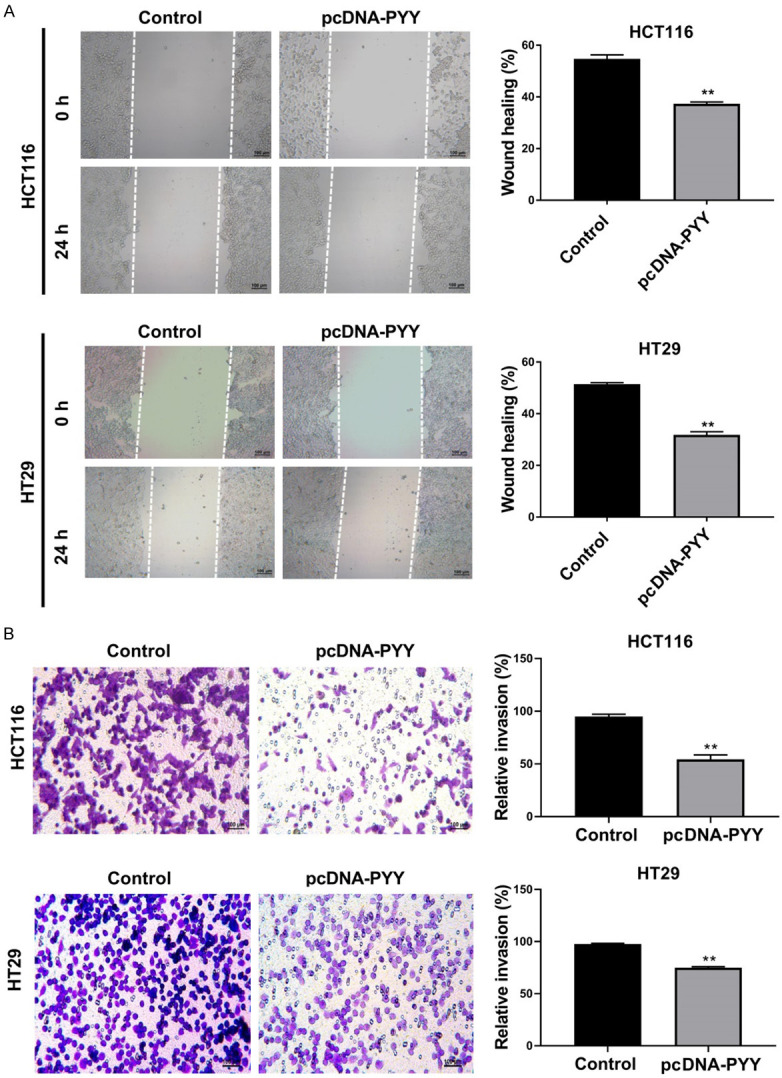
Effects of PYY overexpression on cell migration and invasion. HCT116 and HT29 cells were transfected with pcDNA-PYY and pcDNA-NC for 48 h. A. The migration of HCT116 and HT29 cells was detected by wound healing assay. B. The invasion of HCT116 and HT29 cells was detected by transwell assay. **P<0.01 compared with control group.
Colocalization of PYY and neurons
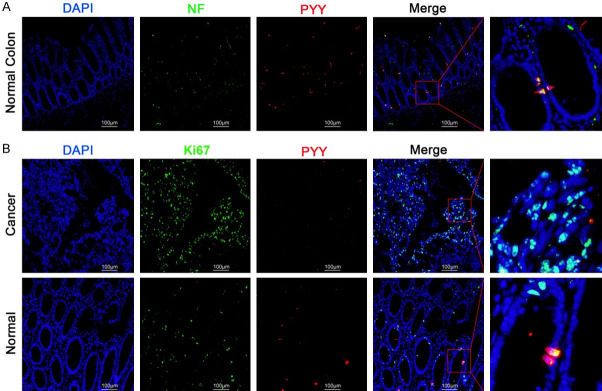
Neurofilaments (NFs) are markers of the nerve cell cytoskeleton while NEUN is expressed in mature neurons [18]. Double staining of NF or NEUN (green) with PYY (red) in normal colon tissues demonstrated the colocalization of neurons with PYY, indicating that PYY was secreted from neurons (Figure 7A). Moreover, Ki67 is a marker for cell proliferation [19]. NF/NEUN and PYY were stained in tumor tissues and paired normal tissues via immunofluorescence. Figure 7B illustrates that Ki67 was strongly labeled in tumor tissues, but PYY staining was not detected. In normal colon tissues, specific colocalization of Ki-67 and PYY was detected. Conclusively, neuron-secreted PYY elicited inhibitory effects on cell proliferation in CRC.
Figure 7.
Immunofluorescence staining of PYY combined with Neurofilament (NF) or Ki67. A. The localization of PYY and NF in normal colon tissues. B. The localization of PYY and Ki67 in normal and tumor tissues.
PYY treatment inhibited tumor organoid growth in CRC
A tumor organoid model was constructed to detect the therapeutic action of PYY in CRC. As shown in Figure 8, the organoids formed and grew over time in the 8-day time course. PYY supplementation hampered the growth of organoids and decreased their area in a dose-dependent manner (P<0.01). Thus, PYY treatment inhibited tumor growth in vitro.
Figure 8.
Effect of PYY treatment on the growth of CRC organoids. CRC organoids were treated with PYY at 0, 1, and 2 μM for 1, 4, and 8 days, respectively. **P<0.01 compared with 0 μM; ##P<0.01 compared with 1 μM.
Discussion
CRC remains a lethal disease characterized by high morbidity and mortality. Currently, there is no cure for CRC. The prognosis of patients with CRC remains relatively poor, particularly because of its aggressive and recurrent features. The identification of biomarkers for CRC provides an attractive approach to understand the pathogenesis of CRC. However, protein biomarkers for the prognosis and treatment of CRC are yet to be fully determined. Our study focused on the proteomic profile of five groups of tumor tissues, normal colon tissues, and tumor-associated adjacent tissues via label-free proteomics. The results of this study are expected to improve our understanding of CRC pathogenesis and provide a therapeutic target.
Our data showed that 126 DEPs were screened between tumor and normal colon tissues derived from five patients with COAD. The DEPs with the highest fold change and lowest p-values were suggested to exert therapeutic and predictive potentials for CRC. In our analyses, CA9 (carbonic anhydrase 9) was the most significantly upregulated protein with the highest fold change in COAD tissues compared with normal tissues. As previously described, CA9 is involved in the metastasis and prognosis of various cancers, such as non-small cell lung cancer [20] and oral tongue squamous cell carcinoma [21]. CA9 has been proposed as a therapeutic target for urothelial carcinoma [22]. Additionally, somatostatin (SST) was identified as one of the most significantly downregulated proteins in CRC tissues in the present study, which has been reported to exert tumor-inhibitory effects on the growth of breast cancer [23]. SST is considered a theranostic target in pan-cancer [24]. Collectively, the DEPs screened in our analyses play crucial roles in CRC development and progression.
Interestingly, PYY was identified as one of the most notable DEPs in COAD tumor tissues compared with normal tissues and was the only protein that overlapped with DEPs in tumor group vs. adjacent group and adjacent group vs. normal group. Consistently, a recent integrated bioinformatic analysis indicated that PYY is a core gene in CRC [25]. PYY is comprised of 36 amino acids and serves as a gastrointestinal hormone. Previous evidence suggests that PYY is widely distributed in the gastrointestinal tract and exerts hormonal regulatory action in the upper digestive tract, which raises the possibility of a regulatory role for PYY in cell growth [26]. Previous studies have verified the lower expression of PYY in polyps and tumor tissues than in controls [27,28]. Our data indicated that CRC tumor tissues exhibited lower PYY expression than normal colon tissues, which concurs with the aforementioned evidence. Poor PYY expression has been postulated to be strongly associated with COAD development. However, the exact mechanism of PYY in CRC has not yet been elucidated. The use of serum PYY as a biomarker for CRC warrants further studies.
With regard to the regulatory role of PYY in cell growth, low expression of PYY is strongly associated with the dysregulation of cell growth in cancers. Alosi et al. suggested that PYY exerted inhibitory action on the growth of pancreatic, breast, and esophagus cancer in vitro [29]. In addition, functional enrichment in our study showed that DEPs enriched in BP were mainly responsible for the regulation of cell cycle checkpoint and developmental processes. DEPs were significantly enriched in focal adhesion- and apoptosis-related pathways. Thus, in the present study, we unveiled the role of PYY in cell proliferation, apoptosis, and metastasis of CRC cells via gain-of-function experiments. Our data revealed that exogenous PYY suppressed cell proliferation and metastasis and enhanced apoptosis of CRC cells. Based on tumor organoid models, PYY inhibits CRC growth in vitro in a dose-dependent manner. As per previous studies, PYY treatment elicited an inhibitory effect on the proliferation of breast cancer [30], pancreatic adenocarcinoma, and CRC cells (HCT116 and CaCo-2) [31]. These results indicate that PYY exhibits an antitumor effect on CRC.
In conclusion, we performed a systemic proteomic analysis of tumor tissues, normal tissues, and tumor-associated adjacent normal tissues derived from patients with COAD. In particular, PYY was identified as the only DEP that overlapped in the cancer vs. normal, cancer vs. adjacent, and adjacent vs. normal groups. PYY was poorly expressed in CRC tumor tissues compared with that in normal controls. Overexpression of PYY inhibits the proliferation and metastasis of CRC cells. In addition, PYY treatment suppressed CRC tumor organoid growth in a dose-dependent manner. Our study suggests that PYY is a promising target for CRC and could offer guidance for future studies on personalized CRC treatment.
Acknowledgements
We thank Dr. Chaohu Wang (Faculty of The Department of Neurosurgery, Nanfang Hospital, Southern Medical University, Guangzhou, China) for guiding experiment in this paper. This work was supported by grants from President Foundation of Nanfang Hospital, Southern Medical University (2020B017), Natural Science Foundation of Guangdong Province (2020A1515010141), The Guangdong Provincial Key Laboratory of Precision Medicine for Gastrointestinal Cancer (2020B121201004), and the Guangdong Provincial Major Talents Project (No. 2019JC05Y361).
Disclosure of conflict of interest
None.
References
- 1.Baidoun F, Elshiwy K, Elkeraie Y, Merjaneh Z, Khoudari G, Sarmini MT, Gad M, Al-Husseini M, Saad A. Colorectal cancer epidemiology: recent trends and impact on outcomes. Curr Drug Targets. 2021;22:998–1009. doi: 10.2174/1389450121999201117115717. [DOI] [PubMed] [Google Scholar]
- 2.Bray F, Ferlay J, Soerjomataram I, Siegel RL, Torre LA, Jemal A. Global cancer statistics 2018: GLOBOCAN estimates of incidence and mortality worldwide for 36 cancers in 185 countries. CA Cancer J Clin. 2018;68:394–424. doi: 10.3322/caac.21492. [DOI] [PubMed] [Google Scholar]
- 3.Chang K, Yuan C, Liu X. A new RBPs-related signature predicts the prognosis of colon adenocarcinoma patients. Front Oncol. 2021;11:627504. doi: 10.3389/fonc.2021.627504. [DOI] [PMC free article] [PubMed] [Google Scholar]
- 4.Jiang H, Du J, Gu J, Jin L, Pu Y, Fei B. A 65-gene signature for prognostic prediction in colon adenocarcinoma. Int J Mol Med. 2018;41:2021–2027. doi: 10.3892/ijmm.2018.3401. [DOI] [PMC free article] [PubMed] [Google Scholar]
- 5.He Z, Yu L, Luo S, Li M, Li J, Li Q, Sun Y, Wang C. MiR-296 inhibits the metastasis and epithelial-mesenchymal transition of colorectal cancer by targeting S100A4. BMC Cancer. 2017;17:140. doi: 10.1186/s12885-017-3121-z. [DOI] [PMC free article] [PubMed] [Google Scholar]
- 6.Chakraborty S, Hosen MI, Ahmed M, Shekhar HU. Onco-multi-OMICS approach: a new frontier in cancer research. Biomed Res Int. 2018;2018:9836256. doi: 10.1155/2018/9836256. [DOI] [PMC free article] [PubMed] [Google Scholar]
- 7.Hong SN. Genetic and epigenetic alterations of colorectal cancer. Intest Res. 2018;16:327–337. doi: 10.5217/ir.2018.16.3.327. [DOI] [PMC free article] [PubMed] [Google Scholar]
- 8.Jauhri M, Bhatnagar A, Gupta S, Shokeen Y, Minhas S, Aggarwal S. Targeted molecular profiling of rare genetic alterations in colorectal cancer using next-generation sequencing. Med Oncol. 2016;33:106. doi: 10.1007/s12032-016-0820-2. [DOI] [PubMed] [Google Scholar]
- 9.Takahashi Y, Iwaya T, Sawada G, Kurashige J, Matsumura T, Uchi R, Ueo H, Takano Y, Eguchi H, Sudo T, Sugimachi K, Yamamoto H, Doki Y, Mori M, Mimori K. Up-regulation of NEK2 by microRNA-128 methylation is associated with poor prognosis in colorectal cancer. Ann Surg Oncol. 2014;21:205–212. doi: 10.1245/s10434-013-3264-3. [DOI] [PubMed] [Google Scholar]
- 10.Li Z, Pan W, Shen Y, Chen Z, Zhang L, Zhang Y, Luo Q, Ying X. IGF1/IGF1R and microRNA let-7e down-regulate each other and modulate proliferation and migration of colorectal cancer cells. Cell Cycle. 2018;17:1212–1219. doi: 10.1080/15384101.2018.1469873. [DOI] [PMC free article] [PubMed] [Google Scholar]
- 11.Zhang B, Wang J, Wang X, Zhu J, Liu Q, Shi Z, Chambers MC, Zimmerman LJ, Shaddox KF, Kim S, Davies SR, Wang S, Wang P, Kinsinger CR, Rivers RC, Rodriguez H, Townsend RR, Ellis MJ, Carr SA, Tabb DL, Coffey RJ, Slebos RJ, Liebler DC NCI CPTAC. Proteogenomic characterization of human colon and rectal cancer. Nature. 2014;513:382–387. doi: 10.1038/nature13438. [DOI] [PMC free article] [PubMed] [Google Scholar]
- 12.Fan NJ, Gao JL, Liu Y, Song W, Zhang ZY, Gao CF. Label-free quantitative mass spectrometry reveals a panel of differentially expressed proteins in colorectal cancer. Biomed Res Int. 2015;2015:365068. doi: 10.1155/2015/365068. [DOI] [PMC free article] [PubMed] [Google Scholar] [Retracted]
- 13.Quesada-Calvo F, Massot C, Bertrand V, Longuespée R, Blétard N, Somja J, Mazzucchelli G, Smargiasso N, Baiwir D, De Pauw-Gillet MC, Delvenne P, Malaise M, Coimbra Marques C, Polus M, De Pauw E, Meuwis MA, Louis E. OLFM4, KNG1 and Sec24C identified by proteomics and immunohistochemistry as potential markers of early colorectal cancer stages. Clin Proteomics. 2017;14:9. doi: 10.1186/s12014-017-9143-3. [DOI] [PMC free article] [PubMed] [Google Scholar]
- 14.Yu J, Zhai X, Li X, Zhong C, Guo C, Yang F, Yuan Y, Zheng S. Identification of MST1 as a potential early detection biomarker for colorectal cancer through a proteomic approach. Sci Rep. 2017;7:14265. doi: 10.1038/s41598-017-14539-x. [DOI] [PMC free article] [PubMed] [Google Scholar]
- 15.Liu Z, Zhang R, Chen X, Yao P, Yan T, Liu W, Yao J, Sokhatskii A, Gareev I, Zhao S. Identification of hub genes and small-molecule compounds related to intracerebral hemorrhage with bioinformatics analysis. PeerJ. 2019;7:e7782. doi: 10.7717/peerj.7782. [DOI] [PMC free article] [PubMed] [Google Scholar]
- 16.Song Y, Wang J, Sun J, Chen X, Shi J, Wu Z, Yu D, Zhang F, Wang Z. Screening of potential biomarkers for gastric cancer with diagnostic value using label-free global proteome analysis. Genomics Proteomics Bioinformatics. 2020;18:679–695. doi: 10.1016/j.gpb.2020.06.012. [DOI] [PMC free article] [PubMed] [Google Scholar]
- 17.Boretto M, Maenhoudt N, Luo X, Hennes A, Boeckx B, Bui B, Heremans R, Perneel L, Kobayashi H, Van Zundert I, Brems H, Cox B, Ferrante M, Uji-I H, Koh KP, D’Hooghe T, Vanhie A, Vergote I, Meuleman C, Tomassetti C, Lambrechts D, Vriens J, Timmerman D, Vankelecom H. Patient-derived organoids from endometrial disease capture clinical heterogeneity and are amenable to drug screening. Nat Cell Biol. 2019;21:1041–1051. doi: 10.1038/s41556-019-0360-z. [DOI] [PubMed] [Google Scholar]
- 18.Gusel’Nikova VV, Korzhevskiy DE. NeuN as a neuronal nuclear antigen and neuron differentiation marker. Acta Naturae. 2015;7:42–47. [PMC free article] [PubMed] [Google Scholar]
- 19.Polley MY, Leung SC, McShane LM, Gao D, Hugh JC, Mastropasqua MG, Viale G, Zabaglo LA, Penault-Llorca F, Bartlett JM, Gown AM, Symmans WF, Piper T, Mehl E, Enos RA, Hayes DF, Dowsett M, Nielsen TO International Ki67 in Breast Cancer Working Group of the Breast International Group and North American Breast Cancer Group. An international Ki67 reproducibility study. J Natl Cancer Inst. 2013;105:1897–1906. doi: 10.1093/jnci/djt306. [DOI] [PMC free article] [PubMed] [Google Scholar]
- 20.Giatromanolaki A, Harris AL, Banham AH, Contrafouris CA, Koukourakis MI. Carbonic anhydrase 9 (CA9) expression in non-small-cell lung cancer: correlation with regulatory FOXP3+ T-cell tumour stroma infiltration. Br J Cancer. 2020;122:1205–1210. doi: 10.1038/s41416-020-0756-3. [DOI] [PMC free article] [PubMed] [Google Scholar]
- 21.Wang S, Fu Z, Wang Y, Sun Y, Cui L, Wang C, Liu Q, Shao D, Wang Y, Wen N. Correlation of carbonic anhydrase 9 (CA9) with pathological T-stage and prognosis in patients with oral tongue squamous cell carcinoma. Ann Transl Med. 2020;8:1521. doi: 10.21037/atm-20-7144. [DOI] [PMC free article] [PubMed] [Google Scholar]
- 22.Todenhöfer T, Gibb EA, Seiler R, Kamyabi A, Hennenlotter J, McDonald P, Moskalev I, Stewart C, Gao J, Fazli L, Dedhar S, Stenzl A, Oo HZ, Black PC. Evaluation of carbonic anhydrase IX as a potential therapeutic target in urothelial carcinoma. Urol Oncol. 2021;39:498.e1–498.e11. doi: 10.1016/j.urolonc.2021.04.011. [DOI] [PubMed] [Google Scholar]
- 23.Hanikoglu A, Kucuksayan E, Hanikoglu F, Ozben T, Menounou G, Sansone A, Chatgilialoglu C, Di Bella G, Ferreri C. Effects of somatostatin and vitamin C on the fatty acid profile of breast cancer cell membranes. Anticancer Agents Med Chem. 2019;19:1899–1909. doi: 10.2174/1871520619666190930130732. [DOI] [PubMed] [Google Scholar]
- 24.Lee H, Suh M, Choi H, Ha S, Paeng JC, Cheon GJ, Kang KW, Lee DS. A pan-cancer analysis of the clinical and genetic portraits of somatostatin receptor expressing tumor as a potential target of peptide receptor imaging and therapy. EJNMMI Res. 2020;10:42. doi: 10.1186/s13550-020-00632-2. [DOI] [PMC free article] [PubMed] [Google Scholar]
- 25.Xu H, Ma Y, Zhang J, Gu J, Jing X, Lu S, Fu S, Huo J. Identification and verification of core genes in colorectal cancer. Biomed Res Int. 2020;2020:8082697. doi: 10.1155/2020/8082697. [DOI] [PMC free article] [PubMed] [Google Scholar]
- 26.Tseng WW, Liu CD. Peptide YY and cancer: current findings and potential clinical applications. Peptides. 2002;23:389–395. doi: 10.1016/s0196-9781(01)00616-7. [DOI] [PubMed] [Google Scholar]
- 27.Calam J, Ghatei MA, Domin J, Adrian TE, Myszor M, Gupta S, Tait C, Bloom SR. Regional differences in concentrations of regulatory peptides in human colon mucosal biopsy. Dig Dis Sci. 1989;34:1193–1198. doi: 10.1007/BF01537267. [DOI] [PubMed] [Google Scholar]
- 28.Tari A, Miyachi Y, Sumii K, Kajiyama G, Miyoshi A. Peptide YY-like immunoreactivity in normal colon mucosa, muscle layer and adenocarcinoma. Jpn J Med. 1987;26:184–188. doi: 10.2169/internalmedicine1962.26.184. [DOI] [PubMed] [Google Scholar]
- 29.Alosi JA, McFadden DW. Peptide YY mediates inhibition of tumor growth and inflammation. Methods Mol Biol. 2009;512:377–394. doi: 10.1007/978-1-60327-530-9_22. [DOI] [PubMed] [Google Scholar]
- 30.Grisé KR, Rongione AJ, Laird EC, McFadden DW. Peptide YY inhibits growth of human breast cancer in vitro and in vivo. J Surg Res. 1999;82:151–155. doi: 10.1006/jsre.1998.5528. [DOI] [PubMed] [Google Scholar]
- 31.Kling K, Kim F, Cole M, McFadden D. B-cell leukemia protein-2 and peptide YY chemotherapy resistance in colon cancer. Am J Surg. 1999;178:411–414. doi: 10.1016/s0002-9610(99)00209-3. [DOI] [PubMed] [Google Scholar]


