Abstract
Objective: Sarcopenia is a geriatric disease characterized by accelerated skeletal muscle mass and function loss due to aging. Cell death plays a pivotal role in the onset and progress of sarcopenia. The purpose of this study was to investigate the role of cuproptosis-related genes (CRGs) and immune infiltration in sarcopenia development. Methods: Three microarray expression datasets from the Gene Expression Omnibus (GEO) database were merged and batch-corrected by R software to identify differentially expressed genes (DEGs) between old and young skeletal muscles. Subsequently, DEGs were subjected to functional enrichment and gene set enrichment analysis (GSEA) to investigate the roles of DEGs and immune infiltration in the pathogenesis of musculoskeletal aging. Then, ssGSEA was performed to calculate the proportion of immune cells and functions within each muscle sample to analyze the differences between the older and young healthy muscle groups. In order to select candidate CRGs, the correlation between CRGs and immune infiltration was analyzed. Finally, a novel nomogram model of musculoskeletal aging was constructed based on candidate CRGs associated with immunity. Additionally, the diagnostic model based on key CRGs was tested using a validation dataset, and its diagnostic performance was evaluated by the area under curve (AUC) value. Results: 141 DEGs were identified between 45 older samples and 50 young healthy samples. Compared to young healthy muscle tissues, significantly lower infiltration levels of T-regulatory cells were identified in older muscle tissues, while dendritic cells (DCs) and mast cells were relatively higher. Based on the CRGs from seven candidates, a novel model with high prediction efficiency (AUC = 0.856) was established to diagnose and screen for sarcopenia. Conclusion: The CRGs associated with immunity may play a vital role in the development of musculoskeletal aging, providing a novel avenue for early diagnosis. Furthermore, immune cell infiltration is essential for the progression of musculoskeletal aging.
Keywords: Sarcopenia, musculoskeletal aging, cuproptosis, immune infiltration, nomogram model
Introduction
The growth in the aging population has caused much discussion about the impact of aging on public health. Sarcopenia, also known as muscle attenuation syndrome, is a progressive, systemic skeletal muscle disorder characterized by age-related musculoskeletal decline [1]. Sarcopenia was defined by Rosenberg in 1989 as a loss of muscle mass, derived from the Greek words Sarx (meat) and Penia (loss), after comparing lean mass in the thighs of older and younger women [2]. Loss of skeletal muscle function is unavoidable in the normal aging process and increases the risk of falls, fractures, disability, and even death. According to a recent study, the prevalence of sarcopenia among hospitalized men and women in China was 12.9% and 11.2%, respectively. In contrast, the prevalence in nursing homes was 26.3% and 33.7%, respectively [3]. Despite the high incidence of sarcopenia, researchers have begun only to recognize its importance in recent years. Sarcopenia was defined as a disease in 2016, according to the 10th edition of the International Statistical Classification of Diseases and Related Health Problems, bearing the code M62.84 [4].
Due to the high prevalence of sarcopenia, numerous studies on the pathophysiology of musculoskeletal aging have been performed. Mild inflammation and apoptosis may be in-volved in the pathogenesis of musculoskeletal aging. Under normal circumstances, immune cells infiltrate skeletal muscle, eliminate necrotic and apoptotic cells in muscle tissue, and secrete growth factors necessary for satellite cell proliferation and differentiation [5]. However, high levels of pro-inflammatory mediators are considered to be one of the diagnostic hallmarks of musculoskeletal aging as chronic inflammatory responses increase with age [6]. Therefore, musculoskeletal aging is associated with immunosenescence caused by pro-inflammatory cytokines and oxidative stress, promoting immune cell infiltration into damaged muscles [7]. Immunosenescence refers to the agerelated disruption and decline of immune system function, which is a major contributor to the pathogenesis of musculoskeletal aging [8]. Moreover, the imbalance of apoptosis and regeneration is believed to be one of the molecular mechanisms of musculoskeletal aging [9]. Furthermore, mitochondria that induce apoptosis by releasing apoptosis-inducing factors and endonuclease G are involved in the endogenous apoptotic pathway [10], and mitochondrial dysfunction may participate in promoting musculoskeletal aging [11]. According to a new study published in Science, cuproptosis refers to a unique type of cell death caused by intracellular copper buildup that leads to the accumulation of lipidated mitochondrial proteins and the destabilization of iron-sulfur cluster proteins [12]. However, the link between cuproptosis and musculoskeletal aging remains unelucidated. Based on the above findings, we speculate that oxidative stress caused by immune dysfunction and intracellular copper load accumulation leads to mitochondrial dysfunction, a critical factor in the pathogenesis of age-related sarcopenia.
In recent years, microarray technology has been widely used in genetic engineering to identify new biomarkers and their roles in various diseases and possible treatments. Nonetheless, finding the signature genes of sarcopenia through microarray gene expression data remains a major challenge in developing predictive diagnostic models. Furthermore, a predictive model based on the signature of cuproptosis-related genes (CRGs) in musculoskeletal aging is currently unavailable. Therefore, based on the CRGs associated with immunity, a novel diagnostic nomogram model for musculoskeletal aging was constructed using microarray gene expression data from the Gene Expression Omnibus (GEO) database.
Materials and methods
Research design
Three microarray expression datasets (GSE8479, GSE1428, and GSE38718) from the GEO database were merged and batch corrected for larger sample sizes. The differentially expressed genes (DEGs) in the merged dataset were then identified. Meanwhile, functional enrichment and gene set enrichment analysis (GSEA) was performed on the merged dataset to investigate the potential roles of DEGs and immune infiltration in the pathogenesis of sarcopenia. Then, the expression levels of CRGs and immune infiltration levels of 16 immune cell types were quantified in older and young skeletal muscles. Furthermore, the correlation between CRG expression matrices and immune cell infiltration and function levels was analyzed to identify key CRGs associated with immunity. Finally, a novel diagnostic nomogram model was constructed based on key CRGs associated with immunity to screen and predict sarcopenia. Additionally, the GSE28422 dataset was used as the validation dataset to test the diagnostic performance of the model.
Differentially expressed gene (DEG) analysis
The merged dataset, consisting of 50 young healthy samples and 45 senile samples, was utilized to analyze mRNA expression in musculoskeletal aging. All muscle biopsy specimens were obtained from the vastus lateralis muscle. The DEGs in the merged dataset was analyzed with the “limma” package in R software [13]. In this research, genes satisfying double filtering criteria were considered DEGs: absolute log2 fold change > 0.5 and Benjamini-Hochberg false discovery rate (FDR)-adjusted P-value ≤ 0.05. The “ggplot2” and “pheatmap” packages in R software were used to visualize the DEGs [14,15], generating volcano distribution maps and heatmaps, respectively.
Functional enrichment analysis and GSEA
Functional enrichment analysis was performed to further investigate the characteristic biological properties of DEGs, including cellular component (CC), molecular function (MF), and biological process (BP). In the meantime, Kyoto Encyclopedia of Genes and Genomes (KEGG) pathway analysis was also performed. Terms with the corrected threshold of adjusted p value < 0.05 were considered significantly enriched by DEGs. The circular visualization plots for GO terms and KEGG pathways were created using the following R packages: clusterProfiler, circlize, dplyr, RColorBrewer, and ComplexHeatmap [16-18]. GSEA is an enrichment analysis method based on one or more functional gene sets [19]. GSEA was used to determine whether any immune-related gene sets were significantly enriched in the sarcopenia group.
Evaluation of CRG expression profiles and calculation of immune score
The CRGs were obtained from a previous study [20]. Then, the gene expression profiles of CRGs were extracted from the older and young healthy groups. Additionally, the ssGSEA method was used to analyze the per-sample infiltration levels of 16 immune cell types and 13 immunological functions in the Gene Set Variation Analysis (GSVA) and GSEABase packages [21]. The correlation between infiltrating immune cells and immune functions was determined and visualized using the Corrplot R package. Subsequently, the R packages ggpubr and Reshape2 were used to detect and visualize the differences in 16 immune cells and 13 immune functions between older and young healthy samples.
Link between CRGs and immune cell and function
To identify key CRGs, a correlation analysis was performed between 12 CRG expression matrices and immune cell infiltration and function levels. The hub CRGs with the highest association with immune cell infiltration levels were selected as candidate biomarkers of musculoskeletal aging to construct a novel diagnostic nomogram model. The R packages psych and ggcorrplot were employed to analyze and visualize the link between CRGs and immune cells and function.
Development of the novel diagnostic nomogram model
Based on the selected candidate biomarkers of musculoskeletal aging, the R package “rms” was used to predict the prevalence of sarcopenia and construct the novel diagnostic nomogram model. The model was based on a logistic regression model, and the gene scores assessment could predict the probability of sarcopenia. A calibration curve was plotted for the nomogram model, and the consistency of the predicted values was evaluated against the actual values. Decision curve analysis (DCA) was performed to assess the clinical utility of the nomogram model, and the clinical impact curve was plotted to determine the benefits of the model-based decisions to patients.
Evaluation and verification of nomogram model
The receiver operating characteristic (ROC) curve plot was drawn by using the R package “pROC”, and the area under the curve (AUC) of the ROC curve was calculated to evaluate the diagnostic performance of the novel model. To validate the diagnostic model, an external dataset (GSE28422) was used as a test dataset. In addition, the AUC and confidence limit (CI) were used to validate the model efficiency.
Statistical analysis
All statistical analyses were performed using R software (R version 4.1.3). The infiltration levels of 16 immune cell types and 13 immune functions between the sarcopenia group and the normal group were compared with the Wilcoxon rank-sum test. Linear regression analysis was performed to examine the correlation between two continuous variables. The corresponding 95% CIs were estimated using confidence intervals. In this study, P < 0.05 was considered significant.
Results
Identification of differentialy expressed genes (DEGs)
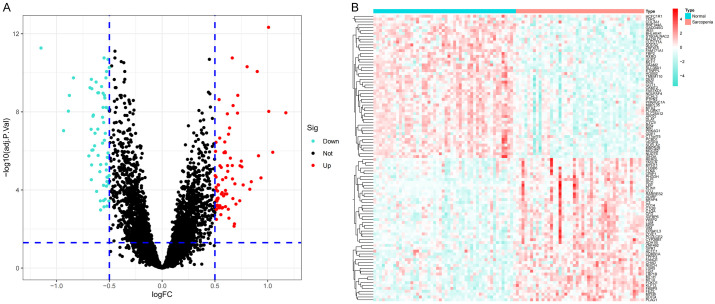
A total of 141 DEGs were identified in the merged dataset using the R software’s “limma” package. The DEGs included 54 lowly expressed genes and 87 highly expressed genes. The genes TPPP3, MYH8, CDKN1A, SLC38A1, and SLPI demonstrated log FC > 1. The DEG results were visualized in the volcano map and heat map (Figure 1).
Figure 1.
A. Volcano plot of differentially expressed genes (DEGs). The red dots in the upper right part represent up-regulated DEGs. The blue dots in the upper left part represent down-regulated DEGs. The middle black dots represent the remaining stable genes. B. Heatmap of the top 100 DEGs. The colors from red to blue in the figure represent the expression of DEGs from high to low.
Functional enrichment analysis and GSEA
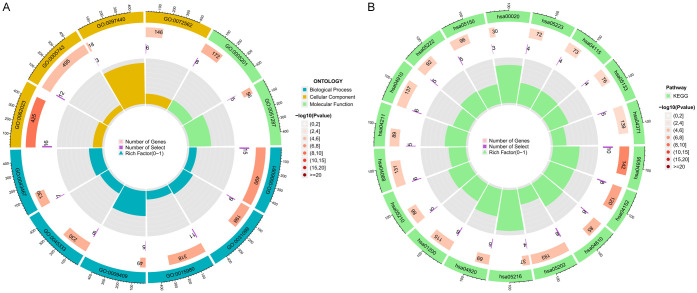
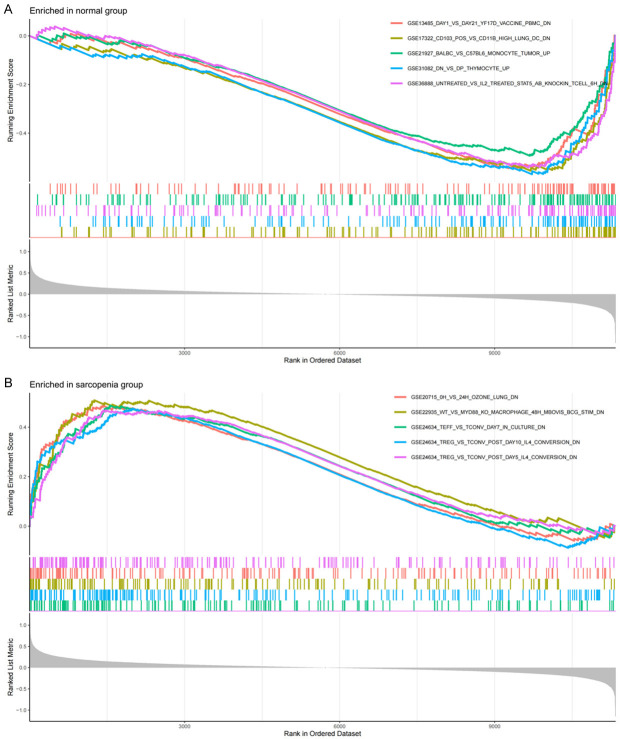
According to the screening criteria of adjusted p value < 0.05, GO enrichment analysis of DEGs yielded 38 enriched annotations, including 31 BPs, 5 CCs, and 2 MFs (see Table 1). BP analysis revealed that DEGs were mainly enriched in the generation of precursor metabolites and energy, regeneration, energy derivation by oxidation of organic compounds, cellular respiration, and response to metal ions. In the CC category, DEGs were involved in the collagen-containing extracellular matrix, mitochondrial inner membrane, apical dendrite, blood microparticle, and platelet alpha granule lumen. In the MF category, DEGs were enriched in extracellular matrix structural constituent and NAD binding. The KEGG pathway enrichment analysis results revealed that DEGs were mainly enriched in the alcoholic liver disease, AMPK signaling pathway, complement and coagulation cascades, transcriptional misregulation in cancer, carbon metabolism, FoxO signaling pathway, and insulin signaling pathway (see Table 2 for details). Figure 2 shows the most significant GO terms and KEGG pathways in the circle charts. Moreover, Figure 3 illustrates the top five immune-related gene sets most significantly enriched in the sarcopenia and normal groups, respectively. These findings suggest that the development of musculoskeletal aging may be mediated by molecular mechanisms of immune-related genes.
Table 1.
Results of each biologic process, cellular component and molecular function from GO-term analysis of DEGs
| GO term | Gene Ratio | Count | p value | q value |
|---|---|---|---|---|
| Biologic process | ||||
| generation of precursor metabolites and energy | 15/131 | 15 | 1.77E-06 | 0.004176101 |
| regeneration | 9/131 | 9 | 1.07E-05 | 0.011680966 |
| energy derivation by oxidation of organic compounds | 11/131 | 11 | 1.48E-05 | 0.011680966 |
| cellular respiration | 9/131 | 9 | 3.52E-05 | 0.011711402 |
| response to metal ion | 11/131 | 11 | 6.36E-05 | 0.012530442 |
| Cellular component | ||||
| collagen-containing extracellular matrix | 16/134 | 16 | 3.67E-08 | 7.37E-06 |
| mitochondrial inner membrane | 12/134 | 12 | 0.000156477 | 0.015730074 |
| apical dendrite | 3/134 | 3 | 0.000238281 | 0.015969 |
| blood microparticle | 6/134 | 6 | 0.000512869 | 0.025778431 |
| platelet alpha granule lumen | 4/134 | 4 | 0.001158048 | 0.046565731 |
| Molecular function | ||||
| extracellular matrix structural constituent | 8/134 | 8 | 3.84E-05 | 0.008865167 |
| NAD binding | 5/134 | 5 | 5.43E-05 | 0.008865167 |
DEGs, Differentially Expressed Genes; GO, Gene Ontology.
Table 2.
The results of KEGG-pathway analysis of DEGs
| KEGG pathway | Gene Ratio | Count | p value | q value |
|---|---|---|---|---|
| Alcoholic liver disease | 10/69 | 10 | 2.67E-07 | 3.62E-05 |
| AMPK signaling pathway | 8/69 | 8 | 6.93E-06 | 0.000470346 |
| Transcriptional misregulation in cancer | 8/69 | 8 | 0.000208346 | 0.006294444 |
| Complement and coagulation cascades | 6/69 | 6 | 7.66E-05 | 0.003465422 |
| Carbon metabolism | 6/69 | 6 | 0.00040373 | 0.007831754 |
| FoxO signaling pathway | 6/69 | 6 | 0.000806608 | 0.011852299 |
| Insulin signaling pathway | 6/69 | 6 | 0.001019432 | 0.011852299 |
| Colorectal cancer | 5/69 | 5 | 0.000771346 | 0.011852299 |
| Adipocytokine signaling pathway | 5/69 | 5 | 0.000278127 | 0.006294444 |
| Longevity regulating pathway | 5/69 | 5 | 0.000901519 | 0.011852299 |
| Thyroid cancer | 4/69 | 4 | 0.000252224 | 0.006294444 |
| Small cell lung cancer | 5/69 | 5 | 0.001047412 | 0.011852299 |
| Staphylococcus aureus infection | 5/69 | 5 | 0.001268377 | 0.013248639 |
| Citrate cycle (TCA cycle) | 3/69 | 3 | 0.002004852 | 0.019445556 |
| Non-small cell lung cancer | 4/69 | 4 | 0.003145963 | 0.028068911 |
| p53 signaling pathway | 4/69 | 4 | 0.003307345 | 0.028068911 |
| Pertussis | 4/69 | 4 | 0.003825222 | 0.030554407 |
| Apelin signaling pathway | 5/69 | 5 | 0.006309847 | 0.047600603 |
DEGs, Differentially Expressed Genes; KEGG, Kyoto Encyclopedia of Genes and Genomes.
Figure 2.
Functional and pathway enrichment analyses of DEGs. A. Circle plot showing gene ontology (GO) terms. B. Circle plot showing Kyoto Encyclopedia of Genes and Genomes (KEGG) pathway enrichment results.
Figure 3.
Results of the gene set enrichment analysis (GSEA) analysis. A. Enrichment results of the top five immune-related gene sets in the normal group; B. Enrichment results of the top five immune-related gene sets in the sarcopenia group.
Infiltration proportion of immune cells and functions
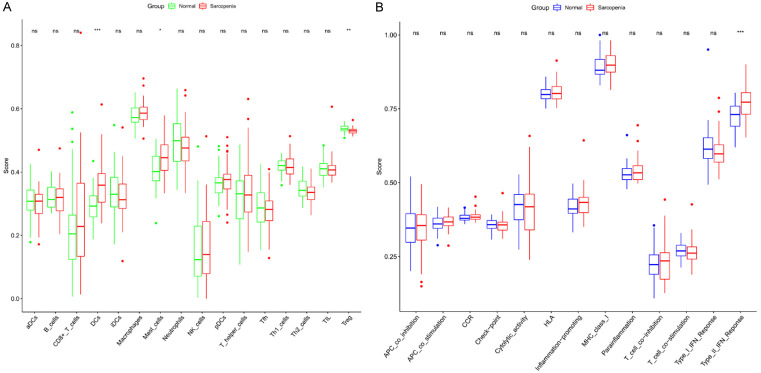
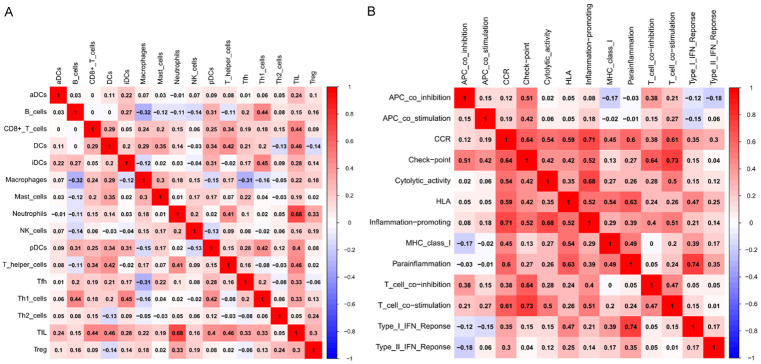
ssGSEA was performed to acquire the proportions of 16 immune cell types and 13 immune functions in each sample to identify the proportion of immune infiltration in the pathology of musculoskeletal aging. The infiltration level of T-regulatory cells was significantly lower in older muscle tissues compared with normal muscle tissues. In contrast, dendritic cells (DCs) and mast cells were relatively higher (Figure 4A). In terms of immune function, a significantly greater proportion of Type_II_IFN_Reponse was observed in sarcopenia muscle tissues than in young muscle tissues (Figure 4B). An immune cell and function correlation analysis was conducted. As shown in Figure 5A, tumor infiltrating lymphocytes (TIL) and neutrophils exhibited the strongest positive association (Pearson coefficient = 0.68). In the immune cell function correlation analysis, Type_I_IFN_Reponse and parainflammation exhibited the strongest positive association, with a Pearson’s correlation coefficient of 0.74 (Figure 5B).
Figure 4.
Box plots of the different expression level of 16 immune cells (A) and 13 immune functions (B) between the normal and sarcopenia groups. *P < 0.05, **P < 0.05, ***P < 0.001.
Figure 5.
Correlation heat map of immune cells (A) and immune function (B).
Correlation between CRGs and immune cell infiltration and function
The correlation between 12 CRGs and the levels of immune cells and functions was analyzed in order to identify candidate CRGs closely associated with immune infiltration. Among these CRGs, seven (PDHA1, PDHB, DLAT, DLST, DLD, FDX1, and LIAS) were associated with 16 immune cells and 13 immune-related functions. As shown in Figure 6, significant negative correlations were observed between all CRGs and immune cells and functions. Notably, Type_II_IFN_Reponse was correlated with almost all seven CRGs.
Figure 6.
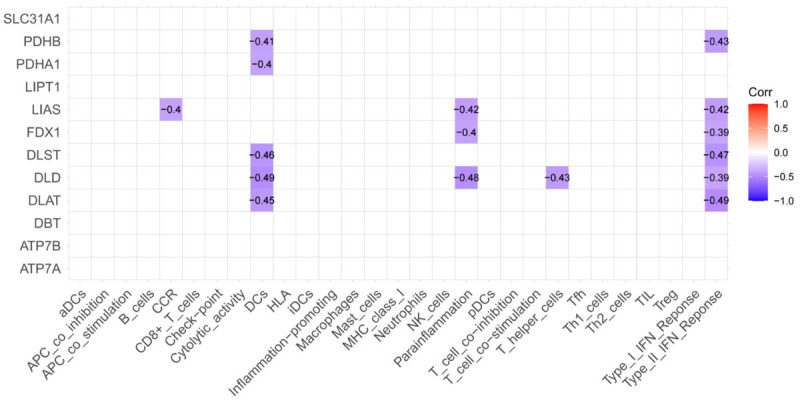
Correlation analysis results between cuproptosis-related genes and immune cells and functions.
Development and validation of the model for sarcopenia
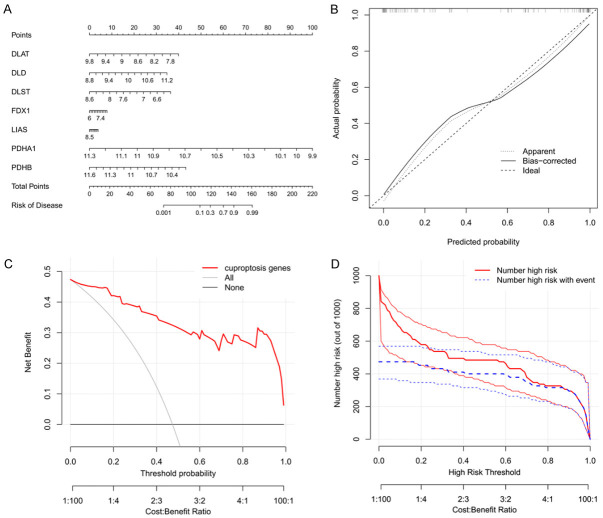
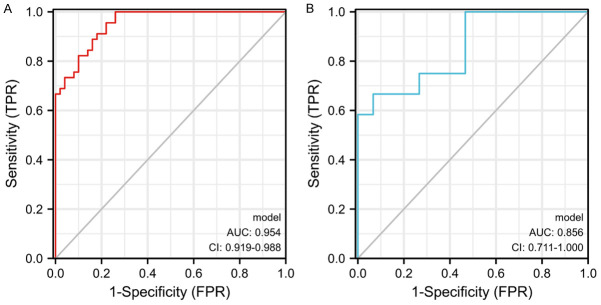
A nomogram model based on the seven candidate CRGs was established to predict the prevalence of sarcopenia (Figure 7A). The calibration curves (Figure 7B) demonstrated the reliability of the nomogram model prediction. The red line in the DCA curve (Figure 7C) remained above the gray and black lines from 0 to 1, indicating that the model-based decisions may have additional benefits for sarcopenia patients. Furthermore, the clinical impact curve (Figure 7D) showed the significant predictive power of the nomogram model. Moreover, the ROC curve (AUC = 0.954) was generated to evaluate the diagnostic performance of the nomogram model (Figure 8A). Besides, the sarcopenia nomogram model was validated using an external dataset (GSE28422) to determine whether the model could discriminate between sarcopenia and normal specimens. As shown in Figure 8B, the AUC value of the diagnostic model for the validation dataset was 0.856, indicating the high diagnostic accuracy of the model for sarcopenia.
Figure 7.
Nomogram model of sarcopenia. A. Construction of the nomogram model based on the seven cuproptosis-related genes. B. Predictive ability of the nomogram model as shown by the calibration curve. C. Decisions based on the nomogram model may benefit sarcopenia patients. D. Clinical impact of the nomogram model as evaluated by a clinical impact curve.
Figure 8.
A. Receiver operating characteristic (ROC) curve of the nomogram diagnostic model of sarcopenia. B. ROC curve of the nomogram diagnostic model in the verification cohort.
Discussion
Sarcopenia has become a major public health problem with the increase in the global elderly population, imposing a significant social and economic burden. Therefore, the early screening and diagnosis of sarcopenia in community areas or nursing homes should be improved. However, sarcopenia screening is hindered by the lack of a generally accepted and actionable “gold standard”. In recent years, new diagnostic and predictive options for sarcopenia have been proposed by making use of gene expression data from public databases. Early genetic diagnosis of sarcopenia through community screening may allow for timely and appropriate intervention.
Although the pathogenesis of musculoskeletal aging is unclear, skeletal muscle apoptosis and immune infiltration are believed to play essential roles in its molecular mechanism. Many kinds of programmed cell death are regularly and precisely controlled in the development of multicellular organisms, such as apoptosis, necroptosis, pyroptosis, and ferroptosis. Recent studies have shown that copper ions in the tricarboxylic acid cycle directly bind to fatty acid acylated components, resulting in the abnormal aggregation of fatty acid acylated proteins and loss of iron-sulfur cluster proteins [12,20]. Furthermore, cells that depended on mitochondrial respiration were about 1,000 times more sensitive to copper ionophores than those that depended on glycolysis. Mitochondrial respiration in skeletal muscles is the major contributor to systemic aerobic capacity [22]. Thence, we supposed that copper-induced cell death might be a crucial mechanism for musculoskeletal aging. Nevertheless, no study has investigated cuproptosis in musculoskeletal aging.
In this research, CRGs specifically expressed in the samples and immune analysis were innovatively combined to construct a stable diagnostic nomogram model of musculoskeletal aging, integrating seven candidate CRGs using logistic regression. In addition, the calibration curve and ROC curve were used to evaluate the predictive efficiency of the diagnostic model. To our knowledge, this is the first study to report the establishment of a nomogram model for sarcopenia.
At the beginning of the study, 141 DEGs were screened from 95 muscle samples in the GEO database, and GO and KEGG analyses were performed. As shown in Table 1, BP analysis showed that these DEGs were mainly involved in energy metabolism, cellular respiration, and response to metal ions. CC analysis revealed that DEGs were mainly involved in the mitochondrial inner membrane. In the molecular function, these DEGs were enriched in NAD binding, which participates in electron transfer in the tricarboxylic acid cycle of mitochondrial respiration. According to the KEGG pathway enrichment analysis (Table 2), these DEGs were also enriched in the citrate cycle (TCA cycle) and p53 signaling pathway, which is closely related to the pathogenesis of musculoskeletal aging. Therefore, the mitochondrial respiratory function might be affected by excessive accumulation of metal ions in skeletal muscle cells of elderly patients, causing copper death in skeletal muscles.
To further investigate the role of immune cell infiltration in the pathogenesis of musculoskeletal aging, ssGSEA was performed to assess the relative percentage of immune cell infiltration in each specimen. In the present study, we found increased infiltration of DCs and mast cells, while decreased infiltration of T-regulatory cells might be associated with musculoskeletal aging. With immune aging, muscle wasting may contribute to the pathogenesis of musculoskeletal aging [5]. DCs are involved in the maturation and differentiation of immune cells. During aging, DCs severely affect the differentiation of CD4+ T cells into Th1 and Th2 cells and increase the release of inflammatory cytokines [23]. These findings are reflected by the significantly higher infiltration levels of DCs in older specimens compared to young, healthy specimens. This suggests that DCs may promote an inflammatory environment by stimulating muscle inflammatory cell infiltration during immunosenescence and ultimately impair the proliferation and regeneration of skeletal muscle. Mast cells are a common type of granulocyte that contain many mediators such as heparin, histamine, and serotonin. After activation, mast cells rapidly trigger an inflammatory response in the tissue, lysing and releasing inflammatory mediators that can attract more immune cells [24]. Thus, an excess of mature mast cells is found between skeletal muscle fibers in sarcopenia muscle tissues, which may be a major cause of inflammatory cell infiltration. Moreover, Widner et al. [25] reported a higher number of activated skeletal muscle-resident mast cells in the mouse model of cachexia, indicating that skeletal muscle-resident mast cells may be used as a biomarker for the development and progression of cachexia-induced muscle atrophy. Conversely, skeletal muscle-resident T-regulatory cells can promote muscle tissue regeneration in an acute or chronic injury. This study also found a significantly lower level of T-regulatory cell infiltration in older muscle tissue than in young muscle tissue. T-regulatory cells respond to specific inflammatory factors during muscle aging or muscle injury, which accumulate in skeletal muscle cells, releasing growth factors that promote muscle repair and regeneration [26]. Additionally, T-regulatory cells can also exert anti-inflammatory effects by secreting anti-inflammatory cytokines, including IL-10 and TGF-β, and promote muscle regeneration by modulating the phenotype and function of macrophages [27]. Therefore, DCs, mast cells, and T-regulatory cells may be applied for diagnosing sarcopenia as immune biomarkers and mediators.
The diagnostic novel model based on seven cuproptosis-related genes CRGs (PDHA1, PDHB, DLAT, DLST, DLD, FDX1 and LIAS) could accurately predict the incidence of sarcopenia by calculating the AUC value. Among the seven CRGs, the proteins encoded by PDHA1, PDHB, DLAT, and DLD participate in the formation of the pyruvate dehydrogenase complex (PDC), which is closely related to mitochondrial respiration. PDC is a multiprotein gatekeeper complex composed of three major catalytic subunits, pyruvate dehydrogenase (PDH), dihydrolipoamide acetyltransferase (DLAT), and dihydrolipoamide dehydrogenase (DLD). It regulates mitochondrial function by catalyzing the conversion of pyruvate to acetyl coenzyme A [28,29]. The primary components of PDH are PDHα and PDHβ subunits encoded by PDHA1 and PDHB. These may be dephosphorylated by the Pdp1 and Pdp2 pyruvate dehydrogenase phosphatases (PDPs) and phosphorylated by the pyruvate dehydrogenase kinases (PDKs) [30]. In general, the metabolic capacity of mitochondria determines the ability of the skeletal muscle to maintain muscle strength during exercise, especially in high-intensity exercise [31]. Mitochondrial metabolism produces energy and metabolic intermediates involved in various activities such as redox homeostasis, anabolism, and epigenetics. Recent studies have shown that mitochondrial dysfunction may play a central role in the development and progression of sarcopenia [32]. In this study, significantly lower expression levels of PDHA1, PDHB, DLAT, and DLD were observed in the older group compared to the younger group. Therefore, the proteins encoded by these CRGs might regulate the activity of PDCs and affect the mitochondrial tricarboxylic acid cycle. However, no study has investigated the involvement of the four CRGs in the pathogenesis of musculoskeletal aging.
The alpha-ketoglutarate dehydrogenase complex (KGDHC) catalyzes the oxidative decarboxylation of α-ketoglutarate to succinyl-CoA, which is a mitochondrial enzyme [33]. Dihydrolipoamide succinyltransferase (DLST) is the primary component of KGDHC and it is responsible for the succinylation of vital mitochondrial enzymes. The DLST gene was also found to encode a novel protein that may be involved in the construction of myofibril structure in skeletal muscle [34]. This finding is aligned with our results, indicating that targeting DLST may be a viable approach for sarcopenia treatment.
Ferredoxin 1, encoded by FDX1, is a mitochondrial reductase involved in forming iron-sulfur (Fe-S) clusters, which is critical for mitochondrial function [35]. In addition, Ferredoxin 1 also acts as a novel substrate to promote a unique form of copper-dependent cell death upon binding to copper [36]. Loss of FDX1 activity has been shown to interfere with intracellular iron-sulfur carboxylase activity and iron stability, resulting in mitochondrial iron overload and cytoplasmic iron deficiency [37]. This is the first study to show a strong association between FDX1 and musculoskeletal aging, providing unique information for diagnosis and treatment.
Lipoic acid (LA) is synthesized in mitochondria by lipoic acid synthase (LIAS). It is a crucial cofactor of KGDHC, which plays a vital role in energy metabolism. In addition, LA is also a powerful mitochondrial antioxidant capable of removing reactive oxygen species (ROS) and nitrogen species in tissues [38]. Therefore, increasing the expression of the LIAS gene could promote the accumulation of LA within the mitochondria, resulting in reduced oxidative stress in musculoskeletal aging. This new therapeutic strategy offers a promising method to decrease oxidative stress in muscle aging. Precise localization to the skeletal muscle mitochondria ensures that ROS can be cleared in situ as they are produced by mitochondria.
To the best of our knowledge, this research is the first to use the molecular signature of cuproptosis-related genes (CRGs) to classify sarcopenia. However, this study also has some limitations and deficiencies. Some clinical data, such as grip strength and gait speed, were difficult to integrate into the nomogram model due to a lack of available data. Also, this research is solely based on bioinformatic findings. Because of the difficulty in obtaining human muscle specimens, the evidence level of the findings from this research is limited by the lack of experimental verification. Further studies are needed to elucidate the molecular mechanisms of the seven cuproptosis-linked genes in sarcopenia.
Conclusion
In this research, seven cuproptosis-related genes or CRGs (PDHA1, PDHB, DLAT, DLST, DLD, FDX1, and LIAS) closely associated with musculoskeletal aging were identified. A novel nomogram model for sarcopenia was constructed based on these CRGs, demonstrating high diagnostic performance. Moreover, skeletal muscle-resident immune cells, including DCs, mast cells, and T-regulatory cells, may serve as potential biomarkers and mediators for the development and progression of musculoskeletal aging. In summary, this research clarified the role of cuproptosis and immunity in musculoskeletal aging and offered a new strategy for the future exploration of the molecular mechanism and early diagnosis of sarcopenia.
Acknowledgements
This research work was financially sponsored by the Shanghai Municipal Commission of Health and Family Planning (No. 202040297), the National Key Research and Development Plan of China (No. 2020YFC2008700), the Shanghai Clinical Research Center for Rehabilitation Medicine (No. 21MC1930200), Huadong Hospital Clinical Research Foundation (No. H1308) and the Clinical Research Center for Geriatric Fractures of Huadong Hospital (No. LCZX2208). The research protocol has been approved by the ethics board of Huadong Hospital Affiliated to Fudan University. All methods were carried out in accordance with relevant guidelines.
Disclosure of conflict of interest
None.
References
- 1.Dao T, Green AE, Kim YA, Bae SJ, Ha KT, Gariani K, Lee MR, Menzies KJ, Ryu D. Sarcopenia and muscle aging: a brief overview. Endocrinol Metab (Seoul) 2020;35:716–732. doi: 10.3803/EnM.2020.405. [DOI] [PMC free article] [PubMed] [Google Scholar]
- 2.Rosenberg IH. Sarcopenia: origins and clinical relevance. J Nutr. 1997;127(Suppl):990S–991S. doi: 10.1093/jn/127.5.990S. [DOI] [PubMed] [Google Scholar]
- 3.Chen Z, Li WY, Ho M, Chau PH. The prevalence of sarcopenia in Chinese older adults: meta-analysis and meta-regression. Nutrients. 2021;13:1441. doi: 10.3390/nu13051441. [DOI] [PMC free article] [PubMed] [Google Scholar]
- 4.Falcon LJ, Harris-Love MO. Sarcopenia and the new ICD-10-CM code: screening, staging, and diagnosis considerations. Fed Pract. 2017;34:24–32. [PMC free article] [PubMed] [Google Scholar]
- 5.Saini J, Mcphee JS, Al-Dabbagh S, Stewart CE, Al-Shanti N. Regenerative function of immune system: modulation of muscle stem cells. Ageing Res Rev. 2016;27:67–76. doi: 10.1016/j.arr.2016.03.006. [DOI] [PubMed] [Google Scholar]
- 6.Lee JS, Auyeung TW, Kwok T, Lau EM, Leung PC, Woo J. Associated factors and health impact of sarcopenia in older Chinese men and women: a cross-sectional study. Gerontology. 2007;53:404–410. doi: 10.1159/000107355. [DOI] [PubMed] [Google Scholar]
- 7.Fan J, Kou X, Yang Y, Chen N. MicroRNA-regulated proinflammatory cytokines in sarcopenia. Mediators Inflamm. 2016;2016:1438686. doi: 10.1155/2016/1438686. [DOI] [PMC free article] [PubMed] [Google Scholar]
- 8.Dalle S, Rossmeislova L, Koppo K. The role of inflammation in age-related sarcopenia. Front Physiol. 2017;8:1045. doi: 10.3389/fphys.2017.01045. [DOI] [PMC free article] [PubMed] [Google Scholar]
- 9.Brioche T, Lemoine-Morel S. Oxidative stress, sarcopenia, antioxidant strategies and exercise: molecular aspects. Curr Pharm Des. 2016;22:2664–2678. doi: 10.2174/1381612822666160219120531. [DOI] [PubMed] [Google Scholar]
- 10.Dam AD, Mitchell AS, Rush JW, Quadrilatero J. Elevated skeletal muscle apoptotic signaling following glutathione depletion. Apoptosis. 2012;17:48–60. doi: 10.1007/s10495-011-0654-5. [DOI] [PubMed] [Google Scholar]
- 11.Rygiel KA, Picard M, Turnbull DM. The ageing neuromuscular system and sarcopenia: a mitochondrial perspective. J Physiol. 2016;594:4499–4512. doi: 10.1113/JP271212. [DOI] [PMC free article] [PubMed] [Google Scholar]
- 12.Tsvetkov P, Coy S, Petrova B, Dreishpoon M, Verma A, Abdusamad M, Rossen J, Joesch-Cohen L, Humeidi R, Spangler RD, Eaton JK, Frenkel E, Kocak M, Corsello SM, Lutsenko S, Kanarek N, Santagata S, Golub TR. Copper induces cell death by targeting lipoylated TCA cycle proteins. Science. 2022;375:1254–1261. doi: 10.1126/science.abf0529. [DOI] [PMC free article] [PubMed] [Google Scholar]
- 13.Ritchie ME, Phipson B, Wu D, Hu Y, Law CW, Shi W, Smyth GK. Limma powers differential expression analyses for RNA-sequencing and microarray studies. Nucleic Acids Res. 2015;43:e47. doi: 10.1093/nar/gkv007. [DOI] [PMC free article] [PubMed] [Google Scholar]
- 14.Maag JLV. Gganatogram: an R package for modular visualisation of anatograms and tissues based on ggplot2. F1000Res. 2018;7:1576. doi: 10.12688/f1000research.16409.1. [DOI] [PMC free article] [PubMed] [Google Scholar]
- 15.Yu B, Tao D. Heatmap regression via randomized rounding. IEEE Trans Pattern Anal Mach Intell. 2022;44:8276–8289. doi: 10.1109/TPAMI.2021.3103980. [DOI] [PubMed] [Google Scholar]
- 16.Gu Z, Gu L, Eils R, Schlesner M, Brors B. Circlize implements and enhances circular visualization in R. Bioinformatics. 2014;30:2811–2812. doi: 10.1093/bioinformatics/btu393. [DOI] [PubMed] [Google Scholar]
- 17.Yu G, Wang LG, Han Y, He QY. clusterProfiler: an R package for comparing biological themes among gene clusters. OMICS. 2012;16:284–287. doi: 10.1089/omi.2011.0118. [DOI] [PMC free article] [PubMed] [Google Scholar]
- 18.Gu Z, Eils R, Schlesner M. Complex heatmaps reveal patterns and correlations in multidimensional genomic data. Bioinformatics. 2016;32:2847–2849. doi: 10.1093/bioinformatics/btw313. [DOI] [PubMed] [Google Scholar]
- 19.Subramanian A, Tamayo P, Mootha VK, Mukherjee S, Ebert BL, Gillette MA, Paulovich A, Pomeroy SL, Golub TR, Lander ES, Mesirov JP. Gene set enrichment analysis: a knowledge-based approach for interpreting genome-wide expression profiles. Proc Natl Acad Sci U S A. 2005;102:15545–50. doi: 10.1073/pnas.0506580102. [DOI] [PMC free article] [PubMed] [Google Scholar]
- 20.Tang D, Chen X, Kroemer G. Cuproptosis: a copper-triggered modality of mitochondrial cell death. Cell Res. 2022;32:417–418. doi: 10.1038/s41422-022-00653-7. [DOI] [PMC free article] [PubMed] [Google Scholar]
- 21.Hanzelmann S, Castelo R, Guinney J. GSVA: gene set variation analysis for microarray and RNA-seq data. BMC Bioinformatics. 2013;14:7. doi: 10.1186/1471-2105-14-7. [DOI] [PMC free article] [PubMed] [Google Scholar]
- 22.Bassett DR Jr, Howley ET. Limiting factors for maximum oxygen uptake and determinants of endurance performance. Med Sci Sports Exerc. 2000;32:70–84. doi: 10.1097/00005768-200001000-00012. [DOI] [PubMed] [Google Scholar]
- 23.Zhang X, Li H, He M, Wang J, Wu Y, Li Y. Immune system and sarcopenia: presented relationship and future perspective. Exp Gerontol. 2022;164:111823. doi: 10.1016/j.exger.2022.111823. [DOI] [PubMed] [Google Scholar]
- 24.Wernersson S, Pejler G. Mast cell secretory granules: armed for battle. Nat Rev Immunol. 2014;14:478–494. doi: 10.1038/nri3690. [DOI] [PubMed] [Google Scholar]
- 25.Widner DB, Liu C, Zhao Q, Sharp S, Eber MR, Park SH, Files DC, Shiozawa Y. Activated mast cells in skeletal muscle can be a potential mediator for cancer-associated cachexia. J Cachexia Sarcopenia Muscle. 2021;12:1079–1097. doi: 10.1002/jcsm.12714. [DOI] [PMC free article] [PubMed] [Google Scholar]
- 26.Schiaffino S, Pereira MG, Ciciliot S, Rovere-Querini P. Regulatory T cells and skeletal muscle regeneration. FEBS J. 2017;284:517–524. doi: 10.1111/febs.13827. [DOI] [PubMed] [Google Scholar]
- 27.Xiang Y, Dai J, Xu L, Li X, Jiang J, Xu J. Research progress in immune microenvironment regulation of muscle atrophy induced by peripheral nerve injury. Life Sci. 2021;287:120117. doi: 10.1016/j.lfs.2021.120117. [DOI] [PubMed] [Google Scholar]
- 28.Guevara EL, Yang L, Birkaya B, Zhou J, Nemeria NS, Patel MS, Jordan F. Global view of cognate kinase activation by the human pyruvate dehydrogenase complex. Sci Rep. 2017;7:42760. doi: 10.1038/srep42760. [DOI] [PMC free article] [PubMed] [Google Scholar]
- 29.Patel MS, Nemeria NS, Furey W, Jordan F. The pyruvate dehydrogenase complexes: structure-based function and regulation. J Biol Chem. 2014;289:16615–16623. doi: 10.1074/jbc.R114.563148. [DOI] [PMC free article] [PubMed] [Google Scholar]
- 30.Constantin-Teodosiu D. Regulation of muscle pyruvate dehydrogenase complex in insulin resistance: effects of exercise and dichloroacetate. Diabetes Metab J. 2013;37:301–314. doi: 10.4093/dmj.2013.37.5.301. [DOI] [PMC free article] [PubMed] [Google Scholar]
- 31.Jensen J, Rustad PI, Kolnes AJ, Lai YC. The role of skeletal muscle glycogen breakdown for regulation of insulin sensitivity by exercise. Front Physiol. 2011;2:112. doi: 10.3389/fphys.2011.00112. [DOI] [PMC free article] [PubMed] [Google Scholar]
- 32.Melouane A, Yoshioka M, St-Amand J. Extracellular matrix/mitochondria pathway: a novel potential target for sarcopenia. Mitochondrion. 2020;50:63–70. doi: 10.1016/j.mito.2019.10.007. [DOI] [PubMed] [Google Scholar]
- 33.Mckenna MC, Rae CD. A new role for alpha-ketoglutarate dehydrogenase complex: regulating metabolism through post-translational modification of other enzymes. J Neurochem. 2015;134:3–6. doi: 10.1111/jnc.13150. [DOI] [PMC free article] [PubMed] [Google Scholar]
- 34.Matuda S, Arimura T, Kimura A, Takekura H, Ohta S, Nakano K. A novel protein found in the I bands of myofibrils is produced by alternative splicing of the DLST gene. Biochim Biophys Acta. 2010;1800:31–39. doi: 10.1016/j.bbagen.2009.10.003. [DOI] [PubMed] [Google Scholar]
- 35.Cai K, Tonelli M, Frederick RO, Markley JL. Human mitochondrial ferredoxin 1 (FDX1) and ferredoxin 2 (FDX2) both bind cysteine desulfurase and donate electrons for iron-sulfur cluster biosynthesis. Biochemistry. 2017;56:487–499. doi: 10.1021/acs.biochem.6b00447. [DOI] [PMC free article] [PubMed] [Google Scholar]
- 36.Tsvetkov P, Detappe A, Cai K, Keys HR, Brune Z, Ying W, Thiru P, Reidy M, Kugener G, Rossen J, Kocak M, Kory N, Tsherniak A, Santagata S, Whitesell L, Ghobrial IM, Markley JL, Lindquist S, Golub TR. Mitochondrial metabolism promotes adaptation to proteotoxic stress. Nat Chem Biol. 2019;15:681–689. doi: 10.1038/s41589-019-0291-9. [DOI] [PMC free article] [PubMed] [Google Scholar]
- 37.Shi Y, Ghosh M, Kovtunovych G, Crooks DR, Rouault TA. Both human ferredoxins 1 and 2 and ferredoxin reductase are important for iron-sulfur cluster biogenesis. Biochim Biophys Acta. 2012;1823:484–492. doi: 10.1016/j.bbamcr.2011.11.002. [DOI] [PMC free article] [PubMed] [Google Scholar]
- 38.Krishnamoorthy E, Hassan S, Hanna LE, Padmalayam I, Rajaram R, Viswanathan V. Homology modeling of Homo sapiens lipoic acid synthase: substrate docking and insights on its binding mode. J Theor Biol. 2017;420:259–266. doi: 10.1016/j.jtbi.2016.09.005. [DOI] [PubMed] [Google Scholar]


