

Abstract
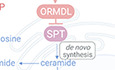
Disruption of sphingolipid homeostasis and signaling has been implicated in diabetes, cancer, cardiometabolic, and neurodegenerative disorders. Yet, mechanisms governing cellular sensing and regulation of sphingolipid homeostasis remain largely unknown. In yeast, serine palmitoyltransferase, catalyzing the first and rate‐limiting step of sphingolipid de novo biosynthesis, is negatively regulated by Orm1 and 2. Lowering sphingolipids triggers Orms phosphorylation, upregulation of serine palmitoyltransferase activity and sphingolipid de novo biosynthesis. However, mammalian orthologs ORMDLs lack the N‐terminus hosting the phosphosites. Thus, which sphingolipid(s) are sensed by the cells, and mechanisms of homeostasis remain largely unknown. Here, we identify sphingosine‐1‐phosphate (S1P) as key sphingolipid sensed by cells via S1PRs to maintain homeostasis. The increase in S1P‐S1PR signaling stabilizes ORMDLs, restraining SPT activity. Mechanistically, the hydroxylation of ORMDLs at Pro137 allows a constitutive degradation of ORMDLs via ubiquitin‐proteasome pathway, preserving SPT activity. Disrupting S1PR/ORMDL axis results in ceramide accrual, mitochondrial dysfunction, impaired signal transduction, all underlying endothelial dysfunction, early event in the onset of cardio‐ and cerebrovascular diseases. Our discovery may provide the molecular basis for therapeutic intervention restoring sphingolipid homeostasis.
Keywords: ceramide, endothelial dysfunction, ORMDL, serine palmitoyltransferase, sphingolipid
Subject Categories: Metabolism
Dysregulation of sphingolipid metabolism contributes to disease states. This study reveals how mammalian endothelial cells sense sphingolipids and how they regulate their biosynthesis, with potential therapeutic implications.
Introduction
Formed by the subunits SPT Long Chain 1 and 2 (SPTLC1 and SPTLC2), mammalian serine palmitoyltransferase (SPT) activity is enhanced by small subunits ssSPTa and ssSPTb (Han et al, 2009), and decreased by ORMDLs (Breslow et al, 2010) and Nogo‐B (Cantalupo et al, 2015). The requirement of sphingolipid (SL) de novo biosynthesis for viability and health is underlined by genetic evidences in humans and mice. SPTLC1/2 mutations cause Hereditary Sensory Neuropathy Type I (Dawkins et al, 2001; Rotthier et al, 2010), single nucleotide polymorphisms in ORMDLs are associated with asthma (Moffatt et al, 2007) and atherosclerosis (Ma et al, 2015), while the excision of Sptlc1 or Sptlc2 genes in mice is embryonically lethal (Hojjati et al, 2005). In yeast, Orms (Orm1 and Orm2) proteins regulate SL homeostasis, with the phosphorylation of Orms releasing the brake on SPT (Breslow et al, 2010) and facilitating, at least in part, their proteasomal degradation (Schmidt et al, 2019). However, mammalian ortholog ORMDLs lack the N‐terminal regions hosting these phosphosites (Hjelmqvist et al, 2002). How cells sense SL, monitor the rate of the de novo biosynthesis, and what goes awry in disease remain unknown.
S1P signaling is critical in development, physiological homeostasis, and diseases (Cartier & Hla, 2019). Genetic disruption of the S1P pathway results in congenital defects in humans, including Sjögren‐Larsson syndrome, and in adrenal insufficiency and nephrosis, hearing impairment, embryonic lethality, and post‐natal organ defects in mice, underlining that functional S1P signaling is a prerequisite for health. Within the cardiovascular and immune systems, S1P is necessary for vascular development (Liu et al, 2000) and homeostasis (Yanagida & Hla, 2017) as well as immune cell trafficking (Rivera et al, 2008), mainly via S1PR1. Endothelial S1PR1 controls blood flow and pressure via nitric oxide (NO) formation (Cantalupo et al, 2015, 2017; Cantalupo & Di Lorenzo, 2016), and maintains the quiescent state of the endothelium by exerting anti‐inflammatory (Galvani et al, 2015; Obinata & Hla, 2019) and barrier (Burg et al, 2018) functions. The endothelium is also an important source of plasma ceramide (Cantalupo et al, 2020) and S1P (Venkataraman et al, 2008), which is transported outside of the cells by the bonafide transporter Spns2 (Hisano et al, 2012). Autocrine S1P signaling controls flow‐induced vasodilation, which is a vital function of blood vessels to meet the tissue metabolic demands (Jacob et al, 2016). Disruption of endothelial S1P signaling by deletion of S1PR1 (Cantalupo et al, 2017) or Spns2 (Del Gaudio et al, 2021) results in vascular (Cantalupo et al, 2017; Del Gaudio et al, 2021) and barrier (Burg et al, 2018) dysfunctions, severe hypertension (Cantalupo et al, 2017; Del Gaudio et al, 2021) and atherosclerosis (Galvani et al, 2015), underlying the fundamental role of S1P‐S1PR1 signaling in preserving vascular health.
Results
S1P acutely inhibits SPT activity
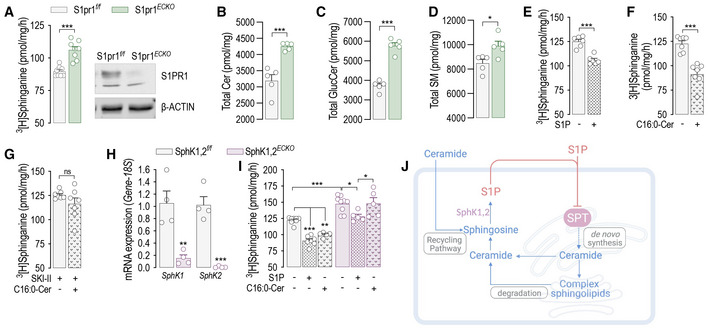
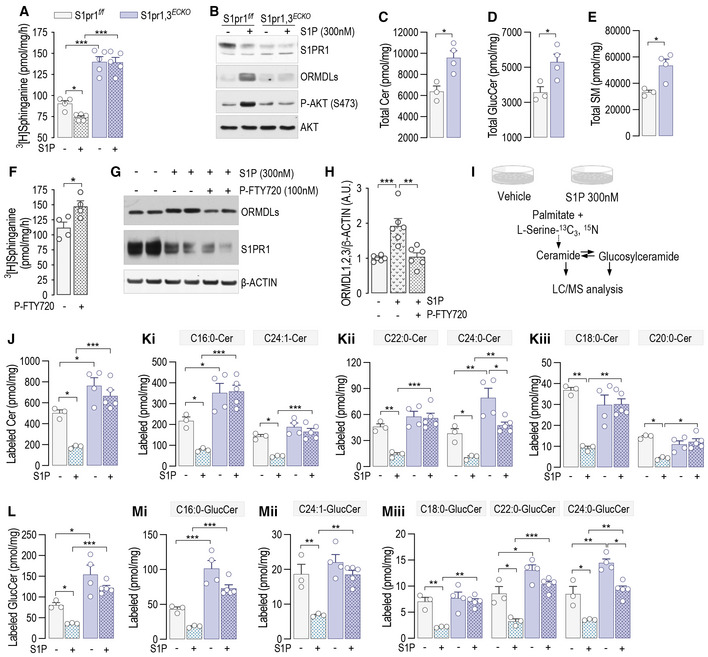
This study tested the hypothesis that S1P signaling is a fundamental molecular mechanism used by the cells to maintain sphingolipid homeostasis. The capability of S1PR to transduce S1P levels in a biological signal and the specificity and dynamicity of this interaction make S1P‐S1PR an ideal metabolite‐sensor system to regulate cellular sphingolipid homeostasis through an effector yet to be identified. To test this hypothesis, we used murine endothelial cell (mEC) inducible knockout for S1pr1 (Fig 1A). Interestingly, S1pr1 deletion resulted in increased SPT activity and SL levels (Figs 1A–D and EV1A–G), suggesting that S1PR1 signaling could function as negative feedback on sphingolipid metabolism. Based on this finding, we hypothesized that S1P is the key sphingolipid metabolite sensed by endothelial cells (EC) to modulate the sphingolipid de novo biosynthesis via SPT. Interestingly, S1P was able to rapidly decrease SPT activity of human umbilical vein EC (HUVEC, Fig 1E). Recent studies suggested that ceramide could modulate the ORMDL‐SPT complex (Siow & Wattenberg, 2012; Gupta et al, 2015; Davis et al, 2019b). In line with this finding, the addition of C16:0‐ceramide significantly decreased SPT activity in HUVEC (Fig 1F). However, this effect was abolished by SKI II, an inhibitor of sphingosine kinase‐1 (SphK1) and SphK2 (Fig 1G), which give rise to S1P via the phosphorylation of sphingosine, suggesting that S1P derived from ceramide metabolism mediates the inhibitory effects of ceramide on SPT. mEC with genetic deletion of Sphk1 and Sphk2 (Sphk1,2 ECKO , Fig 1H) corroborated that S1P formation is necessary for ceramide to downregulate SPT activity (Fig 1I). Of note, basal SPT activity was significantly upregulated in Sphk1,2 ECKO (Fig 1I), revealing a direct role of endothelial‐derived S1P in constraining SPT activity (Fig 1J).
Figure 1. S1P acutely inhibits SPT activity.
-
ASPT activity and Western blot (WB) analysis of S1PR1 in S1pr1 f/f and S1pr1 ECKO endothelial cells after 4‐OHT (1 μM, 72 h) treatment (n = 8/group from three independent EC isolations/group; four mice/EC isolation).
-
B–DLC–MS/MS quantification of Total (B) Ceramide, (C) Glucosylceramide, and (D) Sphingomyelin in S1pr1 f/f and S1Pr1 ECKO endothelial cells after 4‐OHT (1 μM, 72 h) treatment (n = 5/group from two independent EC isolations/group; four mice/EC isolation).
-
E–GSPT activity in HUVEC in (E) absence or presence of S1P (300 nM, 30′); (F) absence or presence of C16:0‐ceramide (300 nM, 30′), and (G) absence or presence of C16:0‐ceramide (300 nM, 30′), in the presence of SKI II (1 μM, 1 h pre‐treatment). (n ≥ 6 biological replicates).
-
HRT‐PCR for SphK1 and SphK2 in endothelial cells SphK1,2 f/f and SphK1,2 ECKO after 4‐OHT (1 μM, 72 h) treatment (n = 4 biological replicates).
-
ISPT activity in SphK1,2 f/f and SphK1,2 ECKO after 4‐OHT (1 μM, 72 h) treatment in absence or presence of S1P (300 nM, 30′) or C16:0‐ceramide (300 nM, 30′) (n ≥ 5/group from three independent EC isolations/group; four mice/EC isolation).
-
JGraphical abstract of the figures findings.
Data information: β‐ACTIN, loading control. 3[H]‐serine and palmitoyl‐CoA were used as substrates for SPT activity. Sphinganine—the reaction product—was separated in TLC (thin‐layer cromatography) and quantified. Data are expressed as mean ± SEM. *P ≤ 0.05; **P ≤ 0.01; ***P ≤ 0.001. Statistical significance was determined by unpaired t‐test (A‐H, K), and two‐way ANOVA with Tukey's post‐test (I).
Source data are available online for this figure.
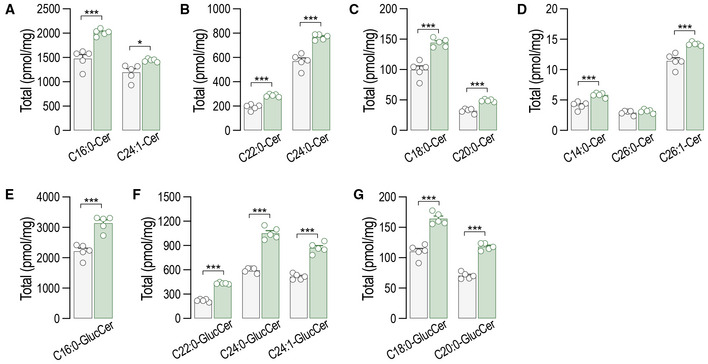
Figure EV1. Ceramide and glucosylceramide levels are increased in S1pr1 ECKO mEC compared to S1pr1 f/f .
-
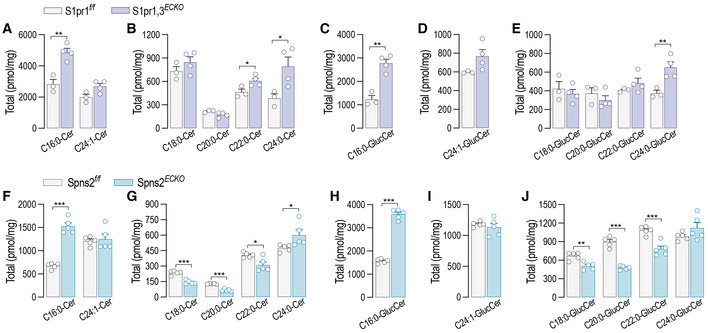
A–GLC–MS/MS quantification of total and specific (A–D) ceramides and (E–G) glucosylceramides in S1pr1 f/f and S1pr1 ECKO mEC after 4‐OHT (1 μM, 72 h) treatment (n = 5/group from two independent EC isolations/group; four mice/EC isolation).
Data information: Data are expressed as mean ± SEM. ***P ≤ 0.001. Statistical significance was determined by unpaired t‐test.
Source data are available online for this figure.
S1P inhibits SPT activity via ORMDLs stabilization
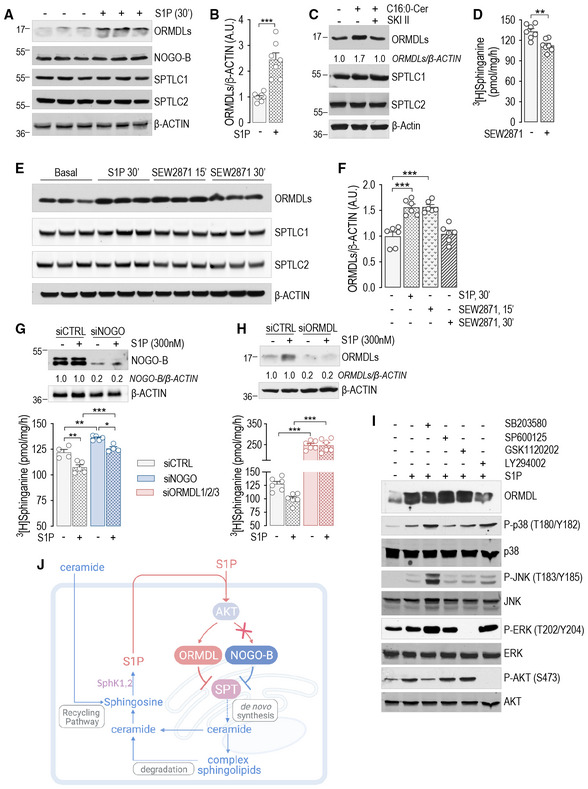
Contrary to Orms in yeast, ORMDL1,2,3 (here thereafter referred to as ORMDLs) are not phosphorylated (Davis et al, 2019b) in mammals. Interestingly, S1P stimulation triggered a rapid increase in ORMDLs protein levels (ca. 2.5‐fold), without affecting NOGO‐B, SPTLC1, or SPTLC2 expression (Fig 2A and B). Conversely, mRNA levels of ORMDLs were unchanged (Fig EV2A). Ceramide also induced a rapid increase in ORMDLs protein levels (Fig 2C), which was abolished by SKI II inhibitor, consistent with S1P mediating ceramide inhibition of SPT activity (Fig 1G). We then stimulated HUVEC with SEW2871, a non‐lipidic S1PR1 agonist (Cantalupo et al, 2015). Interestingly, SEW2871 induced a significant inhibition of SPT activity (Fig 2D), and increased ORMDLs (Fig 2E and F), arguing against the role of S1P‐derived ceramide on SPT.
Figure 2. S1P inhibits SPT activity via ORMDLs stabilization.
-
A, B(A) WB analysis of ORMDLs, NOGO‐B, SPTLC1, and SPTLC2 in HUVEC lysates in the absence or presence of S1P (300 nM, 30′) and (B) relative ORMDLs quantification (n = 7 biological replicates).
-
CWB analysis of ORMDLs, SPTLC1, and SPTLC2 in HUVEC lysates in the absence or presence of C16:0‐ceramide (300 nM, 30′), with or without SKI II 1 μM, 1 h pre‐treatment.
-
DSPT activity in HUVEC in the absence or presence of SEW2871 (300 nM, 15′) (n = 7 biological replicates).
-
E, F(E) WB analysis of ORMDLs, SPTLC1, and SPTLC2 in HUVEC lysates in the absence or presence of SEW2871 (300 nM, 15′ and 30′) and (F) relative ORMDLs quantification (n = 6 biological replicates).
-
G, HSPT activity and WB analysis of HUVEC treated with (G) siCTRL and siNOGO (40 nM, 72 h) (n ≥ 4/group), or with (H) siCTRL and siORMDL1/2/3 (40 nM, 72 h) (n = 4 biological replicates).
-
IWB analysis of ORMDLs, P‐p38, p38, P‐JNK, JNK, P‐ERK, ERK, P‐AKT, and AKT in HUVEC lysates in the absence or presence of the indicated inhibitors, with or without S1P (300 nM, 30′).
-
JGraphical abstract of the figures findings.
Data information: Western blot are representative of three or more independent biological replicates. β‐ACTIN, loading control. Data are expressed as mean ± SEM. *P ≤ 0.05; **P ≤ 0.01; ***P ≤ 0.001. Statistical significance was determined by unpaired t‐test (B, D), and two‐way ANOVA with Tukey's post‐test (F–H).
Source data are available online for this figure.
Figure EV2. S1P inhibits SPT activity via ORMDLs stabilization.
-
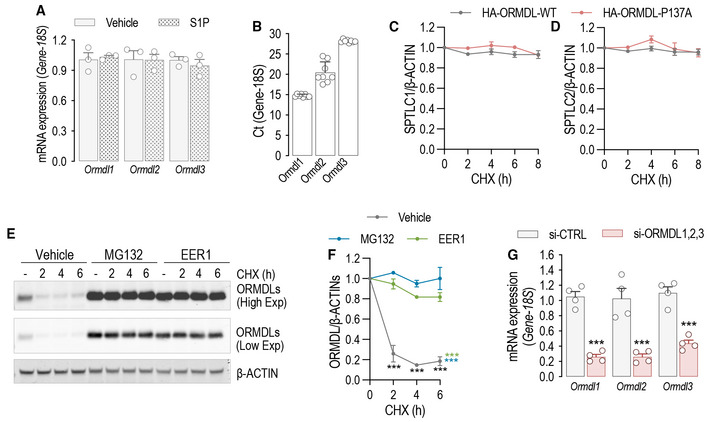
ART‐PCR for Ormdl1, Ormdl2, and Ormdl3 in the presence or absence of S1P (300 nM, 30′) (n = 3 biological replicates).
-
BOrmdl isoforms mRNA abundance determined subtracting the Ct of housekeeping 18S from the Ct of Ormdls (n = 8 biological replicates).
-
C, DQuantification of © SPTLC1 and (D) SPTLC2 levels from Fig 1G.
-
E, F(E) Western blot analysis for ORMDLs in HUVEC lysates treated with CHX (10 μM) for the indicated period of time, in the presence or absence of MG132 (10 μM) or EER1 (10 μM) and (F) relative quantification.
-
GRT‐PCR for Ormdl1, Ormdl2, and Ormdl3 before and after independent silencing with the corresponding siRNA (40 nM, 72 h) (n = 4 biological replicates).
Data information: Western blot and RT‐PCR are representative of three or more independent biological replicates. β‐ACTIN, loading control. Data are expressed as mean ± SEM. ***P ≤ 0.001. Statistical significance was determined by two‐way ANOVA with Tukey's post‐test (C, D, F) and unpaired t‐test (A, G).
Source data are available online for this figure.
Both NOGO‐B (Fig 2G) and ORMDLs (Fig 2H) knockdown resulted in a higher SPT activity, in line with a constitutive inhibition of SPT. However, only knockdown of ORMDLs (Fig 2H and J) abolished the S1P downregulation of SPT activity, suggesting that ORMDLs and not NOGO‐B are accountable for a nimble regulation of SPT activity by S1P. We then assessed the signaling downstream to S1P. The activation of AKT, but not ERK, p38, JNK, mediated, at least in part, the upregulation of ORMDLs (Fig 2I and J).
ORMDLs are degraded via prolyl hydroxylase ‐mediated ubiquitination and proteasomal degradation
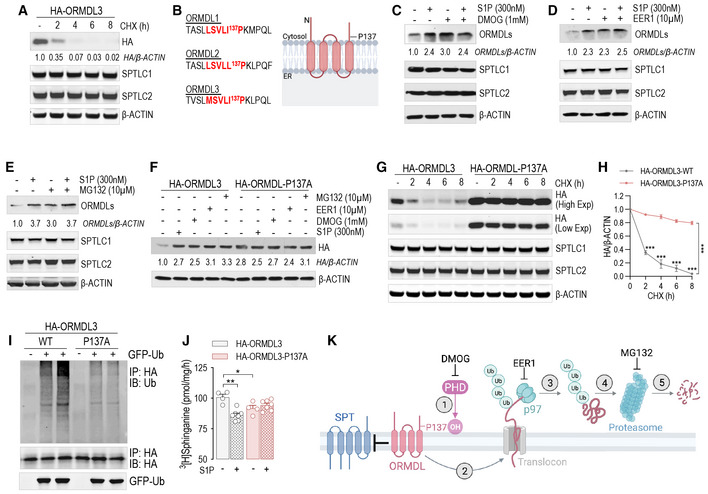
We next sought to unveil the molecular mechanism orchestrating the acute changes of ORMDLs levels. Protein abundance reflects the integration of synthesis and degradation rates (Hipp et al, 2019). The inhibition of translation with cycloheximide (CHX) showed that HA‐tagged ORMDL3 (HA‐ORMDL3) half‐life was 1.7 h (Fig 3A), indicating a relatively fast turnover, similar to the one observed in yeast (Schmidt et al, 2019). To identify the regulatory mechanisms controlling ORMDLs levels, we analyzed ORMDLs sequence properties and observed the presence in the C‐terminus of a degenerate prolyl hydroxylase (PHD) consensus sequence, known to regulate the levels of hypoxia‐inducible factor 1α (HIF‐1α) (Jaakkola et al, 2001) and other proteins (Guo et al, 2016; Yu et al, 2021) via ubiquitination (Fig 3B). Interestingly, the inhibition of PHD activity with the hydroxylase inhibitor dimethyloxalylglycine (DMOG) elevated ORMDLs to the same extent as S1P, suggesting that PHD‐mediated ubiquitination controlled the abundance of ORMDLs (Fig 3C). A retro‐translocation from the ER to the cytosol is necessary for ER‐membrane‐associated protein degradation (ERAD) (Dederer & Lemberg, 2021). The inhibition of dislocase p97/VCP with Eeyarestatin‐1 (EER1) led to ORMDLs accumulation (Fig 3D), implicating the retro‐translocation as regulatory step for ORMDLs levels. Eukaryotic cells rely on the ubiquitin‐proteasome pathway as a major degradation system for short‐lived proteins (Pickart, 1997). MG132, proteasome inhibitor, significantly augmented ORMDLs levels in basal conditions but not in the presence of S1P, most likely because S1P already maximized ORMDLs stability by inhibiting their degradation (Fig 3E). The data highlight proteasomal degradation as a primary mechanism to control mammalian ORMDLs levels.
Figure 3. ORMDLs are degraded via PHD‐mediated ubiquitination and proteasomal degradation.
-
AWB analysis of ORMDL3 (HA), SPTLC1, and SPTLC2 in HUVEC lysates expressing HA‐ORMDL3 and treated with cycloheximide (CHX, 10 μM) for the indicated period of time.
-
BProlyl hydroxylase consensus sequence in the three ORMDL isoforms.
-
C–EWB analysis of ORMDLs, SPTLC1, and SPTLC2 in HUVEC lysates in absence or presence of S1P (300 nM, 30′) and with or without (C) DMOG (1 mM, 1 h pre‐treatment), (D) Eeyarestatin 1 (EER1, 10 μM, 1 h pre‐treatment), (E) MG132 (10 μM, 1 h pre‐treatment).
-
FWB analysis of HA‐ORMDL3 and HA‐ORMDL3‐P137A in HUVEC lysates in the absence or presence of S1P (300 nM, 30′), DMOG (1 mM, 1 h), EER1 (10 μM, 1 h), and MG132 (10 μM, 1 h).
-
G, H(G) WB analysis of HA‐ORMDL3 and HA‐ORMDL3‐P137A, SPTLC1, and SPTLC2 in HUVEC lysates treated with CHX (10 μM) for the indicated period of time, and (H) relative quantification.
-
IWB analysis for Ubiquitin, HA, and GFP of HEK293T transfected with GFP‐ubiquitin and with the indicated HA‐ORMDL3 plasmid, and immunoprecipitated with HA antibody.
-
JSPT activity in HUVEC expressing the HA‐ORMDL3 or HA‐ORMDL3‐P137A, and depleted of endogenous ORMDLs with siRNA, in the absence or presence of S1P (300 nM, 30′) (n ≥ 4 biological replicates).
-
KGraphical abstract of the figure findings.
Data information: Western blot are representative of three or more independent biological replicates. β‐ACTIN, loading control. Data are expressed as mean ± SEM. *P ≤ 0.05; **P ≤ 0.01; ***P ≤ 0.001. Statistical significance was determined by two‐way ANOVA with Tukey's post‐test.
Source data are available online for this figure.
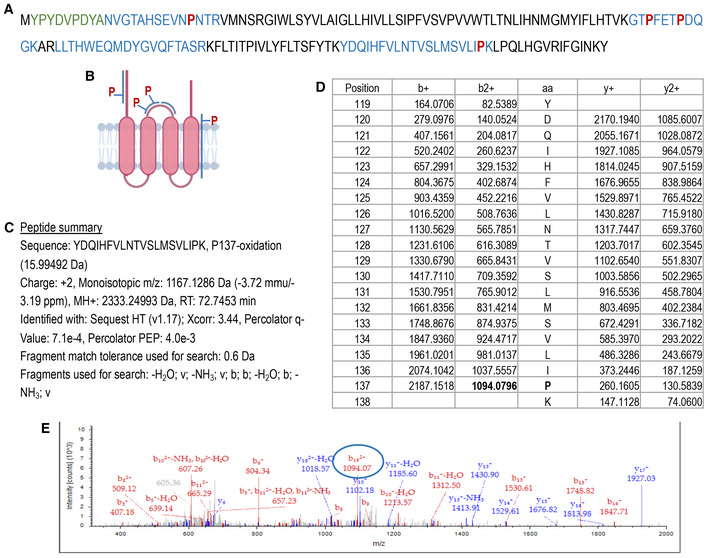
ORMDL3 is the most abundant ORMDL isoform in EC (Fig EV2B), and single nucleotide polymorphisms for ORMDL3 are associated with asthma (Moffatt et al, 2007) and atherosclerosis (Ma et al, 2015). To demonstrate the requirement of PHD‐mediated hydroxylation for ubiquitination‐mediated degradation of ORMDL3, we mutated P137 to A in the PHD consensus sequence. The P137A mutation was sufficient to stabilize HA‐ORMDL3 to the same levels of S1P, DMOG, EER1, and MG132 (Fig 3F). Interestingly, the half‐life of HA‐ORMDL3‐P137A was remarkably higher than the native form, 24 and 1.7 h, respectively (Fig 3G and H). Of note, the expression of mutant HA‐ORMDL3 did not affect the stability of SPTLC1 or SPTLC2 (Figs 3G and EV2C and D). We have also corroborated these data on endogenous ORMDLs in HUVEC, treated with and without MG132 or EER1 (Fig EV2E and F). To directly identify the hydroxylation of P137 of ORMDL, we performed mass spectrometry analysis of immunoprecipitated HA‐ORMDL3 protein overexpressed in HEK293 cells treated with MG132. As shown in Fig EV3A, tryptic peptides were detected containing P12 (N‐terminus), P71, P75 (cytosolic loop), P137 (between the fourth transmembrane domain and C‐terminus, Fig EV3B). MS analysis confirmed that P137, but not other detected prolines, was hydroxylated (Fig EV3C–E).
Figure EV3. ORMDL3 is hydroxylated at P137.
-
AHA‐ORMDL3 sequence. In green HA‐tag; in blue the peptides identified by MS; in red the prolines identified my MS.
-
BGraphical representation of the peptides identified by MS and prolines localization.
-
CSummary for the peptide containing P137.
-
DIon masses for the amino acids in the peptide.
-
ERepresentative mass spectrometry showing the P137 hydroxylated.
Lys‐48‐linked ubiquitination targets protein for degradation (Swatek & Komander, 2016). WB analysis of immunoprecipitated HA‐ORMDL3 showed that Lys‐48‐linked polyubiquitination was significantly reduced in the HA‐ORMDL3‐P137A compared to native HA‐ORMDL3 (Fig 3I), suggesting that P137 hydroxylation is necessary for ORMDL degradation via ubiquitination. Finally, to investigate the biological significance of P137 hydroxylation, native and mutant HA‐ORMDL3 were overexpressed in HUVEC depleted of endogenous ORMDLs via siRNA approach (Fig EV2G). In HUVEC expressing HA‐ORMDL3‐P137A, SPT activity was significantly suppressed at baseline and no longer modulated by S1P (Fig 3J). Mechanistically, these data support the model in which ORMDLs undergo PHD‐mediated hydroxylation of P137, ubiquitination, extraction from ER membrane via ERAD pathway, and ultimately proteasome‐mediated degradation (Fig 3K). S1P signaling downregulates SPT activity by stabilizing ORMDLs via inhibition of PHD‐mediated hydroxylation.
S1P inhibits de novo sphingolipid biosynthesis via S1PRs
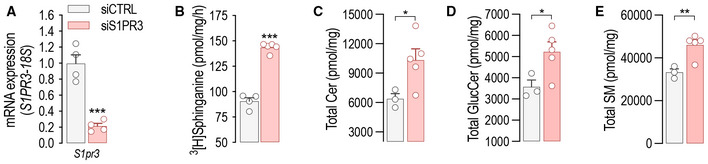
Quiescent EC express mainly S1PR1, and less abundantly S1PR3 (Lee et al, 1999). The loss of either S1PR1 (Fig 1A) or S1PR3 (Fig EV4A) leads to constitutive increase of SPT activity (Figs 1A and EV4B) and sphingolipid levels (Figs 1B–D and EV4C–E), suggesting that S1PR1,3 signaling provides constitutive inhibitory feedback on SPT. Thus, to investigate the role of S1PR1,3 in the dynamic regulation of SPT activity by S1P, mEC were depleted of both S1P receptors. Interestingly, the loss of S1PR1,3 abolished the downregulation of SPT activity (Fig 4A), as well as the stabilization of ORMDLs (Fig 4B), by exogenous S1P, suggesting that these receptors are necessary to sense S1P abundance and operate negative feedback to SPT via ORMDLs. Consistently, S1PR1,3 deletion significantly raised basal SPT activity (Fig 4A), as well as total ceramides (Fig 4C), glucosylceramides (Fig 4D), and sphingomyelins (Fig 4E). The treatment of HUVEC with P‐FTY720, a functional antagonist known to downregulate S1PR1 (Galvani et al, 2015), also raised basal SPT activity (Fig 4F). The pretreatment of HUVEC with P‐FTY720 negated ORMDLs stabilization by S1P (Fig 4G and H), further corroborating the necessary role of S1PRs. Cellular SL results from the de novo and recycling pathways. To investigate the impact of S1P on SPT activity, we used stable‐isotope labeled serine (L‐serine‐13C3,15N) to trace the de novo synthesized SL (Fig 4I). Exogenous S1P significantly decreased labeled ceramides (Fig 4J and K) and glucosylceramides (Fig 4L and M), corroborating the S1P‐induced downregulation of SPT activity (Fig 1E). However, in the absence of S1PR1,3, labeled ceramides and glucosylceramides were significantly elevated in basal conditions and were not significantly decreased by exogenous S1P compared to control EC (Fig 4J–M), suggesting that S1PR1,3 are necessary to mediate S1P downregulation of SPT activity. Unlabeled ceramides and glucosylceramides showed a similar trend (Fig EV5A–E), suggesting that the primary influence exerted on sphingolipid production was indeed from de novo sphingolipid biosynthesis.
Figure EV4. S1pr3 deletion leads to increased SPT activity and SL levels.
-
A, B(A) RT‐PCR for S1pr3 and (B) SPT activity in mEC after siCTRL or siS1PR3 treatment (40 nM, 72 h) (n = 4 biological replicates).
-
C–ELC–MS/MS quantification of total (C) Ceramide, (D) Glucosylceramide, and (E) Sphingomyelin in murine endothelial cell (mEC) after siCTRL or siS1PR3 treatment (40 nM, 72 h) (n = 5/group from two independent EC isolations/group; 4 mice/EC isolation).
Data information: Data are expressed as mean ± SEM. *P ≤ 0.05; ***P ≤ 0.001. Statistical significance was determined by unpaired t‐test.
Source data are available online for this figure.
Figure 4. S1P inhibits de novo sphingolipid biosynthesis via S1PRs.
-
A, B(A) SPT activity in S1pr1,3 f/f and S1pr1,2 ECKO murine endothelial cell (mEC) after 4‐OHT (1 μM, 72 h) and siS1PR3 (40 nM, 72 h) treatments, in the absence or presence of S1P (300 nM, 30′) (n ≥ 4/group from two independent EC isolations/group; four mice/EC isolation) and (B) relative WB analysis for S1PR1, ORMDLs, P‐AKT, and AKT.
-
C–ELC–MS/MS quantification of Total (C) Ceramide, (D) Glucosylceramide, and (E) Sphingomyelin in S1pr1,3 f/f and S1Pr1,3 ECKO mEC (n ≥ 3/group from two independent EC isolations/group; four mice/EC isolation).
-
F–H(F) SPT activity in HUVEC in the absence or presence of P‐FTY720 (100 nM, 30′) (n = 4 biological replicates). (G) WB analysis of ORMDLs and S1PR1 in HUVEC lysates in the absence or presence of P‐FTY720 (100 nM, 30′) and (H) relative ORMDLs quantification (n = 4 biological replicates).
-
IExperimental procedure for the measurement of the de novo synthetized Ceramides and Glucosylceramides.
-
J–MLC–MS/MS quantification of (J) total and (K) specific Ceramides, and of (L) total and (M) specific Glucosylceramides labeled with L‐Serine‐13C3, 15N in absence or presence of S1P (300 nM) (n ≥ 4/group from two independent EC isolations/group; four mice/EC isolation).
Data information: Western blots are representative of three or more independent biological replicates. Β‐ACTIN, loading control. Data are expressed as mean ± SEM. *P ≤ 0.05; **P ≤ 0.01; ***P ≤ 0.001. Statistical significance was determined by unpaired t‐test (C–F) and two‐way ANOVA with Tukey's post‐test (A, H, J–M).
Source data are available online for this figure.
Figure EV5. Endothelial‐derived S1P inhibits SL biosynthesis via S1PR1,3.
-
A–ELC–MS/MS quantification of specific (A and B) ceramides and (C–E) glucosylceramides in S1pr1,3 f/f and S1Pr1,3 ECKO murine endothelial cell (mEC) after 4‐OHT (1 μM, 72 h) and siS1PR3 (40 nM, 72 h) treatments (n = 5/group from two independent EC isolations/group; four mice/EC isolation).
-
F–JLC–MS/MS quantification of specific (F and G) ceramides and (H–J) glucosylceramides in Spns2 f/f and Spns2 ECKO mEC after 4‐OHT (1 μM, 72 h) treatment (n = 5/group from two independent EC isolations/group; four mice/EC isolation).
Data information: Data are expressed as mean ± SEM. *P ≤ 0.05; **P ≤ 0.01; ***P ≤ 0.001. Statistical significance was determined by unpaired t‐test.
Source data are available online for this figure.
Endothelial‐derived S1P inhibits de novo sphingolipid biosynthesis via S1PRs
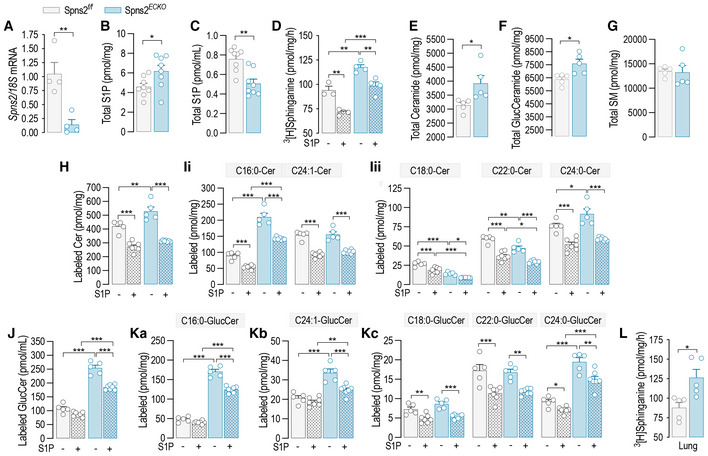
Considering that the deletion of SphK1,2 dramatically upregulated SPT activity (Fig 1I), we hypothesized that S1PR1,3 can be activated in an autocrine manner by locally produced S1P to initiate the negative feedback on SPT. To preserve the formation of intracellular S1P and its degradation by S1P lyase, representing the catabolic exit of the pathway, Spns2, instead of Sphk1,2 genes, was deleted to prevent the transporter‐mediated cellular excretion of S1P (Fig 5A). Consistent with the deletion of S1P transporter, intracellular S1P levels were upregulated (Fig 5B), while the secreted S1P was downregulated (Fig 5C) in Spns2 ECKO vs. Spns2 f/f mEC. Spns2 deletion significantly raised SPT activity, suggesting a constitutive inhibitory function of endogenous S1P on SPT via inside–outside signaling (Fig 5D). Importantly, exogenous S1P was able to downregulate SPT activity in Spns2 ECKO as in Spns2 f/f mEC (Fig 5D), indicating that while the loss of Spns2 disrupted the autocrine S1P signal on SPT, the S1PR‐ORMDL‐SPT signaling pathway was preserved. Consistently with these findings, total ceramides (Figs 5E, and EV5F and G) and glucosylceramides (Figs 5F, and EV5I and J) were upregulated in Spns2 ECKO vs. Spns2 f/f , whereas total sphingomyelin were unchanged (Fig 5G). The measure of sphingolipid flux with isotope‐labeled serine showed that the loss of Spns2 increased the de novo synthesized ceramides (Fig 5H and I) and glucosylceramides (Fig 5J and K) in basal conditions, while preserving the downregulation in response to exogenous S1P (Fig 5H–K), in line with SPT activity data (Fig 5D). Of note, we do not have measurements of labeled sphingomyelins, which would give a more complete picture of the sphingolipid landscape when S1P signaling is disrupted. Lastly, SPT activity was significantly higher in Spns2 ECKO mouse lung microsomes compared to Spns2 f/f (Fig 5L), corroborating the function of SPNS2‐S1P negative feedback on SPT in vivo. These results support an important role of the endothelial‐derived S1P‐S1PR signaling in maintaining sphingolipid homeostasis via stabilization of ORMDL‐SPT complex.
Figure 5. Endothelial‐derived S1P inhibits de novo sphingolipid biosynthesis.
-
ART‐PCR for Spns2 in Spns2 f/f and Spns2 ECKO murine endothelial cell (mEC) after 4‐OHT (1 μM, 72 h) treatment (n = 4 biological replicates).
-
B, C(B) Intracellular and (C) secreted S1P in Spns2 f/f and Spns2 ECKO mEC (n = 8 biological replicates).
-
DSPT activity in Spns2 f/f and Spns2 ECKO , in the absence or presence of S1P (300 nM, 30′) (n ≥ 3/group from two independent EC isolations/group; four mice/EC isolation).
-
E–GLC–MS/MS quantification of Total (E) Ceramide, (F) Glucosylceramide, and (G) sphingomyelin in Spns2 f/f and Spns2 ECKO mEC (n = 5/group from two independent EC isolations/group; four mice/EC isolation).
-
H–KLC–MS/MS quantification of (H) total and (I) specific ceramides, and of (J) total and (K) specific Glucosylceramides labeled with L‐Serine‐13C3, 15N in the absence or presence of S1P (300 nM) (n ≥ 4/group from two independent EC isolations/group; four mice/EC isolation).
-
LSPT activity in microsomes from lung of Spns2 f/f and Spns2 ECKO mice (n = 5 biological replicates).
Data information: β‐ACTIN, loading control. Data are expressed as mean ± SEM. *P ≤ 0.05; **P ≤ 0.01; ***P ≤ 0.001. Statistical significance was determined by unpaired t‐test (A–C, E–G, L), and two‐way ANOVA with Tukey's post‐test (D, H–K).
Source data are available online for this figure.
Ceramide accrual leads to endothelial and mitochondrial disfunction
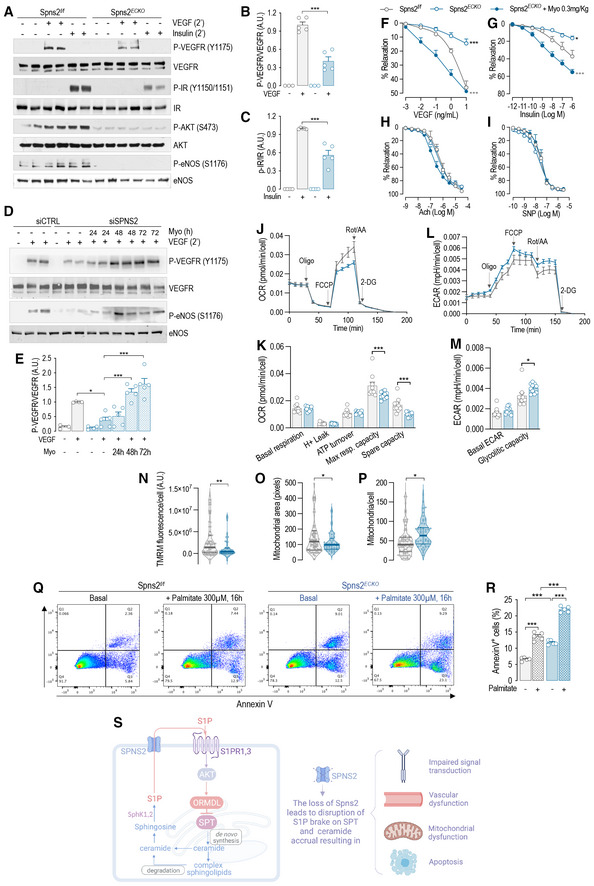
Ceramides regulate membrane biophysical properties, particularly of lipid rafts, important signaling platforms (Kolesnick et al, 2000; Simons & Toomre, 2000; Pinto et al, 2011). Recently, we reported that optimal ceramide levels are necessary to preserve endothelial signal transduction to different agonists, including VEGF and insulin (Cantalupo et al, 2020). The loss of Spns2 disrupted the cellular SL sensing mechanism and increased SL, including ceramides (Fig 5E and F). Thus, to test the hypothesis that in the absence of Spns2 ceramide accrual impairs endothelial signal transduction, we performed a series of experiments in primary mEC in vitro isolated from Spns2 ECKO and Spns2 f/f mice. The activation of both VEGFR2 and insulin receptor (IR), and downstream signaling, were blunted in Spns2 ECKO compared to Spns2 f/f mEC (Fig 6A–C), although the receptor expression was unchanged, suggesting that ceramide accrual in the absence of Spns2 impairs endothelial signal transduction. Interestingly, the inhibition of SPT with myriocin, downregulating ceramide levels, restored VEGF signaling in HUVEC lacking Spns2, confirming ceramide accrual in signal transduction impairment (Fig 6D and E). To further explore the consequences of Spns2 deletion in more physiological setting, we used mesenteric arteries (MA) ex vivo. In line with endothelial signaling data, vasorelaxation to both VEGF (Fig 6F) and insulin (Fig 6G) was significantly diminished in Spns2 ECKO compared Spns2 f/f MA. On the contrary, acetylcholine and sodium nitroprusside (SNP) induced vasorelaxation were not affected by altered ceramide levels (Fig 6H and I), as previously reported (Cantalupo et al, 2020). Interestingly, mouse treatment with myriocin, an inhibitor of SPT, restored VEGF‐ and insulin‐dependent vasorelaxation (Fig 6F and G), consistent with a role of ceramide in endothelial disfunction (Symons & Abel, 2013).
Figure 6. Ceramide accrual leads to endothelial and mitochondrial disfunction.
-
A–C(A) WB analysis of P‐VEGFR2 (Y1175), VEGFR2, P‐IR (Y1150/1151), IR, P‐AKT (S473), AKT, P‐eNOS (S1176), and eNOS in Spns2 f/f and Spns2 ECKO murine endothelial cell (mEC) lysates in the absence or presence of VEGF (100 ng/ml, 2′) or Insulin (1 U/ml, 2′) and (B and C) relative quantification of the indicated phospho/total protein ratios (n ≥ 3 biological replicates).
-
D, E(D) WB analysis of P‐VEGFR2 (Y1175), VEGFR2, P‐eNOS (S1176), and eNOS in Spns2 f/f and Spns2 ECKO mEC lysates in the absence or presence of VEGF (100 ng/ml, 2′), and in the absence or presence of Myriocin (300 nM) for the indicated time and (E) relative quantification of the indicated phospho/total protein ratios (n ≥ 3 biological replicates).
-
F–IVasodilation in response to (F) VEGF, (G) Insulin, (H) acetylcholine, and (I) SNP (Spns2 f/f , n = 3; Spns2ECKO, n = 3; Spns2ECKO + Myo, n = 4 biological replicates).
-
J, K(J) Representative curves of OCR and (K) quantification of OCR metrics in Spns2 f/f and Spns2 ECKO mEC. Oligomycin (Oligo), uncoupler FCCP, rotenone, and antimycin A (Rot/AA) were added at the indicated times (n ≥ 9 biological replicates).
-
L, M(L) Representative curves of ECAR and (M) quantification of ECAR metrics in Spns2 f/f and Spns2 ECKO murine endothelial cell (mEC). Oligomycin (Oligo), uncoupler FCCP, rotenone, and antimycin A (Rot/AA) were added at the indicated times (n ≥ 9 biological replicates).
-
N–P(N) TMRM fluorescence, (O) mitochondrial area, and (P) number of mitochondria per cells, as quantified by TMRM and Hoechst fluorescence.
-
Q, R(Q) Representative dot‐plot diagrams and ® relative quantification of Spns2 f/f and Spns2 ECKO mEC, in the absence or presence of Palmitate (300 μM, 16 h), stained with Annexin V and analyzed by FACS (n ≥ 5 biological replicates).
-
SGraphical abstract of the figure findings.
Data information: Data are expressed as mean ± SEM. *P ≤ 0.05; **P ≤ 0.01; ***P ≤ 0.001; °°°P ≤ 0.001. *Spns2 f/f vs. Spns2 ECKO , °Spns2 ECKO vs. Spns2 ECKO + Myo. Statistical significance was determined by two‐way ANOVA with Tukey's post‐test (B, C, E, F–I, R) and unpaired t‐test (K, M–P).
Source data are available online for this figure.
Multiple lines of evidence have shown that ceramide accrual is causal of mitochondrial dysfunction, oxidative stress (Corda et al, 2001; Kogot‐Levin & Saada, 2014), and apoptosis (Dadsena et al, 2019). Loss of Spns2 resulted in decreased maximal respiration and reduced spare respiratory capacity (Fig 6J and K). Extracellular acidification rate (ECAR), an indirect index of mitochondrial dysfunction, suggests an increased ability to upregulate aerobic glycolysis upon the loss of mitochondrial ATP production caused by inhibition of the ATPase by oligomycin (Fig 6L and M). Spns2 ECKO EC showed decreased membrane potential (Fig 6N), smaller mitochondrial size (Fig 6O), and increased number of mitochondria per cell (Fig 6P), as assessed by TMRM staining. Altogether, these findings suggest a respiratory chain dysfunction that result in lower mitochondrial polarization, fragmentation of mitochondria and adaptive changes in glycolysis as an alternate source of energy production, supporting the concept that Spns2 deletion increases sphingolipid de novo biosynthesis and ceramide levels, hence the susceptibility of the cells to metabolic stress.
Next, we investigated whether the ceramide accrual in the absence of Spns2 heightens the susceptibility of the EC to apoptosis induced by palmitate, substrate of SPT. In Spns2 ECKO EC baseline, apoptosis was increased to the same extent of palmitate‐induced apoptosis in Spns2 f/f EC. The loss of Spns2 dramatically increased the apoptosis induced by palmitate (Fig 6Q and R).
Altogether, these results show that disruption of S1P‐S1PR‐ORMDL negative feedback on SPT results in unrestricted levels of SL, including ceramides, triggering mitochondrial dysfunction, apoptosis, and impaired vascular tone regulation, which all underline endothelial dysfunction, an early event in the pathogenesis of cardiovascular diseases, including atherosclerosis (Fig 6S).
Discussion
SL, a minor class of mammalian lipids, have gained much attention because emerging pre‐clinical and clinical evidences established a strong link between altered sphingolipid homeostasis and diseases (Sasset et al, 2016; Choi et al, 2021), including atherosclerosis (Sattler et al, 2014), coronary artery disease (Sattler et al, 2010), myocardial infarction (Knapp et al, 2009), heart failure (Yu et al, 2015; Ji et al, 2017), hypertension (Spijkers et al, 2011), and type 2 diabetes (Haus et al, 2009; Wigger et al, 2017). However, how cells sense sphingolipid levels and regulate their biosynthesis accordingly remains poorly understood. Because SPT catalyzes the rate‐limiting step of the pathway, there has been much effort in understanding how this enzyme is modulated in response to cellular sphingolipid levels. In this study, we identified a sensing mechanism used by EC to maintain sphingolipid homeostasis and assure proper cellular functions. Our study discovered S1P as the specific SL metabolite sensed by the cells; S1P actions downregulate SPT activity via S1PR/ORMDL negative feedback to maintain sphingolipid homeostasis.
In yeast, the phosphorylation of Orms releases the interaction with SPT, resulting in upregulation of sphingolipid de novo biosynthesis (Breslow et al, 2010). It has been demonstrated that Orm2 phosphorylation triggers its export from the ER, followed by ubiquitination in the Golgi and endosomes, extraction from the membranes by p97, and proteasomal degradation (Schmidt et al, 2019). However, mammalian orthologs ORMDLs lack the N‐terminus hosting the phosphosites (Hjelmqvist et al, 2002). Differently from Orm, our study suggests that ORMDL hydroxylation function as a “go” signal for proteasomal degradation. Considering that sphingolipid homeostasis is necessary to preserve cellular functions and health, it is conceivable that complex regulatory mechanisms exist to regulate SPT‐ORMDL interactions in response to metabolic and environmental cues, at transcriptional, translational, and post‐translational levels. For instance, inflammatory stimuli and changes in SL can upregulate the transcription (Miller et al, 2012) and the translation (Gupta et al, 2015) of ORMDLs, respectively, although the underlying molecular mechanisms remain unknown. Previous works from Wattenberg's group (Siow & Wattenberg, 2012; Davis et al, 2019b), using cell‐free isolated membranes or permeabilized cells, suggested that the addition of C6:0‐ and C8:0‐ceramide (10‐20 μM), as well as boosting native chain‐length ceramide levels using the endogenous ceramide synthases, can acutely downregulate SPT activity, probably by interacting with the SPT‐ORMDLs complex. However, by using multiple genetic and pharmacological strategies our data showed that when S1P formation was inhibited, ceramide was no longer able to modulate SPT activity.
ORMDLs have a relatively short half‐life (ca. 1.7 h, Fig 3A, G, and H). Mechanistically, our data show that PHD‐mediated hydroxylation of Pro137 enforces a constitutive degradation of ORMDLs via ER‐associated degradation and ubiquitin‐proteasome pathway (Fig 3K), hence preserving a steady‐state SPT activity. Upregulation of S1P signaling inhibits PHD‐mediated Pro137 hydroxylation, resulting in ORMDLs stability and downregulation of SPT activity. More importantly, we have directly identified the hydroxylation of P137 of ORMDL3 by mass spectrometry analysis (Fig EV3), confirming that this post‐translational modification of ORMDL3 occurs in cells. It has been reported that PHD activation can be inhibited by AKT by different means (Pore et al, 2006; Spinella et al, 2010; Tan et al, 2014). Interestingly, S1P‐mediated PHD inhibition was, at least in part, mediated by AKT signaling, in agreement with previous studies. Considering the proposed structure of ORMDLs (Davis et al, 2019a), P137 has been predicted to be the penultimate amino acid in the second transmembrane domain, which does not necessarily preclude the accessibility of this amino acids by PHDs. For instance, enzymatic‐mediated palmitoylation of cysteines located inside or close to the transmembrane domain has been shown for several proteins (Charollais & Van Der Goot, 2009). Furthermore, it is conceivable that this sensing‐effector mechanism that maintains sphingolipid homeostasis is not only functional in the EC but also in other cell types. Further studies are needed to explore this possibility.
S1P is known to induce barrier function (Burg et al, 2018), NO production (Cantalupo et al, 2015, 2017; Cantalupo & Di Lorenzo, 2016), as well as cell migration and survival. In addition to known functions, our study discovered that a fundamental function of S1P is to maintain sphingolipid homeostasis via S1PR‐ORMDL negative feedback on SPT. Genetic and pharmacological disruption of endothelial S1P autocrine signaling at multiple levels, including Sphks, Spns2, and S1prs, support the direct role of S1P‐S1PR signaling in modulating SPT activity via stabilization of ORMDLs. However, we cannot completely exclude potential pleiotropic effects when adding lipids (i.e., C16:0‐cer), using inhibitors, or knocking‐out the enzymes (i.e., Sphks) of the pathway. How cells can sense SL has been a longstanding question. Our findings identified S1P‐S1PR as the sensor‐effector unit by which cells can sense SL and maintain homeostasis by a nimble modulation of SPT activity via ORMDLs.
The disruption of S1P negative feedback on SPT leads to uncontrolled sphingolipid de novo biosynthesis and ceramide accumulation, resulting in mitochondrial dysfunction, apoptosis, and impaired signal transduction and endothelial‐regulated vascular tone, which are all manifestations of endothelial dysfunction, an early event in the onset of cardiovascular diseases, including atherosclerosis and hypertension. Postnatally, the disruption of S1P signaling results in permeability (Burg et al, 2018), hypertension (Cantalupo et al, 2017; Del Gaudio et al, 2021), atherosclerosis (Galvani et al, 2015), and heart failure (Zhang et al, 2016), as result of the loss of S1P biological actions, including the enhancement of endothelial barrier functions and NO production, and downregulation of NFkB pathway (Galvani et al, 2015). In addition to these canonical cardiovascular functions, our data identified a novel fundamental function of S1P which is to maintain sphingolipid homoeostasis and protect the cells from a “metabolic catastrophe” due to uncontrolled ceramide accrual, causing cellular and organ dysfunctions.
The clinical significance of this signaling mechanisms is also underlined by the correlation of single nucleotide polymorphisms in SphK1 (Shendre et al, 2017), S1pr1 (Obinata et al, 2014), and Ormdl3 (Ma et al, 2015) with the risk of atherosclerosis. Genetic deletion of endothelial S1pr1 in mice significantly elevated BP (Cantalupo et al, 2017). Interestingly, chronic administration fingolimod, a functional antagonist of S1PR1 approved by the FDA for the treatment of relapsing remitting multiple sclerosis (Kappos et al, 2006), also significantly increased BP, in line with the loss endothelial S1pr1 (Cantalupo et al, 2017). Our findings suggest that an additional biological consequence of fingolimod on‐target actions on S1PRs is the disruption of S1P negative signaling on SPT, and therefore the homeostasis of SL, at least in cell type expressing high levels of S1PR1, such as endothelial and immune cells (Lee et al, 1999; Rivera et al, 2008). Further studies are needed to investigate the impact of fingolimod on sphingolipid sensing and homeostatic pathway of the cells.
This study reveals a novel mechanism by which cells can sense SL and regulate sphingolipid biosynthesis accordingly. S1P is the metabolite sensed by the cells to downregulate SPT activity via S1PR‐ORMDL signaling. Whether the disruption of this negative feedback plays a role in the pathogenesis human diseases remains to be investigated.
Materials and Methods
Mouse models
We generated conditional mouse model lacking endothelial S1PR1, namely S1pr1 ECKO ; lacking endothelial SphK1,2, namely SphK1,2 ECKO ; and lacking endothelial Spns2, namely Spns2 ECKO . S1pr1 f/f (floxed S1pr1) (Allende et al, 2003), SphK1,2 f/f (floxed SphK1,2) (Xiong et al, 2013), and Spns2 f/f (floxed Spns2) (Mendoza et al, 2012) mice were crossed with transgenic mice in which the VE‐cadherin promoter drives expression of tamoxifen‐responsive Cre (VE‐Cad‐CreERT2), such that tamoxifen treatment selectively deletes the loxP‐flanked (floxed) region of S1pr1 in ECs (Wang et al, 2010b). S1pr1 ECKO and S1pr1 f/f , and SphK1,2 ECKO and SphK1,2 f/f were used only for isolation of mouse liver EC. To delete Sptlc2 in EC, 7‐ to 8‐week‐old male mice were injected intraperitoneally with 20 mg/kg of tamoxifen daily for 5 consecutive days. All animal experiments were approved by the Weill Cornell Institutional Animal Care and Use Committee.
Isolation of mouse liver EC
Liver ECs, but not lung and heart EC, are responsive to 4‐hydroxytamoxyfen‐induced gene excision in vitro. Four‐week‐old female and male mice were used to isolate EC. Briefly, livers were cut into small pieces and incubated in a solution of 2 mg/ml collagenase I (Alfa Aesar, #J62406), 1 U/ml dispase (Stemcell Technologies, #07913), and 100 μg/ml DNase I (Roche, # 10104159001), followed by mechanical dissociation. ECs were isolated with CD144 antibody‐conjugated dynabeads (CD144 antibody, BD bioscience, #555289; dynabeads, ThemoFisher Scientific, #11035). Isolated ECs were cultured in dulbecco's modified eagle medium (DMEM) (Lonza, #12709‐F) with 20% fetal bovine serum (FBS; R&D Systems, #S11150H), 100 μg/ml heparin (Sigma, #H3393), and 25 μg/ml ECGF (Alfa Aesar, #J64516). For gene excision, EC were treated with 1 μM 4‐hydroxytamoxyfen (Cayman Chemical, #14854) for three consecutive days. Before treatment with S1P (300 nM, 30 min; Cayman Chemical, #62570), C16:0‐ceramide (300 nM, 30 min; Avanti, #868516), VEGF (100 ng/mL, 2 min; Peprotech, #100‐20), or Insulin (1 U/ml, 2 min), EC were cultured in DMEM with 10% Charcoal‐Stripped FBS for 18 h, followed by 6 h starvation in DMEM with 0.1% Charcoal‐Stripped FBS.
Experimental protocol with HUVEC
HUVEC (LifeLine Cell Technology, cat# FC‐0044) were grown in EBM‐2 (Lonza, cat# CC‐3156) and supplemented with EGM‐2 Endothelial Cell Growth Medium‐2 BulletKit (Lonza, cat# CC‐3162) and 10% FBS. Before treatment, HUVEC were cultured in EBM‐2 with 10% Charcoal‐Stripped FBS for 18 h, followed by 6 h starvation in EMB‐2 with 0.1% Charcoal‐Stripped FBS. The following treatments were used: S1P (300 nM, 30 min), C16:0‐Ceramide (300 nM, 30 min), SKI II (Gao et al, 2012) (1 μM, 30 min before C16:0‐Cer. Cayman Chemical, #10009222); SB203580 (5 μM, 1 h. Cayman Chemical, #13067); SP600125 (5 μM, 1 h. Cayman Chemical, #10010466); GSK1120202 (1 μM, 1 h. Cayman Chemical, #16292); LY294002 (10 μM, 1 h. Cayman Chemical, #70920); CHX (10 μM, for the indicated time. Cayman Chemical, #14126), SEW2871 (300 nM, 15 min or 30 min. Cayman Chemical, #10006440) DMOG (Jaakkola et al, 2001) (1 mM, 1 h. Cayman Chemical, #72210), EER1 (Wang et al, 2010a) (EER1, 10 μM, 1 h. Cayman Chemical, #10012609); MG132 (10 μM, 1 h. Cayman Chemical, #13697), P‐FTY720 (100 nM, 60 min. Cayman Chemical, #10008639).
SPT activity assay
SPT activity in and HUVEC and EC was measured as previously described (Cantalupo et al, 2020). Briefly, the assay was conducted in 0.1 ml of SPT reaction buffer composed by: 0.1 M HEPES pH 8.3, 5 mM DTT, 2.5 mM ethylenediaminetetraacetic acid (EDTA), 50 μM pyridoxal 5′‐phosphate (Sigma, #P9255), 0.45 μM [3H]serine (American Radiolabeled Chemicals, #0246), 0.2 mM palmitoyl‐CoA (Sigma, #P9715), and 150 μg of protein lysates. After 15 min at 37°C, the reaction was stopped with NH4OH and the reaction product 3‐ketosphinganine converted into sphinganine with NaBH4 (5 mg/ml). Radiolabeled lipids were extracted using a modified Bligh and Dyer's method, dissolved in CHCl3 and analyzed by thin‐layer chromatography.
Western blot analysis
RIPA buffer cell lysates were analyzed with sodium dodecyl sulfate–polyacrylamide gel electrophoresis (SDS‐PAGE) and immunoblotting, as previously reported (Cantalupo et al, 2020). The following primary antibodies were used for WB analysis: S1P1 (ABclonal, #A12935); ORMDL3 (Millipore, #ABN417); NOGO‐B (SCBT, #sc‐11027); SPTCL1 and eNOS (BD Biosciences, #611305 and #610297, respectively); SPTLC2 (ABclonal, #A11716); HA, Ubiquitin‐K48, P‐IR (Y1150/1151), IR, P‐VEGFR2 (Y1175), VEGFR2, P‐eNOS (S1177), P‐AKT (S473), and AKT (Cell Signaling Technology, #3724, #4289, #3024, #3020, #2478, #2479, #9571, #4058, and #2920, respectively); β‐ACTIN (ThermoFisher Scientific, #AM4302). Western blots are representative of three or more independent experiments.
Knockdown by siRNA transfection
siRNA targeting Nogo‐B (sense: 5′‐GACUGGAGUGGUGUUUGGUUU‐3′, antisense: 5′‐ACCAAACACCACUCCAGUCUU‐3′); ORMDL1 (sense: 5′‐CUCAUUGGGAACAACUGGAUU‐3′, antisense: 5′‐UCCAGUUGUUCCCAAUGAGUU‐3′); ORMDL2 (sense: 5′‐CUUCCUUCAUACGGUGAA AUU‐3′, antisense: 5′‐UUUCACCGUAUGAAGGAAGUU‐3′); ORMDL3 (sense: 5′‐UUCUACACUAAGUACGACCUU‐3′, antisense: 5′‐GGUCGUACUUAGUGUAGAAUU‐3′); S1PR3 (sense: 5′‐GCUCCAGUAACAACAGCAGUU‐3′, antisense: 5′‐CUGCUGUUGUUACUGGAGCUU‐3′), and control (sense: 5′‐UUCUCCGAACGUGUCACG‐3′, antisense: 5′‐ACGUGACACGUUCGGAGAA‐3′); SPNS2 (sense: 5′‐GCCCAAGUUGUGCAGAAGAUU‐3′, antisense: 5′‐UCUUCUGCACAACUUGGGCUU‐3′) were synthesized by Dharmacon. HUVEC or mEC were transfected with 40 nM of siRNA using DharmaFECT 4 transfection reagent (Dharmacon, #T‐2004). mRNA or protein expression and relative assays were performed 72 h after transfection.
Real‐time PCR (RT‐PCR) analysis of mEC
Total RNA from EC in culture was extracted according to the TRIzol reagent protocol (ThermoFisher Scientific, #15596026). Maxima First Strand cDNA Synthesis Kit (ThermoFisher Scientific, #K1641) was used for the reverse transcription of 100 ng of RNA. For RT‐PCR analysis PowerUp™ SYBR™ Green Master Mix (ThemoFisher Scientific, #A25779) and Applied Biosystems 7500 Fast RT PCR system were used. Primers set were: SphK1 (5′‐AGGTGGTGAATGGGCTAATG‐3′ and 5′‐TGCTCGTACCCAGCATAGTG‐3′); SphK2 (5′‐TGGTGCCAATGATCTCTGAA‐3′ and 5′‐CCAGACACAGTGACAATGCC‐3′); ORMDL1 (5′‐CATAGCCGGTTGAAGCAGAC‐3′ and 5′‐ACGTTGACTCAGAGCCTTGA‐3′): ORMDL2 (5′‐CCAAGTACGATGCTGCTCAC‐3′ and 5′‐TTCCAGTGCCTTCCCTCAAT‐3′); ORMDL3 (5′‐ACTGAGGTTGTAGCCCCTTC‐3′ and 5′‐ACCCTAACCCCACTACAAGC‐3′); S1PR3 (5′‐GCTTCATCGTCTTGGAGAACCTG‐3′ and 5′‐CAGAGAGCCAAGTTGCCGATGA‐3′); Spns2 (5′‐AGAAGCCGCATCCTCAGTTAGC‐3′ and 5′‐CAGGCCAGAATCTCCCCAAATC‐3′); 18S (5′‐TTCCGATAACGAACGAGACTCT‐3′ and 5′‐TGGCTGAACGCCACTTGTC‐3′). Gene of interest relative mRNA expression was calculated with the 2(−ΔΔCt) method, using 18S as housekeeping (Livak & Schmittgen, 2001).
Lentivirus construction
Human HA‐tagged ORMDL3 (NCBI AAM43507.1) and the mutant P137A were synthesized by Genewiz and inserted in the lentiviral vector pCDH‐CMV‐MCS‐EF1‐Puro (Addgene). Lentiviral particles containing the construct encoding HA‐ORMDL3‐WT and HA‐ORMDL3‐P137A were produced in HEK293T cells transfected with calcium phosphate technique. Viral particles were harvested from the culture supernatant 72 h after transfection, passed through a 0.45 μm filter and concentrated by adding a virus precipitation solution (40% PEG8000 and 2.5 M NaCl) overnight at 4°C, followed by centrifugation at 1,500 g for 30 min. Viral pellets were resuspended in DMEM and stored at −80°C until use.
Immunoprecipitation
To asses ubiquitination, 293T cells were co‐transfected with plasmid expressing Ub‐GFP (gift from Nico Dantuma; Addgene plasmid #11928; http://n2t.net/addgene:11928; RRID:Addgene_11928) and HA‐ORMDL3‐WT or HA‐ORMDL3‐P137A. After 48 h, cells were lysed and HA‐ORMDL3 was immunoprecipitated with antibody against HA (Cell Signaling Technology, #3724) in modified RIPA buffer (50 mM Tris–HCl pH 7.2, 150 mM NaCl, 1% NP40, 0.5% SDS, 5.0 mM NaF, 1.0 mM Na3VO4, and protease inhibitors) at 4°C o.n. The immune complexes were precipitated with Dynabeads protein G (#10003D, Invitrogen, for 1.5 h at 4°C) and size‐fractionated on SDS‐PAGE gels. Ubiquitin was detected with Ubiquitin‐K48 antibody (Cell Signaling Technology, #4289).
Identification of proline hydroxylation
293T cells were transfected with the plasmid expressing HA‐ORMDL3. After 48 h, cells were treated overnight with 10 μM MG132 and the day after HA‐ORMDL3 was immunoprecipitated as described in the previous paragraph. After SDS‐PAGE, the band corresponding in size to HA‐ORMDL3 was cut and sent to the Proteomics and Metabolomics Facility of Cornell University. Gel band was digested with trypsin and analyzed on Orbitrap Fusion using CID fragmentation method to acquire the raw file. The raw file was searched against the Homo Sapiens Uniprot databases, with added HA‐ORMDL3 protein sequence, which contains 26,020 sequences. Oxidation of M, deamidation of N and Q, hydroxylation on P were specified as dynamic modifications of amino acid residues; protein N‐terminal acetylation, Met‐loss, and Met‐loss+acetyl were set as variable modifications; carbamidomethyl C was specified as static modifications.
Microsomal isolation from mouse lung
Microsomal fractions were obtained from Spns2 f/f and Spns2 ECKO lungs as previously described (Cantalupo et al, 2015). Briefly, lungs were homogenized with liquid nitrogen in microsomal preparation buffer (50 mM HEPES pH 7.4, 0.25 M sucrose, and 5 mM EDTA). The homogenates were centrifuged for 15 min at 18,000 g at 4°C, and the resulting supernatants were ultracentrifuged for 1 h at 100,000 g at 4°C. The microsomal pellets were then resuspended by adding 0.25 ml of SPT reaction buffer.
Measurement of sphingolipid flux using stable isotopes
Confluent EC were switched to DMEM lacking L‐Serine for 2 h. The cells were then switched to DMEM containing 0.45 mM L‐serine‐13C3,15N (Sigma, #608130) and 300 μM palmitate, with or without 300 nM S1P for 3 h. The reaction was thereafter washed with phosphate‐buffered saline, trypsinized and the cell pellet stored at −80°C. Lipids were thereafter extracted and total and labeled sphingolipids analyzed by mass spectrometry at the University of Utah metabolomics core, as previously described (Chaurasia et al, 2019).
Flow cytometric determination of apoptosis by annexin V/propidium iodide staining
Cells were analyzed for phosphatidylserine exposure by an Annexin‐V FITC/Propidium Iodide double‐staining method, according to the manufacturer instruction (Abcam, #ab14085). Spns2 f/f and Spns2 ECKO cells were treated with vehicle or C6:0‐ceramide (30 μM, 8 h; Avanti, #860506), stained, acquired with BD FACSymphony Flow Cytometer, and analyzed with FlowJo software.
Vascular reactivity studies
At 2‐week post‐tamoxifen treatment, second‐order MAs were harvested, cleaned from adhering tissue and mounted on glass micropipettes in a wire myograph chamber (Danish MyoTechnology, Aarhus, Denmark). Vessels were maintained in Krebs solution (Cantalupo et al, 2015, 2020). MA were equilibrated for 15 min at 80 mmHg, pre‐constricted with PE (1 μM) and a cumulative concentration–response curve of Ach (0.1 nM to 30 μM) was performed to evaluate the endothelial function. The following concentration‐response curves were performed: insulin (pU/ml to 3 μU/ml), VEGF (1 μg/ml to 30 mg/ml), and sodium nitroprussiate (SNP, 10 nM to 30 μM). Where indicated, mice were treated with myriocin 0.3 mg/kg i.p. for two consecutive days before the experiment.
Seahorse
Oxygen consumption rate (OCR) and ECAR was measured with a XF96 Extracellular Flux Analyzer (Agilent Technologies, Santa Clara, CA, USA). mECs were plated a density of 1.5 × 10⁴ cells/well in 200 μl of DMEM and incubated for 24 h at 37°C in 5% CO2. After replacing the growth medium with 200 μl of XF Assay Medium (Seahorse Bioscience, 103575‐100) supplemented with 5 mM glucose, 1 mM pyruvate and 2 mM GlutaMAX (Gibco), pre‐warmed at 37°C, cells were preincubated for 1 h before starting the assay procedure. OCR and ECAR were recorded at baseline, in the presence of 1 μM oligomycin, 2 μM carbonyl cyanide 4‐trifluoromethoxyphenylhydrazone (FCCP), 0.5 μM Antimycin A (AA) plus 0.5 μM Rotenon (Rot) and in the presence of 25 mM 2‐Deoxy‐D‐glucose sequentially. Non‐mitochondrial respiration (in the presence of AA+Rot) was subtracted from all rates. Following the experiment cell nuclei were stained with 1 μM Hoechst 33342 (Thermo), imaged with an ImageXpress pico (Molecular Devices, San Jose, CA, USA) and counted. OCR and ECAR were normalized by the cell counts. Respiratory and glycolysis parameters were quantified by subtracting respiration rates at times before and after the addition of electron transport chain inhibitors according to Seahorse Bioscience. Basal respiration: baseline respiration minus (AA+Rot)‐dependent respiration; H+ leak, Oligo‐dependent respiration minus (AA+Rot)‐dependent respiration; ATP turnover, baseline respiration minus oligo‐dependent respiration; Max respiratory capacity: FFCP‐dependent respiration minus (AA+Rot)‐dependent respiration; Spare capacity: Max respiratory capacity minus Basal respiration. Basal glycolysis: basal ECAR minus non‐glycolitic acidification; Glycolitic capacity: maximal ECAR after oligo minus non‐glycolytic acidification.
Mitochondrial membrane potential and morphology
For the measurements of mitochondrial membrane potential number, mECs were seeded at the density of 2 × 10³ cells/well in a 96‐well glass bottom tissue culture plate (Cellvis P96‐1.5H‐N) in 200 μl of DMEM and incubated for 24 h at 37°C in 5% CO2. Cells were loaded with 15 nM tetramethylrhodamine methyl ester (TMRM, 544ex; 590em, Life Technologies) and 1 μM Hoechst 33342 for 30 min at 37°C in Krebs buffer. TMRM and Hoechst fluorescence were imaged with an ImageXpress pico. Subsequently, 5 μM FCCP was added to record background fluorescence. ~ 50 cells were segmented manually using ImageJ. Background TMRM fluorescence was subtracted from baseline fluorescence. Mitochondria were segmented and counted in each cell using adaptive thresholding.
Statistical analysis
Two‐way ANOVA with Tukey's post‐test, or Student t test were used for the statistical analysis as indicated in figure legends. Differences were considered statistically significant when P < 0.05. GraphPad Prism software (version 9.0, GraphPad Software, San Diego, CA) was used for all statistical analysis.
Author contributions
Linda Sasset: Conceptualization; data curation; formal analysis; investigation; methodology; writing – original draft; writing – review and editing. Kamrul H Chowdhury: Data curation; formal analysis; investigation; methodology. Onorina L Manzo: Formal analysis; investigation; methodology. Luisa Rubinelli: Methodology. Csaba Konrad: Conceptualization; data curation; formal analysis; methodology. J Alan Maschek: Formal analysis; methodology. Giovanni Manfredi: Conceptualization; formal analysis; supervision; writing – original draft. William L Holland: Conceptualization; data curation; supervision; investigation; writing – review and editing. Annarita Di Lorenzo: Conceptualization; supervision; funding acquisition; writing – original draft; project administration; writing – review and editing.
Disclosure and competing interests statement
The authors declare that they have no conflict of interest.
Supporting information
Expanded View Figures PDF
Source Data for Expanded View
PDF+
Source Data for Figure 1
Source Data for Figure 2
Source Data for Figure 3
Source Data for Figure 4
Source Data for Figure 5
Source Data for Figure 6
Acknowledgments
This work was supported by the National Heart, Lung, and Blood Institute of the National Institutes of Health grants R01 HL126913 and R01 HL152195 to ADL, and by the National Institute of Neurological Disorders and Stroke 5R35NS122209 to GM.
EMBO Reports (2023) 24: e54689.
Data availability
No data were deposited in a public database.
References
- Allende ML, Yamashita T, Proia RL (2003) G‐protein‐coupled receptor S1P1 acts within endothelial cells to regulate vascular maturation. Blood 102: 3665–3667 [DOI] [PubMed] [Google Scholar]
- Breslow DK, Collins SR, Bodenmiller B, Aebersold R, Simons K, Shevchenko A, Ejsing CS, Weissman JS (2010) Orm family proteins mediate sphingolipid homeostasis. Nature 463: 1048–1053 [DOI] [PMC free article] [PubMed] [Google Scholar]
- Burg N, Swendeman S, Worgall S, Hla T, Salmon JE (2018) Sphingosine 1‐phosphate receptor 1 signaling maintains endothelial cell barrier function and protects against immune complex‐induced vascular injury. Arthritis Rheumatol 70: 1879–1889 [DOI] [PMC free article] [PubMed] [Google Scholar]
- Cantalupo A, Di Lorenzo A (2016) S1P signaling and de novo biosynthesis in blood pressure homeostasis. J Pharmacol Exp Ther 358: 359–370 [DOI] [PMC free article] [PubMed] [Google Scholar]
- Cantalupo A, Zhang Y, Kothiya M, Galvani S, Obinata H, Bucci M, Giordano FJ, Jiang XC, Hla T, Di Lorenzo A (2015) Nogo‐B regulates endothelial sphingolipid homeostasis to control vascular function and blood pressure. Nat Med 21: 1028–1037 [DOI] [PMC free article] [PubMed] [Google Scholar]
- Cantalupo A, Gargiulo A, Dautaj E, Liu C, Zhang Y, Hla T, Di Lorenzo A (2017) S1PR1 (Sphingosine‐1‐phosphate receptor 1) signaling regulates blood flow and pressure. Hypertension 70: 426–434 [DOI] [PMC free article] [PubMed] [Google Scholar]
- Cantalupo A, Sasset L, Gargiulo A, Rubinelli L, Del Gaudio I, Benvenuto D, Wadsack C, Jiang X‐C, Bucci MR, Di Lorenzo A (2020) Endothelial sphingolipid de novo synthesis controls blood pressure by regulating signal transduction and NO via ceramide. Hypertension 75: 1279–1288 [DOI] [PMC free article] [PubMed] [Google Scholar]
- Cartier A, Hla T (2019) Sphingosine 1‐phosphate: lipid signaling in pathology and therapy. Science 366: eaar5551 [DOI] [PMC free article] [PubMed] [Google Scholar]
- Charollais J, Van Der Goot FG (2009) Palmitoylation of membrane proteins (review). Mol Membr Biol 26: 55–66 [DOI] [PubMed] [Google Scholar]
- Chaurasia B, Tippetts TS, Mayoral Monibas R, Liu J, Li Y, Wang L, Wilkerson JL, Sweeney CR, Pereira RF, Sumida DH et al (2019) Targeting a ceramide double bond improves insulin resistance and hepatic steatosis. Science 365: 386–392 [DOI] [PMC free article] [PubMed] [Google Scholar]
- Choi RH, Tatum SM, Symons JD, Summers SA, Holland WL (2021) Ceramides and other sphingolipids as drivers of cardiovascular disease. Nat Rev Cardiol 18: 701–711 [DOI] [PMC free article] [PubMed] [Google Scholar]
- Corda S, Laplace C, Vicaut E, Duranteau J (2001) Rapid reactive oxygen species production by mitochondria in endothelial cells exposed to tumor necrosis factor‐alpha is mediated by ceramide. Am J Respir Cell Mol Biol 24: 762–768 [DOI] [PubMed] [Google Scholar]
- Dadsena S, Hassan DG, Holthuis JCM (2019) Unraveling the molecular principles by which ceramides commit cells to death. Cell Stress 3: 280–283 [DOI] [PMC free article] [PubMed] [Google Scholar]
- Davis D, Suemitsu J, Wattenberg B (2019a) Transmembrane topology of mammalian ORMDL proteins in the endoplasmic reticulum as revealed by the substituted cysteine accessibility method (SCAM). Biochim Biophys Acta Proteins Proteomics 1867: 382–395 [DOI] [PMC free article] [PubMed] [Google Scholar]
- Davis DL, Gable K, Suemitsu J, Dunn TM, Wattenberg BW (2019b) The ORMDL/Orm‐serine palmitoyltransferase (SPT) complex is directly regulated by ceramide: reconstitution of SPT regulation in isolated membranes. J Biol Chem 294: 5146–5156 [DOI] [PMC free article] [PubMed] [Google Scholar]
- Dawkins JL, Hulme DJ, Brahmbhatt SB, Auer‐Grumbach M, Nicholson GA (2001) Mutations in SPTLC1, encoding serine palmitoyltransferase, long chain base subunit‐1, cause hereditary sensory neuropathy type I. Nat Genet 27: 309–312 [DOI] [PubMed] [Google Scholar]
- Dederer V, Lemberg MK (2021) Transmembrane dislocases: a second chance for protein targeting. Trends Cell Biol 31: 898–911 [DOI] [PubMed] [Google Scholar]
- Del Gaudio I, Rubinelli L, Sasset L, Wadsack C, Hla T, Di Lorenzo A (2021) Endothelial Spns2 and ApoM regulation of vascular tone and hypertension via Sphingosine‐1‐phosphate. J Am Heart Assoc 10: e021261 [DOI] [PMC free article] [PubMed] [Google Scholar]
- Galvani S, Sanson M, Blaho VA, Swendeman SL, Obinata H, Conger H, Dahlback B, Kono M, Proia RL, Smith JD et al (2015) HDL‐bound sphingosine 1‐phosphate acts as a biased agonist for the endothelial cell receptor S1P1 to limit vascular inflammation. Sci Signal 8: ra79 [DOI] [PMC free article] [PubMed] [Google Scholar]
- Gao P, Peterson YK, Smith RA, Smith CD (2012) Characterization of isoenzyme‐selective inhibitors of human sphingosine kinases. PLoS One 7: e44543 [DOI] [PMC free article] [PubMed] [Google Scholar]
- Guo J, Chakraborty AA, Liu P, Gan W, Zheng X, Inuzuka H, Wang B, Zhang J, Zhang L, Yuan M et al (2016) pVHL suppresses kinase activity of Akt in a proline‐hydroxylation‐dependent manner. Science 353: 929–932 [DOI] [PMC free article] [PubMed] [Google Scholar]
- Gupta SD, Gable K, Alexaki A, Chandris P, Proia RL, Dunn TM, Harmon JM (2015) Expression of the ORMDLS, modulators of serine palmitoyltransferase, is regulated by sphingolipids in mammalian cells. J Biol Chem 290: 90–98 [DOI] [PMC free article] [PubMed] [Google Scholar]
- Han G, Gupta SD, Gable K, Niranjanakumari S, Moitra P, Eichler F, Brown RH Jr, Harmon JM, Dunn TM (2009) Identification of small subunits of mammalian serine palmitoyltransferase that confer distinct acyl‐CoA substrate specificities. Proc Natl Acad Sci U S A 106: 8186–8191 [DOI] [PMC free article] [PubMed] [Google Scholar]
- Haus JM, Kashyap SR, Kasumov T, Zhang R, Kelly KR, Defronzo RA, Kirwan JP (2009) Plasma ceramides are elevated in obese subjects with type 2 diabetes and correlate with the severity of insulin resistance. Diabetes 58: 337–343 [DOI] [PMC free article] [PubMed] [Google Scholar]
- Hipp MS, Kasturi P, Hartl FU (2019) The proteostasis network and its decline in ageing. Nat Rev Mol Cell Biol 20: 421–435 [DOI] [PubMed] [Google Scholar]
- Hisano Y, Kobayashi N, Yamaguchi A, Nishi T (2012) Mouse SPNS2 functions as a Sphingosine‐1‐phosphate transporter in vascular endothelial cells. PLoS One 7: e38941 [DOI] [PMC free article] [PubMed] [Google Scholar]
- Hjelmqvist L, Tuson M, Marfany G, Herrero E, Balcells S, Gonzalez‐Duarte R (2002) ORMDL proteins are a conserved new family of endoplasmic reticulum membrane proteins. Genome Biol 3: RESEARCH0027 [DOI] [PMC free article] [PubMed] [Google Scholar]
- Hojjati MR, Li Z, Jiang XC (2005) Serine palmitoyl‐CoA transferase (SPT) deficiency and sphingolipid levels in mice. Biochim Biophys Acta 1737: 44–51 [DOI] [PubMed] [Google Scholar]
- Jaakkola P, Mole DR, Tian YM, Wilson MI, Gielbert J, Gaskell SJ, von Kriegsheim A, Hebestreit HF, Mukherji M, Schofield CJ et al (2001) Targeting of HIF‐alpha to the von Hippel‐Lindau ubiquitylation complex by O2‐regulated prolyl hydroxylation. Science 292: 468–472 [DOI] [PubMed] [Google Scholar]
- Jacob M, Chappell D, Becker BF (2016) Regulation of blood flow and volume exchange across the microcirculation. Crit Care 20: 319 [DOI] [PMC free article] [PubMed] [Google Scholar]
- Ji R, Akashi H, Drosatos K, Liao X, Jiang H, Kennel PJ, Brunjes DL, Castillero E, Zhang X, Deng LY et al (2017) Increased de novo ceramide synthesis and accumulation in failing myocardium. JCI Insight 2: e96203 [DOI] [PMC free article] [PubMed] [Google Scholar]
- Kappos L, Antel J, Comi G, Montalban X, O'Connor P, Polman CH, Haas T, Korn AA, Karlsson G, Radue EW et al (2006) Oral fingolimod (FTY720) for relapsing multiple sclerosis. N Engl J Med 355: 1124–1140 [DOI] [PubMed] [Google Scholar]
- Knapp M, Baranowski M, Czarnowski D, Lisowska A, Zabielski P, Gorski J, Musial W (2009) Plasma sphingosine‐1‐phosphate concentration is reduced in patients with myocardial infarction. Med Sci Monit 15: CR490–CR493 [PubMed] [Google Scholar]
- Kogot‐Levin A, Saada A (2014) Ceramide and the mitochondrial respiratory chain. Biochimie 100: 88–94 [DOI] [PubMed] [Google Scholar]
- Kolesnick RN, Goni FM, Alonso A (2000) Compartmentalization of ceramide signaling: physical foundations and biological effects. J Cell Physiol 184: 285–300 [DOI] [PubMed] [Google Scholar]
- Lee MJ, Thangada S, Claffey KP, Ancellin N, Liu CH, Kluk M, Volpi M, Sha'afi RI, Hla T (1999) Vascular endothelial cell adherens junction assembly and morphogenesis induced by sphingosine‐1‐phosphate. Cell 99: 301–312 [DOI] [PubMed] [Google Scholar]
- Liu Y, Wada R, Yamashita T, Mi Y, Deng CX, Hobson JP, Rosenfeldt HM, Nava VE, Chae SS, Lee MJ et al (2000) Edg‐1, the G protein‐coupled receptor for sphingosine‐1‐phosphate, is essential for vascular maturation. J Clin Invest 106: 951–961 [DOI] [PMC free article] [PubMed] [Google Scholar]
- Livak KJ, Schmittgen TD (2001) Analysis of relative gene expression data using real‐time quantitative PCR and the 2(‐Delta Delta C(T)) method. Methods 25: 402–408 [DOI] [PubMed] [Google Scholar]
- Ma X, Qiu R, Dang J, Li J, Hu Q, Shan S, Xin Q, Pan W, Bian X, Yuan Q et al (2015) ORMDL3 contributes to the risk of atherosclerosis in Chinese Han population and mediates oxidized low‐density lipoprotein‐induced autophagy in endothelial cells. Sci Rep 5: 17194 [DOI] [PMC free article] [PubMed] [Google Scholar]
- Mendoza A, Breart B, Ramos‐Perez WD, Pitt LA, Gobert M, Sunkara M, Lafaille JJ, Morris AJ, Schwab SR (2012) The transporter Spns2 is required for secretion of lymph but not plasma sphingosine‐1‐phosphate. Cell Rep 2: 1104–1110 [DOI] [PMC free article] [PubMed] [Google Scholar]
- Miller M, Tam AB, Cho JY, Doherty TA, Pham A, Khorram N, Rosenthal P, Mueller JL, Hoffman HM, Suzukawa M et al (2012) ORMDL3 is an inducible lung epithelial gene regulating metalloproteases, chemokines, OAS, and ATF6. Proc Natl Acad Sci U S A 109: 16648–16653 [DOI] [PMC free article] [PubMed] [Google Scholar]
- Moffatt MF, Kabesch M, Liang L, Dixon AL, Strachan D, Heath S, Depner M, von Berg A, Bufe A, Rietschel E et al (2007) Genetic variants regulating ORMDL3 expression contribute to the risk of childhood asthma. Nature 448: 470–473 [DOI] [PubMed] [Google Scholar]
- Obinata H, Hla T (2019) Sphingosine 1‐phosphate and inflammation. Int Immunol 31: 617–625 [DOI] [PMC free article] [PubMed] [Google Scholar]
- Obinata H, Gutkind S, Stitham J, Okuno T, Yokomizo T, Hwa J, Hla T (2014) Individual variation of human S1P(1) coding sequence leads to heterogeneity in receptor function and drug interactions. J Lipid Res 55: 2665–2675 [DOI] [PMC free article] [PubMed] [Google Scholar]
- Pickart CM (1997) Targeting of substrates to the 26S proteasome. FASEB J 11: 1055–1066 [DOI] [PubMed] [Google Scholar]
- Pinto SN, Silva LC, Futerman AH, Prieto M (2011) Effect of ceramide structure on membrane biophysical properties: the role of acyl chain length and unsaturation. Biochim Biophys Acta 1808: 2753–2760 [DOI] [PubMed] [Google Scholar]
- Pore N, Jiang Z, Shu HK, Bernhard E, Kao GD, Maity A (2006) Akt1 activation can augment hypoxia‐inducible factor‐1alpha expression by increasing protein translation through a mammalian target of rapamycin‐independent pathway. Mol Cancer Res 4: 471–479 [DOI] [PubMed] [Google Scholar]
- Rivera J, Proia RL, Olivera A (2008) The alliance of sphingosine‐1‐phosphate and its receptors in immunity. Nat Rev Immunol 8: 753–763 [DOI] [PMC free article] [PubMed] [Google Scholar]
- Rotthier A, Auer‐Grumbach M, Janssens K, Baets J, Penno A, Almeida‐Souza L, Van Hoof K, Jacobs A, De Vriendt E, Schlotter‐Weigel B et al (2010) Mutations in the SPTLC2 subunit of serine palmitoyltransferase cause hereditary sensory and autonomic neuropathy type I. Am J Hum Genet 87: 513–522 [DOI] [PMC free article] [PubMed] [Google Scholar]
- Sasset L, Zhang Y, Dunn TM, Di Lorenzo A (2016) Sphingolipid de novo biosynthesis: a rheostat of cardiovascular homeostasis. Trends Endocrinol Metab 27: 807–819 [DOI] [PMC free article] [PubMed] [Google Scholar]
- Sattler KJE, Elbasan Ş, Keul P, Elter‐Schulz M, Bode C, Gräler MH, Bröcker‐Preuss M, Budde T, Erbel R, Heusch G et al (2010) Sphingosine 1‐phosphate levels in plasma and HDL are altered in coronary artery disease. Basic Res Cardiol 105: 821–832 [DOI] [PubMed] [Google Scholar]
- Sattler K, Lehmann I, Gräler M, Bröcker‐Preuss M, Erbel R, Heusch G, Levkau B (2014) HDL‐bound sphingosine 1‐phosphate (S1P) predicts the severity of coronary artery atherosclerosis. Cell Physiol Biochem 34: 172–184 [DOI] [PubMed] [Google Scholar]
- Schmidt O, Weyer Y, Baumann V, Widerin MA, Eising S, Angelova M, Schleiffer A, Kremser L, Lindner H, Peter M et al (2019) Endosome and Golgi‐associated degradation (EGAD) of membrane proteins regulates sphingolipid metabolism. EMBO J 38: e101433 [DOI] [PMC free article] [PubMed] [Google Scholar]
- Shendre A, Irvin MR, Wiener H, Zhi D, Limdi NA, Overton ET, Shrestha S (2017) Local ancestry and clinical cardiovascular events among African Americans from the atherosclerosis risk in communities study. J Am Heart Assoc 6: e004739 [DOI] [PMC free article] [PubMed] [Google Scholar]
- Simons K, Toomre D (2000) Lipid rafts and signal transduction. Nat Rev Mol Cell Biol 1: 31–39 [DOI] [PubMed] [Google Scholar]
- Siow DL, Wattenberg BW (2012) Mammalian ORMDL proteins mediate the feedback response in ceramide biosynthesis. J Biol Chem 287: 40198–40204 [DOI] [PMC free article] [PubMed] [Google Scholar]
- Spijkers LJ, van den Akker RF, Janssen BJ, Debets JJ, De Mey JG, Stroes ES, van den Born BJ, Wijesinghe DS, Chalfant CE, MacAleese L et al (2011) Hypertension is associated with marked alterations in sphingolipid biology: a potential role for ceramide. PLoS One 6: e21817 [DOI] [PMC free article] [PubMed] [Google Scholar]
- Spinella F, Rosano L, Del Duca M, Di Castro V, Nicotra MR, Natali PG, Bagnato A (2010) Endothelin‐1 inhibits prolyl hydroxylase domain 2 to activate hypoxia‐inducible factor‐1alpha in melanoma cells. PLoS One 5: e11241 [DOI] [PMC free article] [PubMed] [Google Scholar] [Retracted]
- Swatek KN, Komander D (2016) Ubiquitin modifications. Cell Res 26: 399–422 [DOI] [PMC free article] [PubMed] [Google Scholar]
- Symons JD, Abel ED (2013) Lipotoxicity contributes to endothelial dysfunction: a focus on the contribution from ceramide. Rev Endocr Metab Disord 14: 59–68 [DOI] [PMC free article] [PubMed] [Google Scholar]
- Tan JT, Prosser HC, Vanags LZ, Monger SA, Ng MK, Bursill CA (2014) High‐density lipoproteins augment hypoxia‐induced angiogenesis via regulation of post‐translational modulation of hypoxia‐inducible factor 1alpha. FASEB J 28: 206–217 [DOI] [PubMed] [Google Scholar]
- Venkataraman K, Lee Y‐M, Michaud J, Thangada S, Ai Y, Bonkovsky HL, Parikh NS, Habrukowich C, Hla T (2008) Vascular endothelium as a contributor of plasma sphingosine 1‐phosphate. Circ Res 102: 669–676 [DOI] [PMC free article] [PubMed] [Google Scholar]
- Wang Q, Shinkre BA, Lee JG, Weniger MA, Liu Y, Chen W, Wiestner A, Trenkle WC, Ye Y (2010a) The ERAD inhibitor Eeyarestatin I is a bifunctional compound with a membrane‐binding domain and a p97/VCP inhibitory group. PLoS One 5: e15479 [DOI] [PMC free article] [PubMed] [Google Scholar]
- Wang Y, Nakayama M, Pitulescu ME, Schmidt TS, Bochenek ML, Sakakibara A, Adams S, Davy A, Deutsch U, Luthi U et al (2010b) Ephrin‐B2 controls VEGF‐induced angiogenesis and lymphangiogenesis. Nature 465: 483–486 [DOI] [PubMed] [Google Scholar]
- Wigger L, Cruciani‐Guglielmacci C, Nicolas A, Denom J, Fernandez N, Fumeron F, Marques‐Vidal P, Ktorza A, Kramer W, Schulte A et al (2017) Plasma dihydroceramides are diabetes susceptibility biomarker candidates in mice and humans. Cell Rep 18: 2269–2279 [DOI] [PubMed] [Google Scholar]
- Xiong Y, Lee HJ, Mariko B, Lu Y‐C, Dannenberg AJ, Haka AS, Maxfield FR, Camerer E, Proia RL, Hla T (2013) Sphingosine kinases are not required for inflammatory responses in macrophages. J Biol Chem 288: 32563–32573 [DOI] [PMC free article] [PubMed] [Google Scholar]
- Yanagida K, Hla T (2017) Vascular and immunobiology of the circulatory sphingosine 1‐phosphate gradient. Annu Rev Physiol 79: 67–91 [DOI] [PMC free article] [PubMed] [Google Scholar]
- Yu J, Pan W, Shi R, Yang T, Li Y, Yu G, Bai Y, Schuchman EH, He X, Zhang G (2015) Ceramide is upregulated and associated with mortality in patients with chronic heart failure. Can J Cardiol 31: 357–363 [DOI] [PubMed] [Google Scholar]
- Yu M, Lun J, Zhang H, Zhu L, Zhang G, Fang J (2021) The non‐canonical functions of HIF prolyl hydroxylases and their dual roles in cancer. Int J Biochem Cell Biol 135: 105982 [DOI] [PubMed] [Google Scholar]
- Zhang Y, Huang Y, Cantalupo A, Azevedo PS, Siragusa M, Bielawski J, Giordano FJ, Di Lorenzo A (2016) Endothelial Nogo‐B regulates sphingolipid biosynthesis to promote pathological cardiac hypertrophy during chronic pressure overload. JCI Insight 1: e85484 [DOI] [PMC free article] [PubMed] [Google Scholar]