

Abstract
Repeatable tumor measurements are key to accurately assessing tumor growth and treatment efficacy. A preliminary study that we conducted showed that a novel 3D and thermal imaging system (3D-TI) for measuring subcutaneous tumors in rodents significantly reduced interoperator variability across 3 in vivo efficacy studies. Here we further studied this reduction in interoperator variability across a much larger dataset. A dataset consisting of 6,532 paired 3D-TI and caliper interoperator measurements was obtained from tumor scans and measurements in 27 laboratories across 289 studies, 153 operators, over 20 mouse strains, and 100 cell lines. Interoperator variability in both measurement methods was analyzed using coefficient of variation (CV), intraclass correlation (ICC) analysis, and significance testing. The median 3D-TI CV was significantly lower than the median caliper CV. The effects of large interoperator variability at critical points in the study were also investigated. At stratified randomization, changing the operator performing caliper measurements resulted in a 59% probability that a mouse would be reassigned to a different group. The probability that this would occur when using 3D-TI was significantly lower at 29%. In studies in which a tumor was expected to regress, changing the operator during the study was associated with a tumor volume increase of approximately 500mm3 when using calipers. This change did not occur when using 3D-TI. We conclude that 3D-TI significantly reduces interoperator variability as compared with calipers and can improve reproducibility of in vivo studies across a wide range of mouse strains and cell lines.
Abbreviations and Acronyms: 3D-TI, 3D and thermal imager; ICC, Intraclass correlation coefficient; V, Test statistic for Wilcoxon signed rank test, which is the minimum from W+ (sum of the positive ranks) and W− (sum of the negative ranks)
Introduction
In vivo preclinical oncology studies rely on accurate and reproducible measurement of tumors for making conclusions about tumor growth kinetics and drug efficacy. The current ‘reproducibility crisis’ in preclinical research has many sources of variation including loosely defined methods, use of poorly characterized cell lines and mouse models, inconsistency in blinding methods, and lack of control cohorts.2 Tumor measurement is one such source of variation that can be easily isolated and better controlled to improve the quality and reproducibility of data. Tumor volume is a good proxy for tumor weight and can be calculated from measurements taken using calipers, which are widely used and inexpensive. However, this measurement technique relies on the person taking the measurement determining the longest length and corresponding perpendicular width of the tumor, making the measurements subject to user bias and interoperator variability.5,6,13 Therefore, a single operator often performs all the measurements in a study to limit user bias and variation in caliper measurements. This approach increases the chance of producing reproducible results if the same user can perform the whole study, including all repeats, but does not solve the problem of data irreproducibility between different institutions. This strategy also fails if the same user cannot perform all the measurements due to illness or other absence.
More accurate, less subjective tumor measurement can be performed by other methods including magnetic resonance, fluorescent protein, and ultrasound imaging, but these methods are significantly more expensive and time consuming than using calipers.1,3,8,9 Furthermore, anesthesia requirements for some techniques has associated risks and places an additional health burden on the mice.14 Rapid noninvasive imaging is a more time- and cost-effective way to reduce interoperator bias and variability when measuring subcutaneous tumors in rodents. In an earlier study,5 we described 3D and thermal imaging (3D-TI) that combines thermal, 3D, and RGB photographic images to produce a 3D tumor scan. Measurements are made by a machine-learning algorithm designed to automatically segment the 3D tumor scans without user bias, and tumor volume is calculated automatically.
Noninvasive image capture provides a clear benefit of 3D-TI as compared with other methods. 3D-TI contacts the mouse body with a soft silicone aperture plate, as opposed to contacting the tumor itself, as happens with calipers. In addition, 3D-TI produces a digital tumor model without the need for anesthesia or intravenous reagents, thus eliminating adverse reactions and hypothermia risks. 3D-TI also enables easy tracking and sharing of data by creating a digital record of every scan and its metadata so that any anomalous points can be retroactively investigated in detail.
A pilot study that we conducted in collaboration with the Genomics Institute of the Novartis Research Foundation showed that 3D-TI reduced user variability as compared with calipers over the course of 3 studies (784 3D-TI scans with corresponding caliper repeats, 258 unique mice, unpublished data). 3D-TI obtained a higher Intraclass Correlation Coefficient score (0.96) than did calipers (0.86) which was a statistically significant difference at the 95% confidence level (unpublished data). Across all 3 studies used in the investigation, 3D-TI increased the repeatability of measurements between users. The low interoperator variability suggested that the 3D-TI system could allow staff to move into and out of studies without affecting tumor growth curves, thereby increasing data reproducibility and allowing teams to optimize their work capacity.
The main objective of this investigation was to determine if our previous result of reduced variability was reproducible across a much larger dataset of 6,532 paired 3D-TI and caliper interoperator repeats from 289 studies (17,270 individual scans, 6,532 individual tumors that were measured multiple times by different operators). A strength of this approach is by evaluating data from 27 organizations, bias that could affect results was minimized (such as differences in caliper measurement, cell culture, and injection methods). New analysis methods and modeling were also used to interrogate the data more thoroughly with the aim of better understanding how variability at critical points affects efficacy studies, including effects on group assignment at stratified randomization (which depends on measured tumor volumes), tumor regression trends, and study outcome when staff change during a study.
Materials and Methods
In vivo data collection.
Fuel3D provided our 3D-TI device and system (BioVolume) and our training and supported 27 client organizations. Mice were restrained by scruffing using client handling protocols. For image capture, the tumor region was presented to the BioVolume silicon aperture. This process required 1.3 to 1.6 s, not including the time needed to pick up and scruff the mouse. The person performing the measurements with either 3D-TI or calipers is referred to as a user.
Subcutaneous tumors were established in the mouse flank area from inoculated cell lines and patient-derived xenografts according to client organization protocols. Methods and welfare endpoints adhered to US or EU welfare and ethics rules depending on lab location. All mouse care, lab work, caliper measurements, and image scans were carried out by scientists in client organizations. Data were shared with Fuel3D for aggregated and anonymized use. Client companies and scientists did not have financial interests in BioVolume.
We previously provided details on scan collection methods, the system, and how scans were processed.5 In December 2020, improved machine learning segmentation algorithms and laser pattern projection were added to the software to improve detection of 3D tumor morphology. However, operator use of the machine did not change, Data collected before December 2020 were not reprocessed, even though data used in this paper were from both before and after these changes were implemented.
Data processing.
The tumor boundary was automatically determined by the 3D-TI software in a process known as automatic segmentation. Tumor scans were then automatically measured algorithmically by the 3D-TI system without any user input. Manual segmentation was required to correct the tumor boundary defined by the machine learning algorithm in 27% of cases in which the automatic segmentation did not perfectly match the tumor boundary seen in 3D and thermal images. This occurred more commonly in tumors with complex and unusual morphologies such as multilobed and very flat tumors. As part of the evaluation study agreements, manual segmentations were performed by Fuel3D support staff using the thermal signature, 3D model, and RGB images to determine the correct tumor boundary in these cases (Figure 1). All segmentations (manual and automatic) were timestamped, and all changes were logged and visible to users. All manual segmentations reviewed and approved by client organization scientists to confirm that the segmentation was correct and objective. All measurements made from thermal imaging were measured and recorded automatically by the measurement algorithm and were not subject to user interpretation; the algorithm always determined the longest length, the corresponding perpendicular width, and the height of the tumor.
Figure 1.
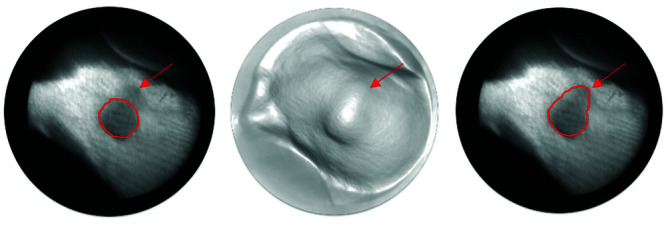
The shape of this circular tumor can be identified by its dark thermal signature (left, right), and by the shape of the generated 3D model (center). Segmentations are shown as a red boundary. In this case, automatic segmentation (left) underestimated tumor size and missed out a section indicated by the red arrow. The manual correction is shown on the right image.
Data analysis.
Aggregated data from 36,725 scans were analyzed by Fuel3D data scientists. For the study of interoperator variability, only scans with repeated 3D-TI and caliper measurements of the same tumor on the same day by different operators were used. Multiple statistical methods were used to provide complete, unbiased results for comparison of the repeatability of measurements across users.
Two datasets were analyzed:
Dataset 1.
3D-TI-caliper comparison included all repeated measures collected between February 2019 and December 2021 (17,270 individual scans forming 6,532 paired interoperator repeats across 3D-TI and caliper measurements). Data were collected across 27 laboratories, by 153 operators, including over 20 mouse strains and 100 cell lines (as of December 2021). We believe that this dataset is the largest used to date to investigate interoperator caliper variability. Figure 2A shows typical cell-line and mouse strains used.
Figure 2.

A) Typical study designs when testing the interoperator variability in a total of 289 studies. B) Typical mouse strain and cell-line combinations scanned using BioVolume.
Dataset 2.
The comparison of 3D-TI and caliper measurements included data from Dataset 1 (9,143 individual scans forming 3,327 paired interoperator repeats across 34 studies, 20 cell lines, 8 mouse strains, and at least 2 different users per study (46 users in total)). Evaluation studies were carried out after operators had reached an acceptable level of competence at using the equipment (this usually required a supervised practice session). Data from initial and training sessions were not included in the analysis. Raw data were formatted and grouped by strain and cell line (Figure 2B). Errors in labeling BioVolume results (incorrect identification of a mouse) were corrected by identifying mice from images.
For all studies in Dataset 1, the coefficient of variation (CV) was calculated by comparing results for different users that had taken measurements of tumor volume for the same mouse on the same day (a lower CV indicates less variation between measurements). A paired Wilcoxon test was then performed to identify statistical significance between the median CV values for each measurement technique.
The coefficient of variation was calculated using the following formula:
This analysis was repeated for studies in which users had been adequately trained with the 3D-TI system (Dataset 2). To ensure adequate training, users’ scans were monitored, and feedback was provided to ensure that the mouse was correctly presented to the 3D-TI system. These studies were rigorously analyzed using intraclass correlation (ICC (2,1))12 to measure agreement between users’ measurements while accounting for other sources of variance.7 A high ICC value corresponds to a high level of agreement between users’ measurements, where a value of 1 is considered perfect agreement. Agreement is defined as follows:
Excellent level of agreement – ICC ≥ 0.9
Good level of agreement – 0.75 ≤ ICC Score < 0.9
Moderate level of agreement – 0.5 ≤ ICC score < 0.75
Poor level of agreement – ICC score < 0.5
Investigating effects of variability on study outcomes.
Two studies were chosen from the set of evaluation studies in our global dataset and were used to investigate the effects of large interoperator variability on study outcomes. The study data used for the randomization analysis will be referred to as the randomization study and the study data used for the endpoint analysis will be referred to as the endpoint study. Table 1 shows the number of mice and users. For the randomization analysis, a study was chosen in which no treatment was applied; this allowed randomization to be performed as desired. For the endpoint analysis, a study was chosen in which mice were treated with a drug known to cause tumor regression. This allowed us to investigate how changing users during a study affects tumor measurements during regression.
Table 1.
Information on study data used for the randomization and endpoint analysis
| Study | Group | Mouse Strain | Tumor Cell Line | # Mice | Users | Duration | Measurement Sessions |
|---|---|---|---|---|---|---|---|
| Randomization Study | Control | C57Bl/6 | MC38 | 20 | User 1, User 2, User 3 | 21 Days | 9 |
| Endpoint Study | Control | Balb/C | CT26 | 14 | User 2, User 3, User 4 | 11 Days | 5 |
| Endpoint Study | Treated | Balb/C | CT26 | 15 | User 2, User 3, User 4 | 18 Days | 7 |
For the randomization study, tumors larger than 1,500 mm3 and smaller than 40 mm3 were excluded from the data. These 2 groups represent tumors at or approaching size endpoints and tumors too small to be considered for randomization, respectively.
Modeling rather than the raw study data was used for 2 reasons. First, tumor measurement capture was inconsistent across the study; after fitting the model to the data, predicted measurements for the missing data could be generated, allowing a more complete analysis. Second, linear modeling can be used to estimate how variation in several important variables can contribute to a change in the predicted volume, known as coefficient estimates of the model. We used linear modeling to determine how changing the user can affect measured tumor volume of the same mouse. This information allowed us to create hypothetical scenarios in which users could be changed across studies.
Two identical fixed effect generalized linear models were fit using either the randomization or the endpoint study data, using the gamlss package in R (Version 5.3-4).12 The model consisted of:
A fixed mouse tumor slope by day, to account for each mouse’s tumor growth
A fixed intercept for each user with each device (3D-TI or calipers), to account for fixed user bias, differences in measured size between devices, and to understand how user bias compared between the 2 devices.
A fixed mouse tumor intercept, to account for varying initial mouse tumor volumes.
Combining the above gave the model formula:
day is day since inoculation. As tumor growth is exponential and heteroskedastic within a group, a generalized linear model was fit using a log link function and a generalized gamma family to account for those characteristics. A fixed effects model was used because predicted tumor measurements for each mouse from each user with each device could be obtained. This allowed for a direct comparison between predicted measurements across users, for a given mouse, and measurement device.
Testing confirmed that the residuals of both models were normally distributed, thereby meeting the assumptions of linear modeling (Figure 3). To determine if both models described the data well, predicted tumor measurements were plotted against the actual tumor measurements for both models, a y = x line was plotted and used to assess model fit (Figure 4). A wide range of model formulas that ranged from using different variables for the slope to introducing random effects were tested, as were other distributions from the gamma family (Gamma, Weibull, etc.). The Akaike information criterion was used to determine which one was the best.
Figure 3.

Four diagnostic residual plots for each to determine if residuals are normally distributed, A–D) contain the diagnostic plots for the model fit to Randomization study data. E–H) contain the plots for the model fit to Endpoint study data. A and E are quantile residuals plotted against the generated volume. B and F are quantile residuals plotted against the index of the data (no order in value). C and G are density plots of the residuals. D and H are normal Q-Q plots of the residuals.
Figure 4.

Comparison of actual volume measurements against volumes generated from the model fit to: A) the Randomization study data used in the randomization analysis and B) the Endpoint study data used in endpoint analysis. A y = x line is plotted to assist in determining accuracy of predicted volumes.
Once both models had been fit, the user:variable coefficient estimates for both models were extracted and compared to assess interoperator variability. The user:variable estimates were plotted and compared, both within each model and across the 2 models.
When fitting a model, a specific configuration of variables was used as the base model. For example, in the case of the model fit to the randomization study seen in Figure 5A, user 3 for 3D-TI and mouse 1 are used as the base model. The other user:variable and mouse coefficient estimates are then offsets of those. This is why in Figure 5A, user 3 for 3D-TI in both the randomization study and the endpoint study has a coefficient estimate of 0 with 0 standard error; the other user:variable estimates are then offset from this estimate.
Figure 5.

User: Variable coefficient estimates from the 2 models. Taken from the 2 models fit to the randomization study and the endpoint study respectively. Error bars are 95% CI. Both models were fit using 3D-TI user 3 as a reference. A) User:Variable coefficient estimates shown separately. B) Coefficient estimates from both models in a single plot.
When comparing user:variable coefficient estimates for 3D-TI across both models, there is no significant difference in estimate across the users (Figure 5A). This is because the user estimates 95% CI overlap of zero, which is user 3 for 3D-TI (the base user). This shows a low interoperator variability with a strong likelihood that there will be no significant difference in the volumes measured by different users. Calipers showed a clear and often significant difference in user estimates across both models, as determined by lack of overlap with the 95% CIs of the estimates, signifying substantial interoperator variability.
A side-by-side comparison of the user:variable estimates from both models (Figure 5B) was used as an initial step in determining if user:variable estimates could be swapped between models. For example, user 2 for both 3D-TI and calipers has similar estimates across both models, supporting this possibility.
Impact of large interoperator variability at the point of randomization.
Stratified randomization is the process of sorting rodents into groups of roughly equal tumor volume at the start of the study once their tumors have established. A group of rodents then receives a treatment and the results are compared with other groups to determine its efficacy. Significant changes in a measured tumor volume before randomization can potentially change the group to which it is assigned, which can result in groups with uneven tumor volume. This difference could then be incorrectly attributed to a treatment effect or lack of effect. To investigate the impact of the interoperator variability at the point of randomization, the model fit to the randomization study was used to generate each user’s measurements for all 20 mice for both 3D-TI and calipers at the point of randomization. From the model, generated user measurements of the 20 mice from day 4 were between 50mm3 to 150mm3; suitable for randomization. These generated measurements were then chosen as the mouse tumor volumes just before randomization, resulting in six generated measurements per mouse, one for each user with each measurement device.
Figure 6 illustrates how significant differences in the user:variable coefficient estimates shown in Figure 5A for calipers affected the generated measurement. User 1 for calipers reported higher values than did the other users and, as a result, the generated volumes for a given mouse were often significantly different between users. In contrast, when all 3 users measured with 3D-TI, little difference was reported between their generated measurements.
Figure 6.

Comparison of user measurements of the same tumor (generated from the model fit to the randomization study) for calipers (left) and 3D-TI (right) at the time of randomization. Volumes were generated on day = 4 of the study, error bars are 95% CI.
For each mouse and each measurement device, one of the 3 generated users measurements for that mouse was randomly assigned to simulate the impact of user bias. The mice were then ranked by tumor size and randomized into 4 groups of 5 mice using deterministic randomization (see supplementary material). This process was repeated 9 times to obtain 10 sets of 4 groups; each of the 10 repeats is referred to as a randomization repeat. Variability of group composition when measuring with 3D-TI and calipers was then compared across the randomization repeats using an alluvial plot and by computing the mean of each group and comparing across each randomization repeat. Of the 10 randomization repeats, the mean probability that each mouse would stay in the same group was computed. This entire process was repeated 10,000 times (10 randomization repeats, 10,000 times) to generate stable mean probabilities for each mouse and each measurement device. Average probabilities by measurement device were then computed.
Impact of large interoperator variability on tumor regression and study endpoint.
To better demonstrate the impact of large interoperator variability on the observed regression of tumors and study endpoint, a scenario was created in which user 1 from the randomization study “measured” in the endpoint study. This was done by taking the user:variable coefficient estimates of user 1 from the model fit to the randomization study data and placing it in the model fit to the endpoint study and then generating volumes as if user 1 measured in the endpoint study. To first show that this process was feasible and to validate this method, the user:variable estimate for user 2 from the randomization model was placed in the model fit to the endpoint data; volumes were then generated for both user 2 from the randomization study placed in the endpoint model and from the original user 2 in the endpoint model. These predictions were plotted against each other, and showed that measurements were highly comparable when swapping user:variable estimates between models (Figure 7).
Figure 7.

A) Model predictions when changing user 2’s User:Variable coefficient estimates for the same user across the 2 models (studies) for 3D-TI (left) and calipers (right). User 2’s User:Variable coefficient from the randomization study model was used in place of User 2 in the endpoint study model. This was then used to generate measurements and compare against generated measures from User 2 from the endpoint study model original coefficient estimate. B) Comparing measured volumes (generated from model) for User 1 and User 4 as if they had both measured for the endpoint study. User 1’s User:Variable coefficient estimates for both 3D-TI and calipers were placed in the endpoint study model. Volumes could then be generated as if user 1 had measured in the endpoint study. The dotted line represents equality of the 2 users’ generated volumes (y = x).
After adding the user:variable estimate for user 1 from the model fit to the randomization data into the model fit to the endpoint data, measurements were generated as if user 1 had measured in the endpoint study, when they originally did not. These generated volumes were then compared against the generated volumes for user 4 in the endpoint study, who did not measure in the Randomization study thus allowing comparison of 2 user measurements even though they had not measured the original data in the same study.
Using the model fit to the endpoint data and the user:variable estimate for user 1 allowed us to generate volume measurements as if users 1, 2, and 3 had measured all of the endpoint data using both 3D-TI and calipers. To determine the effects of changing the user during a study on the regression of a group of tumors treated with a known efficacious drug, drug-treated group growth curves were plotted in which the first 9 days of the study was measured by one user and the remaining 9 days was measured by another. This was done for each possible combination of the 3 users for both 3D-TI and calipers.
To investigate the effects of high interoperator variability at study endpoint, the same generated measures were used with the same scenario of changing users in order to calculate the area-under-the-curve (AUC) for each user combination. Bootstrapping was used to generate a stable mean estimate and a 95% CI. The AUC for each user combination was then compared for both 3D-TI and calipers.
Results
3D-TI significantly reduces interoperator variation as compared with calipers.
User variability is significantly lower when measuring tumors using 3D-TI in comparison to calipers.
To investigate interoperator variability, we analyzed 6,532 paired interoperator repeats of 3D-TI and caliper tumor measurements obtained from tumor scans and measurements in our global dataset. We determined the interoperator variability for both calipers and 3D-TI using coefficient of variation (CV). The data show that 3D-TI reduces interoperator variability as compared with calipers; median 3D-TI CV was significantly lower than the median caliper CV (Figure 8A, P < 0.00001, test statistic(V): 1748301) across all 289 interoperator studies in our global dataset.
Figure 8.

A) Paired coefficient of variation using all comparable data for calipers (left) and 3D-TI (right). Different operator measurements of the same tumor on the same day were compared with analyses the interoperator variability. A total of 6,532 repeat measurements were each carried out by 2 or more operators. A boxplot shows the interquartile range, with the median labeled on the plot. A violin plot was also added to further outline the distribution of the data. A paired Wilcoxon test was used and yielded a P value of < 0.00001, with a test statistic of 1748301. B) Paired coefficient of variation using only evaluation study data for calipers (left) and 3D-TI (right). A total of 3,327 repeat measurements were performed by 2 or more operators. A paired Wilcoxon test yielded a P value of < 0.00001, with a test statistic of 8063847.
A subset of our global dataset consisting of 3,327 paired interoperator repeats of 3D-TI and caliper tumor measurements in evaluation studies was used to calculate CV again. The data showed an even greater reduction in the interoperator variability when using 3D-TI; median 3D-TI CV was significantly lower than the median caliper CV (Figure 8B, P < 0.00001, test statistic(V): 8063847). These results show that 3D-TI reduced measurement variability by approximately 40% as compared with calipers across 34 interoperator evaluation studies in our global dataset.
3D-TI measures tumors of all sizes with lower variability than calipers.
Tumor measurements in the global dataset were divided into 3 groups by size: less than 200 mm3, 200 to 1,000 mm3, and greater than 1,000 mm3. These groups were analyzed as before to assess interoperator variability. At all tumor sizes, 3D-TI reduced interoperator measurement variability significantly as compared with calipers (Figure 9, P < 0.00001, with test statistics(V) equal to 165522, 370168, and 84051 across Figures A, B, C respectively).
Figure 9.

A) Paired coefficient of variation for tumors < 200 mm3 using evaluation study data for calipers (left) and 3D-TI (right). Different operator’s measurements of the same tumor on the same day are compared to analyze the interoperator variability. A total of 931 repeat measurements were performed by 2 or more operators. A boxplot shows the interquartile range, with the median labeled on the plot. A violin plot was also added to further outline the distribution of the data. B) Paired coefficient of variation for tumors greater than 200 mm3 but less than 1,000 mm3 using evaluation study data for calipers (left) and 3D-TI (right). There were 1,545 repeat measurements observed, each carried out by 2 or more operators. C) Paired coefficient of variation for tumors > 1,000 mm3using evaluation study data for calipers (left) and 3D-TI (right). A total of 853 repeat measurements were performed by 2 or more operators. A paired Wilcoxon test was performed for each case and always yielded a P value of < 0.00001.
3D-TI reduces user measurement bias in comparison to calipers.
Variability of 3D-TI measurements was assessed using the intraclass correlation coefficient (2,1) (ICC) for 25 studies in our global dataset. An ICC score of 1 represents zero variation among users.10 Of 25 studies, 24 also assessed caliper measurements in the same way (Figure 10). In 20 of 24 studies, the ICC of 3D-TI was significantly closer to 1 than that of calipers (where 1 represents perfect agreement and 0 variation), with significance assessed using an F-Test (more information on this is available in the supplementary material). The studies in which 3D-TI did not significantly outperform calipers can be attributed to low measurement variability between caliper users as compared with other studies, rather than unusually high variability in 3D-TI measurements. These results again show that 3D-TI reduced variation in measurement of tumors as compared with calipers in most cases.
Figure 10.

Intraclass Correlation Coefficient (ICC) for 25 evaluation studies with a sufficient number of interoperator repeats for calipers (left) and 3D-TI (right). The number of different operators varies between 2 and 5 for different studies; the number of interoperator repeats is shown on the plot. The ICC shows that 3D-TI has a consistently high level of operator concurrence, which is not the case for calipers. An F-test was used for each study and showed that 3D-TI significantly reduced the inter-operator variability compared to calipers in 20 out of 24 studies (P < 0.05).
User measurement variability affects group composition at randomization.
Stratified randomization is the process of sorting mice into groups at the start of the study once their tumors have established such that each group have an equal mean tumor volume . Both high precision and accuracy are needed to ensure that each randomized group has an equal mean tumor volume.4 Uneven distribution of tumor volumes across control and treated groups can mask trends and influence study outcomes. What seems like a drug effect may in fact be due to poor randomization in such cases. As mentioned in the previous section, a model was fit to one of the studies and used to simulate the effects of using a device with a large interoperator variability such as calipers, at the point of randomization.
Figure 11 shows the effects of large interoperator variability at randomization. The alluvial plot (Figure 11A) clearly shows that group composition when using calipers is much more variable than with 3D-TI. For the majority of randomization repeats, group composition was identical when using 3D-TI, but not calipers. This is further supported by the average tumor volume for each group across repeats (Figure 11B and C); the means of the 3D-TI group were much more consistent than those of calipers. Finally, the average probability that a mouse will remain in the same group when repeating the randomization process using 3D-TI and calipers indicates that mice were over twice as likely to remain in the same group when using 3D-TI (87% as compared with 40%). When using 3D-TI, 12 of the 20 mice remained in the same group 100% of the time when repeating the randomizations, whereas for calipers only 1 mouse out of 20 did.
Figure 11.

A) Group composition after repeating the randomization process in the same study 10 times each for calipers (left) and 3D-TI (right). For each randomization repeat, one of the 3 user measurements (generated from the model) was randomly selected for each mouse, the mice were then ordered in descending order of tumor volume and then assigned to groups. A straight line between groups denotes no change in group for a mouse after repeating a randomization. B) Variability of group means for the 10 randomization repeats for calipers (left) and 3D-TI (right). After each randomization repeat, the average group volume was computed for each group. C) Probability a mouse will remain in the same group after repeating a randomization for calipers (left) and 3D-TI (right) for 10 randomization repeats. This entire process was repeated 10,000 times (10 randomization repeats, 10,000 times) to generate a stable mean probability. Average probabilities by measurement device are shown with a dotted line and annotation.
Changing users during the study affects tumor growth regression trend and study endpoint when measurements are variable.
The current industry practice is for one individual to perform all the measurements in a study. This user cannot be changed due to interoperator variability of measurements and must personally complete the study. If the user carrying out the study becomes unavailable, the entire study may have to be ended early, at great cost. As demonstrated in the first section, the tumor volume recorded can vary greatly depending on the user. The following section investigates the impact on growth kinetics of using a measuring device with high interoperator variability, focusing on how changing users during a study can affect the measured regression of mice treated with a known efficacious drug. We designed a longitudinal study with a known efficacious drug to assess tumor regression. We fit a model to the data, similar to what was done in the previous section, and used the model to evaluate the consequences of changing an operator using 3D-TI or calipers during a study.
Changing caliper users during a study had a clear effect on tumor regression (Figure 12B). The volume increased when a new user was assigned, and whether the tumor had regressed was uncertain, even though the drug administered was previously documented to be efficacious under these conditions. Comparing calipers and 3D-TI in all possible user combinations revealed that the measured volume decreased after changing users even though the tumor was clearly regressing and the treatment working as expected (Figure 12A).
Figure 12.

A) Average tumor volume across the three 3D-TI users plotted from the Endpoint Study data. Mice were treated with an effective drug on day = 0, tumor regression is shown. Error bars are 95% CI, n = 15 for each time point. B) Volume regression when changing users during a study as measured by calipers (left) and 3D-TI (right). Mice were treated with an effective drug on day 0. User measurements were generated using a generalized linear model fit to interoperator variability study data and users were changed on day 9. Error bars are 95% CI, n = 15 for each time point.
Similarly, the effects of changing users during a study on the study endpoint is shown in Figure 13. For calipers, the area-under-the-curve (AUC) mean estimate varied depending on which user started and finished the study. With 3D-TI, AUC was near identical regardless of the user combination. Although the AUCs for either calipers or 3D-TI were not significantly different among user combinations, as determined by the overlap of the 95% CIs, the variability of the mean AUC between user combinations was significantly greater for calipers than for 3D-TI as assessed by the Levene test (p = 0.0066, test statistic(F) = 9.74), which evaluates the homogeneity of variance (standard deviation in AUC across users was 0.02 for calipers as compared with 0.002 for 3D-TI). If an AUC threshold was set at 0.25, such that any AUC score below this would render the treatment effective, and the study was performed using calipers, treatment efficacy would vary depending on which user started and ended the study.
Figure 13.

Effect on AUC of changing users during the study for both 3D-TI (left) and calipers (right). AUC was computed using user measurements generated from a generalized linear model fit to interoperator variability study data. For the AUC calculation, the first user’s generated measurements were used until day 9, and the second user’s generated measurements were used from day 9 to 15. Bootstrapping was used to generate 95% CI.
Discussion
Our analyses of interoperator variability of the 2 tumor measurement techniques showed that 3D-TI outperformed calipers in all scenarios tested. When users were trained to use 3D-TI, the variability was even lower, as shown by the CV and the defined level of statistical significance for the CV results. The ICC scores for trained users also showed that 3D-TI measurements are highly repeatable and achieved high user agreement across several studies, cell lines, and mouse strains. The improvement when using 3D-TI was significant in 20 of 24 studies. User agreement for calipers varied extensively, further confirming that caliper measurements are subject to greater user bias. The large sample sizes that we used provide confidence in the results obtained.
We used modeling to show that groups assigned at randomization, detection of tumor regression, and AUC are all affected by user bias. Our randomization modeling showed that for calipers, the initial average volumes of groups were highly dependent on which user’s generated measurements were selected. When calipers were used, mice were more than twice as likely to be assigned to a different group when the randomization was repeated for the same mouse. These initial group averages are highly important because using equivalent average tumor volumes across groups ensures that any differences in average volume between groups after treatment can be attributed to the treatment alone. Because study outcome is highly dependent on accurate initial group volumes, low interoperator variability is essential to ensure that regardless of the user, the initial total tumor volumes are similar and as a result, the study outcome is reproducible.
Changing users during a study has historically been avoided due to the risk of affecting study outcome because of the known problem of user measurement bias. We confirmed this effect by changing users’ measurements during a modeled study. An expected, tumor regression was masked when we simulated changing users who measured with calipers but was not masked when users measured with 3D-TI, indicating less user bias with the latter method. This masking would affect the conclusions of the study, and the assessment of treatment efficacy. This point was further supported by the study of AUC. We showed that if an AUC threshold was set at 0.25 and the study was performed using calipers, then the conclusion of whether the treatment was effective would change depending on the user who started and ended the study. With 3D-TI the conclusion was the same regardless of which user started or finished the study; the tumor regression and the effectiveness of the treatment as indicated by the AUC was highly consistent. Thus, users could be changed if necessary during the study, which could ultimately save time and cost because studies would no longer need to be abandoned if the user who initially started measuring on a certain study had to be replaced for some reason.
3D-TI has great potential to revolutionize preclinical oncology practices in vivo. A digital method with less interoperator variability can be standardized across users and organizations for more reproducible data. At the organizational level, the ability to change users during a study allows much more flexibility in a team and aligns with the 3Rs Reduction principle by removing the need to cull and replace mice if a user cannot complete a study. On a larger scale, better quality and improved data tracking translates into greater confidence that drug efficacy results are correct and will be reproducible at different sites. Greater confidence in results during preclinical testing could also translate into more successful clinical trials by reducing false positive and false negative results caused by user bias or measurement variation. The 3D-TI method also provides greater precision and reliability of measurements and should result in greater experimental power and the ability to reduce the number of mice per group. These outcomes are consistent with achieving both welfare goals and statistically significant results. By noninvasive capture of both tumor images and measurements, 3D-TI also promotes refinement by avoiding contact with the tumor during measurement and by imaging without the use of reagents or anesthesia that could negatively affect rodent welfare. Mouse handling during image capture has also been refined since the studies reported here; image capture time has been reduced from 0.75 s to 0.47 s, further reducing mouse handling time as compared with caliper use.11
We believe the dataset investigated here to be the largest used to date to study caliper variability, as well as the largest dataset used to compare calipers with an alternative measurement device. The 3D-TI imaging device significantly reduced user variability in comparison to calipers, and our modeling showed how this variability can affect in vivo efficacy studies at randomization and endpoints. Our next step will be to interrogate these data more thoroughly to learn whether measurement variability is affected by cell line and tumor morphology and to carry out further modeling to evaluate how user variability specifically affects the chances of missing a drug effect during preclinical trials.
Acknowledgments
The authors thank and gratefully acknowledge the contribution of all the scientists who ran studies and collected the measurement data which was anonymized and analyzed in this report. We also thank Adam Sardar for his guidance and discussion of the modelling methods.
Supplemental Materials
Supplementary tables with supporting data, statistical glossary, and further details on ICC calculations.
Competing Interests Statement
Fuel3D is developing BioVolume and claims financial competing interests on the product. There are specific patents granted and filed for this technology or any part of it. Fuel3D provided support in the form of salaries for authors, but did not have any additional role in the study design, data collection and analysis, decision to publish, or preparation of the manuscript.
In vivo work was carried out by BioVolume users who were not employed by Fuel3D and who did not receive financial compensation.
References
- 1.Ayers GD, McKinley ET, Zhao P, Fritz JM, Metry RE, Deal BC, Adlerz KM, Coffey RJ, Manning HC. 2010. Volume of preclinical xenograft tumors is more accurately assessed by ultrasound imaging than manual caliper measurements. J Ultrasound Med 29:891–901. 10.7863/jum.2010.29.6.891. [DOI] [PMC free article] [PubMed] [Google Scholar]
- 2.Begley CG, Ellis LM. 2012. Raise standards for preclinical cancer research. Nature 483:531–533. 10.1038/483531a. [DOI] [PubMed] [Google Scholar]
- 3.Caysa H, Metz H, Mäder K, Mueller T. 2011. Application of Benchtop-magnetic resonance imaging in a nude mouse tumor model. J Exp Clin Cancer Res 30:69. 10.1186/1756-9966-30-69. [DOI] [PMC free article] [PubMed] [Google Scholar]
- 4.Defensor EB, Lim MA, Schaevitz LR. 2021. Biomonitoring and digital data technology as an opportunity for enhancing animal study translation. ILAR J 62:223–231. 10.1093/ilar/ilab018. [DOI] [PubMed] [Google Scholar]
- 5.Delgado-SanMartin J, Ehrhardt B, Paczkowski M, Hackett S, Smith A, Waraich W, Klatzow J, Zabair A, Chabokdast A, Rubio-Navarro L, Rahi A, Wilson Z. 2019. An innovative non-invasive technique for subcutaneous tumour measurements. PLoS One 14:e0216690. 10.1371/journal.pone.0216690. [DOI] [PMC free article] [PubMed] [Google Scholar]
- 6.Euhus DM, Hudd C, Laregina MC, Johnson FE. 1986. Tumor measurement in the nude mouse. J Surg Oncol 31:229–234. 10.1002/jso.2930310402. [DOI] [PubMed] [Google Scholar]
- 7.Gwet KL.
- 8.Hall C, von Grabowiecki Y, Pearce SP, Dive C, Bagley S, Muller PAJ. 2021. iRFP (near-infrared fluorescent protein) imaging of subcutaneous and deep tissue tumours in mice highlights differences between imaging platforms. Cancer Cell Int 21:247. 10.1186/s12935-021-01918-8. [DOI] [PMC free article] [PubMed] [Google Scholar]
- 9.Jensen MM, Jørgensen JT, Binderup T, Kjaer A. 2008. Tumor volume in subcutaneous mouse xenografts measured by microCT is more accurate and reproducible than determined by 18F-FDG-microPET or external caliper. BMC Med Imaging 8:16. 10.1186/1471-2342-8-16. [DOI] [PMC free article] [PubMed] [Google Scholar]
- 10.Koo TK, Li MY. 2016. A guideline of selecting and reporting intraclass correlation coefficients for reliability research. J Chiropr Med 15:155–163. 10.1016/j.jcm.2016.02.012. [DOI] [PMC free article] [PubMed] [Google Scholar]
- 11.Resasco A, Carranza Martin AC, Ayala MA, Diaz SL, Carbone C. 2019. Non-aversive photographic measurement method for subcutaneous tumours in nude mice. Lab Anim 53:352–361. 10.1177/0023677218793450. [DOI] [PubMed] [Google Scholar]
- 12.Stasinopoulos DM, Rigby RA. 2007. Generalized additive models for location scale and shape (GAMLSS) in R. J Stat Softw 23:1–46. 10.18637/jss.v023.i07. [DOI] [Google Scholar]
- 13.Tomayko MM, Reynolds CP. 1989. Determination of subcutaneous tumor size in athymic (nude) mice. Cancer Chemother Pharmacol 24:148–154. 10.1007/BF00300234. [DOI] [PubMed] [Google Scholar]
- 14.Tremoleda JL, Kerton A, Gsell W. 2012. Anaesthesia and physiological monitoring during in vivo imaging of laboratory rodents: Considerations on experimental outcomes and animal welfare. EJNMMI Res 2:44. 10.1186/2191-219X-2-44. [DOI] [PMC free article] [PubMed] [Google Scholar]
Associated Data
This section collects any data citations, data availability statements, or supplementary materials included in this article.
Supplementary Materials
Supplementary tables with supporting data, statistical glossary, and further details on ICC calculations.