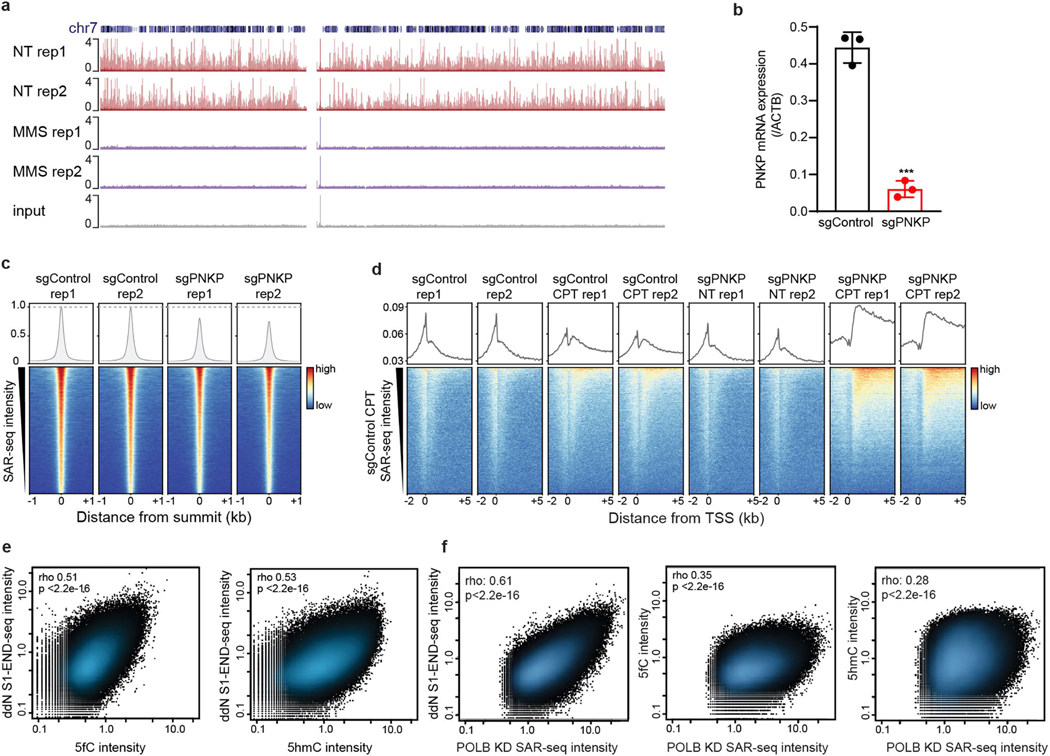
Extended Data Fig. 11 |. Localized SSB repair in neurons correlates with sites of oxidized 5-methylcytosine.
a, Genome browser screenshot of chromosome 7 showing SAR-seq profiles from two biological replicates and input DNA in i3Neurons without MMS treatment (NT, n = 2) or after treatment with 0.1 mg ml−1 MMS (n = 2) for the final 15 min of an 18-h incubation with EdU. After streptavidin pull-down and PCR amplification, total DNA was quantified (NT rep 1: 0.95 μg; NT rep 2: 1.7 μg; MMS rep 1: 3.8 μg; MMS rep 2: 4.5 μg). Stochastic DNA damage results in loss of DNA synthesis at recurrent sites. b, Quantitative RT–PCR analysis showing PNKP mRNA transcript level in i3Neurons after CRISPRi knockdown, cultured in parallel with samples used for SAR-seq. P = 0.00015 by unpaired two-tailed Student’s t-test; ***P < 0.0001 (n = 3). c, Bottom, heat maps of SAR-seq intensities for 1 kb on either side of SAR-seq peak summits for i3Neurons expressing sgControl (n = 2) or sgPNKP (n = 2). Top, aggregate plots of SAR-seq intensity. d, Bottom, heat map of SAR-seq intensity for 1 kb on either side of the transcription start site in i3Neurons, ordered by SAR-seq intensity. i3Neurons expressing sgControl or sgPNKP were either not treated (NT, n = 2) or treated with 25 μM camptothecin (CPT, n = 2) during incubation with EdU. Top, aggregate plots of SAR-seq intensity. e, Scatter plots showing correlations of intensities (RPKM) between SSBs (ddN S1 END-seq) and 5fC or 5hmC, respectively, for 1 kb on either side of SAR-seq peak summits for i3Neurons. Spearman correlation coefficients and P values are indicated. f, Scatter plots showing correlations of intensities (RPKM) between SAR-seq for i3Neurons expressing sgPOLB and ddN S1 END-seq, 5fC, or 5hmC for 1 kb on either side of SAR-seq peak summits. Spearman correlation coefficients and P values are indicated.

