

Abstract
Epcoritamab is a CD3xCD20 bispecific antibody (bsAb) that induces T‐cell–mediated cytotoxicity against CD20‐positive B cells. Target engagement and crosslinking of CD3 and CD20 (trimer formation) leads to activation and expansion of T cells and killing of malignant B cells. The primary objective of the dose‐escalation part of the phase I/II trial of epcoritamab was to determine the maximum tolerated dose, recommended phase II dose (RP2D), or both. For bsAbs, high target saturation can negatively affect trimer formation. The unique properties and mechanisms of action of bsAbs require novel pharmacokinetic (PK) modeling methods to predict clinical activity and inform RP2D selection. Traditional PK/pharmacodynamic (PD) modeling approaches are inappropriate because they may not adequately predict exposure–response relationships. We developed a semimechanistic, physiologically‐based PK/PD model to quantitatively describe biodistribution, trimer formation, and tumor response using preclinical, clinical PK, biomarker, tumor, and response data from the dose‐escalation part of the phase I/II trial. Clinical trial simulations were performed to predict trimer formation and tumor response in patients with diffuse large B‐cell lymphoma (DLBCL) or follicular lymphoma (FL). Model‐predicted trimer formation plateaued at doses of 48 to 96 mg. Simulation results suggest that the 48‐mg dose may achieve optimal response rates in DLBCL and FL. Exposure–safety analyses showed a flat relationship between epcoritamab exposure and risk of cytokine release syndrome in the dose range evaluated. This novel PK/PD modeling approach guided selection of 48 mg as the RP2D and provides a framework that may be applied to other CD3 bsAbs.
Study Highlights.
WHAT IS THE CURRENT KNOWLEDGE ON THE TOPIC?
For bispecific antibodies (bsAbs), the optimal dose is one that leads to maximum trimer formation; therefore, traditional pharmacokinetic (PK) modeling methodologies and exposure–response analyses are inadequate to determine recommended phase II dose (RP2D).
WHAT QUESTION DID THIS STUDY ADDRESS?
This study addresses a major limitation with respect to bsAb dose studies by developing a novel, semimechanistic, physiologically‐based PK/pharmacodynamic (PD) model incorporating preclinical, clinical, and patient biomarker data to identify the RP2D.
WHAT DOES THIS STUDY ADD TO OUR KNOWLEDGE?
The population PK/PD model described epcoritamab concentration–time profiles across doses, and the clinical trial simulations guided selection of the RP2D for epcoritamab.
HOW MIGHT THIS CHANGE CLINICAL PHARMACOLOGY OR TRANSLATIONAL SCIENCE?
Our PK/PD model represents a novel approach and provides a general framework that can be applied to other CD3 bsAbs.
Epcoritamab is a novel, subcutaneously administered, full‐length humanized immunoglobulin G1 bispecific antibody (bsAb) that simultaneously binds to CD3 on T cells and CD20 on B cells to form trimers. Trimer formation leads to activation and expansion of T cells and targeted T‐cell–mediated killing of CD20‐positive malignant B cells. 1 Robust preclinical T‐cell–mediated cytotoxicity against tumor cell‐line models and cells from patients with B‐cell non‐Hodgkin's lymphoma (B‐NHL), including diffuse large B‐cell lymphoma (DLBCL), follicular lymphoma (FL), and mantle cell lymphoma, has been demonstrated. 2 , 3 In an ex vivo study, peripheral or tumor‐resident T cells from patients with B‐NHL showed excellent capacity to induce T‐cell–mediated cytotoxicity in the presence of epcoritamab. 3 In cynomolgus monkeys, subcutaneous administration led to lower peak cytokine levels than intravenous administration. 2 These favorable data from preclinical studies led to initiation of an open‐label, first‐in‐human, phase I/II dose‐escalation/expansion trial of epcoritamab in patients with relapsed or refractory B‐NHL (NCT03625037). 1 The dose‐escalation part of this study met its primary end point of determining the recommended phase II dose (RP2D) of epcoritamab in this population. The maximum tolerated dose (MTD) was not reached. Epcoritamab was well tolerated and had a manageable safety profile. No treatment‐related adverse events leading to discontinuation or death and no cases of neutropenic fever or grade 3 or higher cytokine release syndrome (CRS) events were reported in this study. 1
Trimer formation (target engagement and crosslinking of CD3 and CD20) by epcoritamab leads to activation and expansion of T cells, resulting in the killing of tumor cells. 2 , 3 Therefore, the optimal clinical dose of epcoritamab can be informed by levels of target engagement and trimer formation. 4 , 5 However, unlike typical monoclonal antibodies (mAbs), bsAbs exhibit a “hook effect,” meaning that trimer formation is impaired at high drug concentrations. 5 Thus, high receptor occupancy can lead to suboptimal trimer formation and suboptimal clinical efficacy, and traditional pharmacokinetic (PK)/pharmacodynamic (PD) modeling approaches may be inappropriate to identify the optimal dose of epcoritamab. Rather than targeting high levels of receptor occupancy for the RP2D of epcoritamab, we aimed for epcoritamab concentrations associated with maximal trimer formation (i.e., selection of the RP2D of epcoritamab to be the biologically effective dose of epcoritamab). Herein is described a novel, semimechanistic PK/PD model that leverages preclinical, clinical, and biomarker data to inform the RP2D of epcoritamab.
METHODS
Model structure and parameters
A semimechanistic PK/PD model was developed to quantitatively describe the biodistribution of epcoritamab, trimer formation, and tumor response (Figure 1 ). The semimechanistic PK/PD model includes several submodels, including those describing the PK of epcoritamab, lymphocyte trafficking and turnover, binding of epcoritamab, T‐cell activation, killing of circulating B cells, and tumor killing. Each submodel is described in detail in Supplementary Methods .
Figure 1.
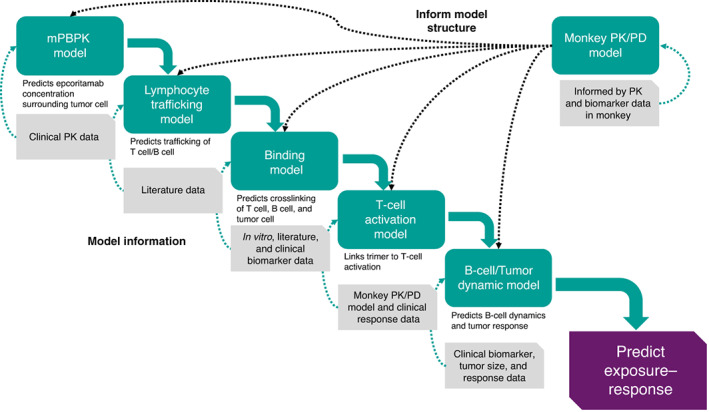
Semimechanistic PK/PD modeling approach used to inform selection of the recommended phase II dose of epcoritamab. mPBPK, minimal physiologically‐based pharmacokinetics; PD, pharmacodynamics; PK, pharmacokinetics.
The structure of the PK submodel is based on a published second‐generation, minimal physiologically‐based PK model developed for mAbs (Figure S1 ). 6 The PK submodel describes the distribution of plasma epcoritamab into tissue compartments (leaky tissue, tight tissue, spleen, tumor lymph node, and lymph) via convective uptake, which is described by a tissue‐compartment–specific lymph flow rate and a vascular reflection coefficient. The passage of epcoritamab from leaky and tight tissue compartments and collection in the lymph compartment are described by lymph flow rates and a lymph reflection coefficient. The model also describes the movement of epcoritamab from the spleen compartment to the tumor lymph node compartment, subsequent collection in the lymph compartment, and drainage from the lymph back into the plasma, as described by the total lymph flow rate. Elimination of epcoritamab from the plasma compartment through linear and nonlinear processes is represented by clearance parameters. Absorption of subcutaneously administered epcoritamab is described by a first‐order rate constant.
The lymphocyte trafficking submodel was developed to describe the trafficking of lymphocytes and to account for the influence of CD3 and CD20 expression on the surface of circulating lymphocytes (T cells and B cells) and the distribution of epcoritamab (Figure S2 ). This submodel describes the movement of lymphocytes from the blood compartment to the spleen compartment, to the tumor lymph node compartment, to the lymph compartment, and back to the blood compartment. The epcoritamab‐binding submodel characterizes the binding of epcoritamab to CD3 on T cells and to CD20 on B cells and tumor cells as well as the crosslinking of CD3 and CD20 by epcoritamab (trimer formation) on free lymphocytes and tumor lymph node cells (Figure S3 ). The submodel for T‐cell activation describes epcoritamab‐induced T‐cell activation against circulating B cells within all compartments containing circulating T cells and B cells and T‐cell activation against tumor cells in the tumor lymph node compartment (Figure S4 ). The circulating B‐cell–killing submodel characterizes the elimination of B cells by activated T cells (Figure S5 ). The tumor‐cell–killing submodel describes tumor growth and the elimination of tumor cells by activated T cells (Figure S6 ).
Data sources
Preclinical PK and T‐cell/B‐cell dynamic data were obtained from studies in healthy cynomolgus monkeys. 2 Epcoritamab concentrations in monkey plasma were determined using a Single Molecule Counting ImmunoAssay method (PRA, Assen, The Netherlands). 2 Lymphocyte counts in whole blood samples and lymph node biopsies were determined by flow cytometry. 2
Clinical PK, safety, biomarker, and tumor response data were obtained from a phase I/II study (NCT03625037) in patients with B‐NHL (dose range, 0.0128–60 mg). 1 In Cycle 1, patients received a priming dose of epcoritamab on Day 1, an intermediate dose on Day 8, and full doses on Days 15 and 22; full‐dose epcoritamab was then administered weekly in Cycle 2, every 2 weeks in Cycles 3–6, and every 4 weeks in Cycle 7 and later. The simulation (to predict and compare efficacy across different doses) covered Cycles 1–3 and used weekly dosing for this period, as in the expansion. Plasma concentrations of epcoritamab were evaluated in blood samples obtained post dosing on Days 1 to 4, 8 to 11, 15, 16, 19, 22, 23, and 26 of Cycle 1; Days 1, 4, 8, 11, 15, and 22 of Cycle 2; Days 1 and 15 of Cycles 3 to 6; and Day 1 of all later cycles. Whole‐blood flow cytometry was used to detect immune cell levels. Different assays were used to quantify plasma concentration of epcoritamab at low and high doses. Details are provided in Supplementary Methods .
Model calibration
To calibrate the model and estimate model parameters, a 2‐stage approach was used. A monkey semimechanistic PK/PD model was fitted to preclinical PK data, T‐cell dynamic data, and B‐cell dynamic data from healthy cynomolgus monkeys using a population‐based modeling approach. Given that healthy cynomolgus monkeys do not have tumors, depletion of circulating B cells was used as the efficacy marker in this model. The monkey semimechanistic PK/PD model is similar in structure to the human model but does not include a tumor lymph node compartment. The human model was developed using some of the parameter values from the monkey model, either directly or allometrically scaled. Other parameters for the human model are based on human‐relevant values from the literature, 6 in vitro data, and available clinical data. The PK submodel was fitted to clinical PK data using a nonlinear mixed effects modeling approach in Monolix. The tumor dynamic submodel was calibrated against clinical response data using a grid search approach. Values for the human model and model parameter variability are listed in Tables S1 and S2 , respectively. A more detailed description of model parameters is provided in Supplementary Methods .
Model evaluation methods
Monte Carlo simulations were performed to evaluate the predictive ability of the human model using 100 virtual patients with DLBCL or FL. The initial condition of the virtual patients was matched to what was observed in patients enrolled in the phase I/II trial (e.g., baseline T‐cell and B‐cell counts). Variability was included in critical model parameters, including PK parameters, baseline T‐cell and B‐cell counts, initial tumor size, tumor growth rate, CD3/CD20 expression levels, T‐cell activation parameters, injection‐induced trafficking parameters, and T‐cell–mediated B‐cell–killing and tumor‐cell–killing parameters. All parameters were assumed to follow a lognormal distribution. Correlations between parameters were not considered. The magnitude of the variability is presented in Table S2 . Results from Monte Carlo simulations were compared with observed T‐cell and B‐cell data from patients in the dose‐escalation part of the phase I/II trial. In addition, simulation‐predicted changes in tumor size were compared with observed changes in tumor size in patients.
Exposure–safety analysis
An exposure–safety analysis was conducted to evaluate the risk of CRS events following epcoritamab dosing. CRS grade was converted from a categorical variable into binary variables (i.e., any grade (yes/no) or grade 2 (yes/no)), and a logistic regression model was used to assess the relationship between risk of CRS events after the priming, intermediate, and first and second full doses of epcoritamab and the maximum concentration (Cmax) of epcoritamab during the respective dosing interval. The model included the dosing interval (priming, intermediate, first full dose, and second full dose) as a categoric covariate and interaction between the dose categoric covariate and Cmax. Epcoritamab Cmax was selected as the exposure metric for the exposure–safety analyses based on the observation that peak cytokine concentrations (e.g., for interleukin 6) tend to occur within 4 days after epcoritamab dosing, consistent with the time to Cmax of 2 to 3 days for epcoritamab. The relationship between the Cmax of epcoritamab and occurrence of grade 2 CRS events was also explored, because no grade ≥ 3 CRS events were reported in the phase I dose escalation.
Selection of the RP2D using the calibrated human PK/PD model
Using the calibrated human model, clinical trial simulations were conducted to separately inform the selection of the RP2D for FL and for DLBCL. Clinical trial simulations were conducted to predict trimer formation in 100 virtual patients with DLBCL and 100 virtual patients with FL across a range of epcoritamab doses administered weekly for 12 weeks. Additional simulations were conducted to predict clinical response rates over the same range of epcoritamab doses after 12 weeks of weekly administration. The simulated trials were designed to match the DLBCL and FL groups and planned sample size of the expansion part of the epcoritamab phase I/II trial. For each dose level, 100 replicates for each of the DLBCL and FL groups were simulated with 128 virtual patients in each replicate trial. The simulation accounted for patient dropout due to disease progression as determined by a 50% or higher increase in tumor size at an efficacy assessment. The simulation did not account for any other reasons for patient dropout. Variability was included in critical model parameters (for more details, refer to the “Model evaluation methods” section). Predicted response rates from each replicate trial were summarized across dose levels. Selection of the RP2D was informed by the results from clinical trial simulations and exposure–safety analysis.
Sensitivity analysis
To assess impact of uncertainty in model parameters on model predictions, global sensitivity analyses were conducted using the R package multisensi (R Foundation, Vienna, Austria). Sensitive model parameters with a meaningful effect on model‐predicted trimer formation and change in tumor size were identified. Local sensitivity analyses of select sensitive model parameters were performed to assess impact of parameter uncertainty on model prediction and selection of the optimal dose.
Analysis software
Population PK analyses were performed using Monolix version 2019 (R2, Lixoft, Antony, France). Model calibration and simulations were performed using R version 4.0.2 and the mrgsolve package (R Foundation). Sensitivity analysis was performed using R and multisensi package.
Ethics approval
The phase I/II clinical study was performed in accordance with Good Clinical Practice Guidelines from the International Council for Harmonization of Technical Requirements for Pharmaceuticals for Human Use and the principles of the Declaration of Helsinki. All protocols were approved by the appropriate institutional review boards, and all participants provided written informed consent, as previously described. 1 All animal studies were conducted in accordance with the European Convention for the Protection of Vertebrate Animals Used for Experimental and Other Scientific Purposes (Council of Europe) under control of the UK Home Office. All authors attest to the validity of the data and adherence to the trial protocol.
RESULTS
Model calibration and validation
The fitted monkey PK/PD model was able to describe epcoritamab PK, T‐cell dynamic, and B‐cell dynamic data in monkeys after epcoritamab administration. The final PK submodel described observed PK data (n = 67) from the phase I/II trial reasonably well (Figure S7 ), and model parameters were estimated with good precision (Tables S1 and S2 ). The overall immunogenicity rate of epcoritamab was low (8%). Antidrug antibody–positive status did not appear to affect PK.
Exposure–response analysis using an empiric maximum effect (Emax) model demonstrated that model‐predicted response rates provided an adequate fit to observed data (n = 60) from the phase I/II trial (Figure 2 ). The model‐predicted Emax was 76.2% and the estimated half‐maximal effective concentration (EC50) was 0.788 nM (relative standard error, 67.1%) across all indications. An epcoritamab dose of 3 mg corresponded to the model‐estimated EC50. Results of the clinical trial simulations using the human PK/PD model also showed good agreement between model‐predicted response probabilities and observed data (Figure 2 ).
Figure 2.
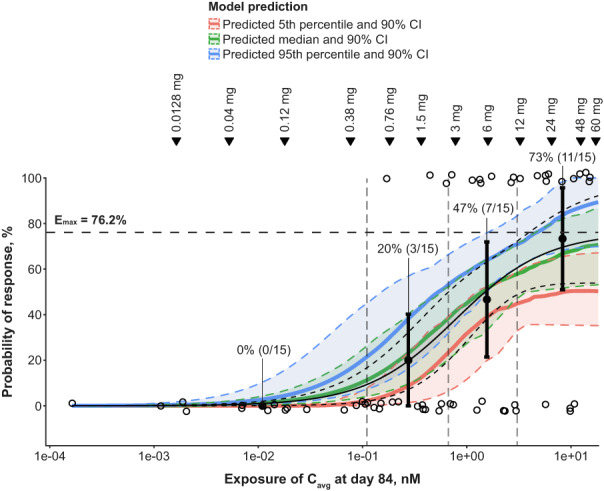
Validation of the human PK/PD model. Visual predictive check comparing predicted response rates from the final Emax model to observed response rates as well as visual predictive check comparing simulated response rates from the final human PK/PD model to observed response rates from the phase I/II trial. The black solid curve represents the predicted probability of response based on the fitted Emax model. The black dashed curve represents the 90% CI of the Emax model–predicted response probability. The horizontal dashed line marks the model‐predicted Emax. For the simulated response rate, a total of 100 replicates of the dose‐escalation part of the phase I/II trial were simulated. Cavg at Day 84 represents the average epcoritamab concentration over Days 0–84 of epcoritamab treatment. The green line and shaded region represent the median model‐predicted probability of response and 90% CI, respectively. The blue and red lines and shaded regions represent the 95th and 5th percentiles of the model‐predicted probability of response and associated 90% CIs. The observed data are grouped based on epcoritamab Cavg quartiles (vertical dashed lines). Open circles represent observed responses in individual patients. Filled circles and error bars in each quartile represent the observed clinical response rate and 90% CI, as indicated by the percentages and associated sample sizes. Inverted triangles mark PK model–predicted mean epcoritamab Cavg over Days 0–84 at each epcoritamab full dose level (0.0128–60 mg) investigated in the dose‐escalation study. Cavg, average concentration; CI, confidence interval; Emax, maximum effect; PD, pharmacodynamics; PK, pharmacokinetics.
Model evaluation
Monte Carlo simulations using the final human PK/PD model were performed to predict changes from baseline in tumor size (Figure 3 ), peripheral B‐cell counts (Figure 4 ), and peripheral T‐cell counts (Figure 5 a,b ). The model‐predicted changes in tumor size captured general trends in tumor dynamics observed in patients at different epcoritamab doses (Figure 3 ). Multiple tumors from the same patients tended to show similar dynamics (Figure 3 ), supporting use of one representative tumor in the human PK/PD model. The discrepancy between model predictions and observed tumor reductions at lower doses (e.g., 0.12 mg) may be due to the low number of patients enrolled at those doses. In general, the model predicts tumor growth at 0.12 mg; however, in a small percentage of virtual patients, the model predicts tumor reduction similar to what was observed. Results of the model‐based simulations of changes in B‐cell counts also generally aligned with trends in observed B‐cell dynamics in patients at different dose levels (Figure 4 ), with some underpredictions and overpredictions, based on individual patients' B‐cell dynamics falling outside the 90% model prediction. The discrepancy between model predictions and observed B‐cell reduction at certain doses (e.g., 0.12, 0.76, and 48 mg) may be due to the low number of patients with B‐cell measurements at those doses. In addition, it was not possible to accurately calibrate the baseline B‐cell production model parameter to individual patients because patients enrolled in the study with reduced baseline B‐cell count in blood, a result of prior anti‐CD20 therapies. The B‐cell count over time is normalized to baseline and, therefore, the shape of the observed B‐cell dynamic data is sensitive to uncertainty in baseline B‐cell measurements. Model‐predicted T‐cell dynamics also showed the same general trends as observed data. The model predicted injection‐induced transient decline in blood T cells after administration of epcoritamab reasonably well during the first cycle (Figure 5 a ) and treatment‐induced T‐cell expansion over six cycles (Figure 5 b ). Some underprediction may be attributed to variability in measurement of baseline T‐cell counts used to normalize observed T‐cell data.
Figure 3.
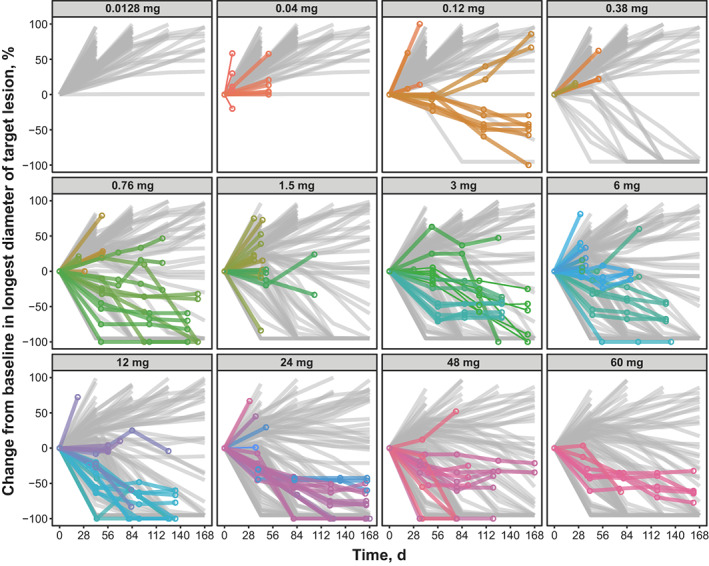
Model‐predicted vs. observed changes from baseline in tumor size at full dose levels of epcoritamab evaluated in the dose‐escalation study. Monte Carlo simulations of 100 virtual patients with one tumor each were conducted for each full dose of epcoritamab. Gray lines represent model‐predicted changes in tumor size for each virtual patient. Colored circles and lines represent observed changes in tumor size in individual patients from the phase I/II trial. Multiple tumors from the same patient are grouped by the same color. d, days.
Figure 4.
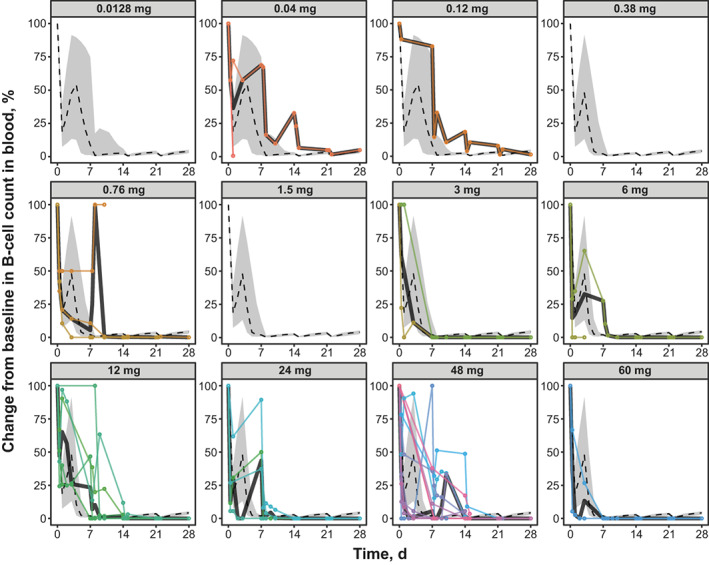
Model‐predicted vs. observed blood B‐cell dynamics at full dose levels of epcoritamab evaluated in the dose‐escalation study. Monte Carlo simulations of 100 virtual patients with one tumor each were conducted for each full dose of epcoritamab. Dashed lines represent median changes in each virtual patient's blood B‐cell count as predicted by model simulation. Gray shading represents 90% CIs of the model prediction. Colored circles and lines represent observed changes in B‐cell counts in individual patients in the phase I/II trial. d, days.
Figure 5.
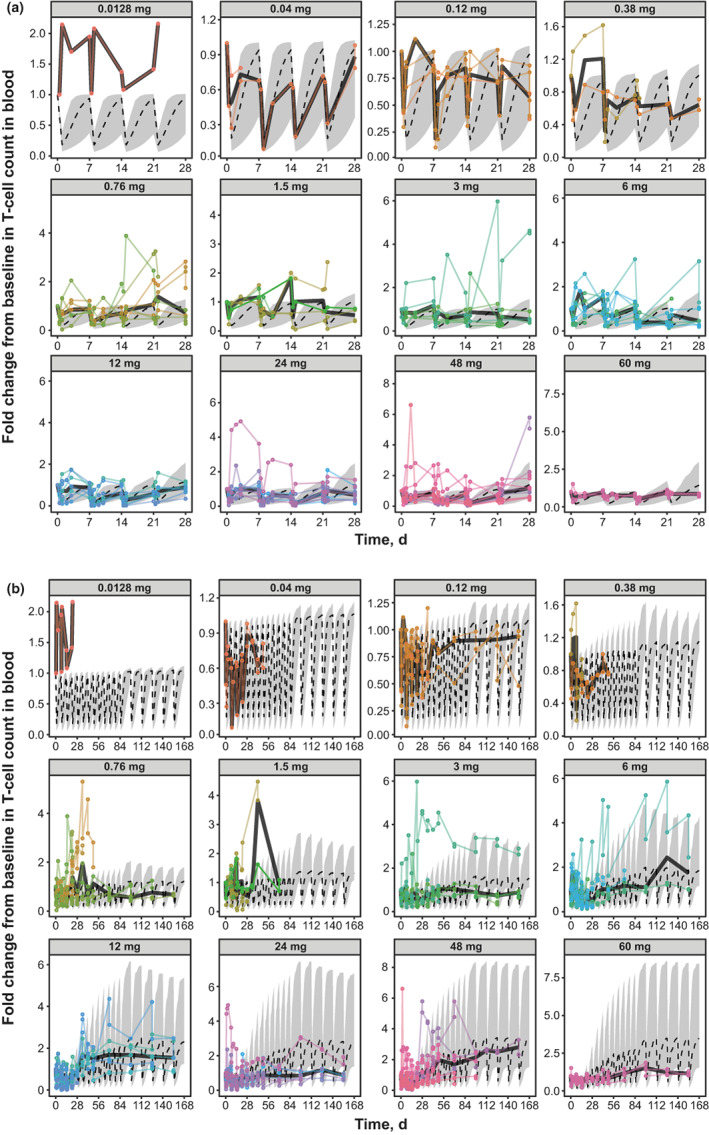
Model‐predicted vs. observed blood T‐cell dynamics at full dose levels of epcoritamab in (a): Cycle 1 and (b): Cycles 1–6. Monte Carlo simulations of 100 virtual patients with one tumor each were conducted for each full dose of epcoritamab. Dashed lines represent median changes in each virtual patient's blood T‐cell count as predicted by model simulation. Gray shading represents 90% CIs of the model prediction. Colored circles and lines represent observed changes in T‐cell counts in individual patients in the phase I/II trial. CIs, confidence intervals; d, days.
Exposure–safety analysis
The exposure–safety model demonstrated a flat relationship between epcoritamab Cmax exposure and probability of a CRS event of any grade across the dose range explored (0.004–60 mg; Figure 6 a ). Consistent with observed data, the model confirmed a low risk of grade 2 CRS events and, more importantly, a flat relationship between Cmax and risk of grade 2 CRS events (Figure 6 b ). Analysis of the covariate effect of priming, intermediate, and first and second full doses on the probability of any‐grade CRS events showed that the risk of CRS events (any grade) was statistically higher after the intermediate and first full doses compared with the priming and second full doses. The relationship between the Cmax of epcoritamab and probability of a CRS event remained flat for the intermediate and first full doses. The risk of grade 2 CRS events was similar for priming, intermediate, and first and second full doses.
Figure 6.
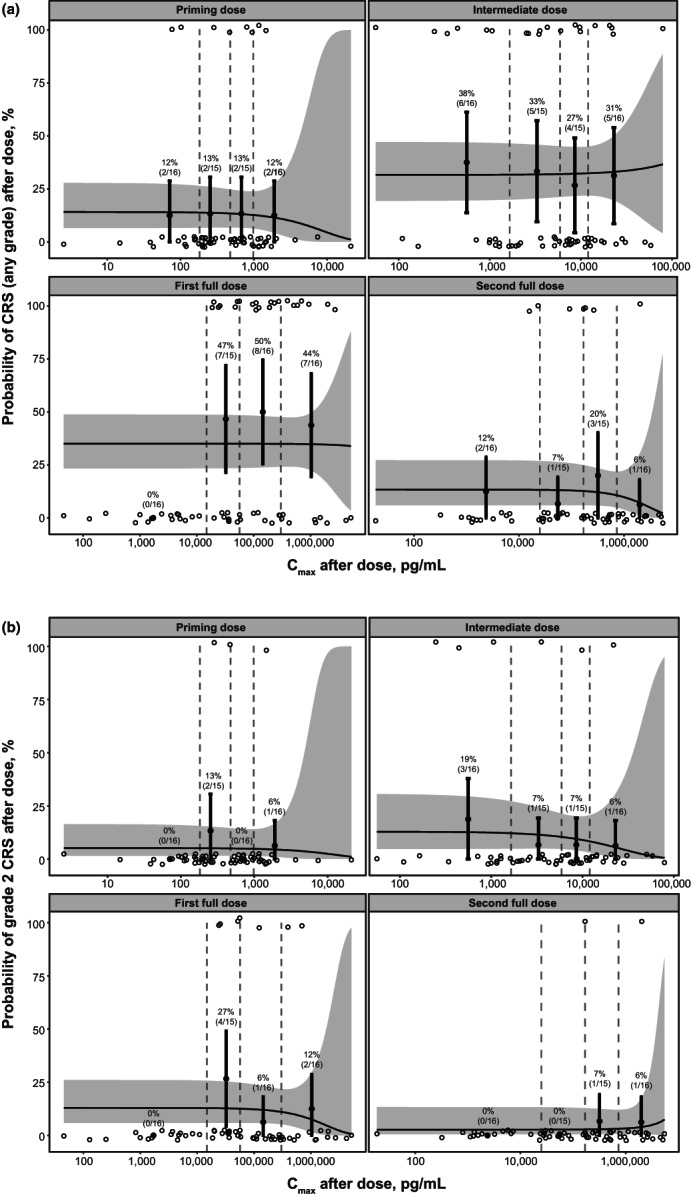
Exposure–safety analysis showing relationship of epcoritamab Cmax and probability of (a): CRS (any grade) and (b): grade 2 CRS after priming, intermediate, first full, and second full doses. Open circles represent the observed incidence of CRS during each dose interval. Observed data are grouped by epcoritamab Cmax quartiles (denoted by vertical dashed lines). Filled circles and error bars in each quartile represent observed response rates and 90% CIs as indicated by the percentages and associated patient sample sizes. Solid lines and shaded regions represent model‐predicted probabilities of a CRS event and 90% CIs, respectively. Priming dose, 0.004–0.16 mg; intermediate dose, 0.0128–1.6 mg; and first and second full doses, 0.0128–60 mg. Cmax, maximum concentration; CIs, confidence intervals; CRS, cytokine release syndrome.
RP2D selection using calibrated human PK/PD model
Clinical trial simulations using the calibrated human PK/PD model were conducted to predict the epcoritamab dose associated with optimal trimer formation and optimal clinical response rates. Simulations showed that trimer formation was maximized at epcoritamab full doses ranging from 48 to 96 mg and started to decrease at simulated doses of 192 mg and higher in virtual patients with DLBCL (Figure 7 a ) and in virtual patients with FL (Figure 7 b ). These observations suggested that the optimal epcoritamab dose is between 48 and 96 mg. Simulations conducted to predict clinical response rates for the DLBCL and FL groups of the epcoritamab phase I/II trial showed that response rates were highest across the dose range of 48 to 192 mg and decreased at doses exceeding 192 mg in patients with DLBCL (Figure 7 c ) and FL (Figure 7 d ), supporting an optimal epcoritamab dose range of 48 to 192 mg.
Figure 7.
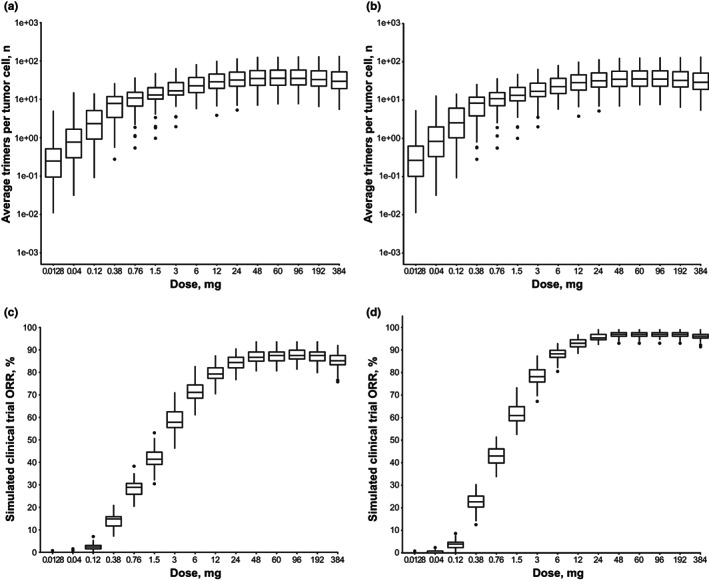
Model‐predicted trimer formations in patients with (a): DLBCL or (b): FL and simulated clinical trial ORRs in patients with (c) DLBCL or (d) FL. In panels a and b, trimer formation estimates are based on Monte Carlo simulations of 100 virtual patients with one tumor each. Box and whisker plots show the model‐predicted number of trimers formed per tumor cell over Days 0–84 by epcoritamab dose. For panels c and d, clinical trial simulations were conducted with 100 trials at each dose level and 128 virtual patients in each trial. Model‐predicted response rates at Day 84 are summarized across epcoritamab doses. For all box and whisker plots, horizontal lines of each box represent the first quartile (lower hinge), median (middle line), and third quartile (upper hinge); whiskers mark 1.5× the interquartile range from the hinge. Solid circles represent outliers. DLBCL, diffuse large B‐cell lymphoma; FL, follicular lymphoma; ORR, overall response rate.
Sensitivity analyses
Global sensitivity analyses demonstrated that the following model parameters meaningfully affected prediction of trimer formation (Figure S8 a): rates of T‐cell activation against tumor cells, tumor‐cell killing by activated T cells, and T‐cell production; levels of CD3 expression on T cells and CD20 expression on tumor cells; natural degradation rate of CD20; and turnover rate of activated T cells. Sensitivity analyses identified a similar set of sensitive model parameters that could meaningfully affect prediction of tumor‐cell killing (Figure S8 b), including levels of tumor‐cell accessibility to activated T cells (tumor‐cell depth), CD3 expression on T cells, and CD20 expression on tumor cells; rates of T‐cell production, tumor‐cell killing by activated T cells, and T‐cell activation against tumor cells; and natural degradation rate of CD20.
To account for uncertainty in sensitive model parameters, variability was directly introduced for some parameters when generating virtual patients in the Monte Carlo and clinical trial simulations. For other sensitive parameters (e.g., natural degradation rate of CD20), variability was indirectly introduced through variability in CD20 expression, because uncertainty in the rate of degradation of CD20 contributes to uncertainty in levels of CD20 expression. Variability in the tumor‐cell depth parameter was not considered in the clinical trial simulations. Local sensitivity analyses were conducted to assess the effect of the tumor‐cell depth parameter on model‐predicted response rates across a range of epcoritamab doses. Increasing the depth parameter by twofold increased maximum predicted response rates in patients with DLBCL (Figure S9 a) and patients with FL (Figure S9 b). However, the shape of the dose–response curve remained the same regardless of the depth value used, further supporting an optimal epcoritamab dose range of 48–192 mg.
DISCUSSION
In this study, we developed and applied a semimechanistic, physiologically‐based PK/PD model to support the selection of the RP2D of epcoritamab. The model describes the distribution of epcoritamab; binding of epcoritamab to CD3 and CD20 on T cells and B cells, respectively; trafficking of lymphocytes and its impact on antibody distribution; dynamics of T cells and B cells in response to treatment with epcoritamab; and the effect of treatment with epcoritamab on lesion size. The model leveraged in vitro data; preclinical PK/PD data from cynomolgus monkeys; data from the literature; and clinical PK, biomarker, safety, and tumor response data from the phase I/II trial. The performance of each of the submodels was qualified against clinical data when available. For example, the PK model was qualified via fitting to clinical PK data. The binding submodel was based on in vitro binding data (e.g., binding parameters) and built using the law of mass action; however, clinical binding data were not available to assess the performance of this model. The performance of the lymphocyte tracking (Figures 4 and 5 ), T‐cell activation (Figure 5 ), and B‐cell and tumor (Figure 4 ) dynamic submodels was compared against clinical data. The submodels performed well and are mechanistically sound. Exposure–response relationships observed in the clinical trial were well characterized by the calibrated PK/PD model. The model was able to capture the observed changes in lesion size in patients as well as the dynamics of T cells and B cells over a wide range of epcoritamab doses. However, there were some underprediction and overprediction of B‐cell dynamics and some underprediction of the change in T‐cell count in some patients, potentially as the result of limited observed data. These unexpected findings may be partly explained by clinical variability and the small number of patients with detectable B cells (n = 39). The values used for the parameters describing epcoritamab‐induced lymphocyte trafficking, T‐cell expansion, and B‐cell killing in the clinical trial simulations may not accurately reflect real‐world variability in patients. Furthermore, variability in baseline T‐cell and B‐cell counts in this population of patients with relapsed/refractory non‐Hodgkin's lymphoma could have affected baseline‐normalized values of T‐cell and B‐cell dynamics, contributing to discrepancies between the observed and model‐predicted results.
A main goal of phase I clinical trials in oncology is to establish the MTD, which is often selected as the RP2D. However, for targeted therapeutics (e.g., mAbs, bsAbs), dose‐limiting toxicities may not occur until doses are considerably higher than effective doses, thereby complicating the decision criteria for stopping dose escalation. 7 Therefore, employing MTD‐based strategies to identify the RP2D can sometimes lead to selection of a dose that is much higher than a sufficiently effective dose. 7 As a result, the selected RP2D using conventional PK/PD modeling may be associated with an unnecessarily high safety risk, necessitating collection of postmarketing data related to dose optimization for regulatory agencies. 8 , 9 , 10 An alternative strategy focuses on identifying a biologically effective dose based on an array of efficacy markers, such as target engagement, pharmacodynamic markers, and, for bispecific therapeutics, trimer formation. 7 , 11 , 12 We used model‐predicted clinical response rate and trimer formation as efficacy markers to identify the biologically effective dose of epcoritamab. Our model predicted that trimer formation would plateau over the dose range of 48–96 mg and start to decrease at doses higher than 192 mg due to the hook effect. Model‐predicted clinical response rate started to plateau at 48 mg and started to decrease at doses higher than 192 mg. The model predicted that clinical response follows a trend similar to trimer formation, due to the fact that efficacy is primarily driven by trimer formation. Therefore, the 48‐mg dose was identified as the biologically effective dose. Taken together with results of the exposure–safety analysis demonstrating that 48 mg was not associated with elevated risk of CRS events, these data support the 48‐mg dose as the RP2D.
The inclusion of a mechanistic model of antibody binding is necessary to capture the behavior of bsAbs. As discussed, dose optimization of bsAbs differs from that of mAbs due to the hook effect, 5 which can cause high levels of target engagement to reduce levels of trimer formation. Exposure–response analyses often make use of Emax models, which monotonically increase and thus cannot account for the hook effect. This shortcoming may lead to selection of a dose too high to maximize trimer formation. By including a mechanistic description of the binding kinetics of epcoritamab, the developed PK/PD model was able to describe the hook effect and predict the epcoritamab dose range associated with optimal trimer formation and, in turn, efficacy.
Application of a semimechanistic model may have advantages over typical exposure–response analysis for novel therapies, including epcoritamab. Standard exposure–response analyses require data collection over a sufficiently wide range of doses and a clear dose–response relationship to provide a meaningful prediction of the RP2D. The 3 + 3 dose‐escalation design commonly used in phase I clinical trials has limitations, and inferior operating characteristics such as small sample size (typically three patients per dose level 13 , 14 ) may identify the MTD in as few as 30% of trials 15 and potentially result in a high proportion of patients being treated at subtherapeutic doses, 16 all of which can be problematic for determining an optimal dose. In addition, meaningful exposure–response analysis can be conducted only after the MTD has been reached or sufficiently robust data have been collected. These requirements will likely delay RP2D identification and initiation of the phase Ib/II part of a clinical trial. Semimechanistic modeling can leverage understanding of the underlying physiology and mechanism of action of a bsAb to predict the expected optimal dose. Model predictions can be confirmed once all dose–response data are available. We first developed the semimechanistic model using preclinical PK/PD data from cynomolgus monkeys. The human model was subsequently developed based on preclinical model and clinical PK data, clinical response, and biomarker data available at the time. The model predicted the optimal dose to be between 48 and 192 mg based on model‐projected trimer formation and simulated clinical response rates. Furthermore, model‐based predictions supported the decision to stop dose escalation before the MTD was reached, preventing exposure of patients to higher doses and accelerating the planning and initiation of the phase Ib/II part of the trial.
This general model structure and modeling approach may be applicable to other T‐cell–redirecting bsAbs. The minimal physiologically‐based PK model framework—binding of the bsAb to T cells, T‐cell trafficking, and T‐cell activation—is generally applicable to a wide range of T‐cell–redirecting bsAbs with minor to moderate modification of the model structure and parameters. Similarly, the approach of leveraging preclinical data for early modeling, iteratively updating the model using available clinical data, and running clinical trial simulations can be applied to other phase I oncology clinical trials and potentially accelerate timelines and reduce the number of patients exposed to suboptimal doses.
In conclusion, this semimechanistic PK/PD modeling methodology represents a valuable, novel approach for determining the optimal dose for bsAbs during phase I trials. Simulations based on the final PK/PD model helped identify an RP2D for epcoritamab that led to optimal trimer formation and clinically relevant response rates while minimizing the risk of CRS events. This accelerated dose escalation and allowed for earlier initiation of the phase Ib/II part of the study. The model may be extended to other T‐cell–redirecting bsAb therapeutics with relative ease. Further development and expansion of the model to include a cytokine component could provide information regarding the dynamics of cytokine release. Moreover, if combined with time‐to‐event modeling, this modeling approach could provide an integrated method for dose finding, incorporating efficacy and safety predictions into a single integrated analysis. Based on population PK, PK/PD modeling, exposure–response, and exposure–adverse‐event analyses along with clinical efficacy and safety data, a full dose of 48 mg was chosen as the RP2D for epcoritamab.
FUNDING
This study was funded by Genmab. The sponsor was involved with data collection, analysis, interpretation, writing of the manuscript, and the decision to submit for publication.
CONFLICT OF INTEREST
All authors are employees of Genmab and may own stock or stock options.
AUTHOR CONTRIBUTIONS
T.L., I.H.H., C.C., R.S.O., B.E., D.D., T.S., F.L.E., T.A., and M.G. wrote the manuscript. T.L., I.H.H., and T.S. designed and performed the research. T.L., I.H.H., C.C., R.S.O., B.E., D.D., T.S., F.L.E., K.S., T.A., and M.G. analyzed the data.
Supporting information
Supinfo
ACKNOWLEDGMENTS
Medical writing was provided by Lela Creutz, PhD, and Stevin Joseph, PharmD, of Peloton Advantage, LLC, an OPEN Health company, Parsippany, NJ, and funded by Genmab.
DATA AVAILABILITY STATEMENT
Clinical trial data can be requested by qualified researchers for use in rigorous, independent scientific research as long as the trials are not part of an ongoing or planned regulatory submission. Sharing of data is subject to protection of patient privacy and respect for patients' informed consent. Data will be provided following review and approval of a research proposal and statistical analysis plan and execution of a Data Sharing Agreement. For approved requests, data will be accessible for 12 months, with possible extensions considered. For more information on the process or to submit a request, contact clinicaltrials@genmab.com.
References
- 1. Hutchings, M. et al. Dose escalation of subcutaneous epcoritamab in patients with relapsed or refractory B‐cell non‐Hodgkin lymphoma: an open‐label, phase 1/2 study. Lancet 398, 1157–1169 (2021). [DOI] [PubMed] [Google Scholar]
- 2. Engelberts, P.J. et al. DuoBody‐CD3xCD20 induces potent T‐cell‐mediated killing of malignant B cells in preclinical models and provides opportunities for subcutaneous dosing. EBioMedicine 52, 102625 (2020). [DOI] [PMC free article] [PubMed] [Google Scholar]
- 3. van der Horst, H. et al. Epcoritamab induces potent anti‐tumor activity against malignant B‐cells from patients with DLBCL, FL and MCL, irrespective of prior CD20 monoclonal antibody treatment. Blood Cancer J. 11, 38 (2021). [DOI] [PMC free article] [PubMed] [Google Scholar]
- 4. Jiang, X. et al. Development of a Target cell‐Biologics‐Effector cell (TBE) complex‐based cell killing model to characterize target cell depletion by T cell redirecting bispecific agents. MAbs 10, 876–889 (2018). [DOI] [PMC free article] [PubMed] [Google Scholar]
- 5. Li, T. et al. Novel semi‐mechanistic model leveraging preclinical and clinical data to inform the recommended phase 2 dose (RP2D) selection for epcoritamab (DuoBody CD3xCD20). Blood 136, 35–36 (2020). [Google Scholar]
- 6. Cao, Y. , Balthasar, J.P. & Jusko, W.J. Second‐generation minimal physiologically‐based pharmacokinetic model for monoclonal antibodies. J. Pharmacokinet. Pharmacodyn. 40, 597–607 (2013). [DOI] [PMC free article] [PubMed] [Google Scholar]
- 7. Sachs, J.R. , Mayawala, K. , Gadamsetty, S. , Kang, S.P. & de Alwis, D.P. Optimal dosing for targeted therapies in oncology: drug development cases leading by example. Clin. Cancer Res. 22, 1318–1324 (2016). [DOI] [PubMed] [Google Scholar]
- 8. Kurzrock, R. et al. Activity of XL184 (cabozantinib), an oral tyrosine kinase inhibitor, in patients with medullary thyroid cancer. J. Clin. Oncol. 29, 2660–2666 (2011). [DOI] [PMC free article] [PubMed] [Google Scholar]
- 9. Elisei, R. et al. Cabozantinib in progressive medullary thyroid cancer. J. Clin. Oncol. 31, 3639–3646 (2013). [DOI] [PMC free article] [PubMed] [Google Scholar]
- 10. Center for Drug Evaluation and Research. 203756Orig1s000 approval letter <https://www.accessdata.fda.gov/drugsatfda_docs/nda/2012/203756Orig1s000RiskR.pdf> (2012). Accessed Jun 29, 2022.
- 11. de Araujo Toloi, D. , Jardim, D.L.F. , Hoff, P.M.G. & Riechelmann, R.S.P. Phase I trials of antitumour agents: fundamental concepts. Ecancermedicalscience 9, 501 (2015). [DOI] [PMC free article] [PubMed] [Google Scholar]
- 12. Kaufman, H.L. , Wadler, S. & Antman, K. Molecular Targeting in Oncology (Humana Press, Totowa, NJ, 2008). [Google Scholar]
- 13. Rogatko, A. , Schoeneck, D. , Jonas, W. , Tighiouart, M. , Khuri, F.R. & Porter, A. Translation of innovative designs into phase I trials. J. Clin. Oncol. 25, 4982–4986 (2007). [DOI] [PubMed] [Google Scholar]
- 14. Le Tourneau, C. , Lee, J.J. & Siu, L.L. Dose escalation methods in phase I cancer clinical trials. J. Natl. Cancer Inst. 101, 708–720 (2009). [DOI] [PMC free article] [PubMed] [Google Scholar]
- 15. Reiner, E. , Paoletti, X. & O'Quigley, J. Operating characteristics of the standard phase I clinical trial design. Comput. Stat. Data An. 30, 303–315 (1999). [Google Scholar]
- 16. Simon, R. , Freidlin, B. , Rubinstein, L. , Arbuck, S.G. , Collins, J. & Christian, M.C. Accelerated titration designs for phase I clinical trials in oncology. J. Natl. Cancer Inst. 89, 1138–1147 (1997). [DOI] [PubMed] [Google Scholar]
Associated Data
This section collects any data citations, data availability statements, or supplementary materials included in this article.
Supplementary Materials
Supinfo
Data Availability Statement
Clinical trial data can be requested by qualified researchers for use in rigorous, independent scientific research as long as the trials are not part of an ongoing or planned regulatory submission. Sharing of data is subject to protection of patient privacy and respect for patients' informed consent. Data will be provided following review and approval of a research proposal and statistical analysis plan and execution of a Data Sharing Agreement. For approved requests, data will be accessible for 12 months, with possible extensions considered. For more information on the process or to submit a request, contact clinicaltrials@genmab.com.