Abstract
Whether N6-methyladenosine (m6A) is involved in biliary atresia (BA) remains undefined. Herein, we comprehensively evaluated the m6A profile in BA. When compared with normal controls, BA had an elevated m6A level with upregulated m6A writers. The m6A level was correlated with liver function, stage of fibrosis and jaundice clearance in BA. Methylated RNA immunoprecipitation sequencing (MeRIP-seq) demonstrated an altered m6A topology in BA. MeRIP-seq and RNA sequencing filtered out 130 m6A-modified genes, which were enriched in fibrogenetic pathways. MeRIP-qPCR in vivo and interventions of LX-2 and primary HSCs in vitro validated the regulatory role of m6A on COL1A1 and THY1. THY1+ myofibroblasts expanded in portal area of BA, and highly expressed profibrogenic genes (COL1A1, MMP2, PDGFRA, and DCN). THY1 was correlated with liver fibrosis and jaundice clearance in BA. Bulk array (GSE46960, GSE15235), single-cell RNA sequencing (GSE136103), primary HSC interventions, and co-immunoprecipitation revealed that THY1 was correlated with extracellular matrix organization, promoted HSC activation, showed higher interactions with integrins on myeloid cells in cholestatic fibrosis, and was correlated with native liver survival in BA. Our study highlights the significance of m6A in BA-induced liver fibrogenesis by regulating THY1, shedding new light on the novel therapies to alleviate liver fibrosis by targeting m6A/THY1 axis in BA.
INTRODUCTION
Biliary atresia (BA), a dominating etiology of obstructive jaundice in infants, is characterized by fibroinflammatory cholangiopathy, which results in progressive liver fibrosis and even cirrhosis.1 BA is the major cause of end-stage liver disease and the most common indication for liver transplantation (LT) in children.2 However, the mechanism of liver fibrosis remains largely undefined.
Myofibroblasts (MFs), which are origninated from HSCs or fibroblasts in choletastic diseases,3 produce excessive extracellular matrix (ECM) to drive liver fibrosis.4 A large body of evidence demonstrated that epigenetic remodeling controls HSC activation and progression of fibrosis. N6-methyladenosine (m6A) is the most common RNA methylation modification in eukaryotes.5,6 However, the role of m6A in HSC activation and liver fibrosis remained largely undefined. A recent study found that Mettl3 deficiency mitigated HSC activation and liver fibrosis7 by controlling the Hippo/YAP signaling pathway. Another study also found that ALKBH5 overexpression ameliorated liver fibrosis and suppressed HSCs activation via triggering PTCH1 activation.8 In addition to the role of m6A writer and erasers, m6A reader YTHDF1 regulated the ferroptosis of HSCs through stabilizing BECN1 mRNA,9 and YTHDF3-mediated PRDX3 translation alleviates liver fibrosis. Taken together, m6A played significant roles in liver fibrosis by a variety of pathways.
Previous studies mainly focused the role of m6A in animal models, in which carbon tetrachloride–induced liver fibrosis was commonly used. However, the studies of m6A methylation in human disease are scarce. Noteworthily, cholestic liver fibrosis has different characteristics when compared with chemical drug-induced liver fibrosis. Furthermore, although BA belongs to the choletastic diseases, its pathogenesis, diagnosis, and treatment are completely different. Therefore, exploration of the role of m6A in BA is urgently needed. In this study, BA had an elevated m6A level with upregulated m6A writers. Methylated RNA immunoprecipitation sequencing (MeRIP-seq) and RNA sequencing (RNA-seq) identified COL1A1 and THY1 as m6A-modified genes. MeRIP-qPCR in vivo and the experimental results of LX-2 and primary HSCs in vitro validated the regulatory role of m6A on COL1A1 and THY1. THY1 promoted HSC activation, and was correlated with liver fibrosis and BA prognosis. This study provides important insights into the role of m6A modification in the liver fibrosis of BA, shedding new light on novel therapies to alleviate liver fibrosis by targeting m6A/THY1 axis in BA.
METHODS
Patient samples
To acquire the level of m6A in liver samples, a total of 27 hepatoblastoma (HB), 28 cholestasis (CS), and 63 BA patients were selected for m6A RNA methylation quantification, their clinical data is presented in Table S1 (Supplementary Material, http://links.lww.com/HC9/A2). HB was diagnosed through liver permanent histopathology, while intraoperative cholangiography and subsequent liver histological examination were used for the diagnosis of CS and BA. The etiology of CS contained Alagille syndrome (4 cases), loss of BSEP gene (1 case), cytomegalovirus hepatitis (2 cases), citrin deficiency (2 cases), Zellweger syndrome (1 case), and idiopathic CS (18 cases). All BA patients were classified as type III according to the clinical phenotype. Liver tissues of all patients were acquired for further analysis and divided into experimental group (BA), normal control (NC) group (normal liver tissue adjacent to the excised HB), and disease control group (CS). One part of liver tissue was fixed in 4% paraformaldehyde for hematoxylin-eosin and Masson staining, and the rest was immediately stored at −80°C for RNA and protein extractions. The grades of liver inflammation and stages of fibrosis were defined as described in our previous study,10 ranging from G0 to G3 and from S0 to S4, respectively. The prognostic information such as jaundice clearance (JC) and native liver survival (NLS) was collected from 46 out of 64 BA patients. JC was defined as total bilirubin <20 μmol/L.11 At 3 and 6 months after Kasai portoenterostomy (KPE), 28 BA patients achieved JC, while 18 BA patients still suffered from jaundice. During the 2-year follow-up after KPE, 34 BA patients had NLS, whereas 12 BA patients underwent LT or death. To determine the mRNA expression levels of m6A writers, erasers, and THY1, 24 cases of HB, 24 cases of CS, and 24 cases of BA were selected from the above patients, and their baseline characteristics are summarized in Table S2 (Supplementary Material, http://links.lww.com/HC9/A2).
A total of 4 HB (NC) and 4 BA patients were enrolled for the MeRIP-seq and RNA-seq. The liver tissues were harvested from BA patients at the time of LT. The detailed information of patients is shown in Table S3 (Supplementary Material, http://links.lww.com/HC9/A2).
The samples of liver tissue microarray (TMA) for immunohistochemistry (IHC) analyses were collected from 30 HB (NC), 34 CS (disease control), and 93 BA patients. Their clinical information is calculated in Table S4 (Supplementary Material, http://links.lww.com/HC9/A2). The etiology of CS included Alagille syndrome (2 cases), cytomegalovirus hepatitis (2 cases), citrin deficiency (2 cases), DCDC2 mutation-induced sclerosing cholangitis (1 case), Zellweger syndrome (1 case), and idiopathic CS (26 cases). All the liver samples were fixed in 4% paraformaldehyde for pathologic staining. The prognostic results were summarized as follows: the results of JC at 6 months after KPE were recorded from 51 BA patients, among whom 31 BA patients manifested no jaundice. During the 2-year follow-up after KPE, 43 BA patients had NLS, while 13 BA patients underwent LT or death, and the remaining 37 BA patients were lost to follow-up.
Other materials and methods
Detailed procedures of the rest of materials and methods can been found in the Supplementary Material (http://links.lww.com/HC9/A2).
Ethics statement
This study was approved by the Ethics Committee of the Children’s Hospital of Fudan University. The implementations were conducted in accordance with the Declaration of Helsinki, and written informed consent was obtained from the legal guardians of all subjects.
Data deposition
The raw sequencing data of this study were deposited to the Genome Sequence Archive (GSA) for Human of National Genomics Data Center under accession number HRA001453. The raw sequencing data during the current study are not publicly available according to guidelines of GSA, but are available from the corresponding author on reasonable request. Publicly available datasets can be found in: https://www.ncbi.nlm.nih.gov/geo/ (GSE46960, GSE15235, and GSE136103).
RESULTS
The m6A level was elevated in BA and was correlated with liver fibrosis, liver function, and BA prognosis
The hepatic m6A level in BA was higher than that in NC (p < 0.001), but was comparable with that in CS (p > 0.05) (Figure 1A). BA patients with higher stage of fibrosis had higher level of m6A (S4 vs. S2, p < 0.0001; S4 vs. S3, p < 0.001) (Figure 1B), which indicated that m6A was correlated with liver fibrosis in BA. Furthermore, m6A also showed correlations with liver functions in all patients, which strengthened the significance of m6A in liver diseases (Figure 1C). Next, the correlation between the level of m6A and BA prognosis was analyzed. BA patients with jaundice at 3 and 6 months after KPE had higher level of m6A than those without jaundice (p < 0.05) (Figures 1D, E). The m6A level in BA patients with NLS was also higher than that in BA patients without NLS, but the change was not significant (p > 0.05) (Figure 1F). To sum up, the elevated m6A level showed significant correlations with liver fibrosis, liver function, and BA prognosis, which implied that m6A methylation may exert crucial roles in the pathogenesis of BA.
FIGURE 1.
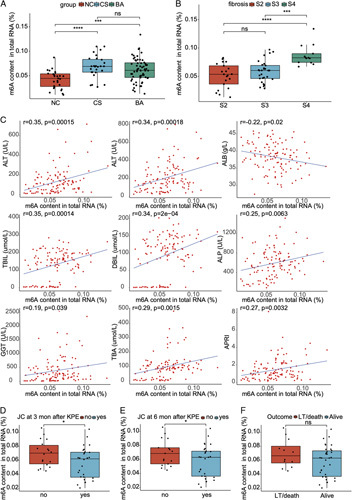
The total level of m6A and its correlations with clinical indicators in biliary atresia and controls. (A) The total level of m6A in the liver of normal control (NC) (27 cases), cholestasis (CS) (disease control, 28 cases), and biliary atresia (BA) (63 cases). (B) The total level of m6A in BA patients with different stage of fibrosis. (C) The correlation analyses between the total level of m6A and liver function indicators in all patients. (D) The total level of m6A in BA patients with jaundice clearance (JC) or not at 3 months after Kasai portoenterostomy (KPE). (E) The total level of m6A in BA patients with JC or not at 6 months after KPE. (F) The total level of m6A in BA patients with native liver survival (NLS) or not at 2 years after KPE. *p < 0.05, ***p < 0.001, ****p < 0.0001, ns: not significant. Abbreviations: ALB, albumin; ALP, alkaline phosphatase; ALT, alanine aminotransferase; APRI, aspartate aminotransferase-to-platelet ratio index; AST, aspartate aminotransferase; DBIL, direct bilirubin; GGT, gamma-glutamyl transpeptidase; LT, liver transplantation; TBA, total bile acid; TBIL, total bilirubin.
The m6A writers were upregulated in BA
The levels of m6A writers and erasers were determined in the liver of BA and controls. qRT-PCR results demonstrated that METTL3, METTL14, WTAP were significantly elevated in BA when compared with those in controls (NC and CS), while ALKBH5 was downregulated in BA in comparison with NC (Figure 2A). To confirm the above findings, western blot was performed. The results also demonstrated higher levels of METTL3, METTL14 and WTAP in the liver of BA when compared with the levels in NC, whereas ALKBH5 and FTO were comparable between BA and controls (NC and CS) (Figures 2B, C). IHC analysis of the liver TMA also validated the upregulated METTL3, METTL14 and WTAP in BA when compared with NC (METTL3, METTL14: p < 0.001, WTAP: p < 0.0001), whereas the m6A erasers had no significant change (p > 0.05) (Figures 2D, E). Taken together, the m6A writers were upregulated, and this may be the cause of the elevated m6A level in BA.
FIGURE 2.
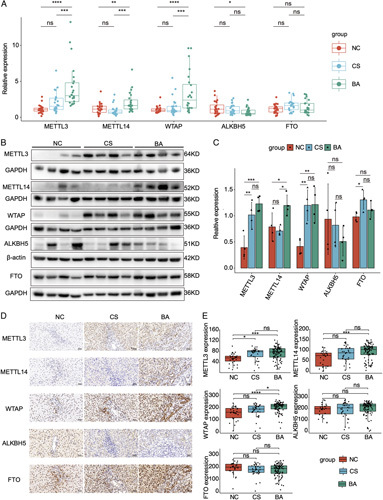
The expressions of m6A writers and erasers in the livers of biliary atresia and controls. (A) qRT-PCR results of m6A writers and erasers in normal control (NC), cholestasis (CS), and biliary atresia (BA). (B) Western blot results of m6A writers and erasers in BA and controls. (C) Statistical analysis of western blot results in (B). (D) Immunohistochemistry of m6A writers and erasers in BA and controls. (E) The H-scores of immunohistochemistry analyses in the liver tissue microarray including 93 cases of BA, 30 cases of NC, and 34 cases of CS. *p < 0.05, **p < 0.01, ***p < 0.001, ****p < 0.0001, ns: not significant.
M6A topology was altered, and m6A-modified genes were enriched in fibrotic pathways in BA
To further figure out the m6A profile in BA, MeRIP-seq was performed in 4 BA and 4 NC. In the genic regions, the percentage of m6A peaks was highest around the stop codon in BA and controls (Figure S1A, Supplementary Material, http://links.lww.com/HC9/A2). On the mRNA transcripts, most m6A peaks were concentrated on CDS in BA, whereas 3′ UTR was the dominant region for m6A peaks in controls (Figure S1B, Supplementary Material, http://links.lww.com/HC9/A2). The distribution of m6A peak number on mRNA demonstrated that more than half of mRNAs had only 1 peak in both groups (Figure S1C, Supplementary Material, http://links.lww.com/HC9/A2). Motif analysis demonstrated that more than half of m6A peaks had the consensus RRACH sequence in BA and controls (Figure S1D, Supplementary Material, http://links.lww.com/HC9/A2).
Similar with the m6A peaks in single group, differential m6A peaks were the most abundant in the vicinity of stop codon region (Figure S2A, Supplementary Material, http://links.lww.com/HC9/A2). Furthermore, the differential peaks between 2 groups also demonstrated a similar m6A topology with BA, and about 44% of differential m6A peaks were concentrated in the CDS, followed by 3′ UTR, stop codon region, 5′ untranslated region (UTR), and transcription start site (Figure S2B, Supplementary Material, http://links.lww.com/HC9/A2). As expected, most genes had 1 or 2 differential m6A peaks (Figure S2C, Supplementary Material, http://links.lww.com/HC9/A2). In addition, the conserved sequence (RRACH) was also found in the differential m6A peaks (Figure S2D, Supplementary Material, http://links.lww.com/HC9/A2). The m6A peaks shared by each sample in BA or control groups were defined as the group-conserved peaks (Figure S2E, Supplementary Material, http://links.lww.com/HC9/A2 and Figure 4F). When comparing the group-conserved peaks, BA had much more unique peaks than the control group (2054 vs. 179 peaks, Figure S2G, Supplementary Material, http://links.lww.com/HC9/A2). Taken together, the m6A profile was altered in BA.
FIGURE 4.
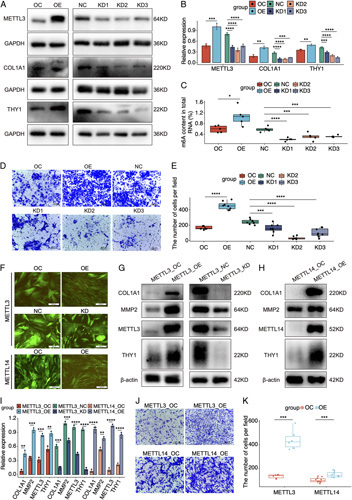
The regulatory role of m6A on target genes and cell migration in HSCs. (A) Western blot results of METTL3, COL1A1, and THY1 in LX-2 cells treated with METTL3 overexpressing (OE) or knocking-down (KD) lentivirus. (B) Statistic analysis of western blot results in (A). (C) The level of m6A in LX-2 cells treated with METTL3 OE or KD lentivirus. (D) The change of cell migration in LX-2 cells treated with METTL3 OE or KD lentivirus. (E) The cell count analysis of cell migration in LX-2 cells treated with METTL3 OE or KD lentivirus. (F) The green fluorescent protein fluorescence and cell morphology of primary HSCs transfected with METTL3 and METTL4 disturbed lentivirus. (G) The expressions of profibrogenic markers in primary HSCs transfected with METTL3 OE or KD lentivirus. (H) The expressions of profibrogenic markers in primary HSCs transfected with METTL14 OE lentivirus. (I) Statistic analysis of western blot results in (G) and (H). (J) The change of cell migration in primary HSCs treated with METTL3 and METTL14 OE lentivirus. (K) The cell count analysis of cell migration in primary HSCs treated with METTL3 and METTL14 OE lentivirus. *p < 0.05, **p < 0.01, ***p < 0.001, ****p < 0.0001. Abbreviations: NC, negative control; OC, overexpression control.
RNA-seq demonstrated that 1908 genes were upregulated, whereas 2008 genes were downregulated in BA when compared with controls (Figure S3, Supplementary Material, http://links.lww.com/HC9/A2). Gene functional enrichment analysis indicated that fibrotic pathways (ECM organization and collagen-containing ECM) were enriched in BA, while oxidation-reduction pathways were enriched in controls (Figure S4, Supplementary Material, http://links.lww.com/HC9/A2). As expected, the density of m6A peaks in BA was higher than that in controls, which was consistent with the higher level of m6A in BA (Figure 3A). Venn diagram plotting identified 130 overlapping genes shared by differential m6A peak-related genes and differentially expressed genes (DEGs) in BA and controls (Figure 3B and Supplementary Excel, http://links.lww.com/HC9/A19). The log2foldchange of m6A was positively correlated with the log2foldchange of RNA expressions in the overlapping genes (r = 0.53, p < 0.0001) (Figure 3C). Gene Ontology (GO) analyses demonstrated that the overlapping genes were enriched in fibrotic pathways, such as collagen-containing ECM (Figure 3D). Thus, the HSC/MF-specific genes that were identified by the scRNA-seq dataset (GSE136103) may be the m6A methylated critical genes in the liver fibrosis of BA. In GSE136103, an intact liver cell map was depicted. A total of 60,880 cells comprising 15 cell types were captured from 5 healthy and 5 cirrhotic liver samples (Figures S5A–D, Supplementary Material, http://links.lww.com/HC9/A2). MFs highly expressed collagen-related genes, such as COL1A1, COL3A1, DCN, BGN and TIMP1, while HSCs owned the smooth muscle-related genes, such as ACTA2, TAGLN, MYL9, RGS5, and ADIRF (Figure S5E, Supplementary Material, http://links.lww.com/HC9/A2). The expression features of overlapping genes demonstrated that ANGPTL6, LTBP2, COL5A2, COL1A1, and THY1 were highly expressed in MFs, while PKIG, NOTCH3, IGFBP5, and MYLK were overexpressed in HSCs, and FXYD1 was equally expressed in HSCs and MFs (Figure 3E).
FIGURE 3.
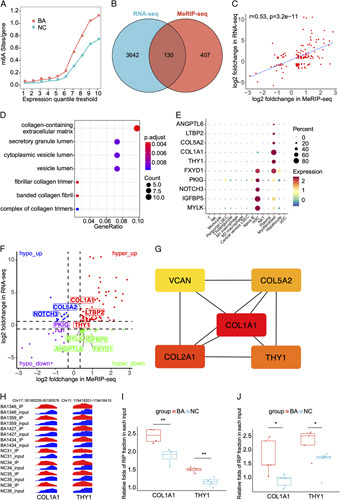
The combined analysis of methylated RNA immunoprecipitation sequencing (MeRIP-seq) and RNA sequencing in biliary atresia and normal controls (NC). (A) The densities of the m6A peaks in biliary atresia (BA) and NC. (B) Venn diagram of the differential m6A peak-related genes and differentially expressed genes in BA and NC. (C) The correlation between the log2foldchange of m6A enrichment and log2foldchange of RNA expressions. (D) Gene Ontology (GO) analysis of the overlapping genes. (E) The expressions of fibrotic overlapping genes in the scRNA dataset of GSE136103. (F) Four-quadrant diagram of the overlapping genes. (G) Top 5 hub genes in the protein-protein interaction network. (H) IGV-browser visualization of the m6A peaks of COL1A1 and THY1 in each sample. (I) MeRIP-seq displaying the m6A enrichment alternations of COL1A1 and THY1 in 4 BA and 4 NC. (J) MeRIP-qPCR displaying the m6A enrichment alternations of COL1A1 and THY1 in 5 BA and 5 NC. *p < 0.05, **p < 0.01.
Given the levels of m6A methylation and gene expression between BA and controls, the overlapping genes were categorized into hyper-up, hyper-down, hypo-up, and hypo-down groups (Figure 3F). To further narrow down the m6A-modified fibrotic genes, proteinprotein interaction analysis was conducted in 130 overlapping genes, and top 5 hub genes were identified by the MCC algorithm in CytoHuba (Figure 3G). On account of the higher level of m6A and upregulated fibrotic genes in BA, we determined COL1A1 and THY1 as the m6A-modified target genes. MeRIP-seq indicated that COL1A1 and THY1 had higher m6A levels in BA than in NC (COL1A1: FC 1.30, p < 0.01; THY1: FC 1.29, p < 0.01) (Figures 3H, I), and the m6A alternations of COL1A1 and THY1 were validated via MeRIP-qPCR analysis in 5 BA versus 5 control samples (Figure 3J).
M6A exerted crucial roles in the activation of HSCs by regulating COL1A1 and THY1
To further validate the regulatory roles of m6A on target genes, LX-2 cells, an immortalized HSC cell line, were adminisrated with lentivirus to overexpress (OE) and knock down (KD) METTL3 (Figure S6, Supplementary Material, http://links.lww.com/HC9/A2). The interference efficiency was confirmed by western blot (Figures 4A, B). As expected, the m6A levels kept consistent with the expressions of METTL3 in LX-2 cells (Figure 4C). Consistent with the hyper-up alternations in vivo, both COL1A1 and THY1 were upregulated in the OE group, whereas both genes were downregulated in the KD groups (Figures 4A, B). Due to the activated HSCs show increased cell migration,12 we determined the regulatory roles of m6A in cell migration. In the OE group, LX-2 cells demonstrated enhanced cell migration. However, the capacity of cell migration was inhibited in the KD groups (Figures 4D, E).
Given that LX-2 cells are activated HSCs,13 we successfully isolated primary HSCs at quiescent state from a healthy control liver, and then METTL3 and METTL14 disturbed HSCs were established. When METTL3 and METTL14 were overexpressed, HSCs transformed from irregularly shape into spindly form (Figures 4F and Figure S7, Supplementary Material, http://links.lww.com/HC9/A2). Meanwhile, overexpression of METTL3 and METTL14 also induced the expressions of COL1A1, MMP2, and THY1 in HSCs, whereas KD METTL3 inhibited the above markers (Figures 4G–I). In addition, HSCs manifested enhanced cell migration in the METTL3 and METTL14 OE groups (Figures 4J, K). Taken together, the m6A methylation exerts crucial roles in HSC activation by regulating COL1A1 and THY1.
THY1+ MFs expanded in the portal area of BA and THY1 was a potential marker for liver fibrosis in BA
THY1 has been identified as a fibrotic marker in CS.3,14–16 However, the research of THY1 in BA was scarce. To further explore the expression of THY1 in BA, THY1 and 3 common fibrotic markers COL1A1, ACTA2, and PDGFRB were determined in the liver of BA and controls. THY1 and 3 fibrotic markers had the highest mRNA level when compared with NC and CS (Figures S8, S9, Supplementary Material, http://links.lww.com/HC9/A2). IHC staining in liver TMA demonstrated that THY1 and 3 fibrotic markers were upregulated, and deposited around the portal area in BA and CS when compared with those in NC (Figures 5A, B). Western blot further validated the elevated expressions of THY1 and 3 fibrotic markers in BA and CS as compared with those in NC, and BA had higher levels of THY1 and PDGFRB than CS (Figures 5C, D). To figure out the cellular localization of THY1 in the liver, the immunofluorescence staining of THY1 and 3 fibrotic markers was performed. THY1 was partly co-located with HSC markers COL1A1, ACTA2, and PDGFRB, and the number of THY1+ cells expanded in the portal area of BA (Figure 5E and Figure S10, Supplementary Material, http://links.lww.com/HC9/A2). Next, the correlation between the expressions of fibrotic markers and the stage of fibrosis were evaluated in 93 BA liver TMA samples. As expected, all the fibrotic markers except ACTA2 were increased with the stage of fibrosis in BA. THY1 showed sensitive for assessing the stage of fibrosis except the comparable levels between S1 and S2 (Figure 5F). To further dissect the expressions of fibrotic markers at single-cell resolution, HSCs and MFs were extracted from the scRNA-seq dataset of GSE136103, a total of 1791 HSCs and 313 MFs were isolated for further analysis after removing the contaminating PTPRC+/CD68+ immune cells, PECAM1+ endothelial cells, and APOA1+/KRT19+ epithelial cells (Figure 5G). Vlnplot demonstrated that COL1A1 and THY1 were highly expressed in MFs, while ACTA2 and PDGFRB were dominantly expressed in HSCs (Figure 5H). Taken together, THY1+ MFs expanded in the portal area of BA, and THY1 was a potential marker for the liver fibrosis of BA.
FIGURE 5.
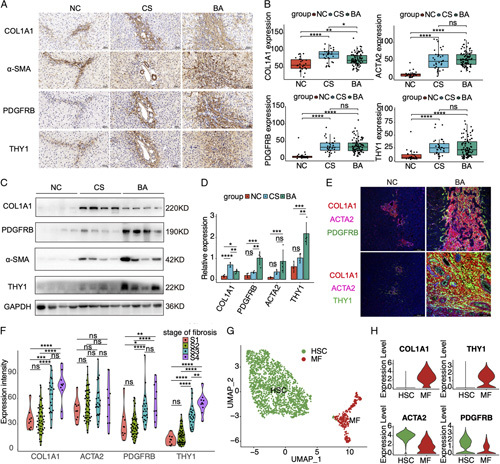
The expressions of THY1 and fibrotic markers, and their correlations with liver fibrosis in biliary atresia. (A) Immunohistochemistry analyses of the THY1 and fibrotic markers in the liver of normal control (NC), cholestasis (CS), and biliary atresia (BA). The images were captured at the same field of microscope. (B) The H-scores of immunohistochemistry analyses in the liver tissue microarray including 93 cases of BA, 30 cases of NC, and 34 cases of CS. (C) Western blot results of THY1 and fibrotic markers in BA and controls. (D) Statistic analysis of western blot results in (C). (E) Immunofluorescence staining of THY1 and fibrotic markers in BA and controls. (F) The expression levels of THY1 and fibrotic markers in BA patients with different stage of fibrosis. (G) UMAP plot of HSCs and myofibroblasts (MFs) in the scRNA dataset of GSE136103. (H) The expression levels of THY1 and fibrotic markers in the HSCs and MFs of GSE136103. *p < 0.05, **p < 0.01, ***p < 0.001, ****p < 0.0001, ns: not significant.
THY1 may play profibrogenic roles in the liver fibrosis of BA
To understand the possible function of THY1, all the patients in GSE46960 (64 BA, 14 CS, and 7 NC) were divided into higher THY1 (> median) and lower THY1 (≤ median) groups. The upregulated genes in the higher THY1 groups were enriched in the fibrotic pathways, such as ECM organization and ECM-receptor interactions (Figure 6A and Figure S11A, Supplementary Material, http://links.lww.com/HC9/A2). Given the location of THY1 in MFs, the functions of THY1 were explored at single-cell level. Similarly, HSCs and activated MFs in GSE136103 were classified into THY1 positive (counts>0) and negative (counts = 0) groups, UMAP plot demonstrated that most of MFs were THY1 positive cells (Figure S11B, Supplementary Material, http://links.lww.com/HC9/A2). The heatmap of DEGs showed that profibrogenic genes such as COL1A1, COL3A1, DCN, and TIMP1 were upregulated in the THY1 positive cells (Figure S11C, Supplementary Material, http://links.lww.com/HC9/A2). GO and GSVA analysis indicated that the upregulated genes in THY1 positive cells were also enriched in ECM organization and collagen-producing pathways (Figure 6B and Figure S11D, Supplementary Material, http://links.lww.com/HC9/A2).
FIGURE 6.
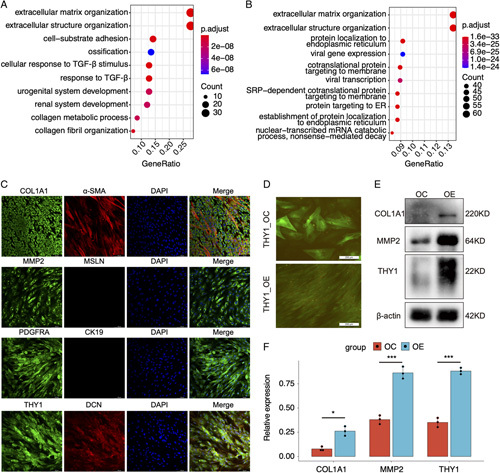
THY1 may play profibrogenic roles in the liver fibrosis of biliary atresia. (A) Gene Ontology (GO) analysis of upregulated genes in patients with higher THY1 expressions. (GSE46960). (B) GO analysis of upregulated genes in THY1 positive versus negative cells in HSCs and myofibroblasts (GSE136103). (C) Immunofluorescence of fibrotic markers in the THY1+ cells isolated from biliary atresia (BA) livers using magnetic activated cell sorting. (D) The green fluorescent protein fluorescence and cell morphology of primary HSCs transfected with THY1 overexpression lentivirus.(E) Western blot of fibrotic markers in primary HSCs transfected with THY1 overexpression lentivirus. (F) Statistic analysis of western blot results in (E). *p < 0.05, ***p < 0.001.
To validate the marker expressions in THY1+ cells in BA, THY1+ cells were captured using magnetic activated cell sorting. Immunofluorescence results demonstrated that THY1+ cells highly expressed profibrogenic genes, such as COL1A1, MMP2, PDGFRA, and DCN, which was consistent with the results in scRNA-seq (Figure S11E, Supplementary Material, http://links.lww.com/HC9/A2). Part of THY1+ cell expressed α-SMA, whereas mesothelial markers such as CK19 and MSLN were negatively detected (Figure 6C). To know about the effects of THY1 on HSC activation, primary HSCs were transfected with THY1 overexpression lentivirus. Overexpression of THY1 also induce the transformation of HSCs from irregularly shape into spindly form (Figure 6D) and the expressions of COL1A1 and MMP2 (Figures 6E, F). Taken together, THY1 promotes HSC activation, and may play profibrogenic roles in the liver fibrosis of BA.
THY1 may exert roles in cholestatic fibrosis by interacting with integrins on myeloid cells
THY1, also called CD90, is a surface glycoprotein in MFs. We speculated that it may interact with other proteins in the cirrhotic circumstance, thus CellChat was performed to analyze the cell communications in GSE136103. The chord diagram demonstrated that MFs was the dominating cell type in cell communications, and had increased number and strength of cell interactions in cirrhosis when compared with healthy controls (Figures 7A, B), which strengthed the significance of MFs in cirrhosis. The circle plots of THY1 signaling pathways showed that MFs interacted with monocytes and M1 macrophage in the healthy controls, while MFs communicated with monocyte, M1 and M2 macrophages in cirrhosis. The strength of cell interactions were much higher in cirrhosis than that in healthy controls (Figures 7C, D), which was consistent with the elevated information flow in cirrhosis (Figure S12, Supplementary Material, http://links.lww.com/HC9/A2). The ligand-receptor analysis revealed that the interaction between THY1 and ITGAX/ITGB2 complex was the predominant way to exert roles in cirrhosis and healthy controls. However, the receiving cells were different. In this signaling pathway, M1 macrophages were the preferred cell type in healthy controls, while monocyte and M1 macrophages were the main cell type in cirrhosis (Figures 7E, F). To validate the ligand-receptor interactions in BA, co-immunoprecipitation (Co-IP) was performed to detect ITGAX and ITGB2 in the immunoprecipitated products of an THY1 antibody. The results demonstrated that the interactions between THY1 and ITGAX/ITGB2 complex were enhanced in BA and CS when compared with NC (Figure 7G). Taken together, THY1 may exert roles in the cholestatic fibrosis through the interactions with ITGAX/ITGB2 complex in myeloid cells.
FIGURE 7.
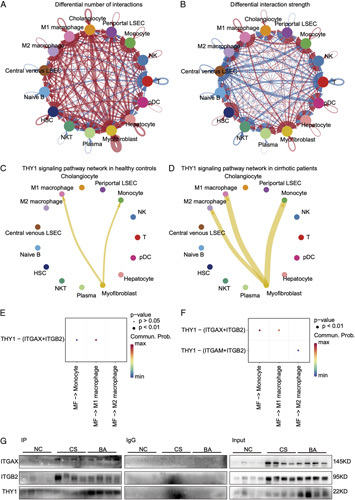
THY1 may exert roles in cholestatic fibrosis by interacting with integrins on myeloid. (A) Differential number of interactions in the cell-cell communication network between cirrhosis and healthy controls in GSE136103. (B) Differential strength of interactions in the cell-cell communication network between cirrhosis and healthy controls in GSE136103. In the chord diagram, the arrow pointed cells represent reveiving cells, while cells on the other side stand for the sending cells. Red colored edges represent increased signaling in cirrhosis, whereas blue colored edges represent decreased signaling in cirrhosis. Furthermore, the line width is proportional to the number and strength of interactions. (C) THY1 signaling pathway network in healthy controls. (D) THY1 signaling pathway network in cirrhotic patients. (E) Heatmap of ligand-receptor interactions in THY1 signaling pathway network in healthy controls. (F) Heatmap of ligand-receptor interactions in THY1 signaling pathway network in cirrhotic patients. (G) Co-immunoprecipitation of ITGAX and ITGB2 by targeting THY1 in BA and controls (NC, CS). Abbreviations: CS, cholestasis; NC, normal control.
THY1 is correlated with BA prognosis
To identify the critical genes that were correlated with the NLS in BA, weighted correlation network analysis was performed in GSE15235. In this dataset, apart from 2 BA patients who were lost to follow-up, 26 BA patients had NLS, and 19 BA patients suffered from LT or death. The soft threshold was set 8 for the reason that the R2 of scale free topology model exceeded 0.8, and the mean connectivity tended to be stable (Figure S13A, Supplementary Material, http://links.lww.com/HC9/A2). When the automatic network was constructed, a total of 37 modules with different colors were produced from 20161 genes in 45 samples. The cluster dendrograms of block 1 and the correlation heatmap among 37 modules were demonstrated in Figures S13B and S13C (Supplementary Material, http://links.lww.com/HC9/A2). The correlation between 37 modules and clinical phenotype (NLS and LT/death) indicated that genes in the greenyellow module were correlated with LT/death in BA (r = 0.28, p = 0.06) (Figure 8A). GO analysis showed that genes in the greenyellow module were enriched in ECM organization (Figure 8B). LT/death-related hub genes were identified as those showing a high correlation with the module (r > 0.8) and clinical phenotype (r > 0.2) (Figure 8C). A total of 36 LT/death-related hub genes were filtered out of the greenyellow module, and most of hub genes were expressed in MFs (Figure S14, Supplementary Material, http://links.lww.com/HC9/A2). THY1 was one of LT/death-related hub genes showing high correlations with greenyellow module (r = 0.90) and LT/death (r = 0.34) (Figure 8C). Inversely, the upregulated genes in BA patients with LT/death versus NLS also were enriched in ECM organization (Figure 8D), and THY1 was also upregulated in BA patients with LT/death as compared with those with NLS (Figure 8E). To figure out the cutoff value of THY1 to predict the NLS in BA, survivalROC software was used. When THY1 was higher than 1.33, the NLS rate of BA patients (n = 13) was significantly lower than those with low THY1 (n = 32) (p < 0.05, Figure 8F). Given that MFs was the unique cellular location for THY1, the cell composition in GSE15235 was predicted by the deconvolution analysis (Figure S15A, Supplementary Material, http://links.lww.com/HC9/A2). The results demonstrated that the percentage of MFs was higher in BA patients with LT/death than that in those with NLS (Figure 8G and Figure S15B, Supplementary Material, http://links.lww.com/HC9/A2). Finally, we evaluated the correlation between the protein expression levels of fibrotic markers and JC or NLS in the liver TMA. THY1 was also upregulated in BA patients with jaundice than those without jaundice at 6 months after KPE. However, COL1A1, ACTA2, and PDGFRB were comparable in BA patients with JC or not (Figure 8H), and all the fibrotic markers also had no significant change in BA patients with NLS or not (Figure 8I). Altogether, THY1 is correlated with BA prognosis.
FIGURE 8.
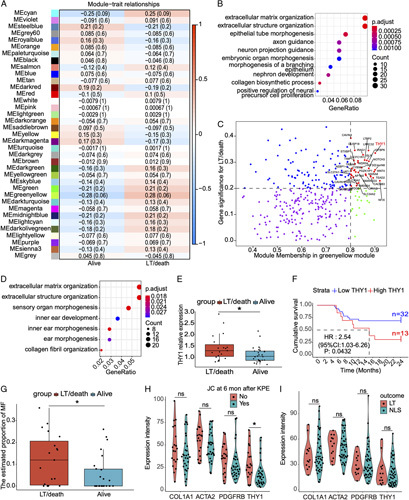
THY1 is correlated with the prognosis of BA. (A) Weighted correlation network analysis showing the heatmap of correlations between 37 modules and clinical trait (alive and LT/death) in GSE15235. (B) Gene Ontology (GO) analysis of genes in the greenyellow module. (C) LT/death-related hub genes showing a high correlation with the module (r > 0.8) and clinical phenotype (r > 0.2). (D) GO analysis of upregulated genes in BA patients with LT/death. (E) THY1 expression levels in BA patients with NLS or not. (F) The NLS survival curve of BA patients with higher and lower level of THY1 expressions. (G) Deconvolution analysis demonstrated the estimated proportion of myofibroblasts between BA patients with NLS and LT/death in GSE15235 using the single cell reference data GSE136103. (H) Immunohistochemistry analyses of the THY1 and fibrotic markers in BA patients with JC or not at 6 months after Kasai portoenterostomy (KPE). (I) Immunohistochemistry analyses of the THY1 and fibrotic markers in BA patients with NLS or not at 2 years after KPE. *p < 0.05, ns: not significant. Abbreviations: BA, biliary atresia; LT, liver transplantation; NLS, native liver survival.
DISCUSSION
In this study, we dissected the m6A profile of BA, confirmed the regulatory role of m6A on COL1A1 and THY1, and evaluated the possible function and mechanism of THY1 in the liver fibrosis of BA. This integrative analysis composed of MeRIP-seq, bulk RNA-seq, bulk microarray, and scRNA-seq implied that the crucial role of m6A in the liver fibrosis of BA by regulating THY1. To our knowledge, this is the first study to elucidate the role of m6A in BA.
When compared with NC, the total level of m6A was elevated in BA, which was validated by higher density of m6A peaks in MeRIP-seq. Furthermore, the upregulated m6A writers in BA may result in the higher level of m6A in BA. However, the m6A level was comparable between BA and CS, suggesting that the alternation of m6A modification may be a response to cholestatic liver injury. Hepatic m6A level was correlated with the stage of fibrosis, liver function, and JC, which strengthened the significance of m6A in BA. In the liver function analyses, alanine aminotransferase, aspartate aminotransferase, and albumin reflect the function of hepatocytes, the m6A level was positively correlated with alanine aminotransferase and aspartate aminotransferase, but negatively correlated with ALB, indicating that m6A may be an indicator for hepatocyte injury. Total bilirubin, direct bilirubin, alkaline phosphatase, and gamma-glutamyl transpeptidase reflect the severity of obstructive jaundice. All the indicators were positively correlated with the level of m6A, which can partly explain the correlation between m6A and JC after KPE. Last, aspartate aminotransferase-to-platelet ratio index, a noninvasive indicator of liver fibrosis, was also positively correlated with m6A, which was consistent with the results between m6A and liver fibrosis. In addition, the evidence that HSCs were activated with higher m6A levels in vitro also supported the positive correlation between m6A and liver fibrosis in BA.
MeRIP-seq demonstrated that most m6A peaks were distributed around the genic stop codon in BA and controls, which was consistent with the results of other studies.6,17 However, m6A topology in the mRNA transcript segments was different, CDS was the dominant region in BA, whereas 3′ UTR had the most m6A peaks in controls, which indicated that m6A may directly modulate the transcription and translation in BA and stabilize the mRNAs in controls. The consensus RRACH sequence was observed in more than 60% of the m6A peaks in BA and reinforced the stability of the m6A epigenetics in BA.
Both the upregulated genes in BA identified by RNA-seq and 130 overlapping genes identified by MeRIP-seq and RNA-seq were enriched in fibrotic pathways, which indicated that m6A may have epigenetic roles in liver fibrogenesis. Both the MeRIP-qPCR in vivo and the experimental results in vitro validated the regulatory role of m6A on COL1A1 and THY1. Although previous studies have demonstrated the effects of DNA methylation on COL1A1 in cirrhosis and THY1 in pulmonary fibrosis,18,19 the role of m6A in COL1A1 and THY1 has not been reported. Thus, this study extended the mRNA epigenetic regulation of COL1A1 and THY1 in liver fibrosis.
Previous studies reported that THY1 was a marker of portal fibroblasts, and THY1+ portal fibroblasts were the major source of MFs in the cholestatic diseases.3,14–16 Only 1 study speculated that THY1+ cells sorted from BA livers may be hepatic progenitor cells based on limited evidence.20 In this study, THY1 showed excellent performance in evaluating BA liver fibrosis. THY1+ cells expanded in the portal area and highly expressed profibrogenic markers in BA, which implied that THY1+ cells may be MFs in BA. Noteworthily, previous studies about THY1 are all from the liver injury models in mice, and the studies about THY1 in human primary cells are scarce. Contrary to the results in mice, the isolated primary HSCs from human livers also expressed THY1.21 The results of scRNA-seq from human livers in GSE136103 also demonstrated that some HSCs were THY1 positive. In this study, we used primary HSCs and the common HSC cell line LX-2, and detected the expression of THY1 in HSCs and LX-2 by western blot, which was supported by the finding that LX-2 expressed mesenchymal maker THY1 by flow cytometry.22 Therefore, the markers of HSCs and fibroblasts varied among different species and liver diseases, and exploring the specific markers to distinguish HSCs from fibroblasts is necessary for the liver fibrosis studies in BA.
Both bulk microarray and scRNA-seq results indicated that THY1 was associated with ECM organization, overexpression of THY1 promotes HSC activation, cell communication analysis and Co-IP further found the interactions between THY1 and integrins in the cirrhotic circumstance. The above results implied a THY1/integrins axis in the cholestatic fibrosis. Cell communication analysis implied that M2 macrophage was the unique receiver in cirrhosis, but not in controls. As THY1 has an integrin binding site that can bind to integrins,23 it can be inferred that THY1 mediates the cell-to-cell contacts, and may promote the transendothelial migration of myeloid cell, facilitating their arrival to the fibrous scar. M2 macrophages release TGF-β1 and thereby activate fibroblasts,24 while M1 macrophages can attenuate or promote liver fibrosis by producing chemokines25 and profibrogenic cytokines.26 The above results may provide a novel role of THY1 in liver fibrosis, and further researches should be performed.
Weighted correlation network analysis and the TMA IHC analyses indicated that THY1 was correlated with BA prognosis, which can be explained by the fact that THY1+ cells were the major source for MFs, and the percentages of MFs in whole liver at KPE may affect the progression of liver fibrosis in BA. The following results supported the significance of MFs in BA prognosis. First, most of LT/death-related hub genes were expressed in MFs. Second, the upregulated genes in BA patients with LT/death were enriched in profibrogenic pathways. Third, deconvolution analysis demonstrated that BA patients with poor prognosis had higher level of MFs. Our previous study found that JC at 6 months after KPE is an independent risk factor for NLS.11 IHC analysis in liver TMA demonstrated that THY1 was correlated with JC at 6 months after KPE, but not with NLS. This inconsistence may be attributed to the fact that JC was an objective indicator, while the NLS status in BA was influenced by a variety of factors. In addition, the fact that too many BA patients were lost to follow-up may also influence the negative results.
This is a retrospective and cross-sectional study about the relationship between the BA prognosis and hepatic m6A or THY1 levels, which was considered a limitation for their clinical applications. Upon all the results, we can just draw the conclusion that the m6A and THY1 levels were correlated with BA prognosis, but cannot be regarded as indicators to distinguish BA prognosis. Given the small sample size and single center in this study, multicenter and prospective studies should be done to confirm the capacity of m6A and THY1 to predict BA prognosis. Consistent with the study by Luo et al.,27 our integrative analyses also demonstrated that the proportion of MF and fibrotic genes were related to BA prognosis. Hence, the combination of THY1 and other profibrogenic genes may be an alternative strategy to enhance their predictive abilities for BA prognosis.
In conclusion, this study comprehensively depicted the critical role of m6A in the liver fibrosis of BA by regulating THY1. The higher level of m6A elevated the THY1 expression, and both hepatic m6A levels and THY1 were correlated with liver fibrosis and BA prognosis. THY1 promotes HSC activation, and THY1 on the surface of MFs can interact with integrins on myeloid cells and affected the ECM organization in the liver fibrosis of BA. Further studies are needed to elucidate the mechanism of m6A in the epigenetic modification of THY1 in BA. Our study may shed new light on the role of RNA epigenetics in liver fibrosis, and exploitation of m6A/THY1 target interventions may block the BA rapid progress of liver fibrosis in the future.
Supplementary Material
Acknowledgments
AUTHOR CONTRIBUTIONS
G.C. and S.Z. designed and supervised the study. J.W. and M.D. conducted the experiments, performed the data analysis and wrote the manuscript. L.M. provided assistance in data analysis. Y.Y. provided great help in editing the manuscript. S.H. helped to conduct experiments in the revised manuscript. Y.Z. collected the clinical information of all patients. X.R. and M.W. collected the liver samples. R.D. reviewed and edited the manuscript. All authors read and approved the final manuscript.
ACKNOWLEDGMENTS
The authors thank Professor Jia Rao for her excellent suggestions in the paper writing.
CONFLICT OF INTEREST
The authors declare that they have no conflict of interest.
Footnotes
Junfeng Wang and Min Du contributed equally to the work.
Funding informationThis study received financial support from Shanghai Municipal Key Clinical Specialty (no. shslczdzk05703), Clinical Research Plan of SHDC (no. SHDC2020CR2009A), National Natural Science Foundation of China (no. 81873545, no. 81974059, no. 82001595, and no. 82201915), and Children’s National Medical Center (no. EK1125180104, and no. EK112520180211).
Abbreviations: ALB indicate albumin; ALP alkaline phosphatase; ALT, alanine aminotransferase; APRI, aspartate aminotransferase-to-platelet ratio index; AST, aspartate aminotransferase; BA, biliary atresia; Co-IP, co-immunoprecipitation; CS, cholestasis; DEG, differentially expressed gene; ECM, extracellular matrix; GSA, Genome Sequence Archive; GGT, gamma-glutamyl transpeptidase; HB, hepatoblastoma; HSC, hepatic stellate cell; IF, immunofluorescence; JC, jaundice clearance; KD, knock down; KPE, Kasai portoenterostomy; LT, liver transplantation; MF, myofibroblast; m6A, N6-methyladenosine; NC, normal control; OE, over-express; RNA immunoprecipitation sequencing; TBA, total bile acid; TBIL, total bilirubin; TMA, tissue microarray; WGCNA, weighted correlation network
Supplemental Digital Content is available for this article. Direct URL citations appear in the printed text and are provided in the HTML and PDF versions of this article on the journal's website, www.hepcommjournal.com.
Contributor Information
Junfeng Wang, Email: wangjunfeng@fudan.edu.cn.
Min Du, Email: 18111240008@fudan.edu.cn.
Lingdu Meng, Email: ldmeng168@163.com.
Yifan Yang, Email: yifanyang16@fudan.edu.cn.
Shiwei He, Email: swheok@foxmail.com.
Ye Zhu, Email: 969320682@qq.com.
Xue Ren, Email: 20211240032@fudan.edu.cn.
Meng Wei, Email: 15000058151@163.com.
Rui Dong, Email: rdong@fudan.edu.cn.
Shan Zheng, Email: szheng@shmu.edu.cn.
Gong Chen, Email: chengongzlp@hotmail.com.
REFERENCES
- 1.Asai A, Miethke A, Bezerra JA. Pathogenesis of biliary atresia: defining biology to understand clinical phenotypes. Nat Rev Gastroenterol Hepatol. 2015;12:342–352. [DOI] [PMC free article] [PubMed] [Google Scholar]
- 2.Sundaram SS, Mack CL, Feldman AG, Sokol RJ. Biliary atresia: Indications and timing of liver transplantation and optimization of pretransplant care. Liver Transpl. 2017;23:96–109. [DOI] [PMC free article] [PubMed] [Google Scholar]
- 3.Iwaisako K, Jiang C, Zhang M, Cong M, Moore-Morris TJ, Park TJ, et al. Origin of myofibroblasts in the fibrotic liver in mice. Proc Natl Acad Sci USA. 2014;111:E3297–E3305. [DOI] [PMC free article] [PubMed] [Google Scholar]
- 4.Friedman SL. Mechanisms of hepatic fibrogenesis. Gastroenterology. 2008;134:1655–1669. [DOI] [PMC free article] [PubMed] [Google Scholar]
- 5.Machnicka MA, Milanowska K, Osman Oglou O, Purta E, Kurkowska M, Olchowik A, et al. MODOMICS: a database of RNA modification pathways—2013 update. Nucleic Acids Res. 2013;41:D262–D267. [DOI] [PMC free article] [PubMed] [Google Scholar]
- 6.Dominissini D, Moshitch-Moshkovitz S, Schwartz S, Salmon-Divon M, Ungar L, Osenberg S, et al. Topology of the human and mouse m6A RNA methylomes revealed by m6A-seq. Nature. 2012;485:201–206. [DOI] [PubMed] [Google Scholar]
- 7.Li Y, Kang X, Zhou Z, Pan L, Chen H, Liang X, et al. The m(6)A methyltransferase Mettl3 deficiency attenuates hepatic stellate cell activation and liver fibrosis. Mol Ther. 2022;30:3714–3728. [DOI] [PMC free article] [PubMed] [Google Scholar]
- 8.Yang JJ, Wang J, Yang Y, Yang Y, Li J, Lu D, et al. ALKBH5 ameliorated liver fibrosis and suppressed HSCs activation via triggering PTCH1 activation in an m(6)A dependent manner. Eur J Pharmacol. 2022;922:174900. [DOI] [PubMed] [Google Scholar]
- 9.Shen M, Li Y, Wang Y, Shao J, Zhang F, Yin G, et al. N(6)-methyladenosine modification regulates ferroptosis through autophagy signaling pathway in hepatic stellate cells. Redox Biol. 2021;47:102151. [DOI] [PMC free article] [PubMed] [Google Scholar]
- 10.Wang J, Xu J, Xia M, Yang Y, Shen Z, Chen G, et al. Correlation between hepatic oxidative damage and clinical severity and mitochondrial gene sequencing results in biliary atresia. Hepatol Res. 2019;49:695–704. [DOI] [PubMed] [Google Scholar]
- 11.Du M, Wang J, Tang Y, Jiang J, Chen G, Huang Y, et al. Evaluation of perioperative complications in the management of biliary atresia. Front Pediatr. 2020;8:460. [DOI] [PMC free article] [PubMed] [Google Scholar]
- 12.Trebicka J, Hennenberg M, Odenthal M, Shir K, Klein S, Granzow M, et al. Atorvastatin attenuates hepatic fibrosis in rats after bile duct ligation via decreased turnover of hepatic stellate cells. J Hepatol. 2010;53:702–712. [DOI] [PubMed] [Google Scholar]
- 13.Weiskirchen R, Weimer J, Meurer SK, Kron A, Seipel B, Vater I, et al. Genetic characteristics of the human hepatic stellate cell line LX-2. PLoS ONE. 2013;8:e75692. [DOI] [PMC free article] [PubMed] [Google Scholar]
- 14.Nishio T, Hu R, Koyama Y, Liang S, Rosenthal SB, Yamamoto G, et al. Activated hepatic stellate cells and portal fibroblasts contribute to cholestatic liver fibrosis in MDR2 knockout mice. J Hepatol. 2019;71:573–585. [DOI] [PubMed] [Google Scholar]
- 15.Katsumata LW, Miyajima A, Itoh T. Portal fibroblasts marked by the surface antigen Thy1 contribute to fibrosis in mouse models of cholestatic liver injury. Hepatol Commun. 2017;1:198–214. [DOI] [PMC free article] [PubMed] [Google Scholar]
- 16.Yang W, He H, Wang T, Su N, Zhang F, Jiang K, et al. Single-cell transcriptomic analysis reveals a hepatic stellate cell-activation roadmap and myofibroblast origin during liver fibrosis in mice. Hepatology. 2021;74:2774–2790. [DOI] [PMC free article] [PubMed] [Google Scholar]
- 17.Cui Z, Huang N, Liu L, Li X, Li G, Chen Y, et al. Dynamic analysis of m6A methylation spectroscopy during progression and reversal of hepatic fibrosis. Epigenomics. 2020;12:1707–1723. [DOI] [PubMed] [Google Scholar]
- 18.Rodríguez-Aguilera JR, Guerrero-Hernández C, Pérez-Molina R, Cadena-Del-Castillo CE, Pérez-Cabeza de Vaca R, Guerrero-Celis N, et al. Epigenetic effects of an adenosine derivative in a Wistar rat model of liver cirrhosis. J Cell Biochem. 2018;119:401–413. [DOI] [PubMed] [Google Scholar]
- 19.Sanders YY, Pardo A, Selman M, Nuovo GJ, Tollefsbol TO, Siegal GP, et al. Thy-1 promoter hypermethylation: a novel epigenetic pathogenic mechanism in pulmonary fibrosis. Am J Respir Cell Mol Biol. 2008;39:610–618. [DOI] [PMC free article] [PubMed] [Google Scholar]
- 20.Yamazaki T, Enosawa S, Kasahara M, Fukuda A, Sakamoto S, Shigeta T, et al. Isolation of hepatic progenitor cells from human liver with cirrhosis secondary to biliary atresia using EpCAM or Thy-1 markers. Cell Med. 2012;3:121–126. [DOI] [PMC free article] [PubMed] [Google Scholar]
- 21.Wilhelm A, Aldridge V, Haldar D, Naylor AJ, Weston CJ, Hedegaard D, et al. CD248/endosialin critically regulates hepatic stellate cell proliferation during chronic liver injury via a PDGF-regulated mechanism. Gut. 2016;65:1175–1185. [DOI] [PMC free article] [PubMed] [Google Scholar]
- 22.Castilho-Fernandes A, de Almeida DC, Fontes AM, Melo FU, Picanço-Castro V, Freitas MC, et al. Human hepatic stellate cell line (LX-2) exhibits characteristics of bone marrow-derived mesenchymal stem cells. Exp Mol Pathol. 2011;91:664–672. [DOI] [PubMed] [Google Scholar]
- 23.Choi J, Leyton L, Nham SU. Characterization of alphaX I-domain binding to Thy-1. Biochem Biophys Res Commun. 2005;331:557–561. [DOI] [PubMed] [Google Scholar]
- 24.Li H, Zheng HW, Chen H, Xing ZZ, You H, Cong M, et al. Hepatitis B virus particles preferably induce Kupffer cells to produce TGF-β1 over pro-inflammatory cytokines. Dig Liver Dis. 2012;44:328–333. [DOI] [PubMed] [Google Scholar]
- 25.Karlmark KR, Zimmermann HW, Roderburg C, Gassler N, Wasmuth HE, Luedde T, et al. The fractalkine receptor CX3CR1 protects against liver fibrosis by controlling differentiation and survival of infiltrating hepatic monocytes. Hepatology. 2010;52:1769–1782. [DOI] [PubMed] [Google Scholar]
- 26.Ramachandran P, Dobie R, Wilson-Kanamori JR, Dora EF, Henderson BEP, Luu NT, et al. Resolving the fibrotic niche of human liver cirrhosis at single-cell level. Nature. 2019;575:512–518. [DOI] [PMC free article] [PubMed] [Google Scholar]
- 27.Luo Z, Shivakumar P, Mourya R, Gutta S, Bezerra JA. Gene expression signatures associated with survival times of pediatric patients with biliary atresia identify potential therapeutic agents. Gastroenterology. 2019;157:1138–1152.e14. [DOI] [PMC free article] [PubMed] [Google Scholar]


