Abstract
Carbon dioxide electroreduction (CO2RR) is a sustainable way of producing carbon‐neutral fuels. Product selectivity in CO2RR is regulated by the adsorption energy of reaction‐intermediates. Here, we employ differential phase contrast‐scanning transmission electron microscopy (DPC‐STEM) to demonstrate that Sn heteroatoms on a Ag catalyst generate very strong and atomically localized electric fields. In situ attenuated total reflection infrared spectroscopy (ATR‐IR) results verified that the localized electric field enhances the adsorption of *COOH, thus favoring the production of CO during CO2RR. The Ag/Sn catalyst exhibits an approximately 100 % CO selectivity at a very wide range of potentials (from −0.5 to −1.1 V, versus reversible hydrogen electrode), and with a remarkably high energy efficiency (EE) of 76.1 %.
Keywords: Ag-Based, Electric Filed, Electrochemical CO2 Reduction, Heteroatoms, Intermediate
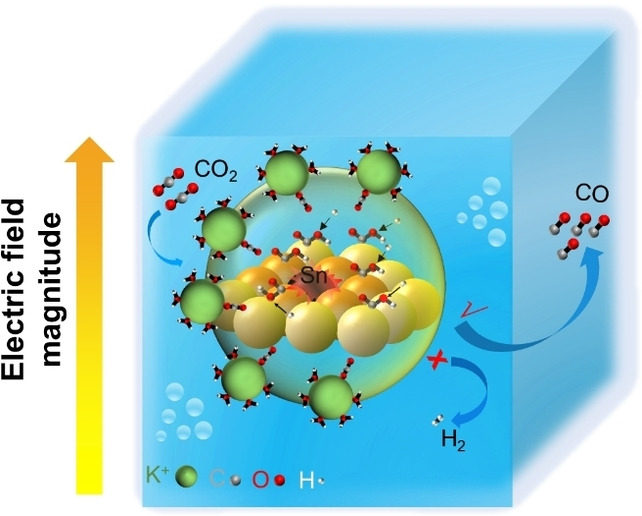
Tin heteroatoms on a silver catalyst generate very strong and atomically localized electric fields, as disclosed by differential phase contrast‐scanning transmission electron microscopy (DPC‐STEM). This results in a 100 % selectivity for CO at a wide range of potentials (−0.5 V to −1.1 V vs. RHE).
Electrochemical carbon dioxide reduction reaction (CO2RR) using renewable energy sources (e.g., solar, wind, and tide) is an attractive route to promote a sustainable and carbon‐neutral economy.[ 1 , 2 , 3 ] Among many CO2RR products, carbon monoxide (CO) is regarded as a very useful product for practical manufacturing in terms of techno‐economic assessments.[ 4 , 5 , 6 ] It is generally accepted that CO2 converts into CO through three main steps:[ 6 , 7 , 8 , 9 ] (i) the adsorption of CO2; (ii) *COOH intermediate forms by concerted proton‐coupled electron transfer (CPET) process; (iii) *CO desorption. The formation of *COOH is mostly considered as the rate‐limiting step in the conversion of CO2 to CO. Hence, the selectivity and energy efficiency (EE) in the reduction of CO2 to CO are vastly limited by the adsorption of the intermediate *COOH on the surface‐active sites.
Compared with other electrocatalysts,[ 3 , 10 , 11 , 12 ] Ag‐based materials exhibit a good performance for CO2RR to CO by facilitating the absorption of *COOH. However, the CO faradaic efficiency (FE) of only 85 %‐90 % is far from the requirements for extensive industrialization.[ 13 , 14 , 15 ] Therefore, it is still necessary to optimize the selectivity and EE of Ag‐based catalysts towards the production of CO. According to previous reports,[ 1 , 16 , 17 , 18 ] electric field can greatly stabilize the *COOH intermediate during the electrochemical reduction reaction. For instance, Liu et al. confirmed that Cu nanoneedles can improve the adsorption of the intermediate by the synergy effect of electric and thermal fields. [17] Besides morphology control, Zhao et al. investigated the introduction of Sn heteroatoms into a Cu catalyst, [10] achieving highly localized electron densities that enhanced the absorption of intermediates. Therefore, it seems a feasible strategy to improve the adsorption of *COOH by building strong atomically localized electric field by the intrusion of heteroatoms.
Here, we demonstrate that introducing Sn atoms to a Ag catalyst leads to accumulation of electrons around the Ag atoms, resulting in a strong and localized electric field. Differential phase contrast‐scanning transmission electron microscopy (DPC‐STEM) unveils the electric‐field distribution at atomic scale in a Ag/Sn particle, clearly revealing the heteroatoms‐induced strongly localized electric field. Theoretical studies and in situ attenuated total reflection infrared spectroscopy (ATR‐IR) results show that the localized electric‐field enhances the absorption of *COOH. As such, our model Ag/Sn catalyst shows a nearly 100 % CO2‐to‐CO faradaic efficiency (FE) under a very broad potential window, ranging from −0.5 to −1.1 V versus reversible hydrogen electrode (vs. RHE). The catalyst maintains a nearly unchanged CO selectivity over 20 hours, surpassing most reported electrocatalysts. Impressively, the Ag/Sn catalyst also exhibits a high current density of up to 200 mA cm−2 with 100 % CO FE at a low overpotential of −1.14 V vs. RHE.
To investigate the atomic interactions and reaction energetics, density functional theory (DFT) simulations were performed.[ 7 , 19 , 20 , 21 ] As displayed in Figure 1a, the calculated charge density reconfiguration demonstrates that charge density is depleted around the central Sn atom, but accumulated around adjacent Ag atoms, indicating that electrons are transferred from inserted Sn atoms to Ag atoms. Matrix laboratory (MATLAB) simulation[ 22 , 23 , 24 , 25 ] confirms that the redistribution of charge caused by the heteroatom Sn induces the enhanced local electric field (Figure 1b). To investigate the effect of the enhanced‐localized electric field on the CO2RR, the Gibbs free energy (ΔG) for the conversion of CO on the catalysts was studied. The results indicate that Ag/Sn displays a lower energy barrier for *COOH generation and a higher energy barrier for *H generation (i.e. the competing H2 evolution reaction) than those of pure Ag (Figure 1c and 1d). Hence, Ag/Sn would—in principle—display a higher selectivity towards CO over H2 in the CO2RR compared with pure Ag. As such, our theoretical calculations demonstrate that the heteroatom‐induce localized electric field could improve the performance of electrochemical carbon dioxide reduction reaction (CO2RR) to CO.
Figure 1.
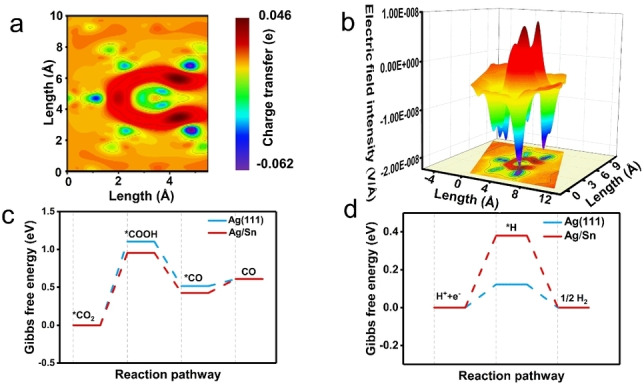
Theoretical calculations and simulations. a) Distribution of charge in the Ag/Sn heteroatom model. b) MATLAB simulations of localized electric field on the Ag/Sn catalyst. c) Free energy diagrams of CO2 reduction to CO on the model catalysts: Ag/Sn and Ag. d) Free energy diagrams for HER on Ag/Sn and Ag.
Next, we move to experimentally measure the heteroatom‐expected CO selectivity in CO2RR. We prepared the Ag/Sn catalyst (see Supporting Information) and performed its characterization. X‐ray diffraction (XRD) patterns exhibit peaks at 19.1°, 22.2°, 32.3° 38.8° and 40.9°, corresponding to the (111), (200), (220), (311) and (222) diffraction planes of the Ag phase, respectively (Figure 2a). The chemical composition and valence states of Ag/Sn are obtained by X‐ray photoelectron spectroscopy (XPS). The Ag 3d (Figure 2b) and Sn 3d spectra (Figure 2c) of the pristine Ag/Sn catalyst display Ag0 and Sn0 states, respectively.
Figure 2.
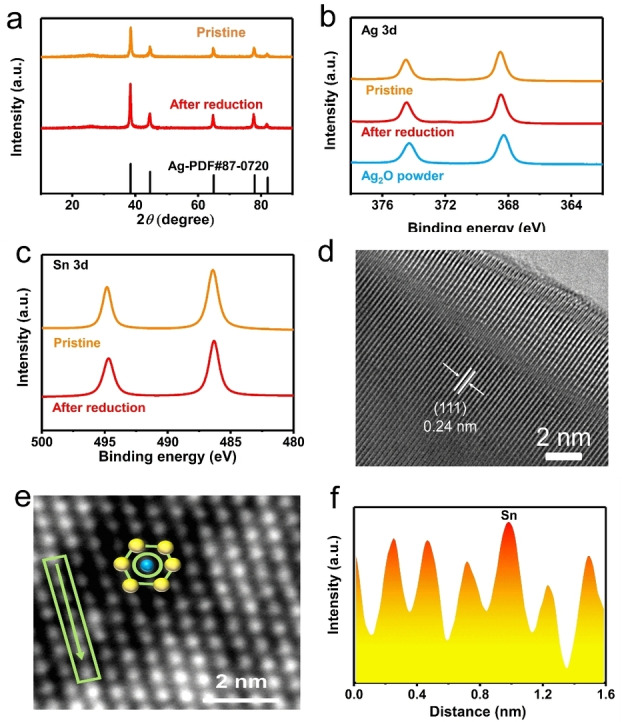
Characterizations of the Ag/Sn catalyst. a) XRD patterns. b) Ag 3d XPS spectra. c) Sn 3d XPS spectra. d) HR‐TEM images. e) High angle annular dark field scanning transmission electron microscopy (HAADF‐STEM) image. f) Intensity profile line scan, the peaks represent atom locations, Sn can be observed from the relatively stronger peak intensities.
Scanning electron microscopy (SEM) image and Brunauer–Emmett–Teller (BET) surface area analyses reveal that both Ag/Sn and Ag samples have identical nanoparticle morphologies and surface areas (Figure S1, S2 and Table S1). Energy‐dispersive X‐ray spectroscopy (EDS) mapping (Figure S2b) confirms the presence of Ag and Sn. Inductively coupled plasma mass spectrometry (Figure S3) measurements reveal a Sn content of 1.02 wt.%. High‐resolution transmission electron microscopy (HR‐TEM, Figure 2d) image shows a lattice distance of ≈2.4 Å in the particle, which can be indexed to the (111) plane of cubic Ag.
To investigate the structure of the Ag/Sn catalyst, high angle annular dark‐field scanning transmission electron microscopy (HAADF‐STEM) was conducted. The image (Figure 2e) shows that the Ag/Sn particles are single crystals with perfect hexagonal lattice. From this Z‐scheme sensitive STEM image, the atomic structure of Ag/Sn can be schemed as the inset in Figure 2e. The profile in Figure 2f corresponds to the linear area in Figure 2e (marked with an arrow). The intensity analysis shows that the Sn was successfully incorporated into the Ag lattice.
Next, we measured the local electric field in the Ag/Sn catalyst by employing differential phase contrast‐scanning transmission electron microscopy (DPC‐STEM). The color map in Figure 3a shows the non‐uniform distribution of the electric field on a single Sn/Ag particle. The arrows mark the irregular electron transfer direction on the Sn/Ag particle. The linear profile in Figure 3b shows the intensity of the electric field across a single Ag/Sn particle. Comparing to the basal plane of Ag, the Sn atoms generate stronger electric field (marked with the dashed rectangles). Inset of Figure 3b shows the anisotropic electric field distribution on Ag/Sn, which is mainly caused by the Sn distribution. In order to identify the relationship between the Sn distribution and the atomic‐scale electric field intensity, we perform a high‐resolution DPC‐STEM imaging (Figure 3). As shown in the line profile in Figure 3c, the atomic‐scale electric field is sensitive to the atomic distribution. The inset of Figure 3c shows the periodicity of Ag is broken by the Sn doping and thus builds an anisotropic electric field distribution. In fact, building an enhanced and ordered electric field distribution can further promote the catalytic activity. [18] Remarkably, the atomic resolution DPC‐STEM image confirms that the charge tends to delocalize around the Sn atoms (Figure 3d), in excellent agreement with the DFT calculation (Figure 1a) and the XPS results (Figure 2c). Besides that, the Ag near‐edge position of Ag/Sn indicates that the Ag valence state is slightly lower than Ag0 (Figure S4a). These results confirm that the incorporation of Sn tends to delocalize charge by donating electrons to the Ag atoms, ultimately inducing atomic electric field localization on the Ag/Sn particle.
Figure 3.
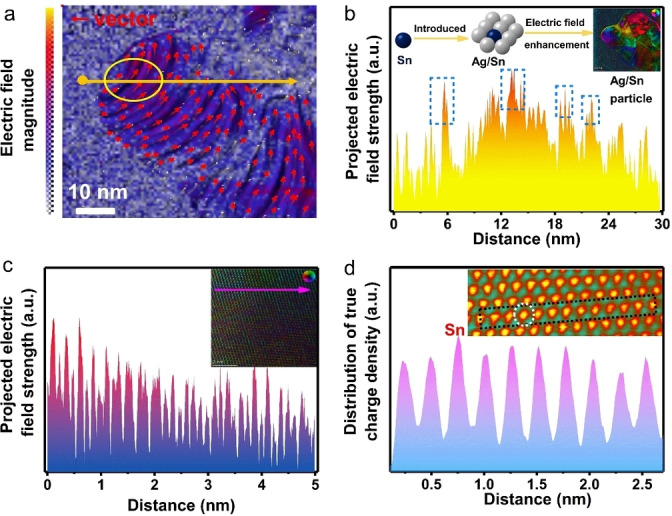
Differential phase contrast (DPC) images of the Ag/Sn catalyst. a) Arrow‐map representation of the strength and orientation of the electric field in the Ag/Sn catalyst. The highlighted area (yellow circle) shows a stronger intensity of the electric field when comparing to other areas. The red arrows indicate the directions of electric field. b) Electric field intensity profile along the yellow line shown in (a). The inset in (b) is the color map of the electric field distribution. c) Electric field intensity profile along the violet line shown in the inset in (c). The inset in (c) shows an arrow‐map representation of the strength and orientation of the electric field at atomic level. The inset color wheel represents vector direction and magnitude by its color and brightness, respectively. d) Distribution of atomic charge density intensity profile along the line (dotted square area in the inset) for Ag/Sn. Inset in (d) is the specific charge distribution map at the atomic scale.
The CO2 electroreduction performances of the catalysts were firstly carried out in a H‐type cell with CO2‐saturated in 0.1 M KHCO3 electrolyte. As shown in Figure 4a, the Ag/Sn catalyst exhibits a lower reaction overpotential and a larger current density in CO2‐saturated electrolyte compared with that of the Ar‐saturated case, hinting a faster CO2RR kinetics than a hydrogen evolution reaction (HER) on the Ag/Sn particles. Furthermore, Ag/Sn shows a larger current density than those of Ag and Ag/Sn washed by diluted HCl (Ag/SnHCl, the Sn can be washed by diluted HCl, as shown in Table S2) in CO2‐saturated electrolyte, indicating the higher activity towards CO2RR of Ag/Sn.
Figure 4.
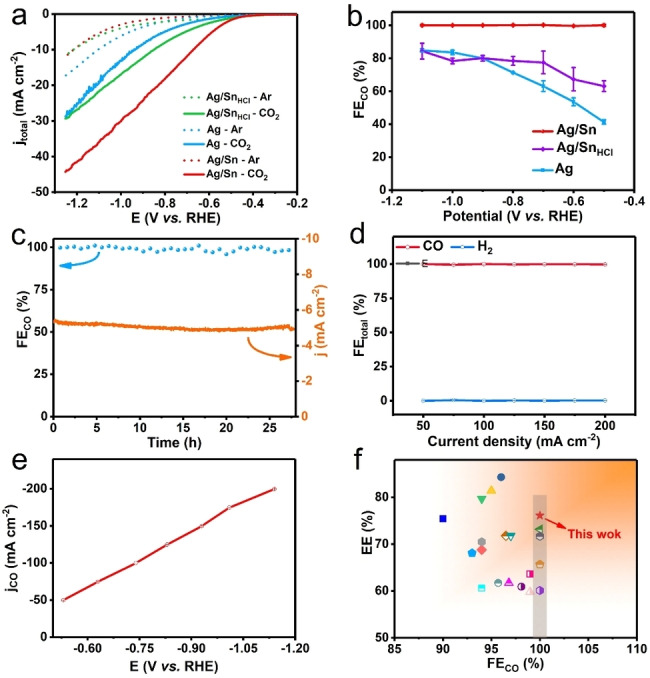
Electrochemical CO2RR performances. a) CO2 reduction cathodic linear sweep voltammetry (LSV) results in H‐cell. b) FE of CO in H‐cell. c) Stability test at −0.65 V vs. RHE in 0.1 M KHCO3 solution for the Ag/Sn catalyst. d) FE values of products on Ag/Sn catalysts under different current densities in flow cell. e) Partial CO current densities j CO at difference potentials of Ag/Sn catalysts in flow cell. f) Comparison on EE as the function of FE. The different symbols indicate the catalysts collected from the literature.
A set of constant‐potential electrolysis experiments were then conducted on Ag/Sn, Ag/SnHCl and Ag catalysts to compare their activities and selectivities. The catalytic activity of Ag/Sn alloy is sensitive to the Ag : Sn ration, where the Ag/Sn alloy with ratio of 96 : 4 shows the best activity (Figure S7a). As shown in Figure 4b, the Ag/Sn catalyst with ratio of 96 : 4 retains ≈100 % FE of CO (FECO) over a wide potential window from −0.5 to −1.1 V vs. RHE, while no liquid product was detected in the solution (Figure S5). In comparison, the selectivities for CO are below 90 % at the tested potentials for the Ag and Ag/SnHCl cases (Figure S7b and S7c). To analyze the intrinsic activity of the catalysts, the current densities were further normalized by electrochemical surface area in each case[ 26 , 27 , 28 ] (ECSA, Figure S8) (Figure S6c). The results suggest that the Ag/Sn catalyst have a higher CO2RR intrinsic activity compared to the control catalysts (Ag/SnHCl and Ag).
A long‐term Ag/Sn stability test is conducted at −0.65 V vs. RHE in H‐cell (Figure 4c) to confirm its performance in time during the CO2RR. Ag/Sn maintains an almost unchanged FECO (≈100 %) and current density over 20 h during the test. At the same time, the production of H2 is negligible. After the long‐term test, Ag/Sn still exhibits a strong localized electric field (Figure S9b). SEM and TEM images further reveal that there is no obvious morphology changes for the Ag/Sn sample after CO2RR (Figure S11a), also confirming the long‐term stability of the Ag/Sn catalyst.
To improve the CO2RR reaction rate, the performance of the Ag/Sn catalyst is investigated in 1 M KOH electrolyte with the gas flow‐cell system (GFC) (Figure S12). As displayed in Figure 4d and 4e, the FEs for CO keep ≈100 % even at current densities ranging from −50 to −200 mA cm−2 with low potentials. Moreover, the Ag/Sn catalyst achieves a remarkable long‐term stability of over 10 h at a current density of −100 mA cm−2 in GFC (Figure S13d) with negligible H2 signal detected by gas chromatograph (Figure S14). These results indicate that the Ag/Sn catalyst possesses good possibilities for industrial applications.
To analyze the cathodic energy efficiency (EE) of our catalyst, the EE as a function of FECO was plotted (Figure 4f) and compared with other remarkable reports from the literature. Considering all catalysts with 100 % selectivity for CO, our work outperforms with the highest EE. Moreover, the Ag/Sn catalyst has the leading EE with great FECO and impressive current density among the listed catalysts (Figure S16 and Table S3).
To correlate the Ag/Sn structure with the outstanding performance, we study the effect of the localized electric field on the adsorption of the *COOH intermediate in the CO2RR. In situ ATR‐FTIR measurements (Figure S17a) were performed at the following potentials: −0.6 V, −0.7 V, −0.8 V, −0.9 V, −1.0 V and −1.1 V vs. RHE (i.e. Ag/Sn has an excellent CO selectivity at those potentials). Peaks at 2350 cm−1 and 1225 cm−1 (Figure 5a) correspond to gaseous CO2 and HCO3 −, respectively.[ 29 , 30 , 31 ] There is an observable peak at 1660 cm−1, caused by the C−O stretching mode of *COOH.[ 19 , 32 , 33 , 34 ] While shifting the applied potential, the *COOH stretching band area increases gradually, indicating that *COOH is consumed quickly to form CO under the localized electric field. The peak intensities of surface‐absorbed *COOH on Ag/Sn and Ag (control) were compared under the same applied potential (Figure 5b). Ag/Sn shows a stronger *COOH adsorption capacity, further confirming the localized electric field enhanced adsorption of *COOH at even low overpotentials during CO2RR. Moreover, we measured the K+ adsorption capacity of the different catalysts (Figure S18 and S19) during CO2RR as it has been shown that high local concentrations of alkali metal cations facilitate reagent diffusion and enhance the absorption of intermediates in electrochemical reactions.[ 1 , 35 , 36 ] Our results indicate that the local concentration of K+ for Ag/Sn is higher than for Ag and Ag/SnHCl samples during the test (Figure S19). These results confirm that the heteroatom‐induced localized electric field improves the CO selectivity by enhancing the adsorption of *COOH during the electrochemical CO2RR. Moreover, Pb underpotential deposition (UPD) demonstrates that the Sn near to surficial Ag can decrease barrier of triggering reaction and enhance adsorption ability on Ag, and thus promote the CO2RR activity. The in situ Raman is employed to investigate the surficial state of Ag/Sn during CO2RR. As shown in Figure 5c, the characteristic peaks of CO locate at surrounded 2100 cm−1. The intensity of this peak increases along with the applied potential. Moreover, the peaks show the blue shift at high applied potential, demonstrating the weakened bond strength between CO and active sites during CO2RR at high potential. This indicates that the high FECO can be assistant with the promoted desorption efficiency of CO on active sites. The CO release process on active sites is reversable. As marked by the arrows in Figure 5c, the strong CO peak moves to its initial position once the applied potential decreased from −1.2 to 0.6 V, indicating that the active sites possess high surficial structural stability during CO2RR. This is consistent with the former XPS, XRD, and TEM results of Ag/Sn after reaction.
Figure 5.
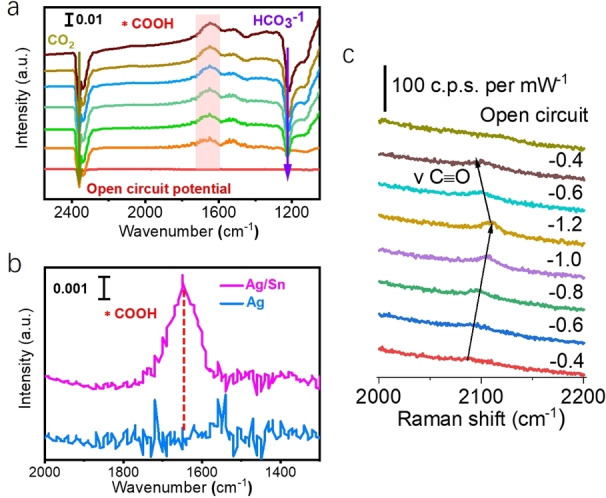
In situ experiments. a) In situ ATR‐IR spectroscopy on Ag/Sn in CO2 0.1 M KHCO3 electrolyte at different potentials and 20 min after CO2 purged in the cell. b) Comparison of in situ ATR‐IR spectra of Ag/Sn and Ag at −0.5 V vs. RHE in the range of 1300–2000 cm−1. c) In situ Raman spectrum of Ag/Sn during CO2RR.
We developed a Ag/Sn catalyst with a strong electric‐field localization at the atomic scale that enhances the adsorption of *COOH. The Ag/Sn catalyst exhibited remarkably high performances for CO2RR in both an H‐cell reactor and a GFC system. DFT calculations revealed that the Sn heteroatoms induced a highly localized and inhomogeneous electric‐field distribution on the Ag/Sn nanoparticles. DPC‐STEM images show the localized electric field in the real space, providing new insights to analyze electric fields in heterogeneous catalysis. Combined with in situ ATR‐IR results, we concluded that the localized electric field enhances the absorption of *COOH and thus promoting a very high selectivity for CO. Indeed, the catalyst exhibits an approximately 100 % CO faradaic efficiency over a very wide potential range: −0.5 (onset) to−1.1 V (vs. RHE) with a remarkable EE of 76.1 %.
Conflict of interest
The authors declare no conflict of interest.
Supporting information
As a service to our authors and readers, this journal provides supporting information supplied by the authors. Such materials are peer reviewed and may be re‐organized for online delivery, but are not copy‐edited or typeset. Technical support issues arising from supporting information (other than missing files) should be addressed to the authors.
Supporting Information
Acknowledgements
We thank the International Science and Technology Cooperation Program (Grant No. 2017YFE0127800 and 2018YFE0203402), Natural Science Foundation of China (Grant No. 21872174 and U1932148), China postdoctoral science foundation (2021 M703627), State Key Laboratory of Powder Metallurgy, Hunan Provincial Science and Technology Program (2017XK2026), Hunan Provincial Natural Science Foundation of China (2020JJ2041and 2020JJ5691), The science and technology innovation Program of Hunan Province (2020WK2002). Ministry of Science and Technology, Taiwan (Contract No. MOST 110‐2113‐M‐213‐002). The authors gratefully thank the National Synchrotron Radiation Research Center (NSRRC, the TLS 01 C1 beamlines) for XAFS measurement. We also acknowledge funding and support from e‐conversion cluster of excellence from the (DFG, German Research Foundation) under Germany′s Excellence Strategy—EXC 2089/1—390776260, the Bavarian program Solar Technologies Go Hybrid (SolTech), the Center for NanoScience (CeNS) and the European Commission through the ERC Starting Grant CATALIGHT (802989). We are grateful for resources from the High Performance Computing Center of Central South University. Open Access funding enabled and organized by Projekt DEAL.
C. Cai, B. Liu, K. Liu, P. Li, J. Fu, Y. Wang, W. Li, C. Tian, Y. Kang, A. Stefancu, H. Li, C.-W. Kao, T.-S. Chan, Z. Lin, L. Chai, E. Cortés, M. Liu, Angew. Chem. Int. Ed. 2022, 61, e202212640; Angew. Chem. 2022, 134, e202212640.
Contributor Information
Prof. Chen Tian, Email: estianchen@csu.edu.cn.
Prof. Emiliano Cortés, Email: emiliano.cortes@lmu.de.
Prof. Min Liu, Email: minliu@csu.edu.cn.
Data Availability Statement
The data that support the findings of this study are available from the corresponding author upon reasonable request.
References
- 1. Liu M., Pang Y., Zhang B., De Luna P., Voznyy O., Xu J., Zheng X., Dinh C. T., Fan F., Cao C., de Arquer F. P., Safaei T. S., Mepham A., Klinkova A., Kumacheva E., Filleter T., Sinton D., Kelley S. O., Sargent E. H., Nature 2016, 537, 382–386. [DOI] [PubMed] [Google Scholar]
- 2. Rosen J., Hutchings G. S., Lu Q., Rivera S., Zhou Y., Vlachos D. G., Jiao F., ACS Catal. 2015, 5, 4293–4299. [Google Scholar]
- 3. Wang Q., Zhang Z., Cai C., Wang M., Zhao Z. L., Li M., Huang X., Han S., Zhou H., Feng Z., Li L., Li J., Xu H., Francisco J. S., Gu M., J. Am. Chem. Soc. 2021, 143, 13605–13615. [DOI] [PubMed] [Google Scholar]
- 4. Jin S., Hao Z., Zhang K., Yan Z., Chen J., Angew. Chem. Int. Ed. 2021, 60, 20627–20648; [DOI] [PubMed] [Google Scholar]; Angew. Chem. 2021, 133, 20795–20816. [Google Scholar]
- 5. Chen K., Cao M., Lin Y., Fu J., Liao H., Zhou Y., Li H., Qiu X., Hu J., Zheng X., Shakouri M., Xiao Q., Hu Y., Li J., Liu J., Cortés E., Liu M., Adv. Funct. Mater. 2022, 32, 2111322. [Google Scholar]
- 6. Chen K., Cao M., Ni G., Chen S., Liao H., Zhu L., Li H., Fu J., Hu J., Cortés E., Liu M., Appl. Catal. B 2022, 306, 121093. [Google Scholar]
- 7. Zhang T., Han X., Yang H., Han A., Hu E., Li Y., Yang X. Q., Wang L., Liu J., Liu B., Angew. Chem. Int. Ed. 2020, 59, 12055–12061; [DOI] [PubMed] [Google Scholar]; Angew. Chem. 2020, 132, 12153–12159. [Google Scholar]
- 8. Cao Y., Guo L., Dan M., Doronkin D. E., Han C., Rao Z., Liu Y., Meng J., Huang Z., Zheng K., Chen P., Dong F., Zhou Y., Nat. Commun. 2021, 12, 1675. [DOI] [PMC free article] [PubMed] [Google Scholar]
- 9. Gao W., Li S., He H., Li X., Cheng Z., Yang Y., Wang J., Shen Q., Wang X., Xiong Y., Zhou Y., Zou Z., Nat. Commun. 2021, 12, 4747. [DOI] [PMC free article] [PubMed] [Google Scholar]
- 10. Ren W., Tan X., Qu J., Li S., Li J., Liu X., Ringer S. P., Cairney J. M., Wang K., Smith S. C., Zhao C., Nat. Commun. 2021, 12, 1449. [DOI] [PMC free article] [PubMed] [Google Scholar]
- 11. Yang F., Song P., Liu X., Mei B., Xing W., Jiang Z., Gu L., Xu W., Angew. Chem. Int. Ed. 2018, 57, 12303–12307; [DOI] [PubMed] [Google Scholar]; Angew. Chem. 2018, 130, 12483–12487. [Google Scholar]
- 12. Chen Y., Li C. W., Kanan M. W., J. Am. Chem. Soc. 2012, 134, 19969–19972. [DOI] [PubMed] [Google Scholar]
- 13. Zhang Z., Wen G., Luo D., Ren B., Zhu Y., Gao R., Dou H., Sun G., Feng M., Bai Z., Yu A., Chen Z., J. Am. Chem. Soc. 2021, 143, 6855–6864. [DOI] [PubMed] [Google Scholar]
- 14. Ma M., Trzesniewski B. J., Xie J., Smith W. A., Angew. Chem. Int. Ed. 2016, 55, 9748–9752; [DOI] [PubMed] [Google Scholar]; Angew. Chem. 2016, 128, 9900–9904. [Google Scholar]
- 15. Liu S., Tao H., Zeng L., Liu Q., Xu Z., Liu Q., Luo J. L., J. Am. Chem. Soc. 2017, 139, 2160–2163. [DOI] [PubMed] [Google Scholar]
- 16. Cai C., Liu K., Zhu Y., Li P., Wang Q., Liu B., Chen S., Li H., Zhu L., Li H., Fu J., Chen Y., Pensa E., Hu J., Lu Y. R., Chan T. S., Cortes E., Liu M., Angew. Chem. Int. Ed. 2022, 61, e202113664; [DOI] [PMC free article] [PubMed] [Google Scholar]; Angew. Chem. 2022, 134, e202113664. [DOI] [PMC free article] [PubMed] [Google Scholar]
- 17. Yang B., Liu K., Li H., Liu C., Fu J., Li H., Huang J. E., Ou P., Alkayyali T., Cai C., Duan Y., Liu H., An P., Zhang N., Li W., Qiu X., Jia C., Hu J., Chai L., Lin Z., Gao Y., Miyauchi M., Cortes E., Maier S. A., Liu M., J. Am. Chem. Soc. 2022, 144, 3039–3049. [DOI] [PubMed] [Google Scholar]
- 18. Zhou Y., Liang Y., Fu J., Liu K., Chen Q., Wang X., Li H., Zhu L., Hu J., Pan H., Miyauchi M., Jiang L., Cortes E., Liu M., Nano Lett. 2022, 22, 1963–1970. [DOI] [PubMed] [Google Scholar]
- 19. Yuan X., Zhang L., Li L., Dong H., Chen S., Zhu W., Hu C., Deng W., Zhao Z. J., Gong J., J. Am. Chem. Soc. 2019, 141, 4791–4794. [DOI] [PubMed] [Google Scholar]
- 20. Sun X., Chen C., Liu S., Hong S., Zhu Q., Qian Q., Han B., Zhang J., Zheng L., Angew. Chem. Int. Ed. 2019, 58, 4669–4673; [DOI] [PubMed] [Google Scholar]; Angew. Chem. 2019, 131, 4717–4721. [Google Scholar]
- 21. Xiong L., Zhang X., Yuan H., Wang J., Yuan X., Lian Y., Jin H., Sun H., Deng Z., Wang D., Hu J., Hu H., Choi J., Li J., Chen Y., Zhong J., Guo J., Rummerli M. H., Xu L., Peng Y., Angew. Chem. Int. Ed. 2021, 60, 2508–2518; [DOI] [PubMed] [Google Scholar]; Angew. Chem. 2021, 133, 2538–2548. [Google Scholar]
- 22. Lin Y., Liu K., Chen K., Xu Y., Li H., Hu J., Lu Y.-R., Chan T.-S., Qiu X., Fu J., Liu M., ACS Catal. 2021, 11, 6304–6315. [Google Scholar]
- 23. Liu D., Li X., Chen S., Yan H., Wang C., Wu C., Haleem Y. A., Duan S., Lu J., Ge B., Ajayan P. M., Luo Y., Jiang J., Song L., Nat. Energy 2019, 4, 512–518. [Google Scholar]
- 24. Knight S., Planet. Space Sci. 1973, 21, 741–750. [Google Scholar]
- 25. Mozer F. S., Planet. Space Sci. 1970, 18, 259–263. [Google Scholar]
- 26. Zhang N., Zhang X., Tao L., Jiang P., Ye C., Lin R., Huang Z., Li A., Pang D., Yan H., Wang Y., Xu P., An S., Zhang Q., Liu L., Du S., Han X., Wang D., Li Y., Angew. Chem. Int. Ed. 2021, 60, 6170–6176; [DOI] [PubMed] [Google Scholar]; Angew. Chem. 2021, 133, 6235–6241. [Google Scholar]
- 27. Abeyweera S. C., Yu J., Perdew J. P., Yan Q., Sun Y., Nano Lett. 2020, 20, 2806–2811. [DOI] [PubMed] [Google Scholar]
- 28. Gu J., Bai L., Chen H. M., Hu X., Science 2019, 364, 1091–1094. [DOI] [PubMed] [Google Scholar]
- 29. Baruch M. F., Pander J. E., White J. L., Bocarsly A. B., ACS Catal. 2015, 5, 3148–3156. [Google Scholar]
- 30. Qi-Hui Wu N.-H. L., Sun S.-G., J. Phys. Chem. B 2006, 110, 11025–11606.16771357 [Google Scholar]
- 31. Corson E. R., Kas R., Kostecki R., Urban J. J., Smith W. A., McCloskey B. D., Kortlever R., J. Am. Chem. Soc. 2020, 142, 11750–11762. [DOI] [PubMed] [Google Scholar]
- 32. Figueiredo M. C., Ledezma-Yanez I., Koper M. T. M., ACS Catal. 2016, 6, 2382–2392. [Google Scholar]
- 33. Firet N. J., Smith W. A., ACS Catal. 2017, 7, 606–612. [Google Scholar]
- 34. Li X., Wang S., Li L., Sun Y., Xie Y., J. Am. Chem. Soc. 2020, 142, 9567–9581. [DOI] [PubMed] [Google Scholar]
- 35. Gao F. Y., Hu S. J., Zhang X. L., Zheng Y. R., Wang H. J., Niu Z. Z., Yang P. P., Bao R. C., Ma T., Dang Z., Guan Y., Zheng X. S., Zheng X., Zhu J. F., Gao M. R., Yu S. H., Angew. Chem. Int. Ed. 2020, 59, 8706–8712; [DOI] [PubMed] [Google Scholar]; Angew. Chem. 2020, 132, 8784–8790. [Google Scholar]
- 36. Resasco J., Chen L. D., Clark E., Tsai C., Hahn C., Jaramillo T. F., Chan K., Bell A. T., J. Am. Chem. Soc. 2017, 139, 11277–11287. [DOI] [PubMed] [Google Scholar]
Associated Data
This section collects any data citations, data availability statements, or supplementary materials included in this article.
Supplementary Materials
As a service to our authors and readers, this journal provides supporting information supplied by the authors. Such materials are peer reviewed and may be re‐organized for online delivery, but are not copy‐edited or typeset. Technical support issues arising from supporting information (other than missing files) should be addressed to the authors.
Supporting Information
Data Availability Statement
The data that support the findings of this study are available from the corresponding author upon reasonable request.


