

Abstract
Background
Fibrin, the main scaffold of thrombi, is susceptible to citrullination by PAD (peptidyl arginine deiminase) 4, secreted from neutrophils during the formation of neutrophil extracellular traps. Citrullinated fibrinogen (citFg) has been detected in human plasma as well as in murine venous thrombi, and it decreases the lysability and mechanical resistance of fibrin clots.
Objective
To investigate the effect of fibrinogen citrullination on the structure of fibrin clots.
Methods
Fibrinogen was citrullinated with PAD4 and clotted with thrombin. Scanning electron microscopy (SEM) and atomic force microscopy (AFM) were used to measure fiber thickness, fiber height/width ratio, and fiber persistence length in clots containing citFg. Fiber density was measured with laser scanning microscopy (LSM) and permeability measurements were carried out to estimate the porosity of the clots. The intra‐fiber structure of fibrin was analyzed with small‐angle X‐ray scattering (SAXS).
Results
SEM images revealed a decrease in the median fiber diameter that correlated with the fraction of citFg in the clot, while the fiber width/length ratio remained unchanged according to AFM. With SAXS we observed that citrullination resulted in the formation of denser clots in line with increased fiber density shown by LSM. The permeability constant of citrullinated fibrin decreased more than 3‐fold indicating significantly decreased porosity. SAXS also showed largely preserved periodicity in the longitudinal assembly of fibrin monomers.
Conclusion
The current observations of thin fibers combined with dense packing and low porosity in the presence of citFg can provide a structural framework for the mechanical fragility and lytic resistance of citrullinated fibrin.
Keywords: atomic force microscopy, citrullination, fibrin, protein–arginine deiminases, small‐angle X‐ray scattering
Essentials.
Post‐translational modifications of fibrinogen, including citrullination, affect fibrin function.
We investigated how incorporation of citrullinated fibrinogen (citFg) affects fibrin structure.
CitFg decreased fiber diameter, bending rigidity, and porosity, and increased the density of fibrin.
These changes can contribute to the fragility and lytic resistance of clots formed with citFg.
1. INTRODUCTION
Cardiovascular diseases (coronary heart disease, cerebrovascular disease, deep vein thrombosis [DVT]) represent a major global health burden accounting for 32% of all global deaths according to the latest World Health Organization report. 1 The underlying cause of acute tissue damage in these diseases is the formation of thrombi, the scaffold of which is fibrin. Fibrin is formed from its soluble precursor, fibrinogen, by thrombin. Multiple studies support the crucial role for fibrin clot structure in thrombosis. 2 Fibrin structure affects the mechanical properties of thrombi, as well as their susceptibility to dissolution by plasmin formed from plasminogen by plasminogen activators (e.g. tissue‐type [tPA]). 3 The lytic pattern in altered thrombus structure might influence their propensity toward embolization 4 , 5 , 6 as well as the success of catheter‐directed thrombolysis and pharmacomechanical thrombectomy. 7 , 8 , 9 , 10
Consequently, post‐translational modifications of fibrin(ogen) (oxidation, glyoxylation, carbamylation, glycation) might have a crucial impact on clot stability through the alteration of fibrin structure. 2 , 11 , 12 , 13 Citrullination is another post‐translational modification potentially converting 23 peptidyl–arginyl residues of fibrinogen into peptidyl–citrulline. 14 The catalysts of citrullination, the peptidyl arginine deiminase (PAD) family of enzymes have recently been in the spotlight due to their role in the formation of neutrophil extracellular traps (NETs)—web‐like DNA–histone–granular protein complexes released by neutrophils. 15 The presence of neutrophils and NET scaffolds in human thrombi has been confirmed, 16 , 17 , 18 , 19 and it has been shown that NET‐forming neutrophils secrete PAD4 and PAD2, 20 which catalyze the citrullination of fibrinogen. 21 The presence of citrullinated fibrinogen (citFg) has been proven in pathologies ranging from inflammatory joint diseases to atherosclerosis. 22 , 23 , 24 However, it has only been very recently demonstrated by our group that citFg is present in murine venous thrombi and that its incorporation in human model thrombi results in impaired fibrinolysis and mechanical stability. 25 These recent developments and the fact that currently there are only preliminary in vitro observations concerning the structure of citFg‐containing clots altogether warranted an in‐depth structural investigation. 26 , 27 , 28
In this study, we employed an orthogonal array of methods (scanning electron‐, confocal laser scanning‐, and atomic force microscopies [SEM/LSM/AFM], turbidimetry, permeability measurements, small‐angle X‐ray scattering [SAXS]) and demonstrate that this fibrinogen derivative leads to drastically altered clot structure characterized by thinner fibrin fibers with increased fiber curvature and density combined with decreased porosity.
2. MATERIALS AND METHODS
2.1. Chemicals and reagents
Fibrinogen (human, plasminogen depleted) was from Merck Kft. Thrombin from Serva Electrophoresis GmbH was further purified by ion‐exchange chromatography on sulfopropyl‐Sephadex yielding preparation with specific activity of 2100 IU/mg. 29 BSA (bovine serum albumin) and PAD4 (GST tagged) were from Merck Kft. Alexa Fluor® 546‐conjugated fibrinogen was from Invitrogen Life Technologies. Mouse monoclonal antibody [6C2.1] to citrulline (ab240908) was from Abcam. Factor XIIIa inhibitor ZED1301 was from Zedira GmbH, which was added at 20 μmol/L final concentration prior the clotting of fibrinogen by thrombin to prevent uncontrolled crosslinking of fibrin by trace contamination of factor XIII in the fibrinogen preparation.
2.2. In vitro citrullination of fibrinogen
Human fibrinogen at a standard concentration of 8 μM was incubated with PAD4 at concentrations ranging between 0.25–2.8 μg/ml or PAD4 vehicle (50 mM Tris–HCl, pH 7.5, 150 mM NaCl, 10 mM glutathione, 0.1 mM EDTA, 0.25 mM dithiothreitol [DTT], 0.1 mM phenylmathanesulfonyl, 25% glycerol) in 100 mM TRIS–HCl 10 mM CaCl2 1 mM DTT pH 7.5 for 1–4 h at 37°C. PAD4 concentrations and incubation times were adjusted according to the highly variable needs of various experimental set‐ups. For example, for the purpose of permeability measurements, shorter incubation times were chosen (compared to those for SEM and turbidimetry) because more extensive citrullination made clots mechanically too unstable to withstand the pressure of the fluid column. Citrullination was stopped by the addition of PAD4‐inhibitor Cl‐amidine at 60 μg/ml. The non‐citrullinated fibrinogen used as control contained Cl‐amidine prior to the addition of PAD4. The efficiency of citrullination was evaluated with four independent methods: (1) the shift of the fibrinogen α‐chain relative to the γ‐chain in polyacrylamide gel electrophoresis (Figure S1),21 (2) the increase in the citrulline‐positive protein bands in western blotting with anti‐citrulline antibody (Figure S1), (3) prolongation of the fibrinogen clotting time in electromechanical coagulometry from 15 s to values over 80 s as described previously,25 and (4) delay in turbidimetric clotting assay from 2 min to more than 12 min (Figure S2).
2.3. Scanning electron microscopy
Fibrinogen at 8 μM was incubated with 1.15 μg/ml PAD4 for 4 h. The generated citFg was added to control Fg (containing equivalent amount of PAD4 inactivated with Cl‐amidine) at increasing ratios (0%, 25%, 50%, 75%, and 100% of total fibrinogen) and clotted at 4 μM with 7.5 nM thrombin for 2 h at 37°C. Fixation with glutaraldehyde, dehydration and CO2 critical point drying of samples, imaging with SEM EVO40 (Carl Zeiss GmbH), and image analysis to determine the diameter of the fibrin fibers were carried out as described previously. 30 , 31 Samples were prepared in triplicate and 300 individual fiber diameters were measured in each SEM image. 30 , 31
2.4. Laser scanning microscopy
Fibrinogen at 3.6 μM (citrullinated with 0.4 μg/ml PAD4 for 0/3/4 h) supplemented with 0.05 μM Alexa Fluor® 546‐conjugated fibrinogen was clotted with 16 nM thrombin for 30 min at room temperature in uncoated IBIDI VI 0.4 μ‐slides (Ibidi GmbH). Confocal fluorescent images (Z‐stack mode) were taken using a Zeiss LSM710 confocal LSM (Carl Zeiss) with a 63× oil immersion objective lens at an excitation wavelength of 543 nm and emission wavelength of 575 nm. Images were analyzed based on a protocol modified from Duval et al. 32 Briefly, fiber density was determined as the average number of fibers crossing two parallel horizontal lines spanning the cross section of a single optical section (60 μm from each other). Each fibrin clot was prepared in duplicate and two density measurements were performed in each.
2.5. Atomic force microscopy
Fibrinogen at 3 μM (citrullinated with 0.25 μg/ml PAD4 for 0/3 h) was clotted with 10 nM thrombin in a total volume of 20 μl. Samples were then washed by rinsing the mica with distilled water, then blowing gently with a stream of high‐purity N2 gas. Non‐contact mode (ACmode) AFM images were acquired with a Cipher ES AFM instrument (Asylum Research/Oxford Instruments). Scanning was performed at relatively high set‐point values (0.6–1.0 V in case of 0.75–1.25 V free amplitude, respectively) to avoid sample binding to the cantilever tip. Silicon–nitride cantilevers (AC160TS, Olympus) were used for scanning in air (at 300 kHz resonance frequency). Images (height‐, amplitude‐, and phase contrast at 512 × 512 pixels) were collected at a typical scanning frequency of 0.3–0.6 Hz. Topographical analysis of fibrin fibers was performed with Igor Pro 6.37 (WaveMetrics) by analyzing the cross‐sectional profile of the fibers. Average fiber height was obtained by measuring the distance between height along the fiber axis and background height values. Actual fiber width was calculated from the apparent fiber width, measured as the full width at half maximum on the cross‐sectional profile plot, by correcting for tip geometry. 33 Persistence length of fibers and the Young's modulus were calculated as previously described. 33 Briefly, the end‐to‐end distance and the contour length of the fibers were measured using the freehand tool of the software. The start‐ and endpoints of the fibrin fibers were estimated where the fiber branched or could not be followed further. Persistence length (the measure of bending rigidity) was estimated by analyzing the relationship between the contour length and the end‐to‐end distance using OriginPro 8 (OriginLab Corporation). It is important to note that the studied fibers are part of a complex network; therefore, the length of an individual fibrin fiber cannot be reliably assessed. The persistence length reported here characterizes the free fiber segment between two crossing points. The Young's modulus of the fibers was calculated from the persistence length, using the second moment of inertia assuming circular fiber cross‐section. Because the fibers are not individually equilibrated onto the mica surface, fibers might be pre‐strained over their equilibrium length. 34 This inherent tension of the fibers could affect their apparent persistence length and the calculated Young's modulus. The calculated Young's modulus values reported here serve the purpose to compare the mechanical properties of the citrullinated fibrin sample to that of the control.
2.6. Small‐angle X‐ray scattering
Small‐angle X‐ray scattering provides information about the internal structure of the fibrin fibers. 35 The general experimental set‐up is described in our previous work. 36 Briefly, measurements were performed using CREDO, an established in‐house transmission geometry set‐up. 37 Fibrinogen at 8 μΜ citrullinated by 0/0.6/1.4/2.8 μg/ml PAD4 for 1 h was clotted with 10 nM thrombin in thin‐walled quartz capillaries of 1.5 mm average outer diameter. After proper sealing, these were inserted into the vacuum space of the sample chamber. Measurements were done using monochromatized and collimated Cu Kα radiation (0.1542 nm wavelength), and the scattering pattern was recorded in the range of 0.2–5 nm−1 in terms of the scattering variable (defined as q = [4π sin θ]/λ where 2θ is the scattering angle and λ is the X‐ray wavelength). To assess sample and instrument stability during the experiment, the exposures were made in 5 min units, with frequent sample change and reference measurements. These individual exposures were corrected for beam flux, geometric distortions, sample self‐absorption ,and instrumental background, as well as calibrated into physical units of the scattering variable (q, nm−1) and differential scattering cross‐section (absolute intensity, cm−1 × sr−1). The averages of all the corrected and calibrated scattering patterns for each sample were azimuthally averaged to yield single one‐dimensional scattering curves for each sample. 37 , 38 , 39 , 40 The tangledness of the fibers makes the scattering patterns isotropic. Therefore, their azimuthal averages, known as scattering curves, carry all information, but in a more tractable form.
2.7. Turbidimetric assay
Fibrinogen at 8 μM was incubated with 1.15 μg/ml PAD4 for 4 h. The generated citFg was added to control fibrinogen (containing equivalent amount of PAD4 inactivated with Cl‐amidine) at increasing ratios (0%, 25%, 50%, 75%, and 100% of total fibrinogen) and clotted at 4 μM with 7.5 nM thrombin at 37°C. The progress of clotting was monitored in 96‐well microtiter plates by measuring the light absorbance at 340 nm with a CLARIOstar spectrophotometer (BMG LABTECH). The maximal absorbance at the end of clotting (Amax) was recorded as an indicator of the fibrin structure (mass‐length ratio of the fibrin fibers), 41 whereas the time to reach 10% Amax was used as an indicator of the changes in the kinetics of clotting (delay in polymerization) caused by citrullination Figure S2.
2.8. Clot permeability measurements
Fibrinogen at 8 μM pretreated with 0.6 μg/ml PAD4 for 0/1/1.5 h was clotted with 16 nM thrombin in plastic pipette tips as described previously. 42 After 60 min incubation at 37°C, 10 mM HEPES 150 mM NaCl pH 7.4 was permeated through the clots. Pressure was kept constant by maintaining a fixed head volume. K S (permeability coefficient) was calculated from the equation
where Q = permeated volume of buffer (cm3); η = viscosity of buffer (10−2 poise = 10−7 N s cm−2); L = clot length (1.5 cm); A = average cross‐sectional area of the clot (0.102 cm2); t = time (s); ΔP = pressure drop (0.209 N cm−2). 42
2.9. Statistical analysis
The distribution of fibrin fiber diameter data from SEM was analyzed using the algorithm described previously:30 theoretical distributions were fitted to the empirical data sets and compared using Kuiper's test and Monte Carlo simulation procedures. On other datasets with three or more compared subsets, analysis of variance was performed. For datasets in which normal distribution of obtained data could not be confirmed by the Shapiro–Wilk test, non‐parametric statistical tests were applied. The Kolmogorov–Smirnov test was chosen because of its robust power to compare distributions of two datasets independently of their type of distribution. For the comparison of three or more datasets, the Kruskal–Wallis test was used. All statistical tests were performed using GraphPad Prism 6.00 (GraphPad Software) and the Statistical Toolbox 7.3 of MATLAB. Data are presented as mean ± standard error of mean, except for fibrin fiber diameter measure with standard error mean given as median and bottom‐top quartile values. Differences between groups were considered statistically significant at a probability value of p < .05. During the AFM‐based topographical analysis one outlier was found to be significantly different compared to the other values and was therefore excluded (Grubb's test with GraphPad Software) and the morphological parameters of citrullinated and control fibrin fibers were compared with two‐tailed t‐test assuming equal variances. For persistence length calculations the mean‐squared end‐to‐end length of the fibrin segment versus contour length curve was fitted with the following exponential equation:
where Y is the square of the end‐to‐end distance, x is the contour length, and p is the persistence length. 43 The best fit parameters of the citrullinated and the control curves were statistically compared using least squares nonlinear regression in the contour length range below 7 μm. For the statistical comparison of the Young's moduli of the citrullinated and control fibrin network the error propagation method was applied and calculated using GraphPad Software.
3. RESULTS
3.1. Thinner fibers with lower bending rigidity in citrullinated fibrin matrices
Scanning electron microscopy demonstrated that increase in the ratio of citrullinated/non‐citrullinated fibrinogen led to a decrease in fibrin fiber diameters following thrombin‐induced clotting (Figure 1A). Besides the shift in median diameters, the distribution curves of fibrin fibers became more uniform as indicated by the narrowing interquartile range of the fiber diameter distribution at increasing citrullinated/non‐citrullinated ratios (Figure 1B). The turbidity of the fibrin clots (red symbols in Figure 1B) that reflects the mass–length ratio of the fibers showed the same pattern of changes at increasing ratio of citrullinated fibrinogen as the fiber diameter in the SEM images.
FIGURE 1.
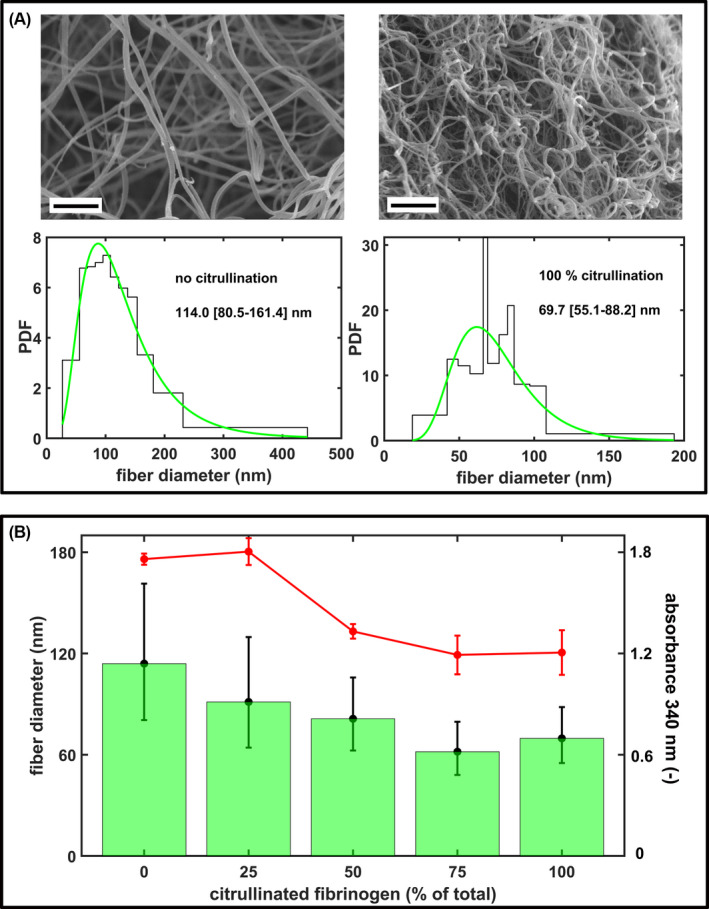
Structural effects of fibrinogen citrullination. A, Representative scanning electron microscropy (SEM) images of fibrin clots prepared from 4 μM fibrinogen pre‐treated with 1.15 μg/ml peptidyl arginine deiminase 4 (PAD4) for 0/4 h (clotted with 15 nM thrombin for 2 h at 37°C). Scale bar = 2 μm. The diameter of 300 fibers per image was measured from three SEM images per clot type using the algorithms described in the Materials and Methods section and their empirical (histogram) and fitted theoretical distribution (green line) are shown (PDF, probability density function of the distribution). Numbers indicate the median (bottom‐top quartile) values of fiber diameter. B, Fibrinogen pre‐treated with 1.15 μg/ml PAD4 for 4 h was mixed with non‐citrullinated fibrinogen (containing the PAD4 at the same concentration, but inactivated with 60 μg/ml Cl‐amidine) at the indicated ratios, clotted with thrombin and SEM images were taken as in (A). The bars show the median values, the whiskers span the interquartile range (bottom and quartile values) of the fitted theoretical distributions. All differences are significant at p < .05 level according to Kuiper's test of the distributions. The red symbols represent the maximal absorbance measured at 340 nm in the turbidimetric clotting assay of the indicated fibrinogen preparations (mean ± standard deviation, one‐way analysis of variance p = .03, n = 5).
While SEM examines the interior of clots, the AFM experimental set‐up more closely mimics the morphology of fibrin surface at interphase boundaries. In this set‐up, the immediate contact of fibrin with the mica surface caused flattening of the cylindrical fibers. AFM observations confirmed that in the presence of citrullinated fibrinogen both mean fiber width and height decreased, but the height/width ratio remained unchanged compared to the native fibrin (Figure 2, Table 1).
FIGURE 2.
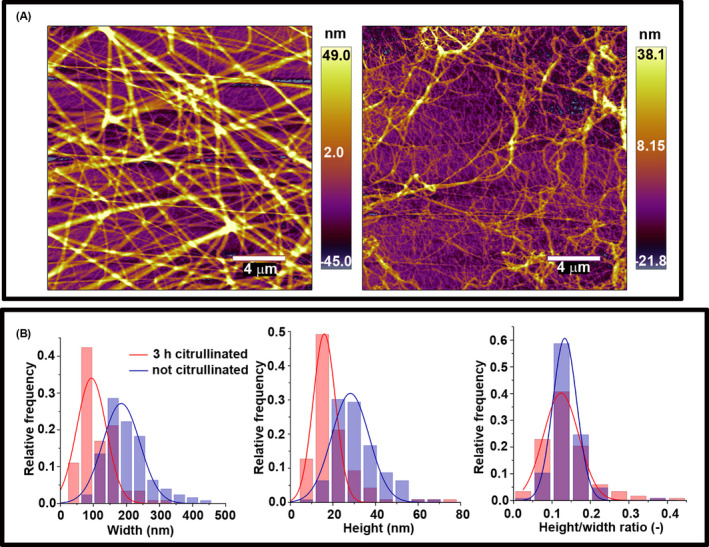
Atomic force microscopy studies of citrullinated fibrinogen. A, Fibrinogen at 3 μM citrullinated with 0.25 μg/ml peptidyl arginine deiminase 4 for 0/3 h; left and right, respectively clotted with 10 nM thrombin in a total volume of 20 μl on a mica surface. Scale bar = 4 μm. B, Topographical analysis of the cross‐sectional profile of the fibrin fibers. Fiber height and width were obtained as described in the Materials and Methods section. Further quantitative data calculated from similar images are presented in Tables 1 and 2.
TABLE 1.
Morphological parameters of fibrin fibers measured by AFM
| Width (nm) | Height (nm) | Height/width ratio (−) | |
|---|---|---|---|
| Th + Native Fg (n = 126) | 200.0 ± 5.8 | 27.0 ± 0.9 | 0.136 ± 0.004 |
| Th + citFg (n = 118) | 116.0 ± 4.8 | 15.8 ± 1.0 | 0.140 ± 0.006 |
| p | <.0001 | <.0001 | .599 |
Note: Topographical analysis was performed on the quasi‐2D fibrin surfaces illustrated in Figure 2. Parameters were calculated as described in the Materials and Methods section.
Abbreviations: AFM, atomic force microscopy; citFg, citrullinated fibrinogen; Th, thrombin.
On the mica surface these thinner fibers appeared generally more curved, and quantification showed a drastic decrease in their apparent persistence length (the measure of bending rigidity) from 122 nm in control to 5 nm. However, fiber‐level elastic attributes of citrullinated fibrin remained essentially unchanged by citrullination; that is, the Young's modulus remained in the same order of magnitude (Table 2).
TABLE 2.
Mechano‐structural data of fibrin fibers estimated from AFM measurements
| Persistence length (nm) | Young modulus (kPa) | |
|---|---|---|
| Th + Native Fg (n = 30) | 121.80 ± 13.29 | 8.43 ± 0.94 |
| Th + citFg (n = 29) | 5.07 ± 0.35 | 3.44 ± 0.25 |
| p | <.0001 | <.0001 |
Note: Topographical analysis was performed on the quasi‐2D fibrin surfaces illustrated in Figure 2 by tracing fibers with the freehand tool along the fiber axis. Parameters were calculated as described in the Materials and Methods section.
Abbreviations: AFM, atomic force microscopy; citFg, citrullinated fibrinogen; Th, thrombin.
3.2. Increased fiber density and decreased porosity in citrullinated fibrin matrices
Laser scanning microscopy has been used for fibrin fiber density measurements in previous studies. 32 According to our LSM observations, citrullination resulted in a fibrin network with increased density (from 44.0 ± 1.9 in control to 52.9 ± 2.9 and 56.4 ± 2.0 per 120 μm in samples preincubated with 0.4 μg/ml PAD4 for 3 and 4 h, respectively; Figure 3). Formation of a finer, but denser, fibrin network was confirmed by an almost 50% decreased turbidity of fibrin clots formed with fibrinogen citrullinated for 8 h at 1.1 μg/ml PAD (not shown), as well as with a mix of citrullinated and native fibrinogen (Figure 1B). Permeability measurements demonstrated that the increase in fiber density was accompanied by lower permeability (more than 3‐fold decrease in the Ks of fibrin clots formed with fibrinogen pre‐treated with 0.6 μg/ml PAD4 for 4 h; Figure 4).
FIGURE 3.
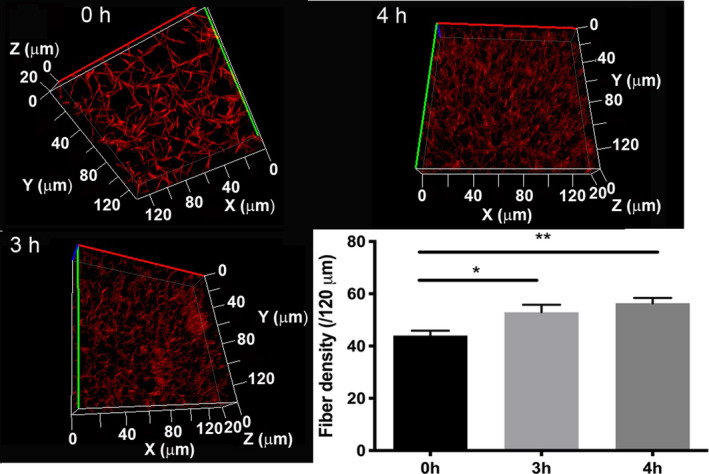
Fibrin fiber density. Fibrinogen at 3.6 μM (citrullinated with 0.4 μg/ml peptidyl arginine deiminase 4 for the indicated times) was clotted with 16 nM thrombin in the presence of 0.05 μM Alexa Fluor® 546‐conjugated fibrinogen. Images were taken after 30 min incubation at room temperature. Optical z‐stacks (every 1 μm over 20 μm) were combined to construct 3D images. Fiber density was determined by counting the number of fibers crossing 120 μm long sections of 2D‐projected laser scanning microscopy images. Error bars represent standard error of the mean. Each clot was prepared in duplicate, and two density measurements were performed in each (n = 4). *p < .05, **p < .01.
FIGURE 4.
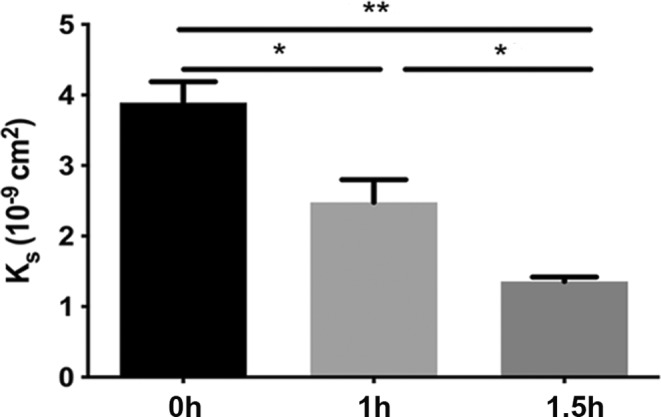
Fibrin permeability. Permeability of clots prepared from fibrinogen at 8 μM pretreated with 0.6 μg/ml peptidyl arginine deiminase 4 for the indicated times and clotted with 16 nM thrombin. The permeability coefficient (K S) was calculated as described in the Materials and Methods section. K S values and standard error of mean were calculated from at least eight samples originating from three independent experiments. *p < .01, **p < .0001.
3.3. Fiber packing, intrinsic fiber characteristics
The LSM observations that fibrinogen citrullination increased the fiber density and convolution of the fibrin fibers formed from it was strengthened by SAXS analysis. Citrullination induced significant nanostructural changes in the fibrin fibers, observable both in the alteration of the correlation peaks and the mass fractal dimension of the SAXS curves shown in Figure 5. The fibrin prepared from partly citrullinated fibrinogen resulted in the well‐known SAXS curve reflecting the cross‐sectional and longitudinal periodicity in the native fibrin fibers. 31 On the decreasing initial part of the scattering curve, two diffuse peaks were visible at around q = .32 and 0.9 nm−1, the central positions of which correspond to the 22 nm longitudinal periodicity and 7 nm lateral periodicity of the fibrin nanostructure, respectively. The first one is approximately the half‐length of fibrin monomer unit, while the second one corresponds to the characteristic distance between the neighboring units packed in parallel. Mild citrullination (using PAD4 at 0.6–1.4 μg/ml for 1 h) only weakly affected the scattering curve by broadening these diffuse peaks. More extensive citrullination (increasing the concentration of PAD4 to 2.8 μg/ml and the exposure time to 2 h) eliminated the correlation peaks and the curve adopted a linear shape (in the double logarithmic plot shown in Figure 5). This scattering pattern indicated definitive nanostructural changes in the citrullinated fibrin matrix suggesting a conserved intrafibrillar monomer assembly up to a critical degree of citrullination, at which point displacement in both dimensions of the fiber structure occurred. 35
FIGURE 5.
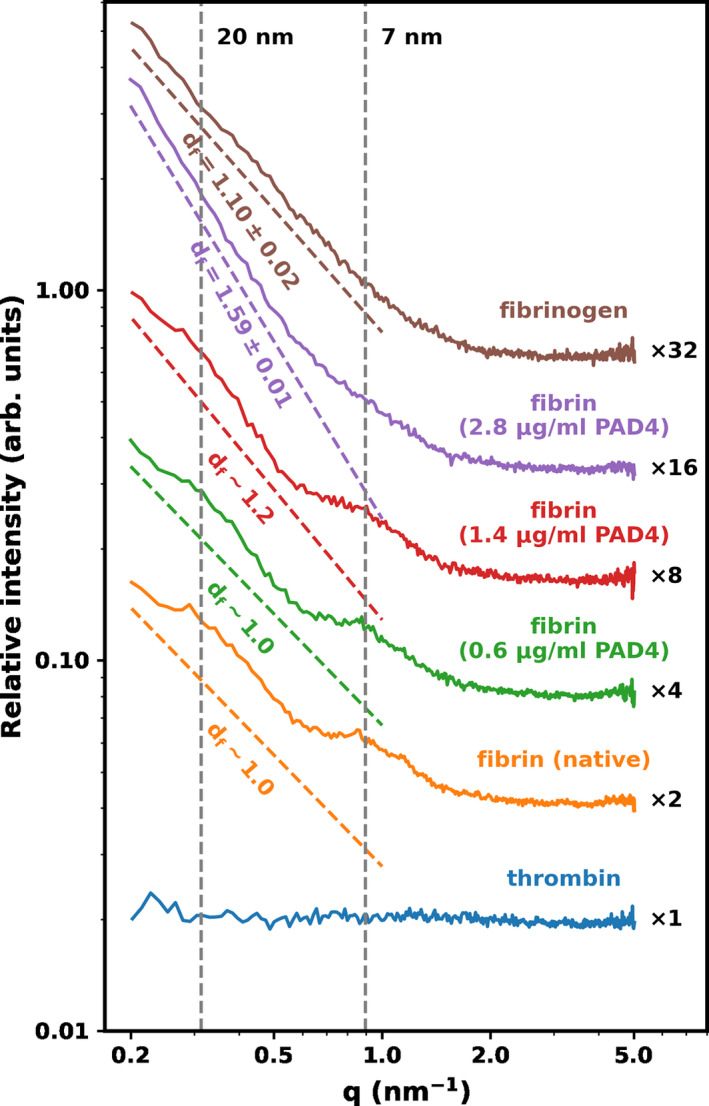
Effect of citrullination on the subfibrillar structure of fibrin. Fibrin clots were formed with fibrinogen pre‐treated with 8 μΜ citrullinated by 0/0.6/1.4/2.8 μg/ml peptidyl arginine deiminase 4 for 1 h and clotted with 10 nM thrombin and examined with small‐angle X‐ray scattering as described in the Materials and Methods section. Fibrinogen and thrombin solutions were used as a reference. The normalized scattering intensity (d∑/d) is plotted as a function of the momentum transfer (q) and empirical curves are fitted to the raw data, as described in the Materials and Methods section. The slope of the dashed color lines indicates the approximated mass fractal dimension of the fibers (d f, best fit of the slope and its uncertainty). For the scattering curves with a diffuse peak at q = .32 lines are fitted to the flanking regions of the peak and approximate d f values are shown. Curves are shifted vertically by the indicated factors for better visualization. The vertical dashed lines indicate the positions of the scattering peaks corresponding to periodicity of ∼7 nm, and 20 nm. The scattering curve of thrombin is also presented to demonstrate the negligibility of the scattering contribution of this component.
Previous studies, applying different techniques, have revealed that the fibrin fiber system exhibits fractal behavior implying that the mass distribution across a fiber cross‐section is not uniform (the mass density of the periphery is lower than in the center of the fiber). 44 , 45 , 46 In our SAXS analysis, the slope derived from the power‐law decay in the q range between 0.1 and 1 nm−1 could be exactly determined in the absence of correlation peaks in the scattering curves of the fully citrullinated fibrin (d f = 1.59 ± 0.01, Figure 5). The presence of the two diffuse correlation peaks in partly citrullinated fibrin (0.6/1.4 μg/ml PAD4 for 1 h) hamper the exact determination of fractal dimension; therefore, in these cases we used approximating lines (Figure 5), the slopes of which showed an ascending trend (from ~1 for native fibrin to ~1.2). In view of the smaller diameter of the fibers in citrullinated fibrin, this increase in the mass fractal from 1 to 1.59 can be interpreted as due to the loss of loosely packed outer shell protofibrils and retention of the denser core of individual fibers, when more citrullinated fibrinogen is incorporated in the clot.
4. DISCUSSION
Mounting evidence points to the clinical prognostic value of clot structure. 47 Denser fibrin networks are associated with early myocardial infarction 48 as well as with increased mortality in patients on hemodialysis. 49 DVT patients have decreased plasma clot permeability compared to controls without a DVT history, and densely packed fibrin fibers have been detected in distal pulmonary emboli. 50 , 51 Clot structure, however, depends on a multitude of factors, including the concentration of thrombin and fibrinogen. 52 In our system the formation of citFg reduces the concentration of thrombin‐sensitive fibrinogen, because thrombin cleaves next to native peptidyl–arginine only. 27 The net effects of these (and possibly other) factors might have contributed to the decreased median fiber diameter in clots containing citFg, which is in alignment with a preliminary study on citFg with SEM investigations. 28 Here we confirm the SEM findings with an independent method that examines fibrin structure in a surface‐bound and naturally hydrated state (AFM) and add structural insights on the level of individual fibers. SAXS indicated that the decrease in fiber thickness did not result from a change in intra‐fiber protofibril density, as the mass fractional dimension consistently increased in clots containing increasing concentrations of citFg, a finding consistent with the loss of a looser peripheral zone in the cross‐section of native fibers. The measured fiber‐level biomechanical parameters are in line with this finding: the apparent Young's modulus of citrullinated fibrin, which we assessed from the persistence length of individual fibers, remained in the same order of magnitude as that of control fibrin. This suggests that the decreased stiffness of citrullinated fibrin shown previously (evidenced by a decreased elastic modulus [G']) 25 was primarily a consequence of a thinner fiber structure and not of a change in the mechanical properties of individual fibrin protofibrils. Generally, formation of thinner fibrin fibers leads to a decrease in porosity of fibrin, 50 which is in line with decreased Ks values observed in permeability measurements and the more compact space‐filling pattern of the clots supported by increased fiber density in LSM, increased mass fractal dimension in SAXS, and shortened persistence length in AFM.
The identified structural changes might provide insights into earlier results concerning the altered mechanical and lytic susceptibility properties of citrullinated clots. We have recently reported that clots formed with citFg are mechanically less stable as revealed by the decrease in the critical shear stress causing gel/fluid transition (rheometry) and a trend for lower maximal amplitude in nano‐thromboelastography. 25 These are in agreement with previous studies that showed that thinner fibrin fiber networks were associated with decreased G' 53 , 54 and an increase in the loss tangent (G"/G') in the presence of calcium. 54 The decreased persistence length identified in our current study could contribute to a decreased macroscopic viscoelasticity (increased G"/G'), as the convoluted fibers of citrullinated fibrin that bear lower bending rigidity according to the decreased persistence length allow for a relatively higher energy loss than energy storage upon deformation.
While we and others have previously demonstrated the marked effects of DNA, histones, and NETs on clot lysis, 31 , 42 our current findings point to another potential mechanism through which neutrophils might influence clot lysibility through structural alterations, namely, generation of citFg via PAD enzymes released from (or present on the surface of) neutrophils. In pure fibrin clots, thinner fibers and lower porosity typically result in slower fibrinolysis, even though mathematical modeling of this system has shown more complexity. 55 This phenomenon is traditionally explained by the different ratios of two processes, namely, inter‐fiber diffusion of plasmin (slower) versus cutting across individual fibers (faster), in dense versus coarse fibrin. 56 Thus, the current findings that citrullination of fibrinogen results in fibrin with thinner fibers and decreased porosity adds a structural mechanism contributing to the lysis resistance of such fibrin reported by us previously, 25 with implications for thrombolytic efficacy. Nevertheless, important caveats should be articulated.
First, it remains to be shown which peptidylarginineºcitrulline conversions are critical in the detected effects, and if fibrinogen citrullinated by PAD4 (as in this and previous studies) has the same effect as forms arising from PAD2‐ or even pathogen‐derived PAD‐dependent citrullination. 21 , 57 A recent study found more prominent effects on fibrin clot turbidity using PAD2 versus PAD4, 28 probably related to the known differences in the susceptibility of the citrullination sites in fibrinogen to the two deiminases. 21
Second, in vivo, a range of other plasma proteins might become citrullinated when PADs are released into the forming clot, as highlighted by a rheumatoid arthritis citrullinome analysis and the recent discovery of A Disintegrin And Metalloprotease with ThroboSpondin‐13 citrullination. 58 , 59 , 60 Nevertheless, given that fibrinogen is the precursor of the primary scaffold, and that it is present in the micromolar concentration range, outweighing several other potential PAD substrates in plasma, its citrullination might be of central importance with regard to the properties of the formed thrombus.
Last, our findings warrant further studies to investigate citFg in human samples as neutrophils and NETs are abundant in arterial and venous thrombi alike. In this respect, at present only indirect data suggest the in vivo relevance of the conditions applied in our current in vitro study, as quantitative data on the local PAD4 activity at sites of NETosis are still not available. In certain disease states (sepsis, cancer) PAD4 concentrations of about 5 ng/ml have been reported in systemic blood circulation. 61 , 62 The local PAD4 concentration at sites of neutrophil activation could be estimated from the data about neutrophil elastase, another NET component that has been more extensively studied in the past. The mean concentration of elastase in the azurophil granules of neutrophils is 160 mg/ml, which upon degranulation maintain 0.1 mg/ml active enzyme concentration in a pericellular zone of 5 μm radius and 0.2 mg/ml within 3 μm around the cells, 63 whereas its level in blood circulation is about 0.2 μg/ml. 64 If we assume the same dilution and clearance pattern for PAD4 as neutrophil elastase, the estimated pericellular concentration of PAD4 that corresponds to the reported blood levels would be 2.5–5 μg/ml, which is higher than the concentrations used by us in the current study.
Our in vitro results likely have implications beyond thrombosis only. CitFg has been detected previously alongside PAD4 in a murine model of wound healing 65 as well as in human atherosclerotic plaques, the rupture of which often trigger thrombosis. CitFg is found in the synovia and serum of patients with rheumatoid arthritis, 21 , 22 , 23 and recent studies suggest a role for citFg in the long‐known elevated risk for cardiovascular disease in this condition. 66 , 67 Furthermore, PAD4‐catalyzed citFg formation might attract attention from a therapeutic perspective. Even though the exact role of PAD4 in NETosis is still debated, 68 inhibition of PAD4 has shown promising in vitro results in inhibiting NET formation 69 and, in a previous study using the inferior vena cava stenosis model, genetic knockout of PAD4 decreased the likelihood of thrombosis. 70 However, therapeutic inhibition of PAD in the circulation would not only silence NETosis but also likely affect the amount of citrullinated plasma proteins such as fibrinogen. With specific regard to thrombosis, it is tempting to visualize cell‐impermeable PAD inhibitors that hinder the formation of the antifibrinolytic citFg, but avoid the hazards of histone modification leading to altered gene expression. Future studies will decide if this vision becomes reality.
AUTHOR CONTRIBUTIONS
Contribution: I. Varjú, E. Tóth, A.Z. Farkas, V.J. Farkas, E. Komorowicz, T. Feller, B. Kiss, A. Wacha, and L. Szabo performed experiments; I. Varjú, K. Kolev, B. Kiss, T. Feller, A. Wacha, and A. Bóta analyzed results; K. Kolev, I. Varjú, C. Longstaff, A. Bóta, and M. Z. Kellermayer designed the research; I. Varjú and K. Kolev wrote the paper. All authors revised the manuscript critically and gave final approval of the submitted manuscript.
CONFLICT OF INTEREST
The authors declare no competing financial interests.
Supporting information
Figures S1–S2
ACKNOWLEDGMENTS
This work was supported by the Hungarian National Research, Development and Innovation Office (NKFIH) #137563 to K.K., #PD124451 to A.W., #K131657 A.B., and #K135360 to M.K.; Thematic Institutional Excellence funding scheme of the Ministry of Innovation and Technology in Hungary for the Molecular Biology thematic programme of Semmelweis University (TKP2021‐EGA‐24) to K.K.; and the Excellence Program BIONANO_GINOP‐2.3.2‐15‐2016‐00017 to A.B. I.V. was supported by postdoctoral fellowships from the Hungarian Academy of Sciences, the Fulbright Commission, as well as the Tempus Public Foundation, and a scholarship by the Rosztoczy Foundation. A.Z.F. and V.J.F. received EFOP scholarship (EFOP‐3.6.3‐VEKOP‐16‐2017‐00009). The authors are grateful to Györgyi Oravecz and Krisztián Bálint for excellent technical assistance.
Varjú I, Tóth E, Farkas ÁZ, et al. Citrullinated fibrinogen forms densely packed clots with decreased permeability. J Thromb Haemost. 2022;20:2862‐2872. doi: 10.1111/jth.15875
Manuscript handled by: Ton Lisman
Final decision: Ton Lisman, 07 September 2022
REFERENCES
- 1. WHO . World Health Statistics Full report 2021. Accessed April 15, 2022 https://www.who.int/data/gho/publications/world‐health‐statistics
- 2. Ariëns RA. Fibrin(ogen) and thrombotic disease. J Thromb Haemost. 2013;11(Suppl 1):294‐305. [DOI] [PubMed] [Google Scholar]
- 3. Longstaff C, Kolev K. Basic mechanisms and regulation of fibrinolysis. J Thromb Haemost. 2015;13(Suppl 1):S98‐S105. [DOI] [PubMed] [Google Scholar]
- 4. Martinez MR, Cuker A, Mills AM, et al. Enhanced lysis and accelerated establishment of viscoelastic properties of fibrin clots are associated with pulmonary embolism. Am J Physiol Lung Cell Mol Physiol. 2014;306:L397‐L404. [DOI] [PMC free article] [PubMed] [Google Scholar]
- 5. Lee JS, Moon T, Kim TH, et al. Deep vein thrombosis in patients with pulmonary embolism: prevalence, clinical significance and outcome. Vasc Specialist Int. 2016;32:166‐174. [DOI] [PMC free article] [PubMed] [Google Scholar]
- 6. Nielsen JD. The incidence of pulmonary embolism during deep vein thrombosis. Phlebology. 2013;28(Suppl 1):29‐33. [DOI] [PubMed] [Google Scholar]
- 7. Goldhaber SZ, Meyerovitz MF, Green D, et al. Randomized controlled trial of tissue plasminogen activator in proximal deep venous thrombosis. Am J Med. 1990;88:235‐240. [DOI] [PubMed] [Google Scholar]
- 8. Turpie AG, Levine MN, Hirsh J, et al. Tissue plasminogen activator (rt‐PA) vs heparin in deep vein thrombosis results of a randomized trial. Chest. 1990;97:172s‐175s. [PubMed] [Google Scholar]
- 9. Watson L, Broderick C, Armon MP. Thrombolysis for acute deep vein thrombosis. Cochrane Database Syst Rev. 2014;11(11):CD002783. [DOI] [PubMed] [Google Scholar]
- 10. Diniz J, Coelho A, Mansilha A. Endovascular treatment of iliofemoral deep venous thrombosis: is there enough evidence to support it? A systematic review with meta‐analysis. Int Angiol. 2020;39:93‐104. [DOI] [PubMed] [Google Scholar]
- 11. Litvinov RI, Nabiullina RM, Zubairova LD, Shakurova MA, Andrianova IA, Weisel JW. Lytic susceptibility, structure, and mechanical properties of fibrin in systemic lupus erythematosus. Front Immunol. 2019;10:1626. [DOI] [PMC free article] [PubMed] [Google Scholar]
- 12. Binder V, Bergum B, Jaisson S, et al. Impact of fibrinogen carbamylation on fibrin clot formation and stability. Thromb Haemost. 2017;117:899‐910. [DOI] [PMC free article] [PubMed] [Google Scholar]
- 13. Hood JE, Yesudasan S, Averett RD. Glucose concentration affects fibrin clot structure and morphology as evidenced by fluorescence imaging and molecular simulations. Clin Appl Thromb Hemost. 2018;24(9_suppl):104‐116. [DOI] [PMC free article] [PubMed] [Google Scholar]
- 14. György B, Tóth E, Tarcsa E, Falus A, Buzás EI. Citrullination: a posttranslational modification in health and disease. Int J Biochem Cell Biol. 2006;38:1662‐1677. [DOI] [PubMed] [Google Scholar]
- 15. Brinkmann V, Reichard U, Goosmann C, et al. Neutrophil extracellular traps kill bacteria. Science. 2004;303:1532‐1535. [DOI] [PubMed] [Google Scholar]
- 16. Oklu R, Albadawi H, Watkins MT, Monestier M, Sillesen M, Wicky S. Detection of extracellular genomic DNA scaffold in human thrombus: implications for the use of deoxyribonuclease enzymes in thrombolysis. J Vasc Interv Radiol. 2012;23:712‐718. [DOI] [PubMed] [Google Scholar]
- 17. Savchenko AS, Martinod K, Seidman MA, et al. Neutrophil extracellular traps form predominantly during the organizing stage of human venous thromboembolism development. J Thromb Haemost. 2014;12:860‐780. [DOI] [PMC free article] [PubMed] [Google Scholar]
- 18. Farkas ÁZ, Farkas VJ, Gubucz I, et al. Neutrophil extracellular traps in thrombi retrieved during interventional treatment of ischemic arterial diseases. Thromb Res. 2019;175:46‐52. [DOI] [PubMed] [Google Scholar]
- 19. Tóth E, Beinrohr L, Gubucz I, et al. Fibrin to von Willebrand factor ratio in arterial thrombi is associated with plasma levels of inflammatory biomarkers and local abundance of extracellular DNA. Thromb Res. 2022;209:8‐15. [DOI] [PubMed] [Google Scholar]
- 20. Spengler J, Lugonja B, Ytterberg AJ, et al. Release of active peptidyl arginine deiminases by neutrophils can explain production of extracellular citrullinated autoantigens in rheumatoid arthritis synovial fluid. Arthritis Rheumatol. 2015;67:3135‐3145. [DOI] [PMC free article] [PubMed] [Google Scholar]
- 21. Nakayama‐Hamada M, Suzuki A, Kubota K, et al. Comparison of enzymatic properties between hPADI2 and hPADI4. Biochem Biophys Res Commun. 2005;327:192‐200. [DOI] [PubMed] [Google Scholar]
- 22. Masson‐Bessière C, Sebbag M, Girbal‐Neuhauser E, et al. The major synovial targets of the rheumatoid arthritis‐specific antifilaggrin autoantibodies are deiminated forms of the alpha‐and beta‐chains of fibrin. J Immunol. 2001;166:4177‐4184. [DOI] [PubMed] [Google Scholar]
- 23. Sokolove J, Brennan MJ, Sharpe O, et al. Brief report: citrullination within the atherosclerotic plaque: a potential target for the anti‐citrullinated protein antibody response in rheumatoid arthritis. Arthritis Rheum. 2013;65:1719‐1724. [DOI] [PMC free article] [PubMed] [Google Scholar]
- 24. Sharma M, Damgaard D, Senolt L, et al. Expanding the citrullinome of synovial fibrinogen from rheumatoid arthritis patients. J Proteomics. 2019;208:103484. [DOI] [PubMed] [Google Scholar]
- 25. Varjú I, Sorvillo N, Cherpokova D, et al. Citrullinated fibrinogen renders clots mechanically less stable, but lysis‐resistant. Circ Res. 2021;129:342‐344. [DOI] [PMC free article] [PubMed] [Google Scholar]
- 26. Nakayama‐Hamada M, Suzuki A, Furukawa H, Yamada R, Yamamoto K. Citrullinated fibrinogen inhibits thrombin‐catalysed fibrin polymerization. J Biochem. 2008;144:393‐398. [DOI] [PubMed] [Google Scholar]
- 27. Okumura N, Haneishi A, Terasawa F. Citrullinated fibrinogen shows defects in FPA and FPB release and fibrin polymerization catalyzed by thrombin. Clin Chim Acta. 2009;401:119‐123. [DOI] [PubMed] [Google Scholar]
- 28. Damiana T, Damgaard D, Sidelmann JJ, et al. Citrullination of fibrinogen by peptidylarginine deiminase 2 impairs fibrin clot structure. Clin Chim Acta. 2020;501:6‐11. [DOI] [PubMed] [Google Scholar]
- 29. Lundblad RL, Kingdon HS, Mann KG. Thrombin. Meth Enzymol. 1976;45:156‐176. [DOI] [PubMed] [Google Scholar]
- 30. Longstaff C, Thelwell C, Williams SC, Silva MM, Szabó L, Kolev K. The interplay between tissue plasminogen activator domains and fibrin structures in the regulation of fibrinolysis: kinetic and microscopic studies. Blood. 2011;117:661‐668. [DOI] [PMC free article] [PubMed] [Google Scholar]
- 31. Longstaff C, Varjú I, Sótonyi P, et al. Mechanical stability and fibrinolytic resistance of clots containing fibrin, DNA, and histones. J Biol Chem. 2013;288:6946‐6956. [DOI] [PMC free article] [PubMed] [Google Scholar]
- 32. Duval C, Allan P, Connell SD, Ridger VC, Philippou H, Ariëns RA. Roles of fibrin α‐ and γ‐chain specific cross‐linking by FXIIIa in fibrin structure and function. Thromb Haemost. 2014;111:842‐850. [DOI] [PubMed] [Google Scholar]
- 33. Kiss B, Röhlich P, Kellermayer MS. Structure and elasticity of desmin protofibrils explored with scanning force microscopy. J Mol Recognit. 2011;24:1095‐1104. [DOI] [PubMed] [Google Scholar]
- 34. Cone SJ, Fuquay AT, Litofsky JM, Dement TC, Carolan CA, Hudson NE. Inherent fibrin fiber tension propels mechanisms of network clearance during fibrinolysis. Acta Biomater. 2020;107:164‐177. [DOI] [PMC free article] [PubMed] [Google Scholar]
- 35. Yeromonahos C, Polack B, Caton F. Nanostructure of the fibrin clot. Biophys J. 2010;99:2018‐2027. [DOI] [PMC free article] [PubMed] [Google Scholar]
- 36. Wacha A, Varga Z, Bóta A. CREDO: a new general‐purpose laboratory instrument for small‐angle X‐ray scattering. J Appl Cryst. 2014;47:1749‐1754. [Google Scholar]
- 37. Wacha A. Optimized pinhole geometry for small‐angle scattering. J Appl Cryst. 2015;48:1843‐1848. [Google Scholar]
- 38. Glatter O, Kratky O. Small Angle x‐Ray Scattering. Academic Press; 1982. [DOI] [PubMed] [Google Scholar]
- 39. Feigin LA, Svergun DI. Structure Analysis by Small‐Angle X‐Ray and Neutron Scattering. Plenum Press; 1987. [Google Scholar]
- 40. Guinier A, Fournet G. Small‐Angle Scattering of X‐Rays. John Wiley & Sons Inc.; 1955. [Google Scholar]
- 41. Carr ME, Gabriel DA. The effect of dextran 70 on the structure of plasma‐derived fibrin gels. J Lab Clin Med. 1980;96:985‐993. [PubMed] [Google Scholar]
- 42. Varjú I, Longstaff C, Szabó L, et al. DNA, histones and neutrophil extracellular traps exert anti‐fibrinolytic effects in a plasma environment. Thromb Haemost. 2015;113:1289‐1298. [DOI] [PubMed] [Google Scholar]
- 43. Rivetti C, Guthold M, Bustamante C. Scanning force microscopy of DNA deposited onto mica: equilibration versus kinetic trapping studied by statistical polymer chain analysis. J Mol Biol. 1996;264:919‐932. [DOI] [PubMed] [Google Scholar]
- 44. Guthold M, Liu W, Stephens B, et al. Visualization and mechanical manipulations of individual fibrin fibers suggest that fiber cross section has fractal dimension 1.3. Biophys J. 2004;87:4226‐4236. [DOI] [PMC free article] [PubMed] [Google Scholar]
- 45. Weigandt KM, Pozzo DC, Lionel P. Structure of high density fibrin networks probed with neutron scattering and rheology. Soft Matter. 2009;5:4321‐4330. [Google Scholar]
- 46. Sabra A, Lawrence MJ, Curtis D, Hawkins K, Williams PR, Evans PA. In vitro clot model to evaluate fibrin‐thrombin effects on fractal dimension of incipient blood clot. Clin Hemorheol Microcirc. 2020;74:147‐153. [DOI] [PubMed] [Google Scholar]
- 47. Weisel JW, Litvinov RI. Mechanisms of fibrin polymerization and clinical implications. Blood. 2013;121:1712‐1719. [DOI] [PMC free article] [PubMed] [Google Scholar]
- 48. Fatah K, Silveira A, Tornvall P, Karpe F, Blombäck M, Hamsten A. Proneness to formation of tight and rigid fibrin gel structures in men with myocardial infarction at a young age. Thromb Haemost. 1996;76:535‐540. [PubMed] [Google Scholar]
- 49. Schuett K, Savvaidis A, Maxeiner S, et al. Clot structure: a potent mortality risk factor in patients on hemodialysis. J Am Soc Nephrol. 2017;28:1622‐1630. [DOI] [PMC free article] [PubMed] [Google Scholar]
- 50. Undas A. Prothrombotic fibrin clot phenotype in patients with deep vein thrombosis and pulmonary embolism: a new risk factor for recurrence. Biomed Res Int. 2017;2017:8196256‐8196259. [DOI] [PMC free article] [PubMed] [Google Scholar]
- 51. Mazur P, Sobczyński R, Ząbczyk M, Babiarczyk P, Sadowski J, Undas A. Architecture of fibrin network inside thrombotic material obtained from the right atrium and pulmonary arteries: flow and location matter. J Thromb Thrombolysis. 2013;35:127‐129. [DOI] [PMC free article] [PubMed] [Google Scholar]
- 52. Undas A, Ariëns RA. Fibrin clot structure and function: a role in the pathophysiology of arterial and venous thromboembolic diseases. Arterioscler Thromb Vasc Biol. 2011;31:e88‐e99. [DOI] [PubMed] [Google Scholar]
- 53. Ryan EA, Mockros LF, Weisel JW, Lorand L. Structural origins of fibrin clot rheology. Biophys J. 1999;77:2813‐2826. [DOI] [PMC free article] [PubMed] [Google Scholar]
- 54. Domingues MM, Macrae FL, Duval C, et al. Thrombin and fibrinogen γ' impact clot structure by marked effects on intrafibrillar structure and protofibril packing. Blood. 2016;127:487‐495. [DOI] [PubMed] [Google Scholar]
- 55. Bannish BE, Keener JP, Fogelson AL. Modelling fibrinolysis: a 3D stochastic multiscale model. Math Med Biol. 2014;31:17‐44. [DOI] [PMC free article] [PubMed] [Google Scholar]
- 56. Weisel JW, Veklich Y, Collet JP, Francis CW. Structural studies of fibrinolysis by electron and light microscopy. Thromb Haemost. 1999;82:277‐282. [PubMed] [Google Scholar]
- 57. Wegner N, Wait R, Sroka A, et al. Peptidylarginine deiminase from Porphyromonas gingivalis citrullinates human fibrinogen and α‐enolase: implications for autoimmunity in rheumatoid arthritis. Arthritis Rheum. 2010;62:2662‐2672. [DOI] [PMC free article] [PubMed] [Google Scholar]
- 58. Tilvawala R, Nguyen SH, Maurais AJ, et al. The rheumatoid arthritis‐associated Citrullinome. Cell Chem Biol. 2018;25:691‐704.e6. [DOI] [PMC free article] [PubMed] [Google Scholar]
- 59. Sorvillo N, Mizurini DM, Coxon C, et al. Plasma Peptidylarginine deiminase IV promotes VWF‐platelet string formation and accelerates thrombosis after vessel injury. Circ Res. 2019;125(5):507‐519. [DOI] [PMC free article] [PubMed] [Google Scholar]
- 60. Varjú I, Kolev K. Networks that stop the flow: a fresh look at fibrin and neutrophil extracellular traps. Thromb Res. 2019;182:1‐11. [DOI] [PubMed] [Google Scholar]
- 61. Costa NA, Gut AL, Azevedo PS, et al. Peptidylarginine deiminase 4 concentration, but not PADI4 polymorphisms, is associated with ICU mortality in septic shock patients. J Cell Mol Med. 2018;22:4732‐4737. [DOI] [PMC free article] [PubMed] [Google Scholar]
- 62. Chang X, Han J, Pang L, Zhao Y, Yang Y, Shen Z. Increased PADI4 expression in blood and tissues of patients with malignant tumors. BMC Cancer. 2009;9:40. [DOI] [PMC free article] [PubMed] [Google Scholar]
- 63. Liou TG, Campbell EJ. Nonisotropic enzyme‐inhibitor interactions: a novel nonoxidative mechanism for quantum proteolysis by human neutrophils. Biochemistry. 1995;34:16171‐16177. [DOI] [PubMed] [Google Scholar]
- 64. Nagamatsu Y, Yamamoto J, Fukuda A, Ohta M, Tsuda Y, Okada Y. Determination of leukocyte elastase concentration in plasma and serum by a simple method using a specific synthetic substrate. Haemostasis. 1991;21:338‐345. [DOI] [PubMed] [Google Scholar]
- 65. Coudane F, Mechin MC, Huchenq A, et al. Deimination and expression of peptidylarginine deiminases during cutaneous wound healing in mice. Eur J Dermatol. 2011;21:376‐384. [DOI] [PubMed] [Google Scholar]
- 66. Bezuidenhout JA, Venter C, Roberts TJ, Tarr G, Kell DB, Pretorius E. Detection of citrullinated fibrin in plasma clots of rheumatoid arthritis patients and its relation to altered structural clot properties, disease‐related inflammation and prothrombotic tendency. Front Immunol. 2020;11:577523. [DOI] [PMC free article] [PubMed] [Google Scholar]
- 67. Wiseman SJ, Ralston SH, Wardlaw JM. Cerebrovascular disease in rheumatic diseases: a systematic review and meta‐analysis. Stroke. 2016;47:943‐950. [DOI] [PubMed] [Google Scholar]
- 68. Konig MF, Andrade F. A critical reappraisal of neutrophil extracellular traps and NETosis mimics based on differential requirements for protein citrullination. Front Immunol. 2016;7:461. [DOI] [PMC free article] [PubMed] [Google Scholar]
- 69. Lewis HD, Liddle J, Coote JE, et al. Inhibition of PAD4 activity is sufficient to disrupt mouse and human NET formation. Nat Chem Biol. 2015;11:189‐191. [DOI] [PMC free article] [PubMed] [Google Scholar]
- 70. Martinod K, Demers M, Fuchs TA, et al. Neutrophil histone modification by peptidylarginine deiminase 4 is critical for deep vein thrombosis in mice. Proc Natl Acad Sci U S A. 2013;110:8674‐8679. [DOI] [PMC free article] [PubMed] [Google Scholar]
Associated Data
This section collects any data citations, data availability statements, or supplementary materials included in this article.
Supplementary Materials
Figures S1–S2