

Abstract
Premise
Genetic variation influences the potential for evolution to rescue populations from impacts of environmental change. Most studies of genetic variation in fitness‐related traits focus on either vegetative or floral traits, with few on floral scent. How vegetative and floral traits compare in potential for adaptive evolution is poorly understood.
Methods
We measured variation across source populations, planting sites, and genetic families for vegetative and floral traits in a hybrid zone. Seeds from families of Ipomopsis aggregata, I. tenuituba, and F1 and F2 hybrids of the two species were planted into three common gardens. Measured traits included specific leaf area (SLA), trichomes, water‐use efficiency (WUE), floral morphology, petal color, nectar, and floral volatiles.
Results
Vegetative traits SLA and WUE varied greatly among planting sites, while showing weak or no genetic variation among source populations. Specific leaf area and trichomes responded plastically to snowmelt date, and SLA exhibited within‐population genetic variation. All aspects of floral morphology varied genetically among source populations, and corolla length, corolla width, and sepal width varied genetically within populations. Heritability was not detected for volatiles due to high environmental variation, although one terpene had high evolvability, and high emission of two terpenes, a class of compounds emitted more strongly from the calyx than the corolla, correlated genetically with sepal width. Environmental variation across sites was weak for floral morphology and stronger for volatiles and vegetative traits. The inheritance of three of four volatiles departed from additive.
Conclusions
Results indicate stronger genetic potential for evolutionary responses to selection in floral morphology compared with scent and vegetative traits and suggest potentially adaptive plasticity in some vegetative traits.
Keywords: common garden, floral morphology, floral scent, genetic variation, genotype by environment interaction, heritability, Polemoniaceae, specific leaf area, water‐use efficiency
Many plant species and populations are threatened by rapid global change (Thomas et al., 2004; Malcolm et al., 2006). The chance that a particular population will go extinct in response to environmental change can be influenced by evolution at two spatial levels. First, the new environmental conditions may alter natural selection in that local population, and if the evolutionary response to that selection is rapid enough, the accompanying increase in absolute fitness may outpace the negative impact of the environment on population growth (Gomulkiewicz and Holt, 1995; Gomulkiewicz and Shaw, 2013). The evolutionary response itself will depend on both within‐population heritability and the strength of the new phenotypic selection (Lande and Arnold, 1983). Phenotypic plasticity in the local population may also aid in population persistence if the phenotypic changes increase fitness and are thus adaptive (Chevin and Lande, 2010). Second, genetic variation across populations can aid in persistence if alleles that are adaptive under the new environmental conditions enter the population through gene flow (Bell and Gonzalez, 2011). To predict the potential for evolution to rescue populations, we thus need to understand genetic variation of fitness‐related traits both within and among populations.
Fitness‐related traits can be expressed during different parts of the life history. Yet, in plants, studies of genetic variation in quantitative traits typically focus only on traits expressed in vegetative parts such as leaves (reviewed by Geber and Griffen, 2003) or only on traits expressed in reproductive organs such as flowers (reviewed by Ashman and Majetic, 2006), but see Feng et al. (2019) and a synthesis review that compared evolvabilities of vegetative and floral traits (Opedal, 2019). This division reflects a long‐standing tendency for plant biologists to specialize either on physiological responses and growth on the one hand or pollination and reproduction on the other hand, even though both represent important functional aspects of plant fitness (Villelas et al., 2021) and can affect each other's evolution (e.g., Ivey and Carr, 2012; Campbell and Kessler, 2013). Outside of model crop systems, it is rare to have information on genetic and environmental variation in both sets of traits from the same plant species (Castellanos et al., 2011), although there are many studies that examine phenotypic correlations between such traits (reviewed by Conner et al., 2014). Moreover, some traits important to fitness are often overlooked in quantitative genetic studies of plants. These include physiological traits such as photosynthetic water‐use efficiency (but see Culley et al., 2006; Agrawal et al., 2008) and volatile emissions that give flowers scent and are especially rarely included (see Zu et al. [2016, 2020] for exceptions in which genetic variances of several volatiles were measured). Similar points can be made for studies of phenotypic selection, which typically focus only on vegetative traits (Ahrens et al., 2019) or only on floral traits (reviewed by Harder and Johnson, 2009; Opedal, 2021), even though selection across life history stages can generate patterns that are not simply the sum of selection during each stage independently (McGlothlin, 2010). In specialized pollination systems, floral traits are often expected to vary phenotypically less than vegetative traits, which can be subject to high levels of environmental variance (Armbruster et al., 1999), but it is not clear whether that difference between traits will also be true for the levels of genetic variance and evolvability (sensu Houle, 1992). Vegetative and floral are each broad categories that encompass a variety of types of traits, but comparing these categories allows assessment of the potential for evolution in response to mortality versus fecundity selection imposed by rapid environmental change.
We examined genetic variation at two levels (among populations of closely related species and within‐population heritability) and spatial environmental variation in vegetative and floral traits in the same study system. We focused on the subalpine plant Ipomopsis aggregata subsp. aggregata (Polemoniaceae) and its closely related congener I. tenuituba subsp. tenuituba (Porter et al., 2010), for which effects of many traits on fitness are already known (Campbell, 1991; Campbell et al., 1991; Meléndez‐Ackerman and Campbell, 1998; Bischoff et al., 2015). That way we could focus on traits already known to be under mortality or fecundity selection to evaluate their genetic potential for response to those two forms of selection. These two taxa often form natural hybrid zones (Aldridge, 2005), resulting from movement of genes through pollen between the two species (Campbell et al., 2002b). Using common gardens at three sites, we addressed the following questions:
-
(1)
How do leaf and floral traits compare in genetic variance due to source population, planting environment, and genotype by environment interaction? We measured the three leaf traits of specific leaf area (SLA), trichome density, and water‐use efficiency (photosynthetic rate/stomatal conductance; hereafter, WUE), and nine floral traits: corolla length, corolla width, nectar production, sepal width, petal color, and emission rates of four volatiles (indole, the combined structural isomers α‐ and β‐pinene, β‐ocimene, and β‐caryophyllene). Traits were chosen primarily because they were likely to influence fitness in this system (see justification in Materials and Methods).
-
(2)
Are environmental differences in trait expression across planting sites consistent across years? That result would support using space as a substitute for time in understanding plastic responses to environmental change (Fukami and Wardle, 2005).
-
(3)
What is the within‐population genetic variance and heritability of each trait? Genetic variance influences the potential for an evolutionary response to a new selective regime. Prior information exists on genetic variance and heritabilities of two of the traits (corolla length, corolla width; Campbell, 1996), but not on the others.
-
(4)
Are genetic correlations higher between traits expressed at the same point of the life cycle (both vegetative or both floral) than between vegetative and floral traits? Genetic mapping (QTL) studies have demonstrated that several floral traits colocalize across the genome in I. aggregata (Campitelli et al., 2018), which would give rise to genetic correlations between them, but floral volatiles and leaf traits were not studied.
MATERIALS AND METHODS
Study system and design of common gardens
We set up common gardens from seed at three sites in Poverty Gulch, Gunnison County, Colorado, United States. The original source populations were a population of I. aggregata located at 2900 m a.s.l. (38°57′21″N, 107°04′32″W) and a population of I. tenuituba 1.55 km away at 3200 m a.s.l. (38°58′1″N, 107°05′32″W) (sites L and C, respectively, of Campbell et al. [1997]). Plants used as parents in crosses had all been raised from seed generated from crosses between field‐collected plants. For example, I. aggregata parents were generated from controlled crosses between I. aggregata plants. All plants used as parents were raised in a common environment, in pots in a screenhouse during summers at the nearby Rocky Mountain Biological Lab (RMBL) and overwintered in a pit in the ground screened to exclude gophers. The common gardens have been previously described (Campbell and Powers, 2015; Campbell, 2019). The choice of crossing design was optimized for measuring selection on traits and for genetic mapping by generating a large number of F2 individuals, rather than estimating heritability. It does, however, provide suitable data for estimating broad sense heritability from the half‐sibships (for further justification, see section Statistical analyses).
In 2007, seeds of AA (I. aggregata × I. aggregata) were generated from reciprocal factorial crosses of five individual potted plants, yielding five maternal half‐sib families, and supplemented with one set of bulk field‐collected seeds from multiple plants. Both species of Ipomopsis are self‐incompatible, so all seeds are outcrossed (Sage et al., 2006). Seeds of TT (I. tenuituba × I. tenuituba) were generated from reciprocal factorial crosses of five individual potted plants, yielding five maternal half‐sib families, and supplemented with one set of field‐collected seeds. The bulk field‐collected seeds were only used in analyses examining effects of source population, not in analyses that investigated within‐population genetic variance. When planting seeds from these intraspecific crosses, we did not keep track individually of seeds by paternal parent, just by the maternal parent. Five families of AT (F1 with I. aggregata as the maternal parent), and five families of TA (F1 with I. tenuituba) as the maternal parent were also generated, as were 14 full‐sib families of F2 seeds obtained by crossing seven independent pairs of F1 plants in both reciprocal directions. Seeds from the 36 families (34 pedigreed families plus the two bulk collections) were planted in 2007 into 20 blocks at each of three field sites, the two sites of parental origin and a site where natural hybrids grow at 3050 m elevation (38°57′41″N 107°05′10″W; site I of Campbell [1997]). Each block contained approximately 60 seeds (average = 58) chosen at random from the 36 families. Seeds were planted individually at 10‐cm intervals using a gridded planting frame. In 2008, we generated another six families of F2 seeds and planted them into 10 blocks at the I. aggregata site, with each block containing 90 seeds chosen at random from the six families and planted at 10‐cm intervals. The F1 parents of the F2 had been generated from crosses made between potted plants during 2005 (for 2007 parents) or 2006 (for 2008 parents). Of the 14 F2 families, 10 were inbred with full‐sib parents (for genetic mapping), and four were outcrossed. Existing vegetation was left intact so that competition with other plants was not modified, except that flowering individuals of Ipomopsis were removed from the surrounding 1‐m area to prevent drop of seeds into the planting area. There is no seed bank, and seedlings typically emerge within 1 cm of the planted location (Campbell et al., 2008). Seedlings were censused in the year following planting using the planting frame, and surviving individuals were given a numbered metal tag for easier identification in future years. In total, 4512 seeds from 42 families were planted, and 666 seedlings established the following summer, of which 477 were alive in 2009 when trait measurements began. Once a seedling emerges, it has a relatively high chance of survival to flowering, with survival to the next year ranging from 34% to 86% depending on age (Campbell and Waser, 2007).
Fitness‐related traits
We measured a set of traits, chosen either because previous studies have suggested impacts on fitness components in Ipomopsis or because little information exists on genetic variation in natural populations for any species (floral volatiles). For vegetative traits, we measured specific leaf area (SLA), leaf trichome density, and photosynthetic water‐use efficiency (WUE). Low SLA is associated with a higher chance of flowering under early snowmelt conditions in I. aggregata (Navarro et al., 2022). Impacts of trichome density on fitness have not been demonstrated in this system, but I. tenuituba has more leaf trichomes (Campbell et al., 2018), and that trait is thought to be generally adaptive under drier conditions (Ehleringer and Mooney, 1978). Water‐use efficiency measured as photosynthetic rate divided by stomatal conductance is positively correlated with flower production (Campbell and Wendlandt, 2013) and can increase survival under dry conditions in I. aggregata (Navarro et al., 2022). For floral traits, plants in this system with longer and wider corollas, redder flowers and higher nectar production receive more hummingbird visits in at least some years (Campbell, 1991; Mitchell, 1993; Meléndez‐Ackerman and Campbell, 1998). Because seed production in Ipomopsis is limited by pollen transfer (Campbell, 1991; Campbell and Halama, 1993), higher visitation is expected to lead to higher seed production, although such a response is not consistently seen for flower color or nectar production (Campbell et al., 2022a). Wider sepals are associated with reduced seed production (Campbell et al., 2022a), presumably because they provide better protection for pre‐dispersal seed predators. Emission of indole at night attracts hawkmoths to approach inflorescences of Ipomopsis (Bischoff et al., 2015) and increases seed production (Campbell et al., 2022a). Higher emission of the volatiles α‐ and β‐pinene also increases seed production, with a signature of stabilizing selection as well (Campbell et al., 2022a). We included two other floral volatiles (E)‐β‐ocimene and β‐caryophyllene, that like α‐pinene, made up at least 10% of the mixture of emissions in I. aggregata or hybrids in a previous study (Campbell et al., 2019).
Trait measurements
We began measuring traits starting two summers after seed planting because the plants are small seedlings during the first summer. Plants of these species at these sites spend from 2 to 12+ years as a vegetative rosette of leaves before flowering during a single season and then dying (Campbell and Waser, 2007). The vegetative traits SLA, leaf trichome density, and photosynthetic water‐use efficiency were measured repeatedly across years for individual plants that were still alive. Since plants are monocarpic, floral traits were only measured in 1 year on an individual. Trait measurements continued every year from 2009 through 2018, at which point only 16 individuals remained alive, and all but two were in the highest‐elevation I. tenuituba garden.
In a given year, one leaf from each juvenile plant was collected in the field to measure SLA and trichome density and taken to the RMBL on ice. There we scanned the leaf with a flatbed scanner and used ImageJ (National Institutes of Health, Bethesda, MD, USA) to measure area. The leaf was dried at 70°C for 2 h and then weighed to obtain dry mass and calculate SLA as Area/Dry mass. Trichomes were counted at 200× magnification using ImageJ to determine density (trichomes per cm2) on the leaf. These traits were measured in 2009 through 2014. We made 982 measurements of SLA on 383 plants and 794 measurements of trichome density on 311 plants.
Photosynthetic WUE was measured in the field only in 2009 (21–28 July), 2010 (15–23 July), 2012 (12–19 July), and 2013 (23–25 July) on one leaf from each juvenile plant using an LI‐6400 Portable Photosynthesis System (LI‐COR, Lincoln, NE, USA). All measurements were taken between 08:00 to 13:00 with saturating light conditions (PAR = 1800 μmol m−2 s−1), a leaf temperature of 27°C, and a sample CO2 concentration of 375 ppm, following conditions used by Wu and Campbell (2006). Measurements were recorded once gas fluxes showed no systematic increase or decrease for 2 min. Because the leaves did not fill the chamber, gas fluxes were calculated by dividing fluxes by the leaf area inside the leaf chamber, measured by scanning the inside portion of the leaf with a flatbed scanner and using ImageJ to obtain the area. We made 272 measurements of gas fluxes on 239 plants, and averaged values for a plant before analyses.
All floral traits (except the volatiles β‐ocimene and β‐caryophyllene) were measured as described previously (Campbell et al., 2022a), so only a brief summary is provided here. Floral morphology was characterized by corolla length and corolla width at the opening of the tube. Two to 10 flowers per plant were measured during the season, then values were averaged. Petal color was measured for 2–4 flowers per plant using a reflectance spectrometer and reported as the proportion reflectance in the red range minus the proportion reflectance in the green (Campbell and Powers, 2015). Nectar production was measured over 48 h and then converted to microliters per 24 h for 1–5 flowers per plant (Campbell and Powers, 2015). In a given year, all plants were measured for nectar on the same days, to the extent that flowers were available. These floral traits were measured in all years between 2010 and 2018. Sepal width was added for 2–4 flowers per plant (Campbell et al., 2002a) in 2012, 2014, and 2015 only. Volatile organic compounds were sampled in the field in 2011–2018 using dynamic headspace sampling and analyzed with thermal desorption gas chromatography–mass spectrometry (detailed methods in Campbell et al., 2022a). Due to contamination of samples with terpenes in 2011, only indole could be quantified that year. We sampled one flower on each plant during the day (09:00–12:00) and one flower during the night (20:00–23:00). Indole, a hawkmoth attractant, is emitted only at night (Bischoff et al., 2014). Emissions are expressed as the combined emission of α‐ and β‐pinene emitted by the plant averaged across the day and night samples, the emission of indole in the night sample, emission of β‐ocimene averaged across the day and night samples, and emission of β‐caryophyllene averaged across the day and night samples. Values are reported as nanograms per flower per hour based on quantification with external standards (Campbell et al., 2019). We did not separately analyze α‐ and β‐pinene because their emissions are so highly correlated (r = 0.90, N = 203; Campbell et al., 2022a). Floral traits were measured for up to 186 plants (corolla length and width) from 40 families, with smaller sample sizes for sepal width and the volatiles not quantifiable in 2011 (Table 1), and values were averaged for a plant before analyses.
Table 1.
P‐values for tests of source (G), planting site (E), and the interaction (GxE). Number of plants is provided in parentheses. The effect of source (AA, F1 hybrid, F2 hybrid, or TT) was divided into three contrasts: species comparison, F1 vs. species average, F2 vs. others. Few TT plants survived to flower at the Ipomopsis aggregata site, and for several traits (sepal width, pinene, β‐ocimene, β‐caryophyllene) we had no measurements at that site, making some comparisons non‐estimable. In those cases, we estimated them based on a one‐way ANOVA without site. P‐values comparing reciprocal F1 hybrids, i.e., with I. aggregata mother (AT) versus I. tenuituba mother (TA) are also reported from one‐way ANOVA.
| Trait | Source (G) | Planting site (E) | G × E | I. aggregata vs. I. tenuituba | F1 vs. parental average | F2 vs. average of others | AT vs. TA |
|---|---|---|---|---|---|---|---|
| Corolla length (186) | <0.0001 | 0.0600 | 0.1089 | 0.0004 | 0.2901 | 0.0106 | 0.2594 |
| Corolla width (186) | 0.0046 | 0.0302 | 0.3138 | 0.0028 | 0.8149 | 0.2364 | 0.8413 |
| Sepal width (108) | 0.0055 | <0.0001 | 0.1683 | 0.5039 | 0.1369 | 0.0821 | 0.0337 |
| Petal color (177) | <0.0001 | 0.9240 | 0.4632 | <0.0001 | 0.0402 | 0.7371 | 0.9787 |
| NPR (155) | <0.0001 | 0.5665 | 0.6212 | <0.0001 | 0.4299 | 0.9621 | 0.0960 |
| Indole (136) | 0.0024 | <0.0001 | 0.0051 | 0.0003 | 0.1562 | 0.0314 | 0.9641 |
| Pinene (104) | 0.0713 | 0.0613 | 0.9805 | 0.8398 | 0.3119 | 0.0307 | 0.4297 |
| β‐ocimene (104) | 0.6566 | 0.0236 | 0.8645 | 0.5630 | 0.3833 | 0.8307 | 0.5226 |
| β‐caryophyllene (104) | 0.1571 | 0.7398 | 0.8577 | 0.7993 | 0.7730 | 0.0191 | 0.6368 |
| SLA (383) | 0.5467 | <0.0001 | 0.6299 | 0.2973 | 0.4150 | 0.8262 | 0.1318 |
| Trichome density (311) | 0.2693 | 0.4806 | 0.7981 | 0.3748 | 0.2647 | 0.5082 | 0.7130 |
| WUE (239) | 0.1553 | <0.0001 | 0.5453 | 0.8483 | 0.8504 | 0.0241 | 0.6877 |
Notes: NPR = nectar production; SLA = specific leaf area; WUE = water‐use efficiency. N = number of plants. Bold font: P < 0.05.
To explore the potential developmental basis for genetic correlations between floral volatiles and other plant traits, we used flower dissections of potted plants to determine whether volatiles were emitted from the corolla, calyx, or both in I. aggregata and I. tenuituba, and the pattern of emissions during flower development (Appendix S1).
Statistical analyses
Question 1: source population and environmental variation
To evaluate genetic variation due to source and environmental variation due to site of planting, we performed a fixed effects ANOVA with the crossed factors of source and site on mean values for plants. Source had four levels: AA, F1 hybrid, F2 hybrid, and TT. The overall effect of source was further subdivided into three independent contrasts: (1) AA vs. TT, (2) average of those parental types vs. F1 to test for heterosis, and (3) average of all of those versus F2 to test for hybrid breakdown in the second generation. Type III sum of squares (SS) was used to account for unequal sample sizes in Proc GLM of SAS version 9.3 (SAS Institute, Cary. NC, USA). Before those analyses, we used a one‐way ANOVA to check for impacts of inbreeding by comparing F2 hybrids with full‐sib parents with F2 hybrids that were outcrossed. Of all the traits, only trichome density (F 1,87 = 4.65, P = 0.0338) and β‐caryophyllene emissions (F 1,26 = 5.26, P = 0.0302) differed between the two F2 groups (P > 0.10 for all other vegetative traits), and differences were slight (see Results for question 4). So, we lumped all F2 plants together for further analyses.
Question 2: repeated measures across years
Consistency of trait expression across years was analyzed for SLA and trichome density by using repeated measures on the same individual plants. We used a linear mixed model with fixed crossed effects of site and year and plant as a random effect nested in site. To examine plasticity with respect to snowmelt timing in the spring, we repeated that analysis except with the continuous variable of snowmelt date instead of year. Snowmelt dates (first date with zero snow on ground) were taken from those measured near the RMBL (Powers et al., 2022), 8 km from the I. aggregata site used here and at the same approximate elevation (2900 m a.s.l.). Analyses were implemented using PROC MIXED of SAS ver. 9.3.
Question 3: within‐population genetic variance
Variance among the 40 maternal lines (not including the bulk collected seeds) in the reciprocal factorial design estimates one fourth of the additive genetic variance plus potential contributions from maternal environmental effects or maternally inherited cytoplasmic genes (Cockerham and Weir, 1977; Bartowska and Johnston, 2009). To estimate heritability, we performed a linear mixed model on each trait with the fixed effect of source and the random effect of family nested within source, implemented in PROC MIXED. This procedure separated genetic variance at the two levels: between sources and within sources (i.e., between and within populations). Using the family variance component to estimate one fourth of the additive genetic variance assumes maternal environmental effects and effects of maternal cytoplasmic genes are absent (Byers et al., 1997). Since all parents were raised from seed in a common environment, we can rule out environmental maternal effects. We tested for effects of differences in cytoplasmic genes between the species by comparing trait values for reciprocal F1 hybrids, i.e., those with I. aggregata as the mother versus those with I. tenuituba as the mother, using one‐way ANOVA. Heritability was determined by our estimate of genetic variance (i.e., 4× the family variance component) divided by phenotypic variance in the trait. Percentage evolvability was estimated as 100 times genetic variance divided by the squared mean of the trait (Opedal, 2019).
For most traits, we simply used the mean value for the plant as the response variable. For the two vegetative traits that were measured on most plants in multiple years (SLA and leaf trichome density), we used a model with the fixed effects of source and year along with the random effect of family nested within source and the random effect of the family by year interaction. That model allowed us to test for genetic variation in plasticity, as a family by year interaction (Scheiner, 1993). Given the low sample sizes, we did not attempt to test for interactions between family and site.
Question 4: genetic correlations
Genetic covariances and correlations between traits were estimated by calculating mean values for the maternal line families and examining Pearson correlation coefficients between family trait means. Genetic correlations within source populations were evaluated by finding the slope of the family mean for one trait on the family mean for the second trait separately by source. A positive slope would indicate a positive genetic correlation within that source population, whereas a negative slope would indicate a negative genetic correlation. That analysis employed a model containing the effect of source and the effect of family mean for the second trait nested within source.
RESULTS
Question 1: source population and environmental variation
All of the morphological and reward floral traits varied significantly across source (Table 1, Figure 1). This source variation generally reflected differences between the two parental species and additive inheritance without evidence for heterosis or hybrid breakdown in the trait (see contrasts in Table 1). However, F2 plants had shorter corollas than expected under an additive model (hybrid breakdown contrast F 1,174 = 6.68, P = 0.0106). For flower color, F1 hybrids differed from the parental average in resembling more closely the red color of I. aggregata (contrast F 1,165 = 4.27, P = 0.0402; Figure 1D). Indole emissions were higher in I. tenuituba (P < 0.0001), although indole was not detectable in all those plants. The one I. tenuituba plant that survived to flower at the I. aggregata site had exceptionally high emissions, but other volatiles were not detectably different between species. Three of the four volatiles (indole, pinene and β‐caryophyllene) had higher emissions in the F2 than expected under an additive model of inheritance (hybrid breakdown contrast, P < 0.05 in Table 1; Figure 1). Total emissions, obtained by summing those four compounds, was also higher in the F2 than expected (P = 0.0297). None of the volatile emissions differed between the two reciprocal F1s, i.e., those with I. aggregata as the mother versus those with I. tenuituba as the mother (one‐way ANOVAs, all P > 0.43). The only trait that did show a significant reciprocal effect was sepal width; F1 hybrids with I. aggregata as the mother had wider sepals than did those with I. tenuituba as the mother (F 1,35 = 4.89, P = 0.0337). None of the vegetative traits varied significantly across the four sources (Table 1). Most traits, whether floral or vegetative, varied with planting site (P < 0.05), although corolla length, nectar production, pinene and β‐caryophyllene emissions, and trichome density were exceptions. Indole emission was the sole trait with a source by site interaction (F 6,124 = 3.27, P = 0.0051), indicating a genotype by environment interaction. This interaction arose because, whereas AA plants never emitted indole, the other plant types emitted less at the hybrid site than at the other two sites (Figure 1F).
Figure 1.
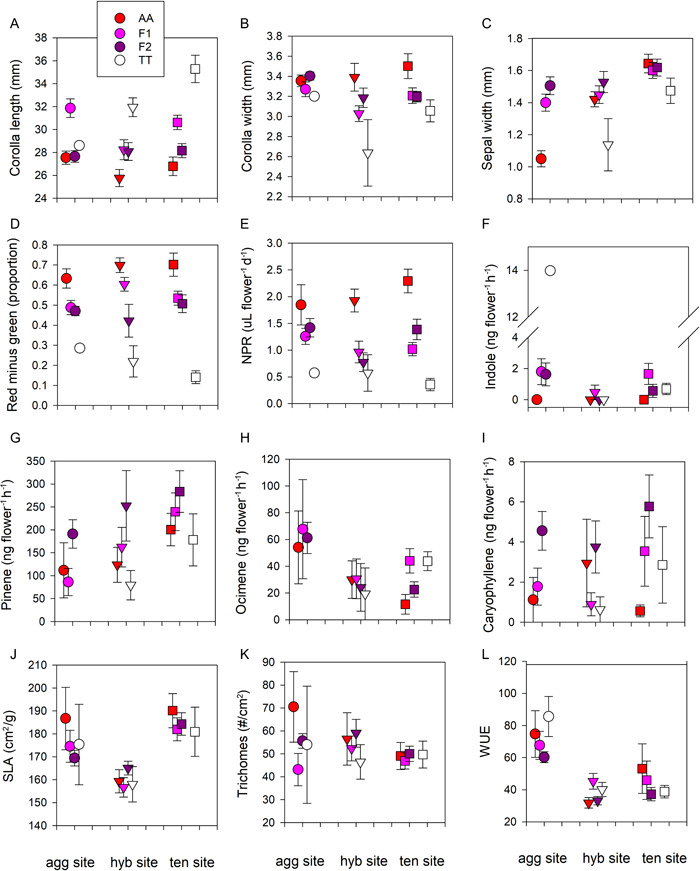
Trait means and standard errors for four source types (AA, F1, F2, TT) planted as seeds at three sites (Ipomopsis aggregata, hybrid, I. tenuituba). AA = I. aggregata × I. aggregata. TT = I. tenuituba × I. tenuituba. F1 and F2 are hybrids. (A–C) Floral morphometric traits. (D) Petal color. (E) Nectar production. (F–I) Floral volatiles. (F) The one I. tenuituba plant measured for indole at the I. aggregata site had an unusually high value, but similarly high values have been seen for other I. tenuituba individuals (Campbell et al., 2022a). (J–L) Vegetative traits.
Question 2: repeated measures across years
In a repeated measures analysis, SLA varied across planting site and year and showed a strong site by year interaction (F 10,584 = 9.83, P < 0.0001) in which sites differed from each other much more strongly in some years (Campbell et al., 2022a). Trichome density also showed a site by year interaction (P = 0.0003), but no differences on average across sites (Table 2). Specific leaf area increased, and trichome density decreased, in years of later snowmelt (Figure 2; for snowmelt date, P < 0.0001). Snowmelt by site interactions were not significant, suggesting that the inconsistency in site differences across years was driven by other environmental variables besides snowmelt. Note that the I. aggregata site had the highest value for SLA in one year, but the lowest value in three other years. Sites differed most in both SLA and trichome density during 2014, which had an intermediate snowmelt date on the 146th day of the year (26 May).
Table 2.
Results of repeated measures analysis of vegetative traits in Ipomopsis. The model included a random effect of plant nested within site, as well as the fixed effects of site, year, and site × year interaction.
| Trait | Effect | df | F | P |
|---|---|---|---|---|
| SLA | Site | 2, 380 | 19.32 | <0.0001 |
| Year | 5, 584 | 59.83 | <0.0001 | |
| Site × Year | 10, 584 | 9.28 | <0.0001 | |
| Trichome density | Site | 2, 312 | 0.79 | 0.4529 |
| Year | 4, 467 | 54.47 | <0.0001 | |
| Site × Year | 8, 467 | 3.73 | 0.0003 |
Notes: Bold font: P < 0.05. N = 982 for specific leaf area (SLA) and 794 for trichome density.
Figure 2.

Changes in (A) specific leaf area (SLA) and (B) trichome density with snowmelt date for Ipomopsis plants. Values plotted are least squares means and SE from repeated measures analysis.
Question 3: within‐population genetic variance
We detected significant genetic variation within populations (P < 0.05) for four of the 12 traits. These included the three aspects of floral morphometrics: corolla length, corolla width, and sepal width, and one vegetative trait, SLA (Table 3). We did not detect family × year interactions for either SLA (P = 1) or trichome density (P = 0.16). Sepal width had the highest heritability, estimated at 0.86 (χ 2 = 5.7, df = 1, P = 0.017), but that estimate might be inflated by effects of maternally inherited cytoplasmic genes because that was the only trait that differed significantly between reciprocal F1 hybrids (Table 1), with wider sepals for those with I. aggregata as the maternal parent. Heritabilities were low or zero for nectar production, petal color, and the four volatile compounds (Table 3), with estimates for volatiles ranging from 0 to 0.13 (all P > 0.05). Standardized genetic variance (G′), expressed in units of SD, was highest for corolla length, trichome density, and SLA. Estimates of standardized genetic variance were higher for three of the volatiles (pinene, β‐ocimene and β‐caryophyllene) than for corolla width and sepal width (Table 3), suggesting that their low heritability was due to high environmental variance rather than low evolvability. Percentage evolvability was actually highest for β‐caryophyllene. On average, both heritability and evolvability were higher for the 9 floral traits than for the 3 vegetative traits (Table 3). Heritability averaged 0.28 for the floral traits versus 0.06 for the vegetative traits. Breaking that down more finely, heritability averaged 0.47 for floral traits typically studied (morphology, color, rewards), 0.04 for floral volatiles, 0.09 for morphological vegetative traits, and 0.01 for the physiological trait of water‐use efficiency.
Table 3.
Estimates of genetic variance and heritability for traits in Ipomopsis. Values are given for standardized genetic variance (G′), evolvability (I), and heritability (h 2), corresponding to the assumption that the family variance in this reciprocal factorial design estimated one fourth of the genetic variance. P = probability value for effect of the family variance from log likelihood ratio test between the fitted model and a model without that term. In addition to reporting on the nine floral traits and three vegetative traits, we also partitioned WUE into photosynthetic rate (assimilation A) and stomatal conductance (g), as relatively few estimates of heritability for those components exist for non‐crop species.
| Trait | Mean | SD | V family | V residual | G′ | I (%) | h 2 | P |
|---|---|---|---|---|---|---|---|---|
| Corolla length (mm) | 28.835 | 3.884 | 1.446 | 9.930 | 1.490 | 0.70 | 0.51 | 0.0102 |
| Corolla width (mm) | 3.254 | 0.361 | 0.0129 | 0.1052 | 0.143 | 0.49 | 0.44 | 0.0201 |
| Sepal width (mm) | 1.524 | 0.234 | 0.0120 | 0.0438 | 0.204 | 2.06 | 0.86 | 0.0170 |
| Petal color (proportion reflectance in red minus green) | 0.5065 | 0.2078 | 0.0041 | 0.0260 | 0.078 | 6.32 | 0.54 | 0.1294 |
| Nectar production (μL flower−1 d−1) | 1.283 | 0.908 | 0 | 0.6785 | 0 | 0 | 0 | 1 |
| Indole (ng flower−1 h−1) | 1.043 | 2.990 | 0 | 9.2698 | 0 | 0 | 0 | 1 |
| Pinene (ng flower−1 h−1) | 203.2 | 161.6 | 51.41 | 26262 | 1.273 | 0.50 | 0.01 | 0.9203 |
| β‐ocimene (ng flower−1 h−1) | 39.03 | 43.06 | 11.25 | 1866 | 1.045 | 2.96 | 0.02 | 0.7518 |
| β‐caryophyllene (ng flower−1 h−1) | 3.463 | 5.453 | 0.932 | 27.186 | 0.683 | 31.06 | 0.13 | 0.6547 |
| SLA (cm 2 g −1 ) | 172.9 | 34.3 | 39.00 | 1507.9 | 4.551 | 0.52 | 0.10 | 0.0483 |
| Trichome density (no. cm−2) | 52.73 | 29.91 | 21.90 | 1030 | 2.929 | 3.15 | 0.08 | 0.1832 |
| WUE (A/g) (μmol CO2 mol H2O−1) | 52.02 | 32.29 | 1.753 | 1030 | 0.217 | 0.26 | 0.01 | 0.4826 |
| A (μmol CO2 m−2 s−1) | 22.28 | 11.74 | 6.093 | 135.47 | 2.075 | 4.91 | 0.17 | 0.2263 |
| g (mol H2O m−2 s−1) | 0.5797 | 0.4755 | 0.0028 | 0.2290 | 0.0234 | 3.31 | 0.05 | 0.4066 |
Notes: G′ = genetic variance standardized by the SD. I = evolvability (genetic variance/mean2 expressed as a percentage). Bold font: P < 0.05 for variance among families.
Question 4: genetic correlations
Family mean correlations differed significantly from zero (after sequential Bonferroni correction) for petal color with corolla length (r = –0.59, uncorrected P < 0.0001), corolla width (r = 0.52, P < 0.0008), and nectar production (r = 0.64, P < 0.0001; Table 4). Sepal width had strongly positive family mean correlations with pinene (r = 0.73, uncorrected P < 0.0001) and β‐caryophyllene emissions (r = 0.53, P = 0.0008), and slopes of both volatiles on sepal width were significantly positive when nested within plant source (P < 0.0001 and 0.0181, respectively). Total emissions of the four volatiles also correlated highly at the family level with sepal width (r = 0.72, P < 0.0001). The genetic association appeared especially strong for pinene emissions in F2 families (Figure 3), and nesting the slope separately within plant source revealed a significantly positive slope for F2 plants (P < 0.0001), but not for the other sources (P > 0.05). Emission of β‐caryophyllene increased significantly with sepal width for both F2 and TT (both P < 0.01). For neither pinene nor β‐caryophyllene were results markedly different for inbred versus outbred F2 families (Figure 3). Flower buds, the corolla and the calyx all emitted terpenes (Appendix S1, Figures S1, S2), which make up the bulk of the floral emissions, but only the corolla emitted indole (Appendix S1, Table S1), a volatile that did not correlate genetically with sepal width. Emissions of terpenes were higher from the calyx (P = 0.03), a pattern driven primarily by I. tenuituba in which calyces but not corollas are covered with trichomes (Appendix 1, Figure S3). For the 12 traits in Table 4, the absolute value of the family mean correlation averaged 0.24 ± 0.03 (mean ± SE) between two floral traits, 0.12 ± 0.02 between two vegetative traits, and 0.15 ± 0.03 across one floral and one vegetative trait. The absolute value of the family mean correlation averaged 0.35 for floral traits typically studied (morphology, color, rewards) and was 0.17 between the two morphological vegetative traits (SLA, trichomes).
Table 4.
Family mean correlations between pairs of traits. Dark gray: correlations between floral traits. White: correlations between vegetative traits. Light gray: correlations between one floral and one vegetative trait. N = 40 families.

|
Notes: Length = corolla length. Width = corolla width. Sepal = sepal width. Color = petal color. NPR = nectar production rate. Caryop = β‐caryophyllene. Trichome = trichome density. Bold font: P < 0.05. Asterisk denotes P < 0.05 after sequential Bonferroni correction.
Figure 3.

Family mean values for (A) pinene and (B) β‐caryophyllene plotted against sepal width. Regression lines are fit separately for each source (AA, F1, F2, TT). AA = Ipomopsis aggregata × I. aggregata. TT = I. tenuituba × I. tenuituba. F1 and F2 are hybrids. Slopes differed significantly from zero for pinene in the F2 (P < 0.0001) and caryophyllene in F2 and TT (P = 0.0108 and 0.0148). The four outbred F2 families are indicated by red symbols.
DISCUSSION
Several traits of Ipomopsis showed some evidence of genetic variation, at either the within population level, among populations, or both. Morphometric aspects of floral morphology (corolla length, corolla width, and sepal width) were genetically variable at both levels. The results for corolla length and width reinforce earlier studies that showed genetic differences between the two species (Campbell and Aldridge, 2006), QTLs for corolla size dimensions in Ipomopsis (Campitelli et al., 2018), and narrow‐sense heritability for these same two traits under field conditions of 0.67 and 0.31, respectively (Campbell, 1996), compared to the current estimates of 0.51 and 0.44. Although the current estimates are broad‐sense, it is likely that narrow‐sense estimates are similar for three reasons. First, for the traits where we had prior narrow‐sense estimates, our current estimates were very similar. Second, raising parents from seed in a common environment eliminated maternal environmental effects. Third, for only one trait (sepal width) did we detect differences dependent on the species of maternal cytoplasm, I. aggregata and I. tenuituba, suggesting that maternal cytoplasmic genes may have little influence on most of these traits. A previous study did, however, find higher WUE for hybrids with I. tenuituba as the maternal parent (Campbell et al., 2005). Sepal width and SLA showed heritable variation within populations, but SLA did not differ among source populations as had been observed for the alpine plant Campanula thyrsoides sourced from a wider range of elevations (Scheepens et al., 2010). It was surprising that WUE failed to differ detectably among the two species and hybrids, because earlier studies had found higher WUE for F1 hybrids than the average of the parental species in a common garden at the same I. aggregata site used here (Campbell et al., 2005). One difference between the studies is that we included full‐sib F2s here, but those did not differ on average from outbred F2. Indole emissions, but not that of other floral volatiles, differed between species, as observed in earlier studies (Bischoff et al., 2014). Overall, floral morphometric traits exhibited more within‐population genetic variation than the two morphological vegetative traits. That result differs from the review in (Opedal, 2019) who found evolvabilities of floral traits tended to be lower than that of vegetative traits. That compilation was dominated by studies in greenhouses where results might be different from in the field. We also found a very low (and nonsignificant) estimate of heritability for the physiological vegetative trait of WUE. More studies of genetic variance in leaf physiological traits are needed to make generalizations about how they compare to structural leaf traits.
Genetic correlations were higher between floral traits than between one floral trait and one vegetative trait, in line with the expectation that these modules would show functional independence (Berg, 1960; Conner et al., 2014). The averages (r = 0.24 for two floral traits and 0.15 between one floral and one vegetative trait) were similar to averages from a general review (r = 0.32 and 0.15; Ashman and Majetic, 2006). One caveat is that we did not use a comprehensive set of traits of each type. For example, we did not include maximum or minimum stamen length because we already knew they were exceptionally highly correlated with corolla length (estimate of genetic correlation = 0.89 by Campbell [1996]) even though stamen length affects male fitness in this system (Campbell et al., 1998). Nor did we include photosynthetic rate and stomatal conductance, as they are inputs to the calculation of WUE. Given the relatively low family mean correlations of floral traits with vegetative traits, it would often be reasonable to make independent predictions about their evolution under climate change.
For volatile emissions, heritability estimates were low (and nonsignificant) at 0.04 compared with heritabilities of other floral traits here (average h 2 = 0.47 in this study) and elsewhere (average h 2 = 0.39 across both broad‐ and narrow‐sense estimates (review by Ashman and Majetic, 2006), largely because of high environmental variation. This high environmental variation is consistent with a previous experimental study using potted plants showing effects of soil moisture on emission of several volatiles in Ipomopsis (Campbell et al., 2019). In that screenhouse experiment, α‐pinene and β‐ocimene were among the volatiles that increased in emission rate with drought.
Despite the low heritabilities, three lines of evidence suggest some genetic variation in volatiles other than that observed between species. First, for three of the four volatiles, F2 had significantly higher emissions than expected under an additive model of inheritance. Second, evolvability within populations was actually highest for one of the four volatiles (β‐caryophyllene) and relatively high for β‐ocimene (Table 3). Third, pinene and β‐caryophyllene also had high family mean correlations with sepal width, and those correlations are maintained within a source type (Figure 3). Both the corolla and the calyx in Ipomopsis aggregata and I. tenuituba emit terpenes, including pinene and β‐caryophyllene, but only the corolla emits indole. That developmental pattern can explain the genetic correlations of pinene and β‐caryophyllene, but not indole, with sepal width. The sepals are covered especially densely with trichomes, although the corolla also has small trichomes in I. aggregata (Appendix 1, Figure S3), and, in other systems, trichomes on sepals have been identified as the source of terpene emissions (Gonzales‐Vigil et al., 2012). If the trichomes serve a similar function in Ipomopsis, that would explain the drop in terpene emissions for corollas compared to calyces specifically for I. tenuituba.
We are aware of only one other species for which within‐population heritability of floral volatiles has been measured, in this case with narrow‐sense estimates (Zu et al., 2016). Whereas that study of Brassica rapa found higher heritability estimates than we did, even for the one compound in common (indole), it was conducted in the controlled environment of a phytotron, rather than in the field like our study. Our power for detecting genetic variance may have been especially low for indole, as the majority of plants in the study (especially I. aggregata) did not emit that compound. Data on expression of volatiles from known F2 hybrids in systems with food rewards are also scarce. An early analysis of scent segregation patterns in F1 and F2 hybrids between Clarkia breweri and C. concinna revealed single‐gene Mendelian dominance for linalool and its pyranoid oxide (Raguso and Pichersky, 1999), whereas a more recent study found that some F2 lines of Petunia could emit large amounts of methylbenzoate due to epistatic interactions between two major quantitative trait loci (Klahre et al., 2011). Such epistatic interactions are a potential explanation for high F2 emissions in Ipomopsis. The high F2 emissions likely help to explain transgressive values for many volatiles seen in natural hybrids sampled from the Ipomopsis hybrid zone (Bischoff et al., 2014), as that hybrid zone contains advanced generation hybrids (Wu and Campbell, 2005). More studies of quantitative genetics of floral volatiles would be welcome to help draw general conclusions about their short‐term evolution.
Different traits could contribute to evolutionary impacts on population growth through different routes. The traits in Ipomopsis exhibiting within‐population genetic variance or genetic covariance (corolla length, corolla width, sepal width, SLA, pinene emissions and β‐caryophyllene emissions) have the potential to evolve if they experience a change in selection or selection on a genetically correlated trait under climate change. The existence of an extensive natural hybrid zone demonstrates gene flow between populations separated by kilometers, as do studies of variation at molecular markers in the area of our study (Wolf and Campbell, 1995). Thus, introgression of traits from sites experiencing different conditions is also a possible source of genetic variation for evolutionary rescue, along with within‐population variation. The current study is only a first step in evaluating the potential for evolutionary rescue, as studies of how early snowmelt impacts selection and absolute fitness, necessary for predictions (Gomulkiewicz and Holt, 1995), are in progress in Ipomopsis. Previous studies have, however, already shown a decline in selection intensity on corolla length with earlier snowmelt (Campbell and Powers, 2015), potentially due to increased water limitation of seed production, suggesting that evolutionary rescue through change in that floral trait, and potentially other floral traits, is unlikely. On the other hand, a recent experimental manipulation of snowmelt date showed that selection favoring high SLA under normal snowmelt was reversed to favor low SLA under early snowmelt (Navarro et al., 2022), suggesting that selection on SLA might contribute favorably to evolutionary rescue. Specific leaf area and leaf trichome density show plasticity in response to snowmelt date, and the selection data suggest that plasticity is adaptive. These effects are likely driven by drought, as early snowmelt leads to lower soil moisture in early summer for Ipomopsis aggregata (Powers et al., 2022) because summer rains in this area do not start until the monsoonal pattern later in the summer (Sloat et al., 2015). In an experimental manipulation, I. aggregata plants showed a plastic response of higher WUE specifically under early snowmelt and reduced precipitation (Navarro et al., 2022). That plastic response increased survival and was thus adaptive. It remains to be seen if the combination of adaptive plasticity and selection on these vegetative traits is sufficient to counter immediate declines in seedling emergence and seed production observed in years of early snowmelt (Campbell, 2019).
We found site by year interactions in the vegetative traits of SLA and trichome density, which included reversals across years in which site had the highest values. Those interactions suggest that sites should be used with caution as a substitute for changes over time due to climate change because they do not provide a consistent substitute. This result adds to others that have found situations in which space‐for‐time substitutions do not necessarily perform (e.g., Johnson and Miyanishi, 2008). On a more encouraging note, we did not find, for either trait, an interaction between site and the specific environmental variable of snowmelt date in the spring. So, for studying impacts of snowmelt date it is likely still possible to make accurate predictions from spatial data sets.
CONCLUSIONS
Using common gardens, we found stronger genetic potential for evolutionary responses to selection in floral traits compared with vegetative traits (with the exception of specific leaf area). Vegetative traits showed plasticity either across years or with snowmelt date, which potentially could contribute to persistence through adaptive plasticity.
AUTHOR CONTRIBUTIONS
D.R.C. designed the study, collected and processed data, analyzed data, wrote the first draft of the manuscript and drafted the revisions. R.A.R., M.M., M.B., and G.T.B. collected data and contributed to revisions.
Supporting information
Appendix S1. Supplementary methods and results, table (Table S1), and figures (Figure S1, S2, and S3) for characterizing developmental patterns in floral volatile emissions.
ACKNOWLEDGMENTS
We thank the many people who helped collect field data over the years of this study, including Laura Barbour, Maddie Crowell, Kirsten Dales, Colleen Danaher, Alexandra Faidiga, Michelle Forster, Emily Graber, John Powers, and Camille Wendlandt. Øystein Opedal and an anonymous reviewer provided helpful comments on the manuscript. Funding was provided by NSF‐DBI‐1624073 to I. Billick, D.R.C., J. Reithel, and R.A.R., and NSF‐DEB‐2135270, NSF‐DEB‐1654655, NSF‐DEB‐0542876, RMBL Research Fellowships, and UC Irvine Research funds to D.R.C.
Campbell, D. R. , Raguso R. A., Midzik M., Bischoff M., and Broadhead G. T.. 2022. Genetic and spatial variation in vegetative and floral traits across a hybrid zone. American Journal of Botany 109(11): 1780–1793. 10.1002/ajb2.16067
This article is part of the AJB Special Issue “Approaches to the Study of Quantitative Fitness‐Related Traits.”
DATA AVAILABILITY STATEMENT
The data are deposited in the Dryad Digital Repository: https://doi.org/10.7280/D1QD7M (Campbell et al., 2022).
REFERENCES
- Agrawal, A. , Erwin A., and Cook S.. 2008. Natural selection on and predicted responses of ecophysiological traits of swamp milkweed (Asclepias incarnata). Journal of Ecology 96: 536–542. [Google Scholar]
- Ahrens, C. W. , Andrew M. E., Mazanec R. A., Ruthrof K. X., Challis A., Hardy G., Byrne M., et al. 2019. Plant functional traits differ in adaptability and are predicted to be differentially affected by climate change. Ecology and Evolution 10: 232–248. [DOI] [PMC free article] [PubMed] [Google Scholar]
- Aldridge, G. 2005. Variation in frequency of hybrids and spatial structure among Ipomopsis (Polemoniaceae) contact sites. New Phytologist 167: 279–288. [DOI] [PubMed] [Google Scholar]
- Ashman, T. , and Majetic C. J.. 2006. Genetic constraints on floral evolution: a review and evaluation of patterns. Heredity 96: 343–352. [DOI] [PubMed] [Google Scholar]
- Armbruster, W. S. , Di Stilio V., Tuxill J. D., Flores C., and Velasquez Runk J. L.. 1999. Covariance and decoupling of floral and vegetative traits in nine neotropical plants: a re‐evaluation of Berg's correlation‐pleiades concept. American Journal of Botany 86: 39–55. [PubMed] [Google Scholar]
- Bartowska, M. P. , and Johnston M. O.. 2009. Quantitative genetic variation in populations of Amsinckia spectabilis that differ in rate of self‐fertilization. Evolution 63: 1103–1117. [DOI] [PubMed] [Google Scholar]
- Bell, G. , and Gonzalez A.. 2011. Adaptation and evolutionary rescue in metapopulations experiencing environmental deterioration. Science 332: 1327–1330. [DOI] [PubMed] [Google Scholar]
- Berg, R. 1960. The ecological significance of correlation pleiades. Evolution 14: 171–180. [Google Scholar]
- Bischoff, M. , Jürgens A., and Campbell D. R.. 2014. Floral scent in natural hybrids of Ipomopsis (Polemoniaceae) and their parental species. Annals of Botany 113: 533–544. [DOI] [PMC free article] [PubMed] [Google Scholar]
- Bischoff, M. , Raguso R. A., Jürgens A., and Campbell D. R.. 2015. Context‐dependent reproductive isolation mediated by floral scent and color. Evolution 69: 1–13. [DOI] [PubMed] [Google Scholar]
- Byers, D. L. , Platenkamp G. A. J., and Shaw R. G.. 1997. Variation in seed characters in Nemophila menziesii: evidence of a genetic basis for maternal effect. Evolution 51: 1445–1456. [DOI] [PubMed] [Google Scholar]
- Campbell, D. R. 1991. Effects of floral traits on sequential components of fitness in Ipomopsis aggregata . American Naturalist 137: 713–737. [Google Scholar]
- Campbell, D. R. 1996. Evolution of floral traits in a hermaphroditic plant: field measurements of heritabilities and genetic correlations. Evolution 50: 1442–1453. [DOI] [PubMed] [Google Scholar]
- Campbell, D. R. 1997. Genetic and environmental variation in life‐history traits of a monocarpic perennial: a decade‐long field experiment. Evolution 51: 373–382. [DOI] [PubMed] [Google Scholar]
- Campbell, D. R. 2019. Early snowmelt projected to cause population decline in a subalpine plant. Proceedings of the National Academy of Sciences, USA 116: 12901–12906. [DOI] [PMC free article] [PubMed] [Google Scholar]
- Campbell, D. R. , and Aldridge G.. 2006. Floral biology of hybrid zones. In Harder L. and Barrett S. C. H. [eds.], Ecology and evolution of flowers, 326–345. Oxford University, Oxford, UK. [Google Scholar]
- Campbell, D. R. , Bischoff M., Raguso R. A., Briggs H. M., and Sosenski P.. 2022a. Selection of floral traits by pollinators and seed predators during sequential life history stages. American Naturalist 199: 808–823. [DOI] [PubMed] [Google Scholar]
- Campbell, D. R. , Crawford M., Brody A. K., and Forbis T. A.. 2002a. Resistance to pre‐dispersal seed predators in a natural hybrid zone. Oecologia 131: 436–443. [DOI] [PubMed] [Google Scholar]
- Campbell, D. R. , Faidiga A., and Trujillo G.. 2018. Clines in traits compared over two decades in a plant hybrid zone. Annals of Botany 122: 315–324. [DOI] [PMC free article] [PubMed] [Google Scholar]
- Campbell, D. R. , Galen C., and Wu C.. 2005. Ecophysiology of first and second generation hybrids in a natural plant hybrid zone. Oecologia 144: 214–225. [DOI] [PubMed] [Google Scholar]
- Campbell, D. R. , and Halama K.. 1993. Resource and pollen limitations to lifetime seed production in a natural plant population. Ecology 74: 1043–1051. [Google Scholar]
- Campbell, D. R. , and Powers J. M.. 2015. Natural selection on floral morphology can be influenced by climate. Proceedings of the Royal Society, B, Biological Sciences 282: 21050178. [DOI] [PMC free article] [PubMed] [Google Scholar]
- Campbell, D. R. , Raguso R. A., Midzik M., Bischoff M., and Broadhead G. T.. 2022. Data from: Genetic and spatial variation in vegetative and floral traits across a hybrid zone. Dryad, Dataset . 10.7280/D1QD7M [DOI] [PMC free article] [PubMed]
- Campbell, D. R. , Sosenski P., and Raguso R. A.. 2019. Phenotypic plasticity of floral volatiles in response to increasing drought stress. Annals of Botany 123: 601–610. [DOI] [PMC free article] [PubMed] [Google Scholar]
- Campbell, D. R , and Waser N.. 2007. Evolutionary dynamics of an Ipomopsis hybrid zone: confronting models with lifetime fitness data. American Naturalist 169: 298–310. [DOI] [PubMed] [Google Scholar]
- Campbell, D. R. , Waser N. M., Aldridge G., and Wu C. A.. 2008. Lifetime fitness in two generations of Ipomopsis hybrids. Evolution 62: 2616–2627. [DOI] [PubMed] [Google Scholar]
- Campbell, D. R. , Waser N. M., and Meléndez‐Ackerman E. J.. 1997. Analyzing pollinator‐mediated selection in a plant hybrid zone: hummingbird visitation patterns on three spatial scales. American Naturalist 149: 295–315. [Google Scholar]
- Campbell, D. R. , Waser N., and Pederson G.. 2002b. Predicting patterns of mating and potential hybridization from pollinator behavior. American Naturalist 159: 438–450. [DOI] [PubMed] [Google Scholar]
- Campbell, D. R. , Waser N. M., Price M. V., Lynch E., and Mitchell R.. 1991. Components of phenotypic selection: pollen export and flower corolla width in Ipomopsis aggregata . Evolution 45: 1458–1467. [DOI] [PubMed] [Google Scholar]
- Campbell, D. R. , Waser N. M., and Wolf P.. 1998. Pollen transfer by natural hybrids and parental species in an Ipomopsis hybrid zone. Evolution 52: 1602–1611. [DOI] [PubMed] [Google Scholar]
- Campbell, D. R. , and Wendlandt C.. 2013. Altered precipitation affects plant hybrids differently than their parental species. American Journal of Botany 100: 1322–1331. [DOI] [PubMed] [Google Scholar]
- Campbell, S. A. , and Kessler A.. 2013. Plant mating system transitions drive the macroevolution of defense strategies. Proceedings of the National Academy of Sciences, USA 110: 3973–3978. [DOI] [PMC free article] [PubMed] [Google Scholar]
- Campitelli, B. E. , Kenney A. M., Hopkins R., Soule J., Lovell J. T., and Juenger T. E.. 2018. Genetic mapping reveals an anthocyanin biosynthesis pathway gene potentially influencing evolutionary divergence between two subspecies of scarlet gilia (Ipomopsis aggregata). Molecular Biology and Evolution 35: 807–822. [DOI] [PubMed] [Google Scholar]
- Castellanos, M. C. , Alcantara J. M., Rey P. J., and Bastida J. M.. 2011. Intra‐population comparison of vegetative and floral trait heritabilities estimated from molecular markers in wild Aquilegia populations. Molecular Ecology 20: 3513–3524. [DOI] [PubMed] [Google Scholar]
- Chevin, L. , and Lande R.. 2010. When do adaptive plasticity and genetic evolution prevent extinction of a density‐regulated population? Evolution 64: 1143–1150. [DOI] [PubMed] [Google Scholar]
- Cockerham, C. C. , and Weir B. S.. 1977. Quadratic analysis of reciprocal crosses. Biometrics 33: 187–203. [PubMed] [Google Scholar]
- Conner, J. K. , Cooper I. A., La Rosa R. J., Perez S. G., and Royer A. M.. 2014. Patterns of phenotypic correlations among morphological traits across plants and animals. Philosophical Transactions of the Royal Society, B, Biological Sciences 369: 20130246. [DOI] [PMC free article] [PubMed] [Google Scholar]
- Culley, T. M. , Dunbar‐Wallis A. K., Sakai A. K., Weller S. G., Mishio M., Campbell D. R., and Herzenach M.. 2006. Genetic variation of ecophysiological traits in two gynodioecious species of Schiedea (Caryophyllaceae). New Phytologist 169: 589–601. [DOI] [PubMed] [Google Scholar]
- Ehleringer, J. R. , and Mooney H. A.. 1978. Leaf hairs: effects on physiological activity and adaptive value to a desert shrub. Oecologia 37: 183–200. [DOI] [PubMed] [Google Scholar]
- Feng, C. , Feng C., Yang L. H., Kang M., and Rausher M. D.. 2019. Genetic architecture of quantitative flower and leaf traits in a pair of sympatric sister species of Primulina . Heredity 122: 864–876. [DOI] [PMC free article] [PubMed] [Google Scholar]
- Fukami, T. , and Wardle D. A.. 2005. Long‐term ecological dynamics: reciprocal insights from natural and anthropogenic gradients. Proceedings of the Royal Society, B, Biological Sciences 272: 2105–2115. [DOI] [PMC free article] [PubMed] [Google Scholar]
- Geber, M. , and Griffen L.. 2003. Inheritance and natural selection on functional traits. International Journal of Plant Sciences 164: S21–S42. [Google Scholar]
- Gomulkiewicz, R. , and Holt R.. 1995. When does evolution by natural selection prevent extinction? Evolution 49: 201–207. [DOI] [PubMed] [Google Scholar]
- Gomulkiewicz, R. , and Shaw R. G.. 2013. Evolutionary rescue beyond the models. Philosophical Transactions of the Royal Society, B, Biological Sciences 368: 20120093. [DOI] [PMC free article] [PubMed] [Google Scholar]
- Gonzales‐Vigil, E. , Hufnagel D. E., Kim J., Last R. L., and Barry C. S.. 2012. Evolution of TPS20‐related terpene synthases influences chemical diversity in the glandular trichomes of the wild tomato relative Solanum habrochaites . Plant Journal 71: 921–935. [DOI] [PMC free article] [PubMed] [Google Scholar]
- Harder, L. D. , and Johnson S. D.. 2009. Darwin's beautiful contrivances: evolutionary and functional evidence for floral adaptation. New Phytologist 183: 530–545. [DOI] [PubMed] [Google Scholar]
- Houle, D. 1992. Comparing evolvability and variability of quantitative traits. Genetics 130: 195–204. [DOI] [PMC free article] [PubMed] [Google Scholar]
- Ivey, C. T. , and Carr D. E.. 2012. Tests for the joint evolution of mating system and drought escape in Mimulus . Annals of Botany 109: 583–598. [DOI] [PMC free article] [PubMed] [Google Scholar]
- Johnson, E. A. , and Miyanishi K.. 2008. Testing the assumptions of chronosequences in succession. Ecology Letters 11: 419–431. [DOI] [PubMed] [Google Scholar]
- Klahre, U. , Gurba A., Hermann K., Saxenhofer M., Bossolini E., Gurerin P. M., and Kuhlemeier C.. 2011. Pollinator choice in Petunia depends on two major genetic loci for floral scent production. Current Biology 21: 730–739. [DOI] [PubMed] [Google Scholar]
- Lande, R. , and Arnold S. J.. 1983. The measurement of selection on correlated characters. Evolution 37: 1210–1226. [DOI] [PubMed] [Google Scholar]
- Malcolm, J. R. , Liu C., Neilson R. P., Hansen L., and Hannah L.. 2006. Global warming and extinctions of endemic species from biodiversity hotspots. Conservation Biology 20: 538–548. [DOI] [PubMed] [Google Scholar]
- McGlothlin, J. W. 2010. Combining selective epsiodes to estimate lifetime nonlinear selection. Evolution 64: 1377–1385. [DOI] [PubMed] [Google Scholar]
- Meléndez‐Ackerman, E. J. , and Campbell D. R.. 1998. Adaptive significance of flower color and inter‐trait correlations in an Ipomopsis hybrid zone. Evolution 52: 1293–1303. [DOI] [PubMed] [Google Scholar]
- Mitchell, R. J. 1993. Adaptive significance of Ipomopsis aggregata nectar production: observation and experiment in the field. Evolution 47: 25–35. [DOI] [PubMed] [Google Scholar]
- Navarro, J. , Powers J. M., Paul A., and Campbell D. R.. 2022. Phenotypic plasticity and selection on leaf traits in response to snowmelt timing and summer precipitation. New Phytologist 234: 1477–1490. [DOI] [PubMed] [Google Scholar]
- Opedal, O. H. 2019. The evolvability of animal‐pollinated flowers: towards predicting adaptation to novel pollinator communities. New Phytologist 221: 1128–1135. [DOI] [PubMed] [Google Scholar]
- Opedal, O. H. 2021. A functional view reveals substantial predictability of pollinator‐mediated selection. Journal of Pollination Ecology 30: 273–288. [Google Scholar]
- Porter, J. M. , Johnson L. A., and Wilken D.. 2010. Phylogenetic systematics of Ipomopsis (Polemoniaceae): relationships and divergence times estimated from chloroplast and nuclear DNA sequences. Systematic Botany 35: 181–200. [Google Scholar]
- Powers, J. M. , Briggs H. M., Dickson R., Li X., and Campbell D. R.. 2022. Earlier snowmelt and reduced summer precipitation alter floral traits important to pollination. Global Change Biology 28: 323–339. [DOI] [PubMed] [Google Scholar]
- Raguso, R. A. , and Pichersky E.. 1999. A day in the life of a linalool molecule: chemical communication in a plant–pollinator system. Part 1: Linalool biosynthesis in flowering plants. Plant Species Biology 14: 95–120. [Google Scholar]
- Sage, T. L. , Price M. V., and Waser N. M.. 2006. Self‐sterility in Ipomopsis aggregata (Polemoniaceae) is due to pre‐zygotic ovule degeneration. American Journal of Botany 93: 254–262. [DOI] [PubMed] [Google Scholar]
- Scheepens, J. F. , Frei E. S., and Stöcklin J.. 2010. Genotypic and environmental variation in specific leaf area in a widespread alpine plant after transplantation to different altitudes. Oecologia 164: 141–150. [DOI] [PubMed] [Google Scholar]
- Scheiner, S. M. 1993. Genetics and evolution of phenotypic plasticity. Annual Review of Ecology and Systematics 24: 35–68. [Google Scholar]
- Sloat, L. L. , Henderson A. N., Lamanna C., and Enquist B. J.. 2015. The effect of the foresummer drought on carbon exchange in subalpine meadows. Ecosystems 18: 533–545. [Google Scholar]
- Thomas, C. D. , Cameron A., Green R. E., Bakkenes M., Beaumont L. J., Collingham Y. C., Erasmus B. F. N., et al. 2004. Extinction risk from climate change. Nature 427: 145–148. [DOI] [PubMed] [Google Scholar]
- Villelas, J. , Ehrlen J., Crone E. E., Csergo A. M., Garcia M. B., Laine A., Roach D. A., et al. 2021. Phenotypic plasticity masks range‐wide genetic differentiation for vegetative but not reproductive traits in a short‐lived plant. Ecology Letters 24: 2378–2393. [DOI] [PubMed] [Google Scholar]
- Wolf, P. G. , and Campbell D. R.. 1995. Hierarchical analysis of allozymic and morphometric variation in a montane herb, Ipomopsis aggregata (Polemoniaceae). Journal of Heredity 86: 386–394. [Google Scholar]
- Wu, C. A. , and Campbell D. R.. 2005. Cytoplasmic and nuclear markers reveal contrasting patterns of spatial genetic structure in a natural Ipomopsis hybrid zone. Molecular Ecology 14: 781–792. [DOI] [PubMed] [Google Scholar]
- Wu, C. A. , and Campbell D. R.. 2006. Environmental stressors differentially affect leaf ecophysiological responses in two Ipomopsis species and their hybrids. Oecologia (Berlin) 148: 202–212. [DOI] [PubMed] [Google Scholar]
- Zu, P. , Blanckenhorn P. Z., and Schiestl F. P.. 2016. Heritability of floral volatiles and pleiotropic responses to artificial selection in Brassica rapa . New Phytologist 209: 1208–1219. [DOI] [PubMed] [Google Scholar]
- Zu, P. , Schiestl F. P., Gervasi D., Li X., Runcie D., and Guillaume F.. 2020. Floral signals evolve in a predictable way under artificial and pollinator selection in Brassica rapa . BMC Evolutionary Biology 127: 127. [DOI] [PMC free article] [PubMed] [Google Scholar]
Associated Data
This section collects any data citations, data availability statements, or supplementary materials included in this article.
Supplementary Materials
Appendix S1. Supplementary methods and results, table (Table S1), and figures (Figure S1, S2, and S3) for characterizing developmental patterns in floral volatile emissions.
Data Availability Statement
The data are deposited in the Dryad Digital Repository: https://doi.org/10.7280/D1QD7M (Campbell et al., 2022).