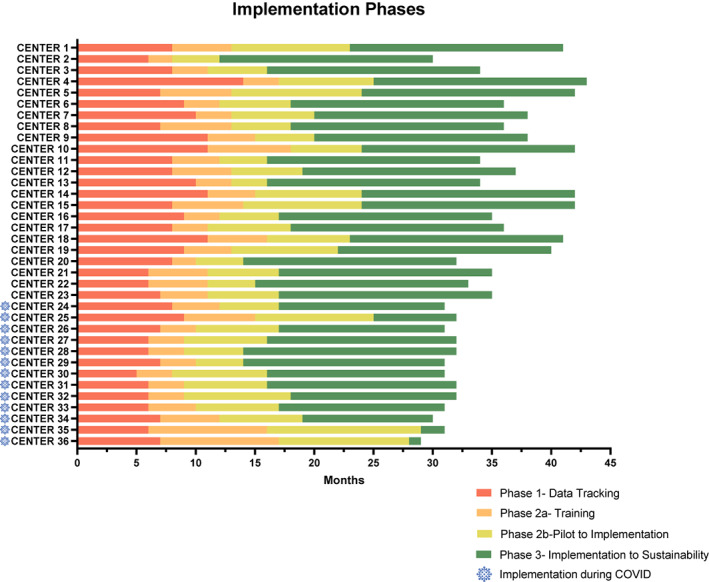
FIGURE 2.

The Proyecto EVAT PEWS implementation phases. This graph describes the time required for each collaborating center to move through the PEWS implementation phases, with the x‐axis representing time and the y‐axis indicating the 36 Proyecto EVAT centers. Centers that completed PEWS implementation after March 2020 (during the COVID pandemic) are marked with the blue COVID symbol. The phases described are as follows: phase 1 (red), time from the start of prospective tracking of clinical deterioration events to completing all necessary adaptation to implement PEWS; phase 2a (orange), time from the start of PEWS training to the start of the PEWS pilot; phase 2b (yellow), pilot start to implementation completion; and phase 3 (green), implementation completion to October 2021 (maximum, 18 months of postimplementation data collection). COVID indicates coronavirus disease; KTA, knowledge‐to‐action; PEWS, pediatric warning systems; Proyecto EVAT, the Early Warning Assessment Scale Project.
