Abstract
Colon cancer is a common malignant tumor. However, its pathogenesis still needs further study. In this study, we explored the role of nucleosome assembly protein 1-like 1 (NAP1L1) in colon cancer and its underlying mechanism. Based on analysis of The Cancer Genome Atlas data, we found that NAP1L1 is augmented in colorectal cancer, and the elevated NAP1L1 expression is associated with a poor prognosis in patients with colon cancer. Immunohistochemistry staining results showed that upregulated NAP1L1 protein level is an unfavorable factor that stimulates colon cancer progression. To further investigate the role of NAP1L1 in colon cancer, we established a colon cancer cell line with NAP1L1 knockdown, and found that repressing NAP1L1 expression in colon cancer cells markedly reduces cell proliferation in vivo and in vitro by MTT assay, colony formation, EdU incorporation, and subcutaneous tumorigenesis in nude mice. Furthermore, we found that NAP1L1 binds to HDGF, recruits DDX5, and induces β-catenin/CCND1 signaling, which promotes colon cancer cell proliferation. Finally, transfection with HDGF or DDX5restores cell growth in NAP1L1-knockdown colon cancer cells by upregulating DDX5/β-catenin/CCND1 signaling. Our study demonstrates that NAP1L1 functions as a potential oncogene that promotes colon cancer tumorigenesis by binding to HDGF, which stimulates DDX5/β-catenin/CCND1 signaling.
Keywords: NAP1L1, HDGF, DDX5, colon cancer, β-catenin/ CCND1 signaling
Introduction
Colon cancer is developed from adenomatous or glandular polyps in the colon and rectum that become malignant. It is one of the most common forms of cancer and a leading cause of mortality, only second to lung cancer [ 1– 5] . People with a family history of cancer or intestinal polyps are at greater risk for this disease, and the probability of developing colon cancer in these patients increases with age [ 6– 8] . Heavy drinking, cigarette smoking, and lack of physical exercise also increase the risk for colon cancer, along with a diet low in fruit, vegetables, fish, and poultry and/or high in red meat [ 9– 12] . These factors, alone or in combination, promote the expression of colorectal cancer-related gene variants [ 13– 16] , which leads to the development of colon cancer [ 17, 18] .
The nucleosome assembly protein 1-like 1 ( NAP1L1) gene is located on 12q21.1 and encodes the NAP1L1 protein. This gene is conserved in chimpanzees, Rhesus monkeys, dogs, cows, mice, rats, chickens, zebrafish, and fruit flies. It is estimated that 235 organisms have orthologs with the human NAP1L1gene [19]. In recent years, several studies have proposed that NAP1L1 is a potential tumor oncogene; however, its role and detailed molecular basis in colon cancer are still unclear.
In this study, overexpression of NAP1L1 was found to be an unfavorable factor that promotes the pathogenesis and poor prognosis of colon cancer. The significance of the NAP1L1 gene in colon cancer is linked to the binding of NAP1L1 with hepatoma-derived growth factor (HDGF ), which stimulates the DEAD-box helicase (DDX5)/β-catenin/cyclin D1 ( CCND1) signaling.
Materials and Methods
Cell culture
Colon cancer cell lines (SW620 and HT29) were obtained from the Cell Bank of Type Culture Collection (Shanghai Institute of Biochemistry and Cell Biology, Chinese Academy of Sciences, Shanghai, China), cultured in Dulbecco’s modified Eagle’s medium (DMEM; HyClone, Logan, USA) supplemented with 10% fetal bovine serum (FBS) (PAN-Biotech, Aidenbach, Germany). Cell lines were incubated in a humidified chamber with 5% CO 2 at 37°C.
Immunohistochemistry assay
Tissue arrays (Shanghai Tufei Biotech Co., Shanghai, China) were utilized to examine NAP1L1 protein expression by indirect streptavidin-peroxidase method [20]. Cell staining was scored separately by two pathologists, who were blinded to the clinical parameters. The extent of staining, defined as the percentage of positively stained tumor cells in relation to the whole tissue area, was scored on a scale of 0–4 as follows: 0, <10%; 1, 10%–25%; 2, 26%–50%; 3, 50%–75%; and 4, >75%. Staining intensity was scored from 0–3 as follows: 0, negative; 1, weak expression; 2, positive expression; and 3, strong expression. The sum of the staining intensity and staining extent scores was used as the final staining score for NAP1L1. For statistical analysis, final staining scores of 0–5 and 6–7 were considered as low expression and high expression, respectively.
Cell transfection
Lentiviral particles carrying shRNA-NAP1L1 or shRNA-NC were designed and constructed by GeneChem (Shanghai, China). The colon cancer cells were then transfected with shRNA-NAP1L1 or shRNA-NC, and the transfection efficiencies were evaluated by reverse transcription-quantitative polymerase chain reaction (RT-qPCR) and western blot analysis to evaluate the NAP1L1 expression. Plasmids were purchased from Vigene Biosciences (Jinan, China), and siRNAs were designed and synthesized by Guangzhou RiboBio (Guangzhou, China). Before transfection, exponentially growing cells were seeded in a cell culture plate or dish (Wuxi NEST Biotechnology, Wuxi, China). Plasmids and siRNAs were then transfected into the cells using Lipofectamine TM 2000 (Invitrogen, Carlsbad, USA) according to the manufacturer’s protocol. Cells were collected 48–72 h after transfection for further experimentation. The sequence information of shRNAs are shown in Supplementary Table S1.
MTT assay
Cell proliferation was determined by MTT assay. Cells were seeded in 96-well plates at a density of 3000 cells/well. After transient transfections, cells were cultured for 1, 2, 3, or 4 days. After incubation, 20 μL of MTT solution (5 mg/mL; Sigma-Aldrich, St Louis, USA) was added to each well and incubated for 4 h. The supernatants were removed at the end of the incubation, and 150 μL dimethyl sulfoxide (DMSO; Sigma-Aldrich) was added. The absorbance of each well was measured at 490 nm with a microplate reader. The calculated rates were then used for curve-fitting calculations. All assays were performed independently three times.
Colony formation and 5-ethynyl-2′-deoxyuridine (EdU) incorporation assay
For the colony formation assay, cells were plated in 6-well plates at a density of 200 cells/well. The medium was refreshed after 24 h of incubation. Colonies were cultured for 14 days, then fixed with methanol for 10 min, and stained with a hematoxylin solution. The number of colonies containing>50 cells was counted under a microscope (Olympus, Tokyo, Japan).
EdU incorporation assay was performed using the Apollo567 in vitro imaging kit (Guangzhou RiboBio) according to the manufacturer’s protocol. In brief, cells were incubated with 10 mM EdU for 2 h before being fixed with 4% paraformaldehyde, permeabilized with 0.3% Triton X-100, and stained with Apollo fluorescent dyes (Sigma-Aldrich). The cell nuclei were stained with 5 mg/mL of 4′,6-diamidino-2-phenylindole (DAPI) for 10 min. The number of EdU-positive cells in five random fields was counted under a microscope. All assays were independently performed in triplicate.
Flow cytometric analysis
For flow cytometric analysis, 1×10 6 cells were resuspended in DMEM containing 2% FBS, and treated with 5 μg/mL Hoechst 33342 stain (Sigma-Aldrich) for 90 min at 37°C with gentle mixing every 10 min. Cells were washed with ice-cold PBS and then subjected to flow cytometric analysis. Propidium iodide was used to identify dead cells.
Subcutaneous tumorigenesis in nude mice
A total of 5×10 6 logarithmically growing colon cancer cells transfected with shRNA-NAP1L1 and their corresponding controls were injected into the subcutaneous tissues of nude mice (BALB/C, nu/nu, 3–4 weeks-old; Sebiona, Guangzhou, China) ( n=5). The animals were fed with an autoclaved laboratory rodent diet. On the 25th day, tumor tissues were excised and weighed. All animal studies were conducted in accordance with the principles and procedures outlined in the Animal Care and Use Committee of Southern Medical University and were performed in accordance with the National Institute of Health Guide for the Care and Use of Laboratory Animals. The research was approved by the Ethics Committee of Shanghai Tufei Biotech Company (Shanghai, China).
Reverse transcription-quantitative polymerase chain reaction (RT-qPCR)
Total RNA was extracted with the TRIzol reagent (Invitrogen), and complementary DNA (cDNA) was synthesized with the PrimeScript RT reagent Kit (TaKaRa, Dalian, China) according to the manufacturer’s instructions. RT-qPCR was performed in triplicate with the SYBR Premix ExTaq (TaKaRa). Each primer sequence of the genes used in this study is listed in Supplementary Table S2. The fold changes were calculated by using the 2 –∆∆Ct method.
Western blot analysis
Western blot analysis was performed as previously reported [20]. Briefly, the extracted proteins were separated by 10% sodium dodecyl sulfate-polyacrylamide gel electrophoresis (SDS–PAGE) and transferred onto polyvinylidene fluoride (PVDF) membranes (Millipore, Bedford, USA). Antibodies against NAP1L1 (Abcam, Cambridge, UK), CCND1 (Abcam), HDGF (Proteintech, Rosemont, USA), DDX5 (Abcam), β-catenin (CST, Beverly, USA), and GAPDH (Santa Cruz Biotech, Santa Cruz, USA) were used as the primary antibodies. Detection was performed using ECL Plus Western blotting detection reagents (Millipore). The specific protein expression levels of the blots were normalized to that of GAPDH. The information of the antibodies used in this study is listed in Supplementary Table S3.
Immunofluorescence microscopy
Cells were plated on coverslips in 48-well plates and cultured overnight to allow for cell adherence. After fixation with 4% paraformaldehyde and permeabilization with 0.2% Triton X-100, cells were incubated with antibodies. Cells were then counterstained with 0.2 mg/mL DAPI and visualized with a fluorescent confocal microscope (Carl Zeiss, Oberkochen, Germany).
Co-immunoprecipitation assay
Co-immunoprecipitation (Co-IP) was carried out using the Pierce Co-IP Kit (Thermo Fisher Scientific, Waltham, USA) based on the manufacturer’s instructions. The total protein in each cell culture was extracted and quantified. A total of 3 mg of protein in 400 μL of supernatant was incubated with 10 μg of anti-NAP1L1, anti-HDGF (Proteintech), anti-DDX5 (Abcam), or anti-IgG antibodies (Proteintech) for 12 h at 4°C. The beads were then washed, eluted in a sample buffer, and boiled for 10 min at 100°C. The immune complexes were then subjected to western blot analysis, with anti-IgG used as a negative control.
Statistical analysis
Statistical analyses were carried out using the SPSS 26.0 statistical software package (SPSS Inc., Chicago, USA). Data from at least three independent experiments are shown as the mean±standard deviation (SD). The two-tailed Student’s t-test was utilized to compare data between groups. Survival analysis was performed using the Kaplan-Meier method. All statistical tests were two-sided, and a P-value of less than 0.05 was considered statistically significant.
Results
Upregulated NAP1L1 expression is an unfavorable factor in colon cancer
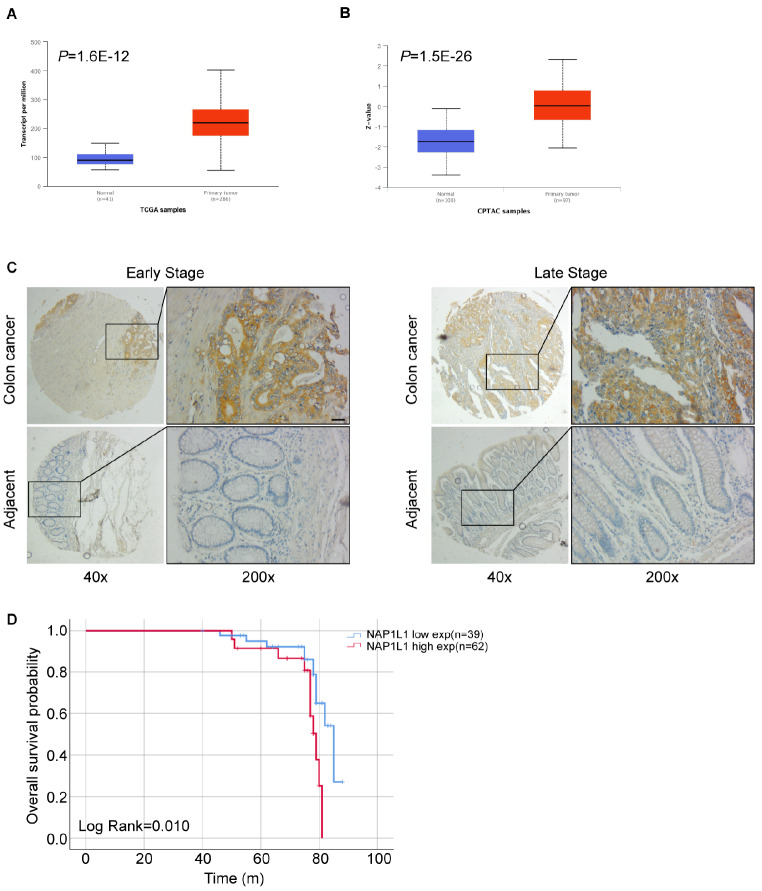
Based on the analysis of The Cancer Genome Atlas (TCGA) database, NAP1L1 mRNA level is obviously increased in colon cancer tissues compared to that in normal tissues ( Figure 1A). Consistent with this result, the Clinical Proteomic Tumor Analysis Consortium (CPTAC) database also demonstrated that NAP1L1 protein expression is upregulated in colon cancer tissues compared to that in normal tissues ( Figure 1B). The immunohistochemistry assay using tissue microarray chips further indicated that NAP1L1 protein expression is elevated in colon cancer tissues compared to that in adjacent tissues in patients with early- and late-stage colon cancer ( Figure 1C). Furthermore, the survival analysis showed that patients with low NAP1L1 expression have better prognoses compared to patients with high NAP1L1 expression ( P=0.01, Figure 1D), which suggests that NAP1L1 is as an unfavorable factor in colon cancer. The clinical features associated are presented in Table 1.
Figure 1 .
NAP1L1 is upregulated in colon cancer and is an unfavorable factor
(A) Analysis of The Cancer Genome Atlas database suggests that NAP1L1 is upregulated in colorectal cancer ( P=1.6×10 –12). (B) Analysis of the Clinical Proteomic Tumor Analysis Consortium database analysis suggests that NAP1L1 protein level is upregulated in colorectal cancer ( P=1.5×10 –26). (C) Immunohistochemistry analyses using tissue microarray chips were performed to detect NAP1L1 protein expression in colon cancer tissues and adjacent tissues in early- and late-stage colon cancer. Scale bar: 200 μm. (D) A Kaplan-Meier survival analysis of the overall survival of 101 patients with colon cancer was performed based on NAP1L1 expression levels ( P=0.01). The log-rank test was used to calculate P-values.
Table 1 Correlation between the clinicopathologic characteristics and expression of NAP1L1
|
Characteristics |
Total NAP1L1 expression |
P value |
||
|
Low, n (%) |
High, n (%) |
|||
|
Age (years) |
|
|||
|
≤ 60 |
13 |
25 |
0.480 |
|
|
>60 |
26 |
37 |
|
|
|
Gender |
|
|||
|
Male |
19 |
29 |
0.849 |
|
|
Female |
20 |
33 |
|
|
|
AJCC stage |
|
|||
|
I–II |
18 |
29 |
0.951 |
|
|
III–IV |
21 |
33 |
|
|
|
T classification |
|
|||
|
T1–T2 |
4 |
6 |
0.924 |
|
|
T3–T4 |
35 |
56 |
|
|
|
N classification |
|
|||
|
N0 |
23 |
40 |
0.576 |
|
|
N1 |
16 |
22 |
|
|
|
Distant metastasis |
|
|||
|
No |
26 |
41 |
0.956 |
|
|
Yes |
13 |
21 |
|
|
|
Recurrence |
|
|||
|
No |
26 |
47 |
0.318 |
|
|
Yes |
13 |
15 |
|
|
|
Infiltration depth |
|
|||
|
Mucosa |
4 |
6 |
0.924 |
|
|
Serosal Layer |
35 |
56 |
|
NAP1L1 downregulation inhibits cell proliferation and cell cycle transition
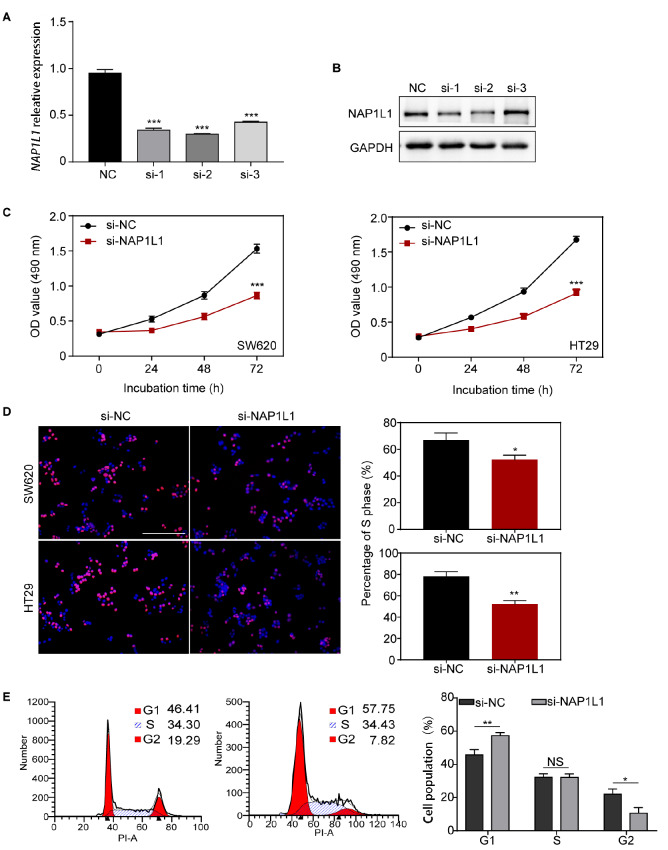
Three different siRNAs that target NAP1L1 (siRNA-1, siRNA-2, and siRNA-3) were separately transfected into colon cancer cells. The suppression efficiency of NAP1L1 was detected by qRT-PCR and western blot analysis ( Figure 2A,B). Results showed that siRNA-1 and siRNA-2 significantly repressed the expression of NAP1L1 at both mRNA and protein levels, whereas siRNA-3 only repressed NAP1L1mRNA expression. MTT analysis showed that si- NAP1L1 significantly decreased cell viability in the SW620 and HT29 cells ( Figure 2C). EdU incorporation assay indicated that cell proliferation ability was significantly reduced in the si-NAP1L1 group compared to the negative controls ( Figure 2D).
Figure 2 .
si-NAP1L1 inhibited cell proliferation and cell-cycle transition in vitro
(A,B) RT-qPCR and western blot analysis were used to detect NAP1L1 expression after si- NAP1L1 transfection. *** P<0.001. (C) MTT assay was used to detect cell viability after si-NAP1L1 transfection. *** P<0.001. (D) EdU incorporation assay was conducted to detect cell proliferation ability after si-NAP1L1 transfection. * P<0.05, ** P<0.01. Scale bar: 100 μm. (E) Cell cycles of cells transfected with si-NC or si-NAP1L1. NS: no significance, * P<0.05, ** P<0.01.
Flow cytometry was used to determine whether si-NAP1L1 affects the cell cycle of colon cancer cells. The results demonstrated that si-NAP1L1 transfection resulted in an 11.34% and 0.13% increase in the number of G1-phase ( P<0.01) and S-phase ( P>0.05) cells, respectively. There was also an 11.47% decrease in the number of G2-phase cells ( P<0.05) compared with the negative controls ( Figure 2E). These results suggested that si-NAP1L1 induces cell cycle arrest by blocking cells in the G1 phase, which leads to cell number reduction in the G2 phase. The opposite results were observed when NAP1L1 was overexpressed in colon cancer cells ( Supplementary Figure S1A,B), which demonstrated that si-NAP1L1 decreased cell proliferation by inducing cell cycle arrest.
Stable NAP1L1 knockdown suppresses colon cancer growth in vitro and in vivo, and inhibits β-catenin/CCND1 signaling.
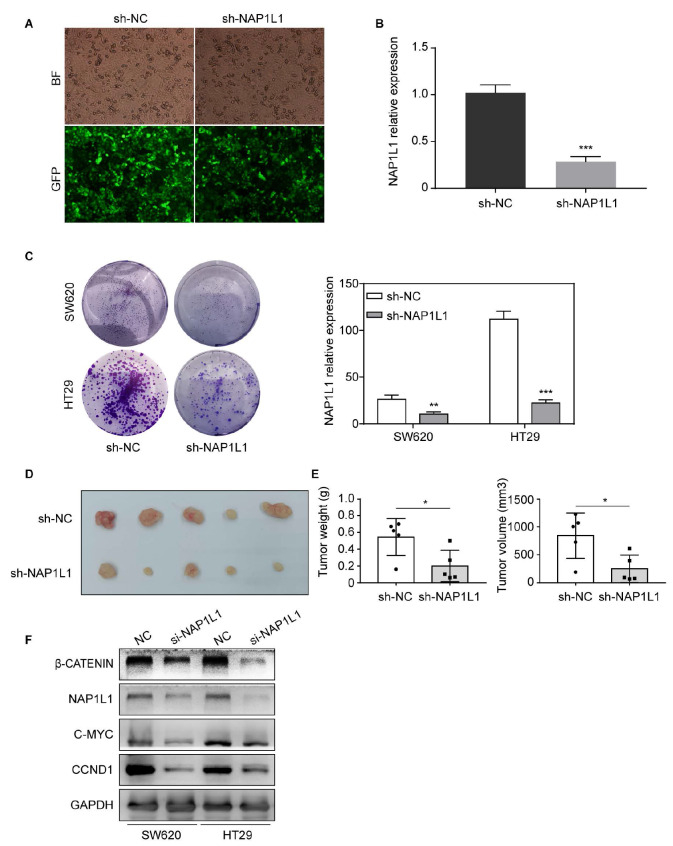
To investigate the role of NAP1L1 in colon cancer, lentivirus carrying shRNA-NAP1L1 were transfected into SW620 and HT29 cells ( Figure 3A). RT-qPCR assays were then used to verify NAP1L1 expression in colon cancer cells compared to their respective controls ( Figure 3B). We subsequently examined the effect of sh-NAP1L1 on colon cancer cell growth by the colony formation assay ( Figure 3C). The results demonstrated that cell colony formation was significantly inhibited in sh-NAP1L1-transfected SW620 and HT29 cells compare to that in controls.
Figure 3 .
Stable knockdown of NAP1L1 suppresses colon cancer growth in vitro and in vivo, and si- NAP1L1inhibits the β-catenin/CCND1 signaling
(A) Images of colon cancer cells transfected with sh-NAP1L1 lentiviral (GFP) were captured after 72 h with a fluorescence microscope. (B) Relative NAP1L1 expression levels were detected by RT-qPCR. *** P<0.001. (C) Colony formation assays were performed after infection with lentiviral particles carrying sh-NAP1L1 precursors or negative control. ** P<0.01, *** P<0.001. (D) Xenograft tumors collected on day 25 after subcutaneous implantation of SW620-NC and SW620-sh- NAP1L1 in nude mice. (E) Tumor volume and weight were measured on Day 25 ( n=5). * P<0.05. (F) β-Catenin, NAP1L1, C-MYC, and CCND1 levels were detected by western blot analysis after transfection with si-NC or si- NAP1L1. GAPDH was used as a loading control.
In vivoexperiments showed that the tumor growth was suppressed in nude mice subcutaneous inoculated with sh-NAP1L1-transfeted colon cancer cells ( Figure 3D). There was a significant decrease in the average weight and volume of the tumors in the sh-NAP1L1 group compared to the sh-NC group ( Figure 3E). Moreover, western blot analysis results indicated that si-NAP1L1 significantly downregulated β-catenin, C-MYC, and CCND1 protein expressions ( Figure 3F) in both SW620 and HT29 cells. These results suggested that NAP1L1 promotes the growth of colon cancer cells by activating β-catenin/CCND1 signaling.
Direct interaction between NAP1L1 and HDGF
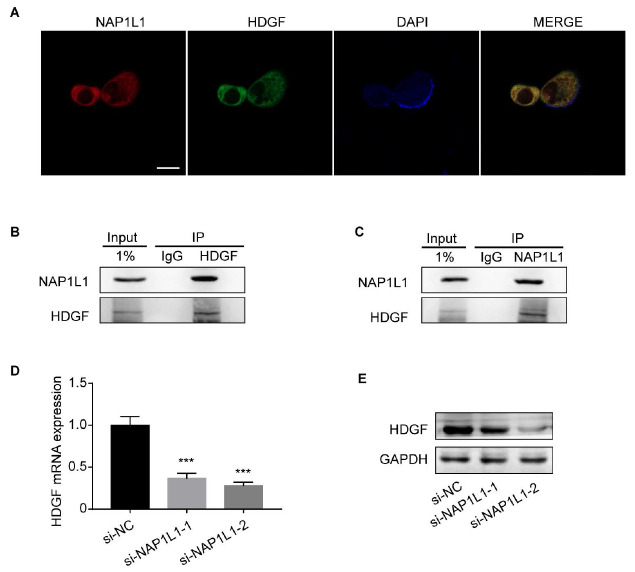
Our previous work demonstrated that NAP1L1 potentially interacts with HDGF in endometrial cancer. To verify whether this interaction also exists in colon cancer, we conducted immunofluorescence and co-IP assays. The immunofluorescence assay demonstrated that NAP1L1 and HDGF proteins co-localize in the nucleus ( Figure 4A), The interaction between NAP1L1 and HDGF is demonstrated in both NAP1L1 -immunoprecipitated and HDGF-immunoprecipitated cells by Co-IP assays ( Figure 4B,C).
Figure 4 .
Direct interaction of NAP1L1 and HDGF
(A) Immunofluorescence microscopy of NAP1L1, HDGF, and DAPI localization in colon cancer cells. Scale bar: 25 μm. (B,C) Co-IP assays were performed to examine the interaction between NAP1L1 and HDGF. Lysates were immunoprecipitated with anti-HDGF/anti-NAP1L1 antibodies or control IgG, and detected by western blot analysis using anti-NAP1L1 antibodies. (D) HDGF mRNA expression after si-NAP1L1-1/si-NAP1L1-2 transfection, normalized with ADP Ribosylation Factor 5. One-way ANOVA and Dunnett multiple comparison test. *** P<0.001. (E) HDGF protein expression after si-NAP1L1-1/si-NAP1L1-2 transfection. GAPDH was used as a loading control.
Next, we measured HDGF mRNA and protein levels in NAP1L1-knockdown cells. Our results confirmed that HDGF mRNA ( Figure 4D) and protein ( Figure 4E) expressions were downregulated after si- NAP1L1-1 and si- NAP1L1-2 transfection. The downregulation was more significant in the si- NAP1L1-2-transfected group. Together, these results indicated that NAP1L1 interacts with HDGF and promotes its expression.
NAP1L1 interacts with HDGF to recruit DDX5
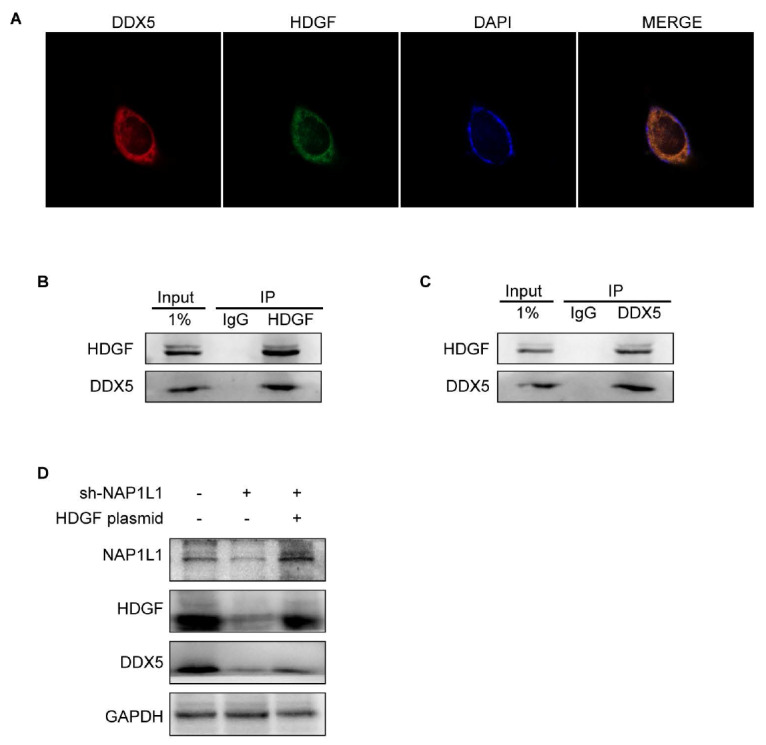
In a previous study, Fu et al. [21] reported that HDGF interacts with DDX5 in lung cancer cells. We confirmed this finding by immunofluorescence microscopy ( Figure 5A) and co-IP assay ( Figure 5B,C) assays. Consistent with previous research, our results demonstrated that HDGF interacts with DDX5, and both are co-localized in the nucleus.
Figure 5 .
NAP1L1 interacts with HDGF to recruit DDX5
(A) Immunofluorescence microscopy of HDGF, DDX5, and DAPI localization in colon cancer cells. Scale bar: 25 μm. (B,C) co-IP assay was performed to examine the interaction between DDX5 and HDGF. Lysates were immunoprecipitated with anti-HDGF/anti-DDX5 antibodies or control IgG, and detected by western blot analysis using anti-HDGF antibodies. (D) Expressions of NAP1L1, HDGF, and DDX5 were detected after transfection with sh-NAP1L1 with/without the HDGF overexpression plasmid. GAPDH was used as a loading control.
To further explore the regulatory mechanisms of NAP1L1, HDGF, and DDX5, we transfected HDGF overexpression plasmids into sh-NAP1L1-transfected cells. The results showed that DDX5 was downregulated in sh-NAP1L1-transfected cells, and this downregulation was rescued after HDGF overexpression ( Figure 5D). Altogether, these results indicated that NAP1L1 interacts with HDGF to recruit DDX5.
Transfecting HDGF/DDX5 overexpression plasmids into sh-NAP1L1 cells activates DDX5/β-catenin/CCND1 signaling and restores cell growth
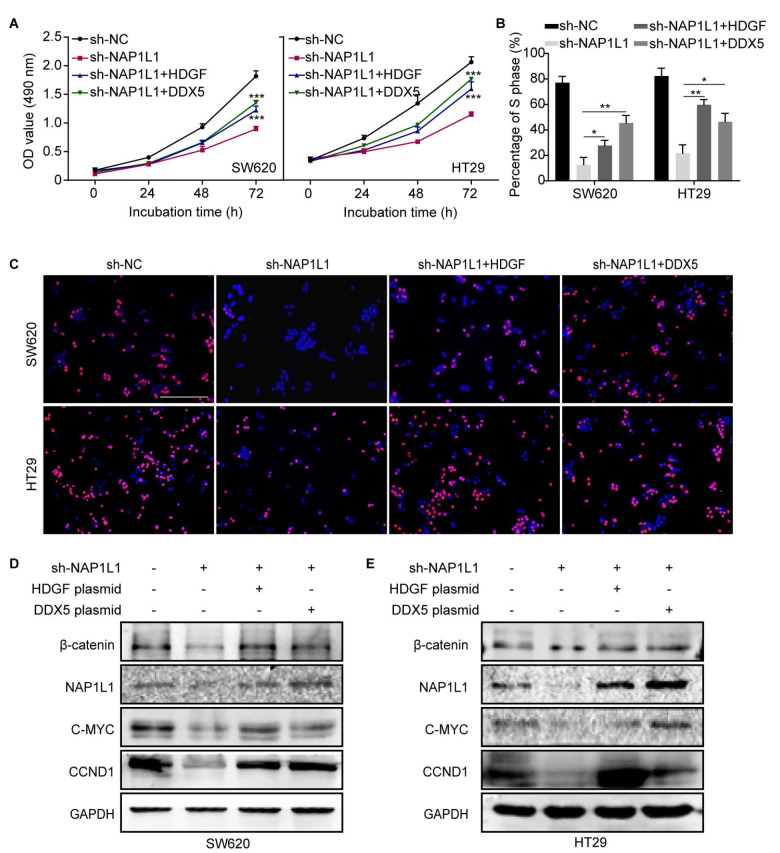
It was reported that DDX5 forms a complex with β-catenin to promote gene transcription [ 21, 22] . To explore the role of HDGF and DDX5 in the NAP1L1-mediated pathogenesis of colon cancer, HDGF or DDX5 overexpression plasmids was transfected into NAP1L1-knockdown cells. The results of the CCK8 and EdU incorporation assays showed that both HDGF and DDX5 can partially restore the cell proliferation ( Figure 6A–C) compared to the sh-NAP1L1 group. Western blot analysis also indicated that β-catenin, C-MYC, and CCND1 expressions were restored in the HDGF /DDX5+sh-NAP1L1 group compared to those in the sh-NAP1L1 group ( Figure 6D,E). These results indicated that NAP1L1 knockdown suppresses colon cancer cell proliferation and inhibits β-catenin signaling through the HDGF/DDX5 signal axis.
Figure 6 .
HDGF/DDX5 activates DDX5/β-catenin/CCND1 signaling and restores cell growth in sh-NAP1L1-transfected cells
(A) MTT assays were conducted after transfection of SW620 and HT29 cells with sh-NC, sh-NAP1L1, sh-NAP1L1 with an HDGF overexpession plasmid, and sh-NAP1L1 with a DDX5 overexpression plasmid. *** P<0.001. (B,C) EdU incorporation assays were conducted after transfection of SW620 and HT29 cells with sh-NC, sh-NAP1L1, sh-NAP1L1 with an HDGF overexpression plasmid, and sh-NAP1L1 with a DDX5 overexpression plasmid. * P<0.05, ** P<0.01. Scale bar: 100 μm. (D,E) Expressions of β-catenin, NAP1L1, C-MYC, and CCND1 were detected by western blot analysis after transfection with sh-NC, sh-NAP1L1, sh-NAP1L1 with an HDGF overexpression plasmid, and sh-NAP1L1 with a DDX5 overexpression plasmid. GAPDH was used as a loading control.
Discussion
Colon cancer is the third most common form of cancer worldwide. It seriously endangers human health; however, its pathogenesis needs to be clarified further. In previous studies, our group used co-IP assays and mass spectrometry to screen HDGF as a potential interacting protein in endometrial cancer (data not published). The UALCAN website ( http://ualcan.path.uab.edu/) also suggests that NAP1L1 mRNA and protein levels are significantly upregulated in colon cancer. Therefore, we selected this gene and examined its correlation with colon cancer and interaction with HDGF.
We initially used immunohistochemistry to confirm that NAP1L1 protein expression is upregulated in colon cancer tissues compared to normal tissues. Our results suggest that NAP1L1 may be involved in the pathogenesis of colon cancer. To further elucidate the role of NAP1L1 in colon cancer, we analyzed the correlation of NAP1L1 protein expression with the clinical features and prognosis of patients with colon cancer. The survival analysis demonstrated that patients with low NAP1L1 expression have better prognoses than patients with high NAP1L1expression, suggesting that NAP1L1 may serve as a potential oncogene in colon cancer. The role of NAP1L1 and its molecular basis in colon cancer remain unreported.
In a subsequent study, we constructed colon cancer cells with stably suppressed and transiently repressed NAP1L1 expression. The data showed that suppression of NAP1L1 expression significantly inhibits cell cycle progression and cell growth in vivo and in vitro. These results are consistent with the results in other studies on hepatocellular carcinoma [ 23, 24] and renal cancer [25], further supporting NAP1L1’s oncogenic role in colon cancer.
β-catenin/ CCND1 is a known promoter of cancer cell cycle transition and proliferation. In this study, we initially observed that knockdown of NAP1L1 reduced the activation of β-catenin/CCND1 signaling. To further investigate the molecular basis of the modulatory effect of NAP1L1 on the β-catenin/CCND1 signaling, we examined the NAP1L1-interacting protein profile in endometrial cancer provided by Prof. Fang (Southern Medical University, Guangzhou, China). The data showed that HDGF potentially binds to NAP1L1. In a subsequent study, we used co-IP assays to confirm that NAP1L1 binds to HDGF in colon cancer cells. We also demonstrated that NAP1L1 and HDGF are co-localized in the nucleus and cytoplasm of colon cancer cells.
HDGF encodes a heparin-binding protein. It was originally puri-fied from the conditioned media of HuH-7 hepatoma cells [26]. Elevated HDGF protein level has been detected in various types of malignancies [27], such as gastric cancer [28], lung adenocarcinoma [29], and breast cancer [30]. It plays a key role in promoting tumorigenesis.
DDX5 encodes a member of the DEAD-box family of RNA helicases that are involved in a variety of cellular processes. In previous studies, upregulation of DDX5 was found to be an unfavorable factor that promotes tumorigenesis in breast cancer [30] and other human malignancies [31].
Interestingly, our previous study demonstrated that the binding of HDGF with DDX5 activated β-catenin in endometrial cancer [32]. Therefore, we also speculated that NAP1L1 may positively regulate β-catenin/CCND1 signaling by interacting with the HDGF/DDX5 complex. Unsurprisingly, the results demonstrated that β-catenin/CCND1 signaling was obviously restored in stable NAP1L1-knockdown colon cancer cells that were transfected with HDGF- or DDX5 overexpression plasmids. Cell growth ability was also obviously restored in these cells.
In summary, our results demonstrate that NAP1L1 is significantly upregulated in colon cancer cells, which identifies it as an unfavorable factor. NAP1L1 also interacts with HDGF to recruit DDX5, which activates β-catenin/CCND1 signaling and promotes colon cancer growth. NAP1L1 acts as a potential oncogene in the pathogenesis of colon cancer.
Supplementary Data
Supplementary Data is available at Acta Biochimica et Biphysica Sinica online.
COMPETING INTERESTS
The authors declare that they have no conflict of interest.
Funding Statement
This work was supported by the grant from the Overseas Talent Workstation Program founded by the Guangdong Provincial Department of Finance in 2021 (No. B71203).
References
- 1.Garrett WS. The gut microbiota and colon cancer. Science. . 2019;364:1133–1135. doi: 10.1126/science.aaw2367. [DOI] [PubMed] [Google Scholar]
- 2.Vasaikar S, Huang C, Wang X, Petyuk VA, Savage SR, Wen B, Dou Y, et al. Proteogenomic analysis of human colon cancer reveals new therapeutic opportunities. Cell. . 2019;177:1035–1049.e19. doi: 10.1016/j.cell.2019.03.030. [DOI] [PMC free article] [PubMed] [Google Scholar]
- 3.Chen JK, Yaffe MB. Atlas drugged. Cell. . 2019;177:803–805. doi: 10.1016/j.cell.2019.04.023. [DOI] [PubMed] [Google Scholar]
- 4.Click B, Pinsky PF, Hickey T, Doroudi M, Schoen RE. Association of colonoscopy adenoma findings with long-term colorectal cancer incidence. JAMA. . 2018;319:2021. doi: 10.1001/jama.2018.5809. [DOI] [PMC free article] [PubMed] [Google Scholar]
- 5.Siegel RL, Miller KD, Fedewa SA, Ahnen DJ, Meester RGS, Barzi A, Jemal A. Colorectal cancer statistics, 2017. CA-Cancer J Clin. . 2017;67:177–193. doi: 10.3322/caac.21395. [DOI] [PubMed] [Google Scholar]
- 6.Crockett SD. Sessile serrated polyps and colorectal cancer. JAMA. . 2017;317:975. doi: 10.1001/jama.2017.0538. [DOI] [PMC free article] [PubMed] [Google Scholar]
- 7.Dejea CM, Fathi P, Craig JM, Boleij A, Taddese R, Geis AL, Wu X, et al. Patients with familial adenomatous polyposis harbor colonic biofilms containing tumorigenic bacteria. Science. . 2018;359:592–597. doi: 10.1126/science.aah3648. [DOI] [PMC free article] [PubMed] [Google Scholar]
- 8.Kolb JM, Molmenti CL, Patel SG, Lieberman DA, Ahnen DJ. Increased risk of colorectal cancer tied to advanced colorectal polyps: an untapped opportunity to screen first-degree relatives and decrease cancer burden. Am J Gastroenterol. . 2020;115:980–988. doi: 10.14309/ajg.0000000000000639. [DOI] [PMC free article] [PubMed] [Google Scholar]
- 9.Hofseth LJ, Hebert JR, Chanda A, Chen H, Love BL, Pena MM, Murphy EA, et al. Early-onset colorectal cancer: initial clues and current views. Nat Rev Gastroenterol Hepatol. . 2020;17:352–364. doi: 10.1038/s41575-019-0253-4. [DOI] [PMC free article] [PubMed] [Google Scholar]
- 10.Song M, Chan AT, Sun J. Influence of the gut microbiome, diet, and environment on risk of colorectal cancer. Gastroenterology. . 2020;158:322–340. doi: 10.1053/j.gastro.2019.06.048. [DOI] [PMC free article] [PubMed] [Google Scholar]
- 11.Wang L, Lo CH, He X, Hang D, Wang M, Wu K, Chan AT, et al. Risk factor profiles differ for cancers of different regions of the colorectum. Gastroenterology. . 2020;159:241–256.e13. doi: 10.1053/j.gastro.2020.03.054. [DOI] [PMC free article] [PubMed] [Google Scholar]
- 12.Yang J, Yu J. The association of diet, gut microbiota and colorectal cancer: what we eat may imply what we get. Protein Cell. . 2018;9:474–487. doi: 10.1007/s13238-018-0543-6. [DOI] [PMC free article] [PubMed] [Google Scholar]
- 13.Guo X, Lin W, Wen W, Huyghe J, Bien S, Cai Q, Harrison T, et al. Identifying novel susceptibility genes for colorectal cancer risk from a transcriptome-wide association study of 125,478 subjects. Gastroenterology. . 2021;160:1164–1178.e6. doi: 10.1053/j.gastro.2020.08.062. [DOI] [PMC free article] [PubMed] [Google Scholar]
- 14.Innocenti F, Sibley AB, Patil SA, Etheridge AS, Jiang C, Ou FS, Howell SD, et al. Genomic analysis of germline variation associated with survival of patients with colorectal cancer treated with chemotherapy plus biologics in CALGB/SWOG 80405 (Alliance) Clin Cancer Res. . 2021;27:267–275. doi: 10.1158/1078-0432.CCR-20-2021. [DOI] [PMC free article] [PubMed] [Google Scholar]
- 15.Sanz-Pamplona R, Melas M, Maoz A, Schmit SL, Rennert H, Lejbkowicz F, et al. Lymphocytic infiltration in stage II microsatellite stable colorectal tumors: A retrospective prognosis biomarker analysis. PLoS Med . 2020, 17(9): e1003292 . [DOI] [PMC free article] [PubMed]
- 16.Zheng G, Catalano C, Bandapalli OR, Paramasivam N, Chattopadhyay S, Schlesner M, Sijmons R, et al. Cancer predisposition genes in cancer-free families. Cancers. . 2020;12:2770. doi: 10.3390/cancers12102770. [DOI] [PMC free article] [PubMed] [Google Scholar]
- 17.Yamada A, Komaki Y, Komaki F, Micic D, Zullow S, Sakuraba A. Risk of gastrointestinal cancers in patients with cystic fibrosis: a systematic review and meta-analysis. Lancet Oncol. . 2018;19:758–767. doi: 10.1016/S1470-2045(18)30188-8. [DOI] [PubMed] [Google Scholar]
- 18.Papadimitriou N, Dimou N, Tsilidis KK, Banbury B, Martin RM, Lewis SJ, Kazmi N, et al. Physical activity and risks of breast and colorectal cancer: a mendelian randomisation analysis. Nat Commun. . 2020;11:597. doi: 10.1038/s41467-020-14389-8. [DOI] [PMC free article] [PubMed] [Google Scholar]
- 19.Okuwaki M, Kato K, Nagata K. Functional characterization of human nucleosome assembly protein 1-like proteins as histone chaperones. Genes Cells. . 2010;15:13–27. doi: 10.1111/j.1365-2443.2009.01361.x. [DOI] [PubMed] [Google Scholar]
- 20.Roth J, Saremaslani P, Zuber C. Versatility of anti-horseradish peroxidase antibody-gold complexes for cytochemistry and in situ hybridization: preparation and application of soluble complexes with streptavidin-peroxidase conjugates and biotinylated antibodies. Histochemistry. . 1992;98:229–236. doi: 10.1007/BF00271036. [DOI] [PubMed] [Google Scholar]
- 21.Shin S, Rossow KL, Grande JP, Janknecht R. Involvement of RNA helicases p68 and p72 in colon cancer. Cancer Res. . 2007;67:7572–7578. doi: 10.1158/0008-5472.CAN-06-4652. [DOI] [PubMed] [Google Scholar]
- 22.Zhang M, Weng W, Zhang Q, Wu Y, Ni S, Tan C, Xu M, et al. The lncRNA NEAT1 activates Wnt/β-catenin signaling and promotes colorectal cancer progression via interacting with DDX5. J Hematol Oncol. . 2018;11:113. doi: 10.1186/s13045-018-0656-7. [DOI] [PMC free article] [PubMed] [Google Scholar]
- 23.Chen Z, Gao W, Pu L, Zhang L, Han G, Zuo X, Zhang Y, et al. PRDM8 exhibits antitumor activities toward hepatocellular carcinoma by targeting NAP1L1. Hepatology. . 2018;68:994–1009. doi: 10.1002/hep.29890. [DOI] [PubMed] [Google Scholar]
- 24.Huang Y, Xiang B, Liu Y, Wang Y, Kan H. LncRNA CDKN2B-AS1 promotes tumor growth and metastasis of human hepatocellular carcinoma by targeting let-7c-5p/NAP1L1 axis. Cancer Lett. . 2018;437:56–66. doi: 10.1016/j.canlet.2018.08.024. [DOI] [PubMed] [Google Scholar]
- 25.Zhai W, Ma J, Zhu R, Xu C, Zhang J, Chen Y, Chen Z, et al. MiR-532-5p suppresses renal cancer cell proliferation by disrupting the ETS1-mediated positive feedback loop with the KRAS-NAP1L1/P-ERK axis. Br J Cancer. . 2018;119:591–604. doi: 10.1038/s41416-018-0196-5. [DOI] [PMC free article] [PubMed] [Google Scholar]
- 26.Nakamura H, Kambe H, Egawa T, Kimura Y, Ito H, Hayashi E, Yamamoto H, et al. Partial purification and characterization of human hepatoma-derived growth factor. Clinica Chim Acta. . 1989;183:273–284. doi: 10.1016/0009-8981(89)90361-6. [DOI] [PubMed] [Google Scholar]
- 27.Zhao J, Ma MZ, Ren H, Liu Z, Edelman MJ, Pan H, Mao L. Anti-HDGF targets cancer and cancer stromal stem cells resistant to chemotherapy. Clin Cancer Res. . 2013;19:3567–3576. doi: 10.1158/1078-0432.CCR-12-3478. [DOI] [PMC free article] [PubMed] [Google Scholar]
- 28.Wang Q, Chen C, Ding Q, Zhao Y, Wang Z, Chen J, Jiang Z, et al. METTL3-mediated m 6 A modification of HDGF mRNA promotes gastric cancer progression and has prognostic significance . Gut. . 2020;69:1193–1205. doi: 10.1136/gutjnl-2019-319639. [DOI] [PubMed] [Google Scholar]
- 29.Fu Q, Song X, Liu Z, Deng X, Luo R, Ge C, Li R, et al. miRomics and proteomics reveal a miR-296-3p/PRKCA/FAK/Ras/c-Myc feedback loop modulated by HDGF/DDX5/β-catenin complex in lung adenocarcinoma. Clin Cancer Res. . 2017;23:6336–6350. doi: 10.1158/1078-0432.CCR-16-2813. [DOI] [PubMed] [Google Scholar]
- 30.Hashemi V, Masjedi A, Hazhir‐karzar B, Tanomand A, Shotorbani SS, Hojjat‐Farsangi M, Ghalamfarsa G, et al. The role of DEAD‐box RNA helicase p68 (DDX5) in the development and treatment of breast cancer. J Cell Physiol. . 2019;234:5478–5487. doi: 10.1002/jcp.26912. [DOI] [PubMed] [Google Scholar]
- 31.Nyamao RM, Wu J, Yu L, Xiao X, Zhang FM. Roles of DDX5 in the tumorigenesis, proliferation, differentiation, metastasis and pathway regulation of human malignancies. Biochim Biophys Acta Rev Cancer. . 2019;1871:85–98. doi: 10.1016/j.bbcan.2018.11.003. [DOI] [PubMed] [Google Scholar]
- 32.Liu C, Wang L, Jiang Q, Zhang J, Zhu L, Lin L, Jiang H, et al. Hepatoma-derived growth factor and DDX5 promote carcinogenesis and progression of endometrial cancer by activating β-catenin. Front Oncol. . 2019;9:211. doi: 10.3389/fonc.2019.00211. [DOI] [PMC free article] [PubMed] [Google Scholar]


