

Abstract
Amino acid biosynthesis initiates with the reductive amination of α‐ketoglutarate with ammonia to produce glutamate. However, the other α‐keto acids derived from the glyoxylate and Krebs cycles are converted into amino acids by transamination, rather than by reductive amination. Why is only one amino acid synthesized by reductive amination and not the others? To explore this question, we quantified the inherent reactivities of keto acids in nonenzymatic reduction and reductive amination by using BH3CN− as a model nucleophile. Biological α‐keto acids were found to show pronounced nonenzymatic reactivity differences for the formation of amino acids (α‐ketoglutarate<oxaloacetate≈pyruvate≪glyoxylate). Accordingly, the flow of ammonia passes through the least reactive α‐keto acid of the Krebs cycle. One possible explanation for this choice is the position of the corresponding amino acid, glutamate, at the top of the thermodynamic landscape for subsequent transamination reactions.
Keywords: Amino Acids, Hydride Transfer, Kinetics, Metabolism, Reductive Amination
Why does biochemical amino acid synthesis proceed the way it does? Kinetic and mechanistic experiments with a model hydride donor were used to determine the intrinsic electrophilic reactivities of keto acids in reduction and reductive amination reactions. Comparing the nonenzymatic reactivity trends with those found in biology provides new insight into the structure of amino acid metabolism.
Introduction
Biological metabolism exhibits a number of regularities whose origins remain unexplained. Ammonia flows into metabolism during amino acid biosynthesis, but this flow is channeled through certain α‐keto acids and not through others; the reasons for which remain unclear. [1] To be specific, in animal tissues and in some bacteria, glutamate is made by direct reductive amination of α‐ketoglutarate with NH4 + and NAD(P)H, catalyzed by glutamate dehydrogenase (Figure 1, blue arrows).[ 1a , 2 ] In plants and most bacteria, the NH4 + for reductive amination of α‐ketoglutarate is indirectly obtained by the hydrolysis of glutamine, catalyzed by glutamate synthase, with the NH4 + then being channeled through the enzyme to a second active site for reductive amination (Figure 1, purple arrows).[ 1a , 3 ] Glutamine is then regenerated from glutamate and NH4 + by glutamine synthase, which consumes ATP. However, although other α‐keto acids, such as glyoxylate, pyruvate, or oxaloacetate, could in principle also undergo reductive amination by dehydrogenase enzymes, this typically does not happen. [4] Instead, synthesis of glycine, alanine, and aspartate from the corresponding keto acids proceeds via transamination reactions using glutamate as an amine donor (Figure 1, red arrows), [1] a reaction that can also proceed in the absence of enzymes catalyzed by abiotic catalysts.[ 5 , 6 ]
Figure 1.
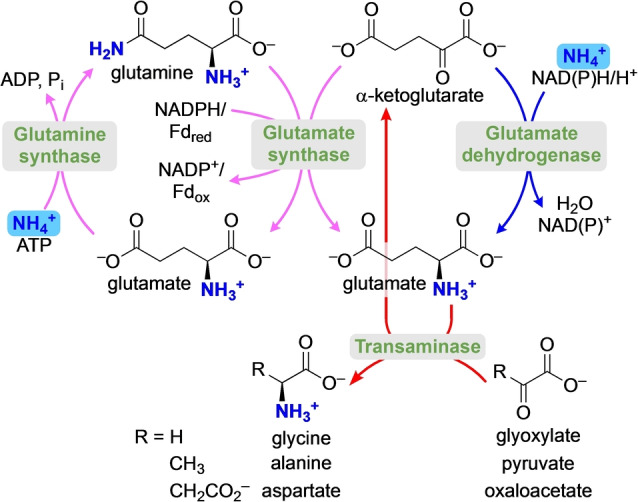
The flow of ammonia in amino acid biosynthesis proceeds through reductive amination for α‐ketoglutarate (blue/purple arrows) but through transamination for pyruvate and oxaloacetate (red arrows).
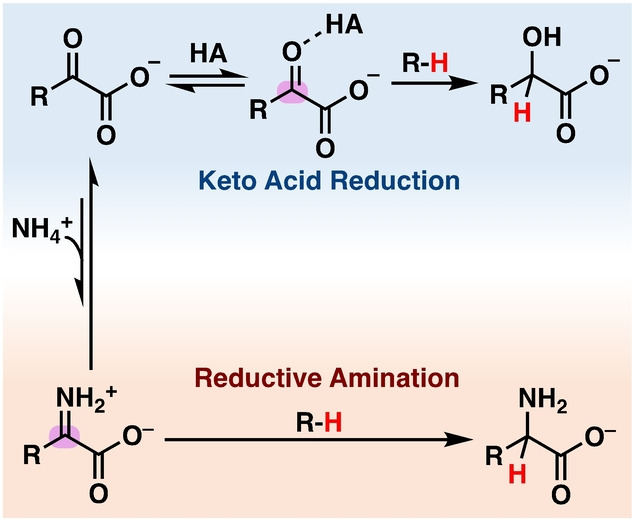
From an evolutionary standpoint, it is not clear why the biochemical selectivity for the reductive amination of α‐ketoglutarate over pyruvate or oxaloacetate emerged. One hypothesis is that underlying nonenzymatic reactivity trends were preserved and amplified by enzymes. However, the underlying reactivity trends for reductive amination of α‐keto acids have not yet been studied. In this work, we thus set out to test whether the preference for a glutamate‐based amino acid synthesis in biology might be derived from inherent selectivity in nonenzymatic reductive amination reactions (Scheme 1).
Scheme 1.
Reduction of ketones or iminium ions (reductive amination) and reducing agents.
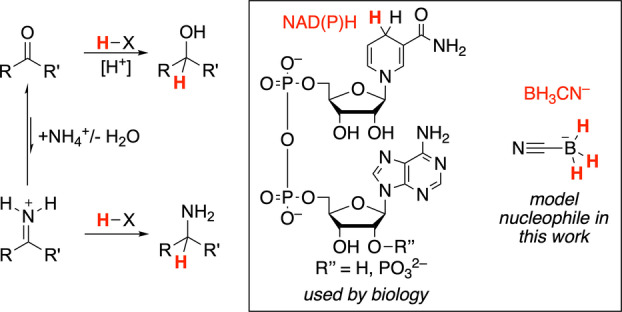
So far, nonenzymatic reductive aminations have been reported under homogeneous [7] or heterogeneous catalysis, [8] photochemistry, [9] electrochemistry, [10] oxidative decarboxylation, [11] and with nucleophilic hydride species.[ 12 , 13 ] While NADH or dihydronicotinamides would be ideal model nucleophiles to investigate the reactivity of keto acids under nonenzymatic conditions, initial experiments showed this to be unfeasible. [14] Outside of enzymes, NADH and dihydronicotinamides do not undergo hydride transfer toward keto acids which can at least in part be attributed to their hydrolysis even under the mildly acidic conditions which are required to activate carbonyl compounds. [15] Additionally, the nonenzymatic reactivity of dihydronicotinamides toward carbonyl groups in water is low and only a few reports exist on their reactions with highly electrophilic species. [16]
To circumvent these issues, we envisioned to apply BH3CN− as a model nucleophile to quantify the relative reactivity of keto acids and the related iminium ions in hydride transfer reactions, as BH3CN− is hydrolytically stable even at acidic pH and known to be a suitable nucleophile for both reduction and reductive amination reactions in water.[ 13 , 17 , 18 ] Previous studies of nucleophile‐electrophile recombinations have shown that relative electrophilic reactivity is independent of the nucleophile. [19] While this assumption has been verified most extensively for carbenium ions and acceptor‐substituted olefins, it is not generally established for nucleophile additions to carbonyl groups in water which might be subject to general catalysis. However, we found that the relative electrophilicities of various ketones determined toward carbanions in DMSO follow the same trends as observed both in their reduction rates with BH4 − in dioxane/water and in their rates of hydration (Figure S1). [20] Furthermore, linear relationships of the rate constants of nucleophile additions in water had previously been reported for different ketones, additionally suggesting that the relative electrophilicities are independent of the nucleophile also for ketones. [20d] Thus, we assume that relative electrophilicities of keto acids and iminium ions observed with BH3CN− should also be somehow reflective of unobstructed nonenzymatic hydride transfer with other nucleophilic hydride species like NAD(P)H.
Using BH3CN− as model nucleophile, we thus set out to investigate the mechanism and to quantify the reactivity trends of the direct reduction of α‐keto acids by means of kinetic measurements and competition experiments as a function of pH and buffer composition. Next, we studied the underlying equilibria of imine and iminium ion formation from keto acids and quantified their reactivity within reductive amination. Lastly, we compared the relative reactivities of all investigated species to test whether fundamental differences in reactivity can explain the biochemical preference for the reductive amination of α‐ketoglutarate.
Results and Discussion
Reduction of α‐Keto Acids
Initially, the products of the reaction of pyruvate with NaBH3CN were studied. NMR spectroscopic analysis of the reaction of pyruvate (K1) with stoichiometric NaBH3CN in aqueous phosphate solution (0.5 M, pH 5) showed the formation of 71 % lactate, hydrogen gas, boric acid, 25 % of cyanohydrin and 4 % unreacted K1 after a reaction time of 18 h (Scheme 2).[ 21 , 22 , 23 ] The formation of cyanohydrin proved to be reversible and consequently the lactate concentration was found to slowly increase over days. At pH 4, however, cyanohydrin formation with K1 was found to be negligibly small and, accordingly, pH 4 was chosen as pH value for our subsequent kinetic studies.
Scheme 2.
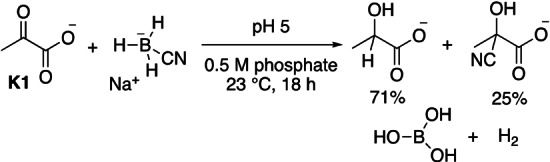
Products of the reaction of K1 with NaBH3CN. See the Supporting Information p. S5 for the spectroscopic analysis.
The kinetics of the reaction of pyruvate with BH3CN− were followed by using UV/Vis spectroscopy to measure the disappearance of the carbonyl absorption band of K1 in acetate buffer at pH 4. By using a large excess of BH3CN− over K1, pseudo‐first order kinetics resulted which allowed to determine the rates k obs. Correlation of k obs with the concentration of [BH3CN−] afforded apparent second‐order rate constants k 2′ (Figure 2A). The rate constants k 2′ are additionally dependent on the concentration of the buffer, implying that the reaction is subject to general acid‐base catalysis (Figure 2B). [24] To allow a consistent comparison of the reduction rates of various keto acids with BH3CN−, the correlation of k 2′ with the buffer concentration was finally used to determine the buffer‐independent second‐order rate constants k 2,0 from the intersection with the ordinate.
Figure 2.
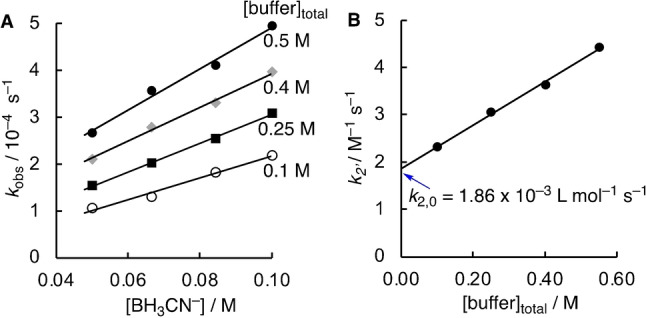
A) Correlations of k obs for the reaction of pyruvate (K1, 5.0 mM) with [BH3CN−] for different concentrations of acetate buffer at pH 4, 20 °C, I=1.0 (NaCl) used to determine k 2′. B) Correlation of k 2′ with the buffer concentration yields k 2,0 as intercept with the ordinate.
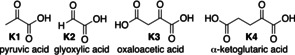
Next, we compared the reactivity of the reduction reaction of different keto acids based on the model reaction with BH3CN− in an analogous way as shown for pyruvate (K1). Table 1 lists the buffer‐independent second order rate constants k 2,0 for the reaction of BH3CN− with the different keto acids K1–K4 at pH 4. To identify the reasons for the observed reactivity differences of K1–K4 and to verify how they hold under different pH and buffer concentrations, initially the pH‐rate profile for the reaction of K1 with BH3CN− was studied (Figure 3A). [25] The observed pH‐dependency could be analyzed by the empirical equation k 0=k w+k H+[H+], where an acid‐dependent reaction (via k H+) dominates at lower pH and is characterized by a slope of −1, while a “water‐catalyzed” background reaction (via k w) takes over at neutral pH. Lastly, we correlated the rate constants k HA for catalysis by the protonated component of the buffer with the corresponding pK a values (Figure 3B). The slope of the resulting Brønsted‐plot of α=−0.49 suggests the involvement of a proton‐transfer during the transition state of the reaction.
Table 1.
Buffer‐independent second‐order rate constants k 2,0 for the reaction of K1–K4 with NaBH3CN at 20 °C, pH 4 and I=1.0 (NaCl).
|
| ||
|---|---|---|
|
Electrophile |
k 2,0 [L mol−1 s−1] |
k 2, rel. [a] |
|
K1 |
(1.86±0.07)×10−3 |
1 |
|
K2 [b] |
(5.57±0.16)×10−3 |
3.0 |
|
K3 |
(1.58±0.07)×10−1 |
85 |
|
K4 |
(3.93±0.10)×10−2 |
21 |
[a] Calculated relative to the rate with K1. [b] Mostly present in the form of the hydrate in aqueous solution.
Figure 3.
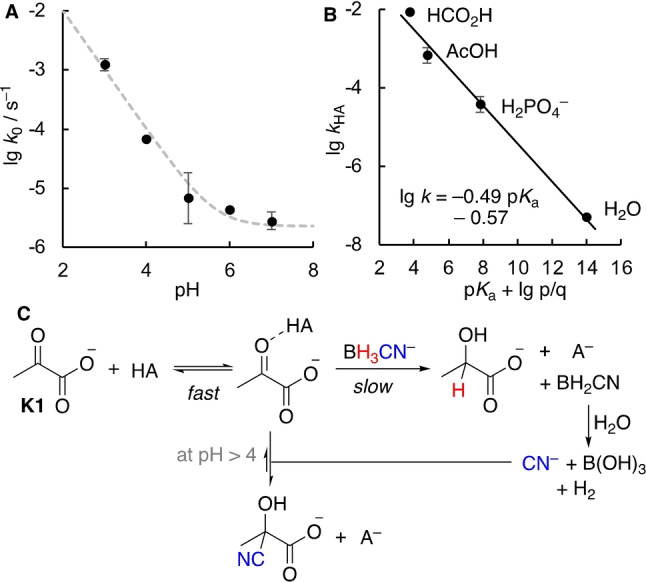
A) pH‐rate profile for the reaction of K1 (5 mM) with NaBH3CN (50 mM) from buffer independent rates k 0. The dashed line corresponds to the fit to the equation k 0=k w+k H+[H+] with k w=(2.73±0.85)×10−6 s−1, k H+=0.78±0.19 M−1 s−1. B) Brønsted plot of lg k HA versus the statistically corrected pK a values. C) Proposed mechanism for the reaction of BH3CN− with K1.
Both the buffer and pH‐dependency as well as the slope observed in the Brønsted plot support a mechanism like the one depicted in Figure 3C that relies on general acid catalysis, in contrast to one proceeding exclusively via specific catalysis. Accordingly, the reaction rate is composed of different terms that will have a different contribution depending on the pH as well as the presence or absence of a buffer species HA [Eq. 1].
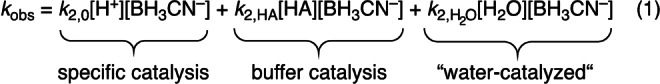
In 0.5 M acetate buffer at pH 4, catalysis by the buffer accounts for 58 % of the reaction rate with the remaining contribution being mostly due to specific catalysis (cf. Figure 2B). In turn, at pH 5 more then 96 % of the reaction rate is due to the buffer‐catalyzed reaction. At neutral pH, specific catalysis is insignificant and the reaction will mostly be due to buffer catalysis and a background reaction enabled by water. General acid catalysis was previously reported for the addition step of sufficiently strong nucleophiles to carbonyls compounds. [26] Furthermore, the hydride transfer of an N‐benzylated dihydronicotinamide to hexachloroacetone in ethanol was proposed to be subject to general acid catalysis. [27]
Based on the insights on the mechanism of the reduction of K1, we next studied the pH‐rate profiles as well as the buffer dependency of the reactions with the other keto acids K2‐4. At pH 4, glyoxylate (K2) was found to be only slightly more electrophilic than K1 and the reduction reaction is analogously subject to general catalysis (see Supporting Information, p. S19). However, the reactivity trends change drastically with decreasing acidity and at neutral pH the reduction of K2 is two orders of magnitude faster than that of K1 (Figure 4A). The significantly higher rate of the water‐catalyzed reaction at pH 7 of K2 compared to K1 is not surprising given the intrinsic higher reactivity of aldehydes compared to ketones. [20a] In aqueous solution, glyoxylate is almost predominantly present as a hydrate and it is the small amount of free aldehyde which is reacting. [28] To exclude that the dehydration reaction of glyoxylate hydrate is rate‐determining under our reaction conditions and thus, a main reason for the pH‐rate behavior, we determined the rate of dehydration by exchange NMR spectroscopy (see the Supporting Information p. S33). In support of our kinetic analysis, we found that at pH 4 and 7 the rate of dehydration is faster than that of the reduction reaction.
Figure 4.

A) pH‐rate profiles for the reaction of K1–K4 with NaBH3CN (50 mM). The dashed lines correspond to the fitted equation for k 0 (see the Supporting Information). B) Dependence of k obs for the reaction of K3 and K4 (5 mM) with NaBH3CN (50 mM) on the total concentration of acetate buffer at pH 4, 20 °C and I=1.0 (NaCl). C) Intramolecular acid catalysis and effective molarities.
Comparison of the buffer‐independent second‐order rate constants k 2,0 indicate that at pH 4 oxaloacetate (K3) and α‐ketoglutarate (K4) react approximately 85 and 21 times faster than K1 (Table 1). In contrast to K1 and K2, the rates k obs for the reduction of both K3 and K4 were found to be independent of the concentration of the buffer (Figure 4B). The pH‐rate profiles show titration of the terminal carboxylate of K3 and K4 at their respective pK aH values but are otherwise consistent with an acid‐dependent reaction (Figure 4A, grey and red points). Accordingly, we attribute the significantly higher reduction rates of K3 and K4 compared to K1 observed at acidic pH to the terminal carboxylate groups of K3 and K4 being involved in intramolecular acid catalysis (Figure 4C). [29] If intramolecular acid catalysis is a significant contribution to the reaction, then the loss of intermolecular general acid catalysis would be predicted and k obs should not increase with the buffer concentration, conforming to our experimental observations. Intramolecular acid catalysis might now also be used to explain the relative reactivities of K3 and K4 at acidic pH which is also illustrated by the differences in the effective molarities (Figure 4C, Supporting Information p. S27/30). An intramolecular hydrogen‐bond forms a six‐membered ring in K3, but a similar hydrogen bond in K4 forms a less favorable seven‐membered ring (Figure 4C).
When comparing the buffer‐independent pH‐rate profiles of all four keto acids (Figure 4A), it becomes clear that the reactivity ordering of K1–K4 is largely dependent on the pH value. These trends will additionally change with buffer concentration, as the reduction rate of K3 and K4 is independent on the buffer, while it is the opposite for K1 and K2.
To further verify how the reactivity trends change with pH in the presence of buffer, competition experiments were performed. Additionally, these experiments allow to verify the trends obtained in our kinetic analysis. The readily occurring aldol addition reactions between keto acids K1‐K3 renders a direct competition experiment between all four keto acids impossible. [30] Instead, we performed pairwise competition experiments of a limiting amount of BH3CN− reacting with K4 and K1–3 (Figure 5A). Analysis of the ratio of keto acids before and after the reaction ([K]0/[K]t) for both competing electrophiles allows to calculate the competition constants κ which corresponds to the ratio of the second order rate constants [Figure 5A, I]. [31] Due to significant overlap of the keto acid resonances in the NMR spectra after the reaction, the concentration [K]t was derived from the concentration of the hydroxy acid [H]t [Figure 5A, II]. In this case, this treatment allows to subtract the contribution of side reactions (e.g. cyanohydrin formation) and decomposition of the keto acids (e.g. decarboxylation of oxaloacetate). Based on the competition constants for all three pairwise reactions, the relative reactivities of all species was assigned (Figure 5B).
Figure 5.
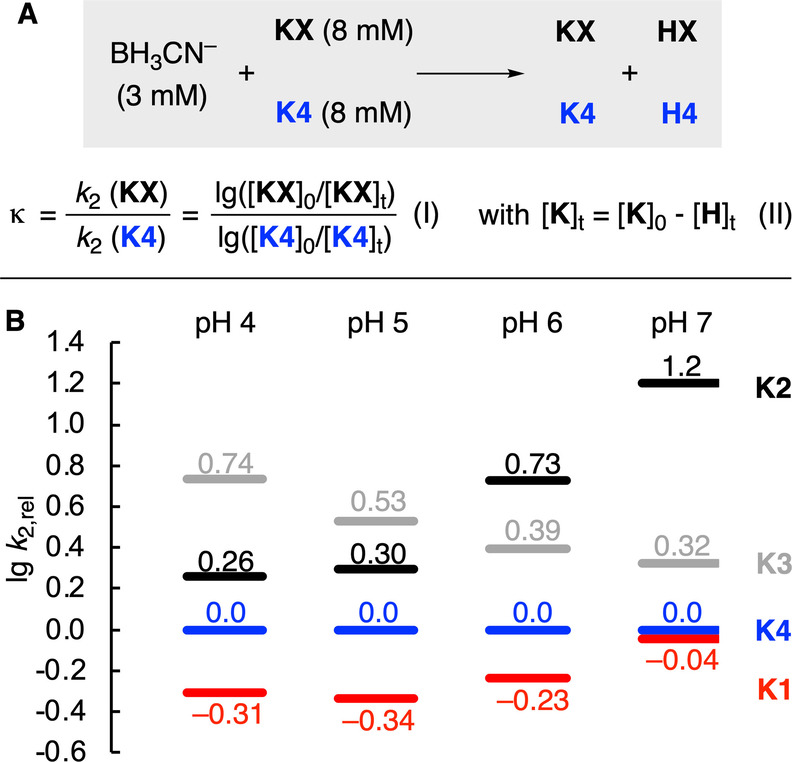
A) Competition experiments to analyze the relative rates of keto acid reduction. B) Rates lg k 2,rel for the keto acid reduction relative to the reduction of K4 based on pairwise competition experiments of K1, K2 and K3 with K4 in 0.5 M acetate or phosphate buffer at pH 4–7 (to aid the comparison with Figure 4A, the same colors were used for the different keto acids).
Comparing the relative rates of all keto acids with another in the presence of 0.5 M buffer shows that the absolute differences in reactivities are far smaller than in the buffer‐independent reaction (cf. Figure 4A). This can be explained by the large buffer dependency of the reduction rates of K1 and K2 while the reduction of K3 and K4 is insensitive to buffer effects (cf. Figure 4B). As a result, at neutral pH the reduction of glyoxylate (K2) is kinetically dominating despite being unfavored at acidic pH and in the absence of a buffer.
Equilibria for Imine/Iminium Ion Formation in Solution
The equilibrium for the formation of imine I or iminium ion I‐H+ from keto acids and ammonia can be described by the reactions in Scheme 3. However, quantitative insight into imine or iminium formation from α‐keto acids and ammonia is scarce: The equilibrium constant K I for imine formation in the reaction of pyruvate with ammonia has been reported by using polarographic measurements in aqueous solution at pH 9.25 and was found to be K=0.25 at 0 °C.[ 32 , 33 ]
Scheme 3.
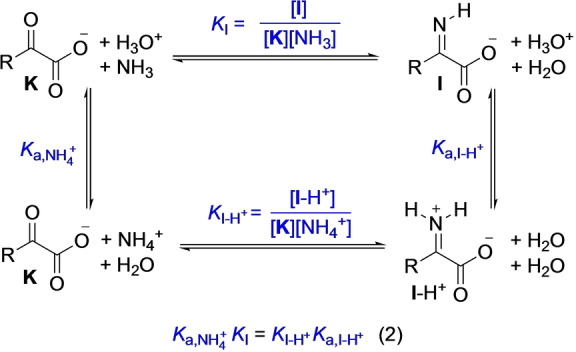
Equilibria for imine/iminium formation from α‐keto acids and NH3/NH4 +.
As the equilibrium constant K I for imine formation from α‐ketoglutarate was not yet reported, we attempted to determine it, as well as that for pyruvate, by 1H NMR titrations at buffered alkaline pH and at constant ionic strength (I=1.5). As the iminium ions I‐H+ are acidic (pK a≈5–9), titrations at pH=10.2 will predominantly reflect the formation of the imine I. Analysis of the NMR shift of the CH3 resonance of pyruvate and the β‐CH2 resonance of α‐ketoglutarate as a function of the NH3 concentration gave rise to shallow binding isotherms (see the Supporting Information on p. S42 for a detailed discussion including IR spectroscopy and DFT computations). Analysis of the binding isotherms at 23 °C provided the equilibrium constants for imine formation for both pyruvate (K=0.104±0.008) and α‐ketoglutarate (K=0.060±0.025), the former of which is in reasonable agreement with the value reported for pyruvate at 0 °C from polarography (K=0.25).[ 32 , 34 ]
To determine the equilibrium constants K I‐H+ for iminium ion (I‐H+) formation, which is pertinent in neutral or acidic solution, the thermodynamic cycle described in Scheme 3 and Equation (2) was used. As the acidity of NH4 + (K a,NH4+) is known, the knowledge of the acidity of I‐H+ (K a,I‐H+) allows to calculate K I‐H+. However, due to their instability in aqueous solution, the acidity of iminium ions cannot be determined experimentally in a straightforward way. To solve this issue, we turned to DFT computations anchored to a set of reference compounds (see the Supporting Information, Tables S18/19) which allowed us to assign an acidity of pK a=7.8±0.3 to the iminium ion of pyruvate (for other iminium ions, see Table 3).
From the equilibria in Scheme 3, the pH‐dependent species distribution was calculated as shown in Figure 6 on the example of pyruvate (for the analogous analysis of α‐ketoglutarate, see the Supporting Information Figure S22). Comparing the relative amounts of imine and iminium ion as a function of pH, the iminium ion dominates between pH 4 and 8, where its concentration stays almost constant. Accordingly, general catalysis, as observed for the reduction of keto acids, does not play a significant role below pH 8, as the imine is fully protonated.
Figure 6.
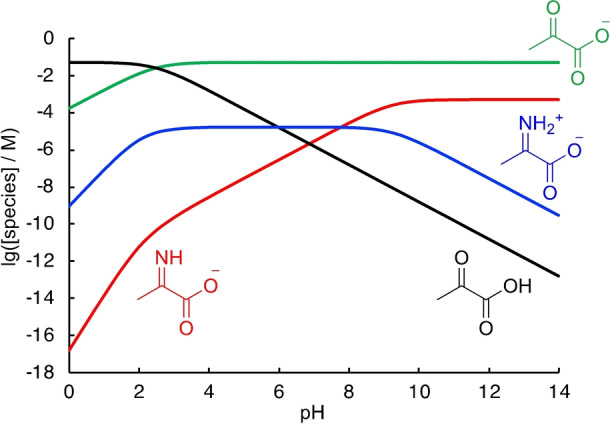
Species distribution for the system pyruvate (50 mM)/NH3 (100 mM) as a function of pH with K I=0.104, pK a,NH4+=9.25, pK a,I1‐H+=7.78 and pK a,K1 =2.49.
Kinetics of Reductive Amination
Treating an α‐keto acid with a reductant in the presence of NH4 + results in competing reduction of the keto acid and the iminium ion formed in equilibrium (Figure 7A). When using BH3CN− as a reductant, cyanide is formed as by‐product along with the hydroxy and amino acids. Cyanohydrin formation thus becomes a third potentially competing pathway, as already discussed above for the reduction of keto acids. However, for K1 and K2, cyanohydrin formation was found to be negligible at pH 4, while, for K3 and K4, only traces could be detected at pH 5. To study the kinetics of the reductive amination of pyruvate (K1) with NaBH3CN in the presence of NH4Cl, measurements were therefore performed at pH 4 (Figure 7). To reduce buffer‐catalysis of the keto acid reduction, we additionally used phosphate solution instead of acetate buffer, as under these conditions the H2PO4 − ion is a weaker acid catalyst.
Figure 7.
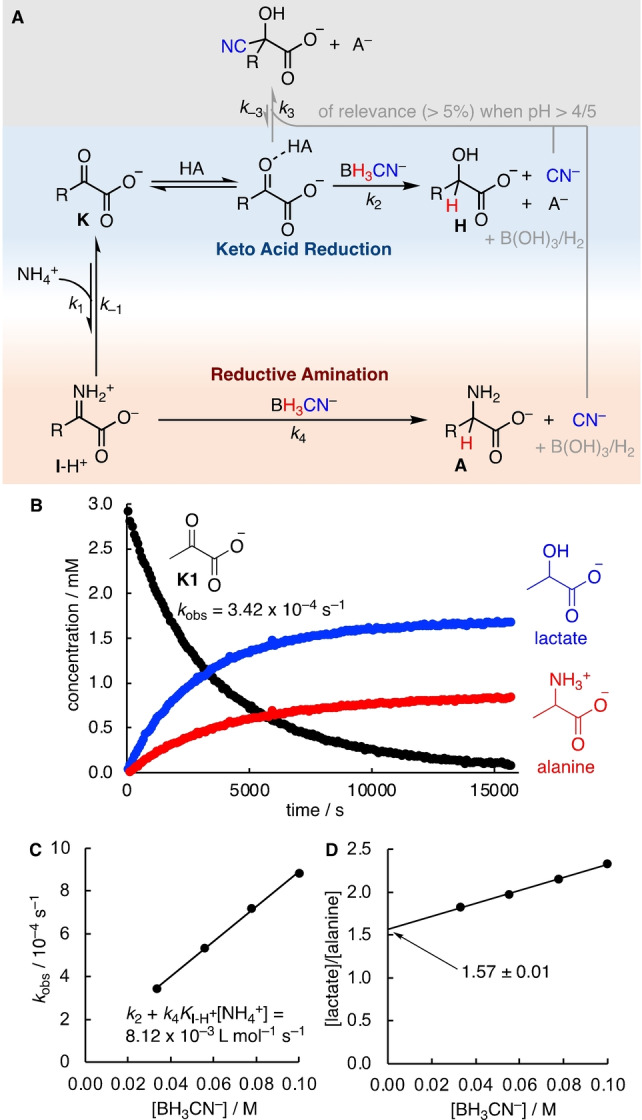
A) Mechanistic model for reductive amination. B) 1H NMR kinetics of the reaction of pyruvate (K1, 3.3 mM) with NaBH3CN (33.3 mM) and NH4Cl (0.5 M) in 0.5 M phosphate solution, pH 4 at 20 °C. C) Correlation of k obs and [BH3CN−] with [NH4Cl]=0.5 M at pH 4. D) Correlation of the experimental ratio [lactate]/[alanine] at pH 4 from quantitative 1H NMR spectroscopy vs. [BH3CN−].
In the following, we briefly describe our analysis of the kinetics of reductive amination; a more detailed explanation with full derivations is provided in the Supporting Information. For the mechanistic model of Figure 7A, under conditions where cyanohydrin formation is negligible, the disappearance of the keto acid K is described by Equation (3), which consists of two terms.
On one hand, K undergoes direct reduction through acid‐catalyzed reaction with BH3CN−, as described by the rate constant k 2 (cf. the section on keto acid reduction above). On the other hand, K is in equilibrium with the iminium ion I‐H+ which is reduced by BH3CN− via the rate constant k 4. Combining the definition of the equilibrium for iminium formation from K and NH4 + [Eq. (4)] with the rate law for disappearance of K [Eq. (3)] results in Equation (5).
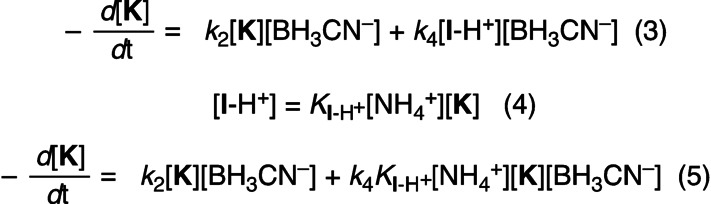
Equation (5) can be simplified under pseudo‐first order conditions when there is a large excess of BH3CN− and NH4 + and, accordingly, the concentrations of BH3CN− and NH4 + will not change largely during the reaction. With the definition of the pseudo‐first order rate constants k 2ψ [Eq. (6)] and k 4ψ [Eq. (7)], Equation (5) thus simplifies to Equation (8).
A rate law like Equation (8) can be solved analytically for the disappearance of K [Eq. (9)] as well as for the formation of the products H and A. [35] Thus, k obs for the disappearance of K1 in Figure 7B corresponds to the sum k 2ψ+k 4ψ and the product ratios of H and A can be used to differentiate the terms k 2ψ and k 4ψ.

In a series of measurements with constant concentration of NH4 + but with variation of the excess of BH3CN−, a correlation of k obs (=k 2ψ+k 4ψ) vs [BH3CN−] should have a slope of k 2+k 4 K I‐H+[NH4 +]. These two terms relate to the sum in Equation (5): The first term describes the contribution of the general acid catalyzed and pH‐dependent keto acid reduction. The second term accounts for the reductive amination, the rate of which should not change largely between pH 4 and 8 due to the constant concentration of the iminium ion (cf. Figure 6). Indeed, experimental analysis of the reductive amination of pyruvate (K1) showed the expected linear correlation (Figure 7C).
In a series of measurements with different excesses of BH3CN−, the product ratio of hydroxy to amino acid was used to differentiate the two terms of k obs=k 2ψ+k 4ψ, which in turn also differentiates the sum in Equation (5) into k 2 and k 4 K I‐H+[NH4 +]. At pH 7, the product ratio of hydroxy to amino acid was found to be independent of [BH3CN−] in line with the mechanism in Figure 7A. At pH 4, a slight dependency on [BH3CN−] was observed and the lactate/alanine ratio at [BH3CN−]=100 mM was 27 % higher than at [BH3CN−]=33 mM (Figure 7D). We attribute this discrepancy to the rate of iminium formation (via k 1) that becomes slower due to the decreased amount of free NH3 present at pH 4. To ascertain our analysis, we extrapolated the product ratio of hydroxy and amino acid at [BH3CN−]=0 from the linear correlation of the product ratios and [BH3CN−] (Figure 7D). The product ratio at [BH3CN−]=0 corresponds to reaction conditions under which the reduction step is clearly rate limiting, as the reaction is so slow that full equilibration of K and I‐H+ is achieved. This product ratio was finally used to separate the terms in Equation (5). A more detailed explanation of our approach and a verification with numerical simulations is shown in the Supporting Information on page S48–50.
Table 2 summarizes the values of k 2 and k 4 K I‐H+[NH4 +] as well as the associated errors determined in this way for the reductive amination of pyruvate (K1). For the other keto acids K2‐K4, the measurements were performed in an analogous way as described for K1, using the same concentration of NH4Cl. However, the reductive aminations of K3 and K4 were studied at pH 5, as, at pH 4, the kinetics were found to result almost exclusively from keto acid reduction. The product k 4 K I‐H+ allows us to rank the relative reactivities of keto acids K1–4 in the reductive amination under an identical NH4 + excess. The formation of aspartate and alanine is faster by factors of 1.7 and 1.9, respectively, than the formation of glutamate. The rate for reductive amination of K2 is 11 times larger than for K1.
Table 2.
Second‐order rate constants k 2 and k 4 K I‐H+ for hydroxy (H) and amino acid (A) formation in the reaction of K1–4 with NaBH3CN in the presence of NH4Cl (0.5 M) determined by 1H NMR spectroscopy at 20 °C in 0.5 M phosphate solution.[a]
|
Species |
k 2+k 4 K I‐H+[NH4 +] |
[H]/[A] |
k 2 [L mol−1 s−1] |
k 4 K I‐H+[NH4 +] [L mol−1 s−1] |
pK a,I‐H+ [b] |
K I |
K I‐H+ [e] |
|---|---|---|---|---|---|---|---|
|
K1 |
(8.12±0.21)×10−3 |
1.57±0.01 |
(5.0±0.1)×10−3 (pH 4) |
(3.2±0.1)×10−3 |
7.8±0.3 |
0.104±0.008 [c] |
(4±3)×10−3 |
|
K2 |
(3.96±0.26)×10−2 |
1.12±0.02 |
(2.1±0.1)×10−2 (pH 4) |
(1.9±0.1)×10−2 |
5.3±0.3 |
[d] |
|
|
K3 |
(1.94±0.06)×10−2 |
5.78±0.27 |
(1.7±0.1)×10−2 (pH 5) |
(2.9±0.1)×10−3 |
8.9±0.4 |
[d] |
|
|
K4 |
(8.66±0.30)×10−3 |
4.24±0.30 |
(7.0±0.3)×10−3 (pH 5) |
(1.7±0.1)×10−3 |
8.7±0.4 |
0.061±0.025 [c] |
(2±2)×10−2 |
[a] All errors correspond to standard errors. For values calculated from multiple entries, the errors were calculated from propagation of the individual errors. [b] Extrapolated from experimentally anchored DFT computations (see the Supporting Information). [c] Determined by 1H NMR titrations (this work). [d] Could not be determined. [34] [e] Calculated as K I‐H+=K a,NH4+ K I/K a,I‐H+.
Competition Experiments of Reductive Amination
The pH‐dependent species distribution suggests that the amount of iminium ion in solution stays stationary for pyruvate and α‐ketoglutarate within pH 4 and 7 (Figure 6, Figure S22). Accordingly, the reactivity ordering of the reductive amination reaction should stay constant within this pH range. As direct kinetic studies cannot be used above pH 4–5 due to experimental limitations, we turned to competition experiments to verify our model. Binary mixtures of keto acids were subjected to conditions of reductive amination and the product distribution was analyzed to determine the competition constants for the reaction to both hydroxy acid H and amino acids A under these conditions (Figure 8, see the Supporting Information for full details).[ 31 , 36 ]
Figure 8.
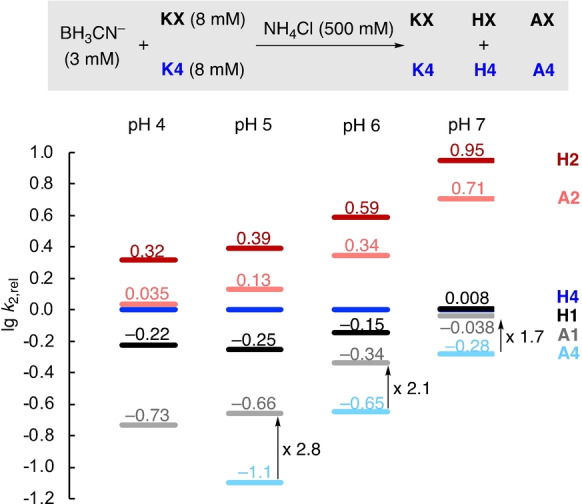
Rates lg k 2,rel for keto acid reduction and reductive amination relative to the reduction of K4 based on pairwise competition experiments of K1, K2 and K3 with K4 in 0.5 M acetate (pH 4/5) or phosphate buffer (pH 6/7).
Figure 8 shows that increasing the pH enhances the rate of reductive amination with respect to keto acid reduction for alanine (A1) and glutamate (A4) while the ratio stays almost constant in the case of glycine (A2). However, even for A1 and A4, the ratio of amino vs. hydroxy acids is surprisingly low despite the large excess of NH4 +, even at neutral pH. This contrasts with the high selectivity typically observed in reductive amination reactions with classical organic substrates. [13] Accordingly, these results suggest that the reactivity difference of keto acids and their respective iminium ions is significantly smaller compared to that found with aliphatic ketones. Comparing the rate constants of the keto acids to undergo reductive amination confirms the intrinsically lower tendency to form glutamate (A4) compared to alanine (A1) also observed in the direct kinetic experiments (Table 2). When increasing the pH from 5 to 7, the ratio of the rate constants for the formation of glutamate vs. alanine is slightly reduced from 2.8 to 1.7. However, the changes in the relative reductive amination rates are far smaller than those observed for the keto acid reduction (cf. Figure 4A), which is in line with the relatively stationary concentration of iminium ions in the investigated pH range. In line with direct kinetic experiments, the high reactivity of glyoxylate (K2) compared with other keto acids at neutral pH to yield either glycine (A2) or glycolate (H1) is also found in competition experiments.
Lastly, competition experiments were used to study the buffer dependency of the reductive amination reaction in a mixture of K1 and K4 (Supporting Information, p. S61). When performing the reaction in 50 mM and 500 mM buffer, the observed changes were rather small and neither the ratio of glutamate (A4) to alanine (A1) nor the rates changed significantly.
Thermochemistry of Reductive Amination
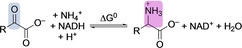
Experimental thermochemistry for reductive amination has previously been derived from kinetic measurements of the enzyme catalyzed reaction of NAD+ with glutamate or alanine. [37] The Gibbs free energies of these reactions were combined by means of thermodynamic cycles with the known energetics of transamination to provide the Gibbs energies of reductive aminations for further keto acids (Table 3). The trends in thermodynamics of reductive amination (with NADH) are globally in line with the kinetics observed for the nonenzymatic reduction with BH3CN−: The fastest reductive amination is observed for the most exergonic substrate (glyoxylate/glycine), while the reaction is slowest (and least exergonic) for glutamate synthesis. However, the reductive amination of oxaloacetate proceeds slower (based on k 4 K I‐H+ ) than expected from thermochemistry.
Table 3.
Experimental Gibbs energies of reductive amination at 25 °C.
|
| |
|---|---|
|
R= |
ΔG 0 [kJ mol−1] |
|
H (glycine) |
−89.73[a] |
|
CH3 (alanine) |
−75.15±0.80[b] |
|
CH2COO− (aspartate) |
−79.53[a] |
|
CH2CH2COO− (glutamate) |
−74.80±0.80[c] |
Conclusion
Kinetic studies of the hydride transfer of BH3CN− to C=O and C=N functionalities of α‐keto acids and related iminium ions were used to investigate the reaction mechanism and to study the relative electrophilic reactivities of these biologically relevant functionalities.
The relative electrophilic reactivities of keto acids in hydride transfer reactions are highly dependent on the pH as well as the presence or absence of buffer species that can act as general acid catalysts (Figure 4 and 5). In consequence, the observed reactivity differences can largely be attributed to the reactions proceeding via inter‐ vs. intramolecular acid catalysis: Intramolecular acid catalysis from internal carboxylic acid groups can be found for oxaloacetate (K3) and α‐ketoglutarate (K4), while only intermolecular catalysis can enhance the reaction rates of pyruvate (K1) or glyoxylate (K2) reductions.
Subjecting α‐keto acids to conditions of reductive amination resulted in a complex system of underlying reactions. Investigations of the equilibrium constants for imine/iminium formation and the acidities of the iminium ions were used to establish the pH‐dependent species‐distribution in the keto acid/NH3 system relevant for the understanding of the subsequent reduction reactions (Scheme 3, Figure 6). Analysis of the species distribution suggests an almost stationary concentration of iminium ions between pH 4 and 8. At pH 4, direct kinetic studies could be performed by 1H NMR spectroscopy and the product ratios were used to separate the kinetic contributions of the direct reduction from the reductive amination reaction (Figure 7). At [NH4 +]=0.5 M, the reductive amination of glyoxylate, oxaloacetate and pyruvate are 11, 1.7 and 1.9 times faster, respectively, than that of α‐ketoglutarate (Table 2). The differences in intrinsic reactivities were furthermore verified by competition experiments conducted at pH 4–7. The competition experiments confirmed that the reactivity ordering of keto acids to undergo reductive amination does not change largely within this pH range. The contrasting pH‐dependency of keto acids to undergo reductive aminations or direct reductions can again be rationalized by acid catalysis. Reductive amination is predominantly governed by specific catalysis as the iminium ions are largely protonated at neutral pH and below. Consequently, reactivity differences are due to the underlying electronic nature of the substrate, rather than due to the mode of acid catalysis.
Extensive previous studies on the reactivities of electrophiles and nucleophiles have shown that electrophilicity is independent of the nature of the nucleophile. Accordingly, our kinetic and competition experiments with BH3CN− as model nucleophile suggest that the reductive amination of α‐ketoglutarate over other keto acids is kinetically less favored than that of other keto acids; though, not by much. Moreover, the reductive amination of α‐ketoglutarate is also thermochemically less favored compared to pyruvate, oxaloacetate and glyoxylate. Accordingly, the usage of reductive amination to only synthesize glutamate within biological amino acid biosynthesis is not due to glutamate being intrinsically more accessible.
Why then did evolution select for amino acid biosynthesis to initiate with the kinetically and thermodynamically least favorable reductive amination? One possible answer lies within the thermodynamics of the subsequent transamination reactions.[ 6 , 37 ] Despite their apparent similarities, glutamate is thermochemically a better amine‐donor when compared to alanine. Thus, formation of alanine from pyruvate and glutamate is exergonic. Even though the energetic preference in transamination is relatively small (ΔG 0=−1.04 kJ mol−1), synthesizing glutamate by reductive amination renders the subsequent transamination reactions to other α‐keto acids exergonic and might, therefore, establish glutamate as a high‐energy amine donor within amino acid synthesis.
Conflict of interest
The authors declare no conflict of interest.
1.
Supporting information
As a service to our authors and readers, this journal provides supporting information supplied by the authors. Such materials are peer reviewed and may be re‐organized for online delivery, but are not copy‐edited or typeset. Technical support issues arising from supporting information (other than missing files) should be addressed to the authors.
Supporting Information
Acknowledgements
R.J.M. thanks the Deutsche Forschungsgemeinschaft (DFG, German Research Foundation) for a fellowship (MA 9687/1‐1). This project has received funding from the European Research Council (ERC) under the European Union's Horizon 2020 research and innovation program (grant agreement no. 101001752). J.M. thanks the VW Foundation (no. 96 742) for generous support. Computations were performed at the High Performance Computing Center of the University of Strasbourg. Prof. Herbert Mayr, Dr. David Lebœuf, and Dr. Quentin Dherbassy are acknowledged for helpful discussions.
R. J. Mayer, J. Moran, Angew. Chem. Int. Ed. 2022, 61, e202212237; Angew. Chem. 2022, 134, e202212237.
Contributor Information
Dr. Robert J. Mayer, Email: rjmayer@unistra.fr.
Prof. Dr. Joseph Moran, Email: moran@unistra.fr.
Data Availability Statement
The data that support the findings of this study are available in the supplementary material of this article.
References
- 1.
- 1a. Metzler D. E., Biochemistry—The Chemical Reactions of Living Cells, Vol. 2 , 2nd ed., Academic Press, San Diego, 2003; [Google Scholar]
- 1b. McMurry J. E., Begley T. P., The Organic Chemistry of Biological Pathways , 2nd ed., Roberts and Company, Greenwood Village, CO, 2016. [Google Scholar]
- 2.For a crystallographic study of the mechanism, see: Prakash P., Punekar N. S., Bhaumik P., J. Biol. Chem. 2018, 293, 6241–6258. [DOI] [PMC free article] [PubMed] [Google Scholar]
- 3.
- 3a. Fagan R. L., Ralfey B. A., in Comprehensive Natural Products II, Vol. 7 (Ed.: Begley T. P.), Elsevier, Amsterdam, 2010, pp. 96–98; [Google Scholar]
- 3b. Vanoni M. A., Curti B., IUBMB Life 2008, 60, 287–300. [DOI] [PubMed] [Google Scholar]
- 4.A comparative study of nitrogen uptake by glutamate synthase, glutamate dehydrogenase, glutamine synthase and alanine dehydrogenase in Bacillus azotofixans found that even though alanine dehydrogenase is present in relatively high concentration, it shows “little, if any contribution to NH4 + assimilation” and is predominantly of catabolic relevance: Kanamori K., Weiss R. L., Roberts J. D., J. Biol. Chem. 1988, 263, 2817–2823.2893794 [Google Scholar]
- 5.For reviews on nonenzymatic metabolism, see:
- 5a. Ralser M., Biochem. J. 2018, 475, 2577–2592; [DOI] [PMC free article] [PubMed] [Google Scholar]
- 5b. Muchowska K. B., Varma S. J., Moran J., Chem. Rev. 2020, 120, 7708–7744. [DOI] [PubMed] [Google Scholar]
- 6. Mayer R. J., Kaur H., Rauscher S. A., Moran J., J. Am. Chem. Soc. 2021, 143, 19099–19111; see references cited therein for an overview on other reports on metal catalyzed transamination. [DOI] [PubMed] [Google Scholar]
- 7.
- 7a. Murakami M., Kang J.-W., Bull. Chem. Soc. Jpn. 1962, 35, 1243–1244; [Google Scholar]
- 7b. Murakami M., Kang J.-W., Bull. Chem. Soc. Jpn. 1963, 36, 763–769; [Google Scholar]
- 7c. Ogo S., Uehara K., Abura T., Fukuzumi S., J. Am. Chem. Soc. 2004, 126, 3020–3021. [DOI] [PubMed] [Google Scholar]
- 8.Reduction with H2 on Pd or Pt catalysts:
- 8a. Knoop F., Oesterlin H., Hoppe-Seyler′s Z. Physiol. Chem. 1925, 148, 294–315; [Google Scholar]
- 8b. Knoop F., Oesterlin H., Hoppe-Seyler′s Z. Physiol. Chem. 1927, 170, 186–211; [Google Scholar]
- 8c. Bourguel A., Moureu C., C. R. Hebd. Seances Acad. Sci. 1928, 186, 1844–1846. Reduction using FeII minerals: [Google Scholar]
- 8d. Tabushi I., Yabushita Y., Nakajima T., Tetrahedron Lett. 1976, 17, 4343–4346; [Google Scholar]
- 8e. Hafenbradl D., Keller M., Wächtershäuser G., Stetter K. O., Tetrahedron Lett. 1995, 36, 5179–5182; [Google Scholar]
- 8f. Huber C., Wächtershäuser G., Tetrahedron Lett. 2003, 44, 1695–1697; [Google Scholar]
- 8g. Barge L. M., Flores E., Baum M. M., Van der Velde D. G., Russell M. J., Proc. Natl. Acad. Sci. USA 2019, 116, 4828–4833. [DOI] [PMC free article] [PubMed] [Google Scholar]
- 9.
- 9a. Wang W., Li Q., Yang B., Liu X., Yang Y., Su W., Chem. Commun. 2012, 48, 2146–2148; [DOI] [PubMed] [Google Scholar]
- 9b. Wang W., Liu X., Yang Y., Su W., Int. J. Astrobiol. 2013, 12, 69–77. [Google Scholar]
- 10.
- 10a. Jeffery E. A., Meisters A., Aust. J. Chem. 1978, 31, 73–78; [Google Scholar]
- 10b. Jeffery E. A., Johansen O., Meisters A., Aust. J. Chem. 1978, 31, 79–84. [Google Scholar]
- 11.
- 11a. Erlenmeyer E., Kunlin J., Justus Liebigs Ann. Chem. 1899, 307, 146–162; [Google Scholar]
- 11b. De Jong M. A. W. K., Recl. Trav. Chim. Pays-Bas 1900, 19, 259–310; [Google Scholar]
- 11c. Erlenmeyer E., Justus Liebigs Ann. Chem. 1904, 337, 205–221; The reaction was re-discovered in the 1980: [Google Scholar]
- 11d. Yanagawa H., Makino Y., Sato K., Nishizawa M., Egami F., Origins Life 1984, 14, 163–169 and ref. cited therein; Morowitz claimed that formate acts as a nucleophilic reducing agent, but the reaction was later shown by Miller to be due to oxidative decarboxylation: [DOI] [PubMed] [Google Scholar]
- 11e. Morowitz H., Peterson E., Chang S., Origins Life Evol. Biospheres 1995, 25, 395–399; [DOI] [PubMed] [Google Scholar]
- 11f. Maughan Q., Miller S. L., Origins Life Evol. Biospheres 1999, 29, 355–360. [DOI] [PubMed] [Google Scholar]
- 12. Nakamura K., Ohno A., Oka S., Tetrahedron Lett. 1977, 18, 4593–4594. [Google Scholar]
- 13. Borch R. F., Bernstein M. D., Durst H. D., J. Am. Chem. Soc. 1971, 93, 2897–2904. [Google Scholar]
- 14.Mixtures of NADH and glyoxylate or pyruvate with each compound at 100 mM concentration kept in 0.2 M phosphate buffer at pH 7, 23 °C, did not show any measurable hydride transfer within 7 days.
- 15.
- 15a. Lowry O. H., Passonneau J. V., Rock M. K., J. Biol. Chem. 1961, 236, 2756–2759; [PubMed] [Google Scholar]
- 15b. Burton R. M., Kaplan N. O., Arch. Biochem. Biophys. 1963, 101, 150–159. [DOI] [PubMed] [Google Scholar]
- 16.
- 16a. Steffens J. J., Chipman D. M., J. Am. Chem. Soc. 1971, 93, 6694–6696; [DOI] [PubMed] [Google Scholar]
- 16b. Stewart R., Ng L. G., Teo K. C., Tetrahedron Lett. 1979, 20, 3061–3064; [Google Scholar]
- 16c. Chipman D. M., Yaniv R., van Eikeren P., J. Am. Chem. Soc. 1980, 102, 3244–3246; [Google Scholar]
- 16d. Bossaerts J., Dommisse R., Alderweireldt F., Heterocycles 1986, 24, 115–123; [Google Scholar]
- 16e. Tsukiji S., Pattnaik S. B., Suga H., J. Am. Chem. Soc. 2004, 126, 5044–5045. [DOI] [PubMed] [Google Scholar]
- 17. Borch R. F., Durst H. D., J. Am. Chem. Soc. 1969, 91, 3996–3997. [Google Scholar]
- 18.Though NAD(P)H and BH3CN− are chemically widely different, computational enthalpic hydricities (ΔH H −) have indicated that NADPH (ΔH H −=77.1 kcal mol−1) and BH3CN− (ΔH H −=75.3 kcal mol−1) are thermodynamically similar hydride donors: Ilic S., Alherz A., Musgrave C. B., Glusac K. D., Chem. Soc. Rev. 2018, 47, 2809–2836.29543931 [Google Scholar]
- 19.
- 19a. Mayr H., Patz M., Angew. Chem. Int. Ed. Engl. 1994, 33, 938–957; [Google Scholar]; Angew. Chem. 1994, 106, 990–1010; [Google Scholar]
- 19b. Mayr H., Tetrahedron 2015, 71, 5095–5111. [Google Scholar]
- 20.
- 20a. Li Z., Jangra H., Chen Q., Mayer P., Ofial A. R., Zipse H., Mayr H., J. Am. Chem. Soc. 2018, 140, 5500–5515; [DOI] [PubMed] [Google Scholar]
- 20b. Geneste P., Durand R., Hugon I., Reminiac C., J. Org. Chem. 1979, 44, 1971–1973; [Google Scholar]
- 20c. Guthrie J. P., J. Am. Chem. Soc. 2000, 122, 5529–5538; Finiels and Geneste had already reported linear correlations between the rates of nucleophile additions for different ketons in water: [Google Scholar]
- 20d. Finiels A., Geneste P., J. Org. Chem. 1979, 44, 1577–1578. [Google Scholar]
- 21.While the exact mechanism for the formation of boric acid and cyanide has not yet been investigated, an analysis of the hydrolysis products has been described in: Evers E. C., Freitag W. O., Keith J. N., Kriner W. A., MacDiarmid A. G., Sujishi S., J. Am. Chem. Soc. 1959, 81, 4493–4496. While borane intermediates that might occur during the decomposition are known to be highly Lewis acidic, we do not expect them to affect our kinetic measurements due to the large excess of buffer (0.1–0.5 M) that should rapidly react with such species. For an evaluation of the effect of boric acid on our measurements, see p. S18. [Google Scholar]
- 22.
- 22a.Mixing pyruvate with an equimolar amount of KCN at pH 4 resulted in almost quantitative formation of the cyanohydrin within 5 minutes which were required to record an NMR spectrum; for previous reports on cyanohydrin formation of keto acids, see:
- 22b. Yerabolu J. R., Liotta C. L., Krishnamurthy R., Chem. Eur. J. 2017, 23, 8756–8765; [DOI] [PubMed] [Google Scholar]
- 22c. Yadav M., Pulletikurti S., Yerabolu J. R., Krishnamurthy R., Nat. Chem. 2022, 14, 170–178. [DOI] [PubMed] [Google Scholar]
- 23.For a detailed study of the mechanism of cyanohydrin formation, see: Svirbely W. J., Roth J. F., J. Am. Chem. Soc. 1953, 75, 3106–3111. [Google Scholar]
- 24.
- 24a. Jencks W. P., Catalysis in Chemistry and Enzymology, Dover Publications, New York, 1987; [Google Scholar]
- 24b. Carey F. A., Sundberg R. J., Advanced Organic Chemistry, Part A: Structure and Mechanisms, 5 th ed., Springer, New York, 2007, p. 345–353. [Google Scholar]
- 25.
- 25a.For a discussion of the effect of cyanohydrin formation on the kinetics at pH>4, see p. S31 in the Supporting Information;
- 25b.We assume that all cyanohydrin is due to the cyanide formed from oxidation of BH3CN− and subsequent decomposition as the formation of CN− due to hydrolysis of BH3CN− was far slower than hydride transfer even at pH 4 (after 26 days 43 % decomposition was observed in 0.5 M phosphate solution, pH 4).
- 26.
- 26a. Jencks W. P., J. Am. Chem. Soc. 1959, 81, 475–481; [Google Scholar]
- 26b. Cordes E. H., Jencks W. P., J. Am. Chem. Soc. 1962, 84, 4319–4382; [Google Scholar]
- 26c. Sørensen P. E., Jencks W. P., J. Am. Chem. Soc. 1987, 109, 4675–4690. [Google Scholar]
- 27. Shinkai S., Kunitake T., Chem. Lett. 1977, 6, 297–300. [Google Scholar]
- 28.
- 28a.See p. S33 in the Supporting Information for equilibrium studies at variable pH; For analysis of the equilibrium constant, see:
- 28b. Sørensen P. E., Bruhn K., Lindeløv F., Acta Chim. Scand. A. 1974, 28, 162–168; for the mechanism and catalysis of glyoxylate dehydration in reduction, see: [Google Scholar]
- 28c. Meany J. E., Pocker Y., J. Am. Chem. Soc. 1991, 113, 6155–6171. [Google Scholar]
- 29.For a discussion on intramolecular acid catalysis and examples, see:
- 29a. Greig I. R., Kirby A. J., J. Phys. Org. Chem. 2004, 17, 498–506; [Google Scholar]
- 29b. Kirby A., Lima M. F., da Silva D., Roussev C. D., Nome F., J. Am. Chem. Soc. 2006, 128, 16944–16952. [DOI] [PubMed] [Google Scholar]
- 30. Stubbs R. T., Yadav M., Krishnamurthy R., Springsteen G., Nat. Chem. 2020, 12, 1016–1022. [DOI] [PMC free article] [PubMed] [Google Scholar]
- 31.
- 31a. Huisgen R., Angew. Chem. Int. Ed. Engl. 1970, 9, 751–762; [Google Scholar]; Angew. Chem. 1970, 82, 783–794; [Google Scholar]
- 31b. Yau H. M., Croft A. K., Harper J. B., Chem. Commun. 2012, 48, 8937–8939. [DOI] [PubMed] [Google Scholar]
- 32. Zuman P., Collect. Czech. Chem. Commun. 1950, 15, 839–873. [Google Scholar]
- 33. Favero P., Semerano G., Rend. Accad. Naz. Lincei, Cl. Sci. Fis., Mat., Nat. 1953, 14, 520–525. [Google Scholar]
- 34.Analogous determination of the association constants with K1 and K3 were not successful. While K3 is too unstable in aqueous solution, the hemiaminal and a triazine species were already described to dominate in aqueous solutions of glyoxylate and ammonia: Hoefnagel A. J., van Bekkum H., Peters J. A., J. Org. Chem. 1992, 57, 3916–3921. [Google Scholar]
- 35. Wright M. R., An Introduction to Chemical Kinetics, Wiley, Chichester, 2004, pp. 79–80. [Google Scholar]
- 36.Due to decarboxylation of oxaloacetate to pyruvate and its subsequent reaction to alanine and lactate, competition experiments with oxaloacetate could not be reliably analyzed.
- 37.
- 37a. Miller S. L., Magowan-Smith D., J. Phys. Chem. Ref. Data 1990, 19, 1049–1073; [Google Scholar]
- 37b. Engel P. C., Dalziel K., Biochem. J. 1967, 105, 691–695; [DOI] [PMC free article] [PubMed] [Google Scholar]
- 37c. Grimshaw C. E., Cleland W. W., Biochemistry 1981, 20, 5650–5655. [DOI] [PubMed] [Google Scholar]
Associated Data
This section collects any data citations, data availability statements, or supplementary materials included in this article.
Supplementary Materials
As a service to our authors and readers, this journal provides supporting information supplied by the authors. Such materials are peer reviewed and may be re‐organized for online delivery, but are not copy‐edited or typeset. Technical support issues arising from supporting information (other than missing files) should be addressed to the authors.
Supporting Information
Data Availability Statement
The data that support the findings of this study are available in the supplementary material of this article.