Abstract
Aim
To describe adults with (non‐dialysis) chronic kidney disease (CKD) in nine public renal practice sites in the Australian state of Queensland.
Methods
7,060 persons were recruited to a CKD Registry in May 2011 and until start of kidney replacement therapy (KRT), death without KRT or June 2018, for a median period of 3.4 years.
Results
The cohort comprised 7,060 persons, 52% males, with a median age of 68 yr; 85% had CKD stages 3A to 5, 45.4% were diabetic, 24.6% had diabetic nephropathy, and 51.7% were obese. Younger persons mostly had glomerulonephritis or genetic renal disease, while older persons mostly had diabetic nephropathy, renovascular disease and multiple diagnoses. Proportions of specific renal diagnoses varied >2‐fold across sites. Over the first year, eGFR fell in 24% but was stable or improved in 76%. Over follow up, 10% started KRT, at a median age of 62 yr, most with CKD stages 4 and 5 at consent, while 18.8% died without KRT, at a median age of 80 yr. Indigenous people were younger at consent and more often had diabetes and diabetic kidney disease and had higher incidence rates of KRT.
Conclusion
The spectrum of characteristics in CKD patients in renal practices is much broader than represented by the minority who ultimately start KRT. Variation in CKD by causes, age, site and Indigenous status, the prevalence of obesity, relative stability of kidney function in many persons over the short term, and differences between those who KRT and die without KRT are all important to explore.
Keywords: chronic kidney disease (CKD), epidemiology, indigenous, kidney replacement therapy (KRT), obesity, progression
Summary at a glance
This profile of CKD in public renal practices in Queensland, the first in any Australian state, exposes a much broader spectrum of characteristics than represented by those who ultimately start KRT, major variations in weightings of causes by age group, Indigenous status and practice site, strong links to obesity, and short‐term stability of renal function in many persons, all of which can influence design and evaluation of intervention strategies and inform public health policy.
1. INTRODUCTION
What are the characteristics and course of patients with Chronic Kidney Disease (CKD) seen by nephrologists in their renal specialty practices in Australia?
CKD is purportedly the most common chronic disease in the developed world. It is the most common pathway to end stage kidney failure (ESKF) but is also associated with increased rates of non‐renal deaths (a “multiplier of risk”). 1 The burden and costs of KRT as well as the premature deaths in patients with pre‐terminal kidney disease are of increasing concern in the developed world. Current trends predict that the costs of KRT will be unsustainable in Australia by 2030. 2 We need to better understand CKD, detect it earlier and manage it better to improve patient outcomes and reduce related health care costs.
Many countries have no systematic mechanisms for surveillance of CKD in the ambulatory (outpatient) setting. However, registries or surveillance systems for CKD have been established in some countries and regions and patient characteristics and risk factors for CKD progression have been described. 3 , 4 Lash et al 5 described the association of CKD with cardiovascular disease (CVD) and low socioeconomic status. A Korean group reported an 8.2% prevalence of CKD in adults, with older age, diabetes, hypertension, CVD, overweight or underweight and residence in rural areas being significant associations. 6 The first results of the German CKD registry were reported in 2013, 7 and patterns of CKD progression, and risk factor profiles for ESKF and deaths were described in 2020. 8
The Australian state of Queensland had a population of 5.2 million people in 2020 9 (20% of the nation's total), with an age structure and ethnic mix similar to those of Australia's population in general. These include sizeable immigrant populations and the second largest number of Indigenous people in the country, who comprised, 3.6% of Queensland's populain in 2011 and 4.0% in 2016. 10 The state has an area of 1.86 million sq km, (>7 times that of the United Kingdom), and environments ranging from large cities to very remote areas, as well as great variation of terrain and climate.
Queensland has a centralized public health system (Queensland Health, or QH), which provides state‐wide healthcare through 16 semi‐autonomous Hospital and Health Services and with 10 renal specialty practice hubs. The ethos, standards, and performance of QH are of the highest quality, despite the challenges posed by a vast geographical area, sparse population, and various high‐risk groups. A private health system also complements the Queensland public system. However, access is limited for persons with modest incomes, and for those living in more remote areas: furthermore, some persons with CKD switch from the private to the public health system over time, due to cost considerations.
We established a program for surveillance and research of CKD among the state‐funded renal specialty services of QH, which we called Chronic Kidney Disease Queensland (CKD.QLD). Its components are the CKD.QLD Registry, which is a database of demographic and clinical information on CKD patients at enrolment, with subsequent surveillance over time, and associated programs of practice improvement, health economic evaluations and biomarker research. 11
Service providers (including over 60 nephrologists, senior nurses, and program managers, supported by administration officers and data managers) in all QH renal specialty hubs were invited to recruit non‐dialysis CKD patients to the CKD.QLD registry. All these patients had an established diagnosis of CKD; they had usually been referred for evaluation and sometimes ongoing care from general practice or primary care (according to the Kidney Heath Australia Guidelines), 12 and from other specialty systems, Emergency Department visits or at discharge from hospital admissions.
We have previously reported findings from some individual CKD.QLD clinical sites of clinical characteristics of patients, age‐related changes, progression, rates of endpoints, and frequency and associations of obesity, as well as some broad views of genetic kidney disease, blood pressure profiles and treatments, and acute kidney injury. 13 , 14 , 15 , 16 , 17 , 18 CKD.QLD has also contributed to studies of blood pressure control and kidney disease progression as a member of the collaborative research network of iNET‐CKD. 19 , 20 , 21
This is the first report of the profiles and short‐term outcomes of the full cohort of CKD.QLD registry participants, and the first to be updated to mid‐2018.
2. METHODS
People aged ≥ 18 years with an established diagnosis of CKD, who were attending public renal clinics in all Queensland Health facilities were eligible for recruitment to the CKD.QLD Registry. 22 The diagnosis of CKD was based on international guidelines. 23 Patients receiving KRT at time of recruitment were not included, as all KRT patients are profiled in the ANZDATA registry. 24 Patients with acute kidney injury (AKI) were excluded unless they already had, or subsequently developed, CKD.
All participants provided written informed consent to join the CKD.QLD registry. They were enrolled from May 2011 onwards, and followed until the endpoints of death, the start of KRT or until the censor date of June 30, 2018. Demographic and clinical data were compiled from medical records. From 2015 onwards, an integrated electronic information system has been progressively rolled out over most QH clinical services, which has greatly facilitated our review of clinical information for the sites now “online”. Clinical laboratories all used the same method of creatinine estimation and reported estimated glomerular filtration rates (eGFR) based on the CKD‐epi formula, 25 and urine albumin concentrations were measured by standardized immunonephelometry. 26 The Statistical Analysis and Linkage Unit, Queensland Health provided linked data on the “endpoints” of institution of KRT and death.
Stata Statistical Software: Release 14 (Stata Corp LLC [RRID:SCR_012763]) was used for analyses. Descriptive statistics included means (SD) for normally distributed values, median (IQR) values for non‐normal distributions, as well as percentages, and proportions where appropriate, and incidence rates of KRT or of death without KRT were expressed as events per 100 person years.
Ethics approval for CKD.QLD was first granted in 2010 by the Queensland Health Central (QHC) Human Research Ethics Committee (HREC/10/QHC/41) and The University of Queensland (No. 20110000290). In 2015, ethics oversight was transferred to the Royal Brisbane and Women's Hospital Committee (HREC/15/QRBW/294). A Public Health Act approval (QCOS/029817/RD006802) was granted in 2017 for release of patient care data held by the QH Statistical Analysis and Linkage Unit.
3. RESULTS
3.1. CKD Patients
In total, 8,296 patients were recruited to the registry from among all nine major public renal service hubs in Queensland up to June 2018. At one site there were major inconsistencies between “endpoint” data recorded in that site's local register and data stored by QH; information from that site was ultimately decanted from the central registry following several discussions with the principal investigators of CKD.QLD, the director of that particular site, UQ research representatives, the UQ ethics committee and Queensland Health.
Figure 1 shows the areas that fed into the remaining nine renal practice service hubs, from which the remaining 7,060 CKD.QLD patients were recruited. They are the subject of this report. Among these, 54.0% were males, and 457 (6.5%) were Indigenous Australians by self‐report. Age at consent ranged from 18 to 100 years, with a median (IQR) of 69 (57–77) years.
FIGURE 1.
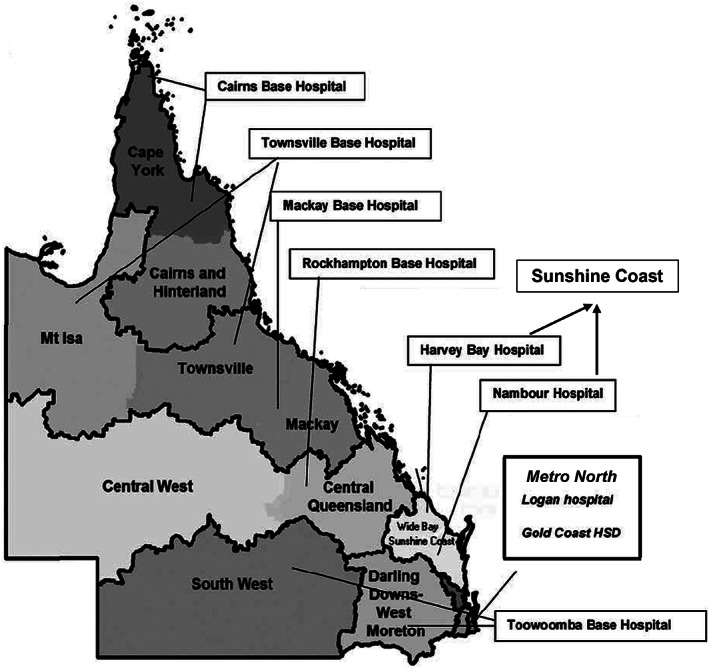
Regions of Queensland served by Queensland Health
Figure 2A shows similar age distributions of CKD patients by gender. Figure 2B shows that most of the subjects were at CKD stages 3B and 4 at consent, while 7.6% were at stage 5, with little difference by gender from stage 2 and beyond. The median (IQR) eGFR at consent was 37 (25–52) ml/min/1.73 m2. Figure 2C shows that older persons had progressively more advanced CKD. At consent, 20% of persons did not have significant albuminuria/proteinuria (ACR <3.4 g/mole or PCR <15 g/mol), 31.2% of persons had mild proteinuria/microalbuminuria (ACR ≥ 3.4 and < 34; or PCR ≥ 15 and < 50) and 40.9% had overt proteinuria/albuminuria (ACR ≥ 34 g/mol or PCR ≥ 50 g/mol).
FIGURE 2.
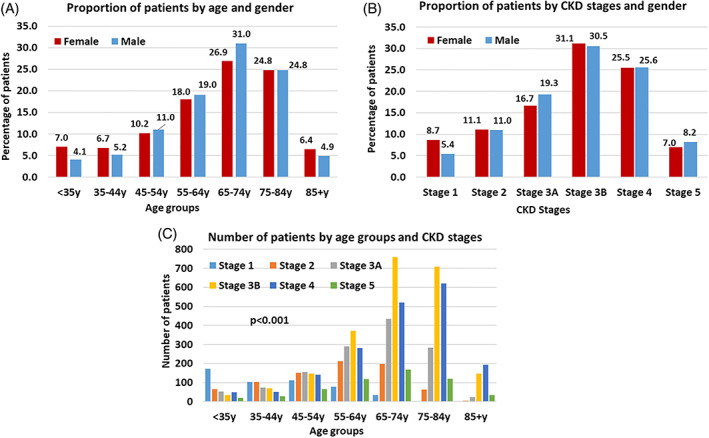
Characteristics of CKD patients. A. Age group at consent by gender (Female n = 3,256, Male n = 3,804). B. CKD stage by gender (Female n = 3,241, Male n = 3,788). C. CKD stage by age group at consent (n = 7,029)
Kidney disease diagnoses had been assigned by the patients' nephrologists. The proportions of different diagnoses varied markedly among sites. Renovascular disease (RV)/hypertension constituted 30.1% of all primary diagnoses (range 18.3%–50%); diabetic nephropathy (DN) 24.6% (13.5%–32%), glomerulonephritis (GN) 12.2% (2.1%–18.1%), genetic renal disease (GRD) 5.4% (3.2%–8.2%), and “other” 16.7% (10.7%–24.2%). Among “other” causes were toxic (non‐analgesic) kidney injury 5%, acute kidney injury 4%, single kidney (including renal transplant donors) 3%, analgesic nephropathy 3% and calculi 2%. Diagnosis was reported as uncertain or unknown in 11.1%, (range 5.9%–14.1%). Figure 3A shows that the proportions of various primary kidney disease assignments also differed markedly by age. Genetic renal disease and glomerulonephritis constituted the majority of diagnoses in young adults, while proportions with diabetic renal disease were maximum between 55 and 75 years, and the proportion with renal vascular disease increased with age to become the leading individual diagnosis beyond age 65 years, As shown in Figure 3B, there was almost 30 years difference in mean age at consent between those with GRD and RV disease. Finally, as shown in Figure 3C, there was a higher likelihood of individual CKD patients having more than one assigned renal disease diagnosis at higher ages. Among those multiple diagnoses, renovascular disease was the leading assignment.
FIGURE 3.
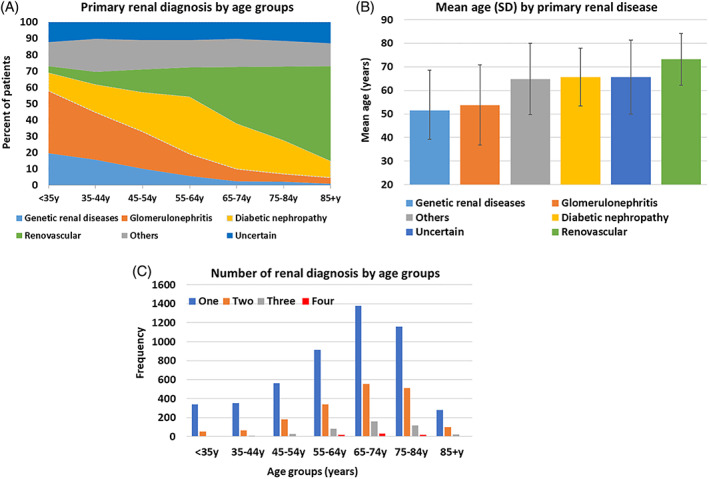
Assigned renal diagnoses (n = 7,060). A. Assigned primary renal diagnosis by age group at consent. B. Assigned primary renal diagnosis and mean (SD) age at consent. C. Number of renal diagnoses by age group (9 sites, n = 7,060)
3.2. Comorbidities and Obesity in CKD patients
The median number of comorbidities in CKD patients was five, with a maximum exceeding 15. The leading comorbidities, and the age dependency of most, are shown in Figure 4. Most persons had hypertension. We have described medications and the degree of blood pressure control in a subset of sites in the previous manuscript. 16 , 21 Almost half of all patients had diabetes (mostly type 2). Cardiovascular disease in its various manifestations was very common. Notable too were the proportions of patients with arthritis, respiratory disease, and malignancies, particularly in older persons.
FIGURE 4.
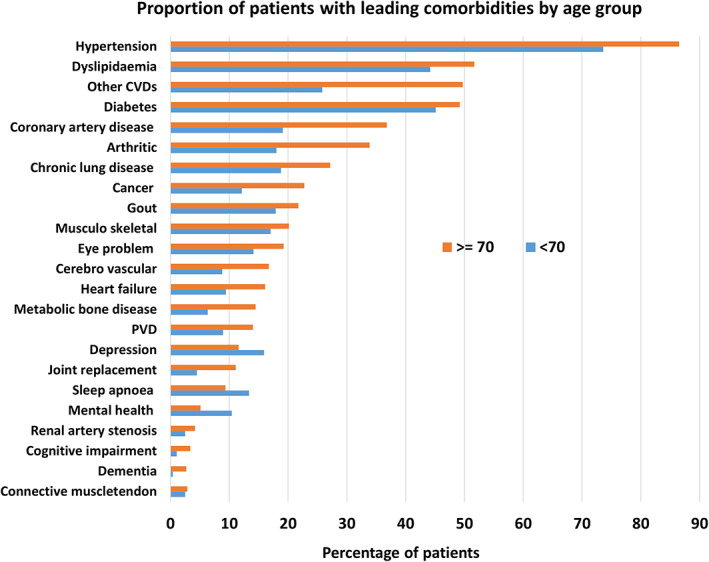
Leading 23 comorbid conditions by age group (9 sites, n = 7,060)
In an earlier manuscript describing BMI in 3,382 CKD patients from 3 sites, 50.5% had a BMI ≥ 30 kg/m2, which, with age adjustment, was 1.9 times the general adult Australian population in 2014. 14 , 27 In that sample, higher BMIs were powerfully linked to diabetes, diabetic nephropathy, hyperlipidemia, obstructive sleep apnea and gout, and significantly correlated with cardiovascular disease. In this updated report, drawing on 4,481 patients from the 4 sites in which recordings of BMI or height plus weight could be retrieved for >75% of participants within a year of recruitment, 81% of patients were overweight or obese: 29.3% had a BMI of 25‐< 30 kg/m2 (overweight), and 51.7% had a BMI ≥ 30 kg/m2 (obese). These contrast with the reported prevalence of overweight and obesity of 66.9% in adult Australians in 2017–2018, 28 with 35.6% overweight and 31.3% obese. In this current updated study, proportions with various degrees of obesity were 40.3%, 64.8% and 68.3% in persons without diabetes, with diabetes and with diabetic nephropathy, respectively. Figure 5A shows that only CKD patients with GRD had rates of obesity approximating, although still higher than, those of the survey Australian adults. Figure 5B shows that proportions with overt albuminuria/proteinuria were higher in those with greater degrees of obesity, although the differences, albeit significant, were not striking. Finally, Figure 5C shows greatly excessive rates of obesity in those with all stages of CKD, although relatively less extreme in persons with Stage 4 and 5 CKD.
FIGURE 5.
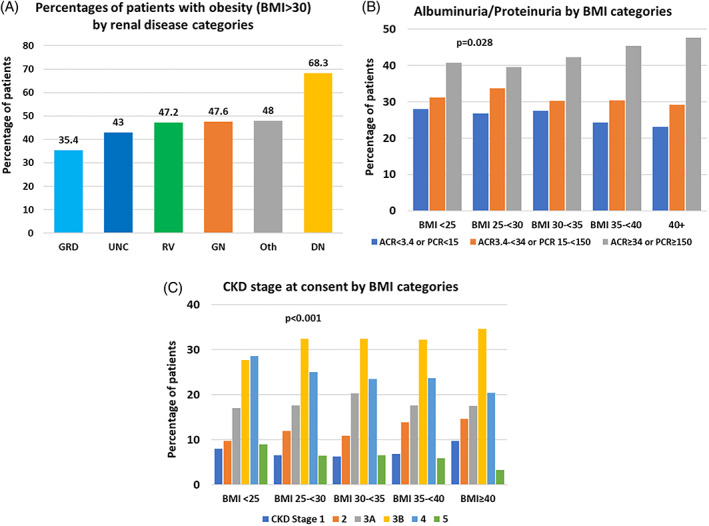
BMI by renal diagnoses, CKD stages and albuminuria/proteinuria categories at consent (4 sites, n = 4,481). A. Proportion of patients with obesity (BMI ≥ 30) by renal disease categories. B. Proportion of patients by CKD stage and BMI categories at consent. C. Proportion of patients by albuminuria/proteinuria and BMI categories at consent
3.3. Progression of CKD patients and their endpoints
Among the cohort there were substantial rates of progression by various definitions. However, progression was not inevitable, at least over the short and intermediate term. 17 Data were available, or could be imputed, to estimate eGFR changes over the first year after consent in 5,184 persons, or 83.3% of those who had been enrolled at least 9 months before the censor date. (842 persons had been enrolled for less than 9 months prior to the censor date and “1‐year” data could not easily be retrieved for eGFR levels within a 6 month window of the first‐year of follow up in some early enrollees before electronic records were introduced. As Figure 6A shows, eGFR fell by >5 ml/min/1.73 m2 over the first year in 28.0%, remained within 5 ml/min/1.73 m2 of baseline for 52.3%, and rose by ≥5 ml/min/1.73 m2 in 19.7% of subjects. These trends were generally retained at the second year after consent (not shown). Figure 6B shows that, among those with progressively less favourable eGFR changes, there were significantly higher proportions of males, of persons with diabetes and with diabetic nephropathy, (but not of obesity), with overt albuminuria/proteinuria, and with a history of heart failure, as well as indigenous persons.
FIGURE 6.
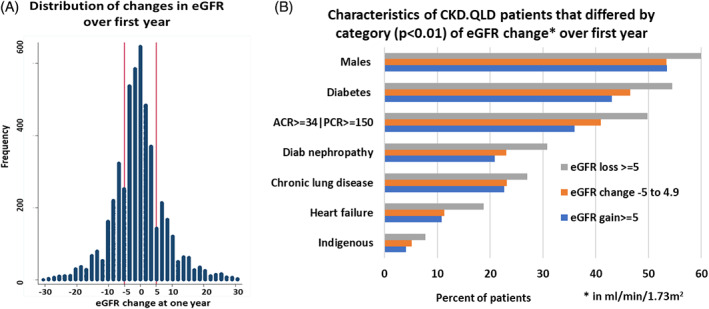
Characteristics of CKD patients by eGFR change. A. Change in eGFR in the first year of observation after consent (n = 5,184). B. Characteristics of CKD. QLD patients that differ by category of eGFR change over first year
Over the total follow‐up of 24,968 person years and a median follow up of 3.4 years (IQR 1.4–5.7 years), 730 persons (10%) started maintenance KRT, and 1,369 (18.8%) died without starting KRT, with incidence rates of 2.9 (CI: 2.7–3.1) and 5.5 (CI: 5.2–5.8) per 100 person years, respectively. Of those who died without receiving KRT, 45% had an underlying or associated cause of death compatible with renal failure. The proportion of people with the “terminal” outcome of ESKF, who either started KRT or died a renal death, was nearly 20%, with an incidence of 5.54 (CI: 5.3–5.8) per 100 person years. Table 1 shows that the incidences of death without KRT and of ESKF increased progressively with more advanced CKD stage at recruitment, while initiation of KRT was largely confined to subjects with Stages 4 and 5 CKD at recruitment. Median eGFR within 2 weeks of the start of dialysis was 8 ml/min/1.73 m2. Figures 7A and 7B show the time courses of these events. There was an 18‐year difference between the age at which maintenance KRT was started in those who eventually received that treatment, and the age of death of the 1,368 persons who died without ever receiving KRT, with median (IQR) ages of 61.9 years (52–70) vs. 79.5 years (72.5–85.7), respectively; Figure 7C shows their clearly distinct age distributions. Those who died without receiving KRT also had more comorbidities than those who started KRT; as shown in Figure 7D. Although only marginally reflected in the median values (5 vs, 4 comorbidities per person), there were different weightings of those burdens, as shown in Figure 7D.
TABLE 1.
Incidence rates by CKD stage at enrolment for KRT and for death without KRT
| CKD Stages | Rate (CI) of KRT per 100 person yr FU f/u* | Rate of death without KRT per 100‐person yr f/u* (CI) |
|---|---|---|
| Stage 1 | 0.2 (0.1–0.5) | 0.6 (0.4–1.1) |
| Stage 2 | 0.5 (0.3–0.8) | 1.5 (1.2–2.0) |
| Stage 3A | 0.6 (0.4–0.8) | 2.9 (2.4–3.4) |
| Stage 3B | 1.2 (1.0–1.4) | 5.2 (4.8–5.7) |
| Stage 4 | 5.1 (4.5–5.7) | 10.0 (9.2–10.9) |
| Stage 5 | 34.0 (30.0–38.0) | 18.0 (15.3–21.1) |
| Overall | 2.9 (2.7–3.1) | 5.5 (5.2–5.8) |
f/u = follow up.
FIGURE 7.
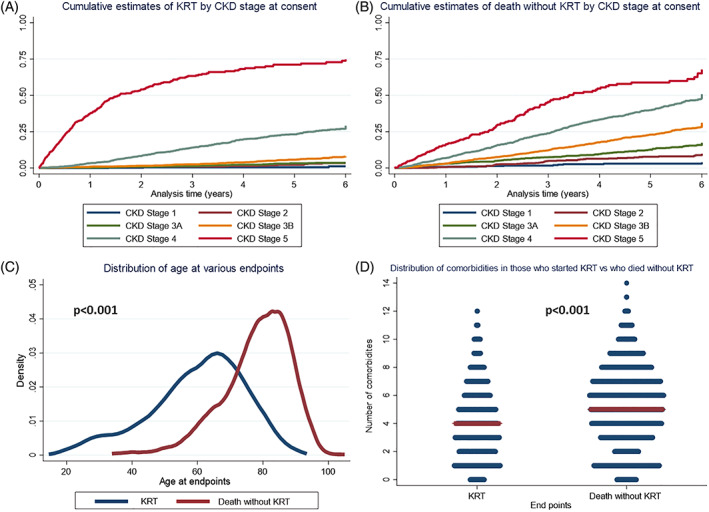
A. Time course of cumulative incidence of starting KRT up to 6 years of follow up by CKD stages. B. Time course of cumulative incidence of death without KRT up to 6 years of follow up by CKD stages. C. Differences in age distribution at start of KRT and death without KRT. D. Numbers of comorbidities at enrolment of persons who started KRT and who died without KRT
3.4. CKD in Australian indigenous people
Indigenous patients with CKD were, on average, 10 years younger at consent than non‐indigenous patients, with median (IQR) ages of 61 years (51.5–69.7) and 69 years (57.8–77.3), p < .001; 48% of nonindigenous persons and 24.1% of Indigenous persons were ≥ 70 years of age at enrolment, p < .001. Indigenous patients were more often female (51.5%), more likely to have diabetes (64.1% vs. 45.4%) and almost twice as likely to have diabetic nephropathy (40.9% vs. 23%) compared to non‐indigenous patients. Incidence rates of starting KRT were higher in Indigenous than non‐Indigenous CKD patients, (5.8 vs. 2.7 per 100 person years), but rates of deaths without KRT were not different (5.3 vs. 5.5 per 100 person years).
4. DISCUSSION
This manuscript describes representative persons with CKD seen in public renal specialty practices in one state in Australia. To our knowledge, it is the first in any region of the country. It fills the knowledge gap between CKD in community and in primary care and end points of death or KRT.
These persons have a much broader profile than that of people who start KRT, who have been characterized by many dialysis and transplant registries, but who constitute only the minority of the broader CKD population.
Half the group was ≥68 years of age at time of consent. Only 10% went on to KRT within the observation period. The average age of those who went onto KRT was 61.9 years (similar to the mean age of the Australia‐wide incident KRT cohort 24 ) which is almost 10 years younger than aggregate CKD cohort's age at the end of the observation period (71.5 yrs.), and much younger than those who died without receiving KRT (78.1 yr). Thus, the scope of CKD practice of Queensland renal care providers goes well beyond the care of the minority of patients destined for KRT, and encompasses major problems with obesity, excessive burden of co‐morbid conditions, and syndromes of ageing, including frailty, dependency, and cognitive impairment.
There was considerable variation among sites in proportional assignments of primary kidney diseases. This needs further analysis with population‐based estimates of incidence and prevalence, mapping by demographic and biologic features, and attention to potential environmental and occupational exposures. There is also great variation by age, with increasing dominance of a renovascular diagnosis at more advanced ages, when it exceeds diabetic nephropathy, and with much lower proportions of the traditional kidney diseases that are central to classic nephrology teaching. Furthermore, older people had more advanced stage CKD and more often had multiple kidney disease diagnoses, with renovascular disease predominating; this is likely a component of generalized vascular disease, which influences the overall clinical picture and prognosis.
The association of the bulk of CKD with obesity is inescapable. Nearly a third of Australian adults are obese, and rates in these CKD.QLD patients, in turn, are 1.9 times those of the mainstream population. 14 Although obesity was most pronounced among CKD patients with diabetes, patients with all other renal diagnosis had excessive rates of obesity, except, arguably, those with genetic renal disease. Our data suggest that CKD associated with, driven by, or exacerbated by, excessive BMIs is characterized by somewhat higher levels of albuminuria/proteinuria, and relatively less advanced CKD stages. It is well accepted that obesity‐associated CKD can be prevented and modified. 29 The growing burden of CKD and the looming threat of unsustainable costs of KRT, as well as the more obvious risks and complications of diabetes, might further stimulate Australian national policies to minimize obesity.
The predominance of renovascular disease in older persons flags the need for prospective functional evaluations, proactive predictions of survival and quality of life, and strengthening of supportive kidney care and pending end‐of‐life protocols.
The spectrum of eGFR changes over the first year of follow up, which include stability or increase in eGFR in almost half the subjects, infers that CKD progression might not be inevitable, and for some, potential for partial kidney functional recovery seems real. The heavier representations of males, Indigenous persons, and those with diabetes, diabetic nephropathy, heavy proteinuria, histories of heart failure and sleep apnea, among those who lost renal function, will be further pursued in studies of progression, which will include potential indicators flagged by hospital admissions. The profusion of newer agents for the management of diabetes, diabetic nephropathy, and CKD more broadly, with their added mitigation of cardiovascular risk, 30 , 31 holds enormous promise for a better future.
Almost twice as many people died without KRT as started that treatment, and those deaths increased over a continuum of CKD stages. The differences in ages at which people reached those endpoints show that these persons are largely different populations. Those who died without KRT had survived without ESKF, on average, 18 years longer than those who started KRT and had generally exceeded the life expectancy of their birth cohort (life expectancy for people born in 1940 was about 62 years). CKD is but one accompaniment of their increased longevity. For many, CKD itself is a co‐morbidity, rather than the major clinical problem in people approaching end of life. These facts underpin increasing choice of non‐KRT kidney supportive care for many CKD patients who develop ESKF along this trajectory.
The strength of this project lies in the absence of selection bias in recruitment of the study population. Patients were not recruited for a clinical trial, nor based on a particular kidney disease diagnosis, or CKD stage. The only exclusions were the <0.2% of all patients approached who could not consor refused to consent.
The similarities of Queensland's general population and its incident KRT population with those of the rest of Australia suggest that these findings on CKD might apply more broadly across the country. However, these CKD.QLD patients are only a sample of people referred to public renal specialty practices. Furthermore, they do not include CKD patients seen exclusively in private kidney care practices or in other specialty settings like diabetes or cardiovascular practices. They represent more advanced stages of CKD and do not reflect characteristics of people with asymptomatic or early‐stage disease or those seen solely in general or family practice settings. Although patients from one large referral site were decanted, this did not change the overall profiles of the study group.
There are still many topics to pursue. A better understanding of regional differences is important, as well as socioeconomic correlates of profiles. Determinants of CKD progression, the causes, costs and outcomes of AKI, 15 and the separate and combined impacts of anaemia and heart failure on AKI and CKD progression are under study. We also have detailed hospital admission and cost data over a 9‐year interval for all CKD.QLD registry patients, as well as on persons with CKD in other care settings, plus a comparator population of demographically matched persons without CKD. Finally, we hope that the major advances in CKD treatments might be reflected in measurably better outcomes for CKD patients within a few years of their widespread application.
FUNDING INFORMATION
Funding for the establishment of CKD.QLD has been provided by Professor Wendy E Hoy NHMRC Australian Fellowship, the NHMRC CKD.CRE APP1079502, the Colonial Foundation (Melbourne, Australia), AMGEN Australia and Queensland Health. None of these funding bodies had any role in the design of the study and collection, analysis, and interpretation of data and in writing the manuscript.
CONFLICT OF INTEREST
All the authors have nothing to disclose. This manuscript paper has not been published previously in whole or part, except in abstract format.
ACKNOWLEDGEMENTS
Thanks to Chris Banney, Leanne Brown, Katrina Duff, Sridevi Govindarajulu, Stella Green, Murthy Divi, Stamatina Katsanevas, Erica Lennan, Valli Manickam, Chetana Naresh, Andrea Pollock, Vikas Srivastava, Ada Stevenson, John Killen, Lois Burlund, Andrea Rolfe, Rebecca Barton, Joise Skewes, Michele Harvey, Rachael Brown, Balaji Hiremagalur, Lorraine Bubblitz, Sonya Coleman, Bernadette Taylor, Janine Hale, Sonny Huynh, Anitha Dinesh, Robyn Moyle, Cassandra Stone, Anne Dunne, Andrew Winn, Anne Graham, Peter Miach, Barbara Harvie, Mandy Zweedyk, and to all the patients who participated in the Registry to help inform chronic kidney disease in Queensland. Open access publishing facilitated by The University of Queensland, as part of the Wiley ‐ The University of Queensland agreement via the Council of Australian University Librarians.
Hoy WE, Wang Z, Zhang J, et al. Chronic kidney disease in public renal practices in Queensland, Australia, 2011–2018. Nephrology. 2022;27(12):934‐944. doi: 10.1111/nep.14111
Subject Editor: Kashihara, Naoki
Funding information AMGEN Australia; Department of Health, Queensland; National Health and Medical Research Council, Grant/Award Number: APP1079502; The Colonial Foundation (Melbourne, Australia)
REFERENCES
- 1. Neovius M, Jacobson SH, Eriksson JK, Elinder CG, Hylander B. Mortality in chronic kidney disease and renal replacement therapy: a population‐based cohort study. BMJ Open. 2014;4:e004251. [DOI] [PMC free article] [PubMed] [Google Scholar]
- 2. Kidney Health Australia . Pre‐Budget Submission 2016–2017 Federal Budget Charting a Comprehensive Approach to Tackling Kidney Disease “Proposals to guide increased risk assessment, support early detection and improve the treatment of kidney disease”. 2017.
- 3. Tuttle KR, Alicic RZ, Duru OK, et al. Clinical characteristics of and risk factors for chronic kidney disease among adults and children: an analysis of the CURE‐CKD registry. JAMA Netw Open. 2019;2:e1918169. [DOI] [PMC free article] [PubMed] [Google Scholar]
- 4. Bello AK, Ronksley PE, Tangri N, et al. Prevalence and demographics of CKD in Canadian primary care practices: a cross‐sectional study. Kidney Int Rep. 2019;4:561‐570. [DOI] [PMC free article] [PubMed] [Google Scholar]
- 5. Lash JP, Go AS, Appel LJ, et al. Chronic renal insufficiency cohort (CRIC) study: baseline characteristics and associations with kidney function. Clin J Am Soc Nephrol. 2009;4:1302‐1311. [DOI] [PMC free article] [PubMed] [Google Scholar]
- 6. Park JI, Baek H, Jung HH. Prevalence of chronic kidney disease in Korea: the Korean National Health and nutritional examination survey 2011‐2013. J Korean Med Sci. 2016;31:915‐923. [DOI] [PMC free article] [PubMed] [Google Scholar]
- 7. Kleophas W, Bieber B, Robinson BM, et al. Implementation and first results of a German chronic kidney disease registry. Clin Nephrol. 2013;79:184‐191. [DOI] [PubMed] [Google Scholar]
- 8. Reichel H, Zee J, Tu C, et al. Chronic kidney disease progression and mortality risk profiles in Germany: results from the chronic kidney disease outcomes and practice patterns study. Nephrology, Dialysis, Transplantation: Official Publication of the European Dialysis and Transplant Association ‐ European Renal Association. 2020;35:803‐810. [DOI] [PMC free article] [PubMed] [Google Scholar]
- 9. Australian Bureau of Statistics . National, state and territory population, September 2020. 2020.
- 10. Australian Bureau of Statistics . Census of Population and Housing – Counts of Aboriginal and Torres Strait Islander Australians, 2016, released on 31 August 2017. 2016.
- 11. Owens EP, Hoy WE, Cameron A, Coombes JS, Gobe GC. An Australian chronic kidney disease biobank to support future research. Open J Bioresour. 2019;6:2. [Google Scholar]
- 12. Kidney Health Australia . Chronic Kidney Disease (CKD) Management in General Practice Guidance and clinical tips to help identify, manage and refer patients with CKD in your practice. 3rd ed. 2015.
- 13. Mahmood U, Healy HG, Kark A, et al. Spectrum (characteristics) of patients with chronic kidney disease (CKD) with increasing age in a major metropolitan renal service. BMC Nephrol. 2017;18:372. [DOI] [PMC free article] [PubMed] [Google Scholar]
- 14. Wang Z, Zhang J, Chan S, et al. BMI and its association with death and the initiation of renal replacement therapy (RRT) in a cohort of patients with chronic kidney disease (CKD). BMC Nephrol. 2019;20:329. [DOI] [PMC free article] [PubMed] [Google Scholar]
- 15. Zhang J, Healy HG, Baboolal K, et al. Frequency and consequences of acute kidney injury in patients with CKD: a registry study in Queensland Australia. Kidney Med. 2019;1:180‐190. [DOI] [PMC free article] [PubMed] [Google Scholar]
- 16. Zhang J, Healy HG, Venuthurupalli SK, et al. Blood pressure management in hypertensive people with non‐dialysis chronic kidney disease in Queensland. Australia BMC Nephrol. 2019;20:348. [DOI] [PMC free article] [PubMed] [Google Scholar]
- 17. Abeysekera RA, Healy HG, Wang Z, Cameron AL, Hoy WE. Heterogeneity in patterns of progression of chronic kidney disease. Intern Med J. 2021;51:220‐228. [DOI] [PubMed] [Google Scholar]
- 18. Mallett A, Patel C, Salisbury A, Wang Z, Healy H, Hoy W. The prevalence and epidemiology of genetic renal disease amongst adults with chronic kidney disease in Australia. Orphanet J Rare Dis. 2014;9:98. [DOI] [PMC free article] [PubMed] [Google Scholar]
- 19. Dienemann T, Fujii N, Orlandi P, et al. International network of chronic kidney disease cohort studies (iNET‐CKD): a global network of chronic kidney disease cohorts. BMC Nephrol. 2016;17:121. [DOI] [PMC free article] [PubMed] [Google Scholar]
- 20. Orlandi PF, Huang J, Fukagawa M, et al. A collaborative, individual‐level analysis compared longitudinal outcomes across the international network of chronic kidney disease (iNETCKD) cohorts. Kidney Int. 2019;96:1217‐1233. [DOI] [PubMed] [Google Scholar]
- 21. Alencar de Pinho N, Levin A, Fukagawa M, et al. Considerable international variation exists in blood pressure control and antihypertensive prescription patterns in chronic kidney disease. Kidney Int. 2019;96:983‐994. [DOI] [PubMed] [Google Scholar]
- 22. Venuthurupalli SK, Healy H, Fassett R, Cameron A, Wang Z, Hoy WE. Chronic kidney disease, Queensland: profile of patients with chronic kidney disease from regional Queensland, Australia: a registry report. Nephrology (Carlton). 2019;24:1257‐1264. [DOI] [PubMed] [Google Scholar]
- 23. National Kidney Foundation . K/DOQI clinical practice guidelines for chronic kidney disease: evaluation, classification, and stratification. Amer J Kidney Dis. 2002;39:S1‐S266. [PubMed] [Google Scholar]
- 24. ANZDATA Registry . 43rd report, chapter 1: incidence of renal replacement therapy for end stage kidney disease. Australia and New Zealand Dialysis and Transplant Registry. Australia and New Zealand Dialysis and Transplant Registry; 2020. [Google Scholar]
- 25. Mathew TH, Johnson DW, Jones GR. Australasian creatinine consensus working G. chronic kidney disease and automatic reporting of estimated glomerular filtration rate: revised recommendations. Med J Aust. 2007;187:459‐463. [DOI] [PubMed] [Google Scholar]
- 26. Molinario R, Pocino K, Daloiso PD, et al. Urinary albumin detection: comparison of two different methods. J Clin Lab Anal. 2016;30:888‐891. [DOI] [PMC free article] [PubMed] [Google Scholar]
- 27. Chan S, Cameron A, Wang Z, et al. Body mass index in an Australian population with chronic kidney disease. BMC Nephrol. 2018;19:209. [DOI] [PMC free article] [PubMed] [Google Scholar]
- 28. Australian Institute of Health and Welfare . Overweight and obesity. July 7, 2022.
- 29. Kovesdy CP, Furth SL, Zoccali C. World kidney day steering C. obesity and kidney disease: hidden consequences of the epidemic. Can J Kidney Health Dis. 2017;4:1‐10. doi: 10.1177/2054358117698669 [DOI] [PMC free article] [PubMed] [Google Scholar]
- 30. Breyer MD, Susztak K. The next generation of therapeutics for chronic kidney disease. Nat Rev Drug Discov. 2016;15:568‐588. [DOI] [PMC free article] [PubMed] [Google Scholar]
- 31. de Boer IH, Caramori ML, Chan JCN, et al. Executive summary of the 2020 KDIGO diabetes management in CKD guideline: evidence‐based advances in monitoring and treatment. Kidney Int. 2020;98:839‐848. [DOI] [PubMed] [Google Scholar]


