Abstract
Defect detection in additive manufacturing (AM) is of paramount importance to improve the reliability of products. Nondestructive testing is not yet widely used for defect detection. The main challenges are a lack of standards and methods, the types and location of defects, and the complex geometry of many parts. During selective laser melting (SLM), several types of defects can occur such as porosity, cracking, and lack of fusion. In this study, several nondestructive tests were conducted in a highly complex shaped part in AISI 316L stainless steel with real defects manufactured by SLM. Two additional artificial defects (one horizontal and one flat bottom hole) were produced and the defect detectability was evaluated. The techniques used were as follows: dye penetrant, infrared thermography, immersion ultrasonic, eddy current, and X-ray microcomputed tomography to assess different types of defects in the as-built part. We conclude that no single technique can detect every type of defect, although multiple techniques provide complementary and redundant information to critically evaluate the integrity of the parts. This approach is fundamental for improving the reliability of defect detection, which will help expand the potential for using AM to produce parts for critical structural applications.
Keywords: nondestructive testing, powder bed fusion, selective laser melting, X-ray μCT, thermography
Introduction
Additive manufacturing (AM) technologies enable the creation of geometrically complex parts in a layer-by-layer deposition process.1 Selective laser melting (SLM) is currently the most studied AM process where melting occurs. Compared with more conventional manufacturing technologies, SLM offers several advantages, both technological and economical. Technologically, there is substantial freedom in design, that is, virtually any shape can be produced. Economically, the major advantages include short production times, no need to change machines and tools, and little or no material waste.2
However, in metal powder-based AM processes, there are still challenges that need to be surpassed to allow consistent inspection and characterization. Moreover, issues related to geometric and microstructural features often limit the application of existing nondestructive testing (NDT) techniques.3 Depending on the powder size and the chemical composition of the material and processing parameters, several types of defects may occur that can compromise in-service performance.4,5 The most common defects in parts produced by SLM are porosity, cracking, lack of fusion (LoF), and local formation of oxides or brittle phases. Two additional characteristics of parts produced by SLM are anisotropy and residual stresses, both of which affect mechanical behavior.
There are two stages where the integrity of the part can be accessed: during production between layer deposition (in-line inspection) or after the part is finished (offline inspection). The first is highly desirable because it allows detection of defects when they occur, that is, before additional layers are applied, and the operator can intervene to remove defects. However, in-line inspection during SLM cannot be easily conducted, and it is the subject of ongoing research activity.6,7
Various research groups have evaluated several nondestructive techniques. In powder-based fusion AM, dynamics and stability of the molten pool are determined by the temperature field. Thus, thermographic inspection is a suitable technique for in-line inspection that can also provide valuable insights regarding the material cooling rates, which can be related to the microstructure development and mechanical properties.8 Berumen et al.9 used a thermographic camera for in-line inspection of laser powder bed fusion. Electromagnetic radiation emitted by the melt pool is transmitted through the scan head to a high-speed camera and a photodiode. The camera measures the dimensions of the melt pool and the photodiode sensor measures the radiation emitted; this assessment also yields the temperature or the temperature gradient across the build area.9 Another technique tested was a low-coherence interferometry imaging technique, called in-line coherent imaging (ICI), coaxially integrated into the SLM process to monitor the morphology changes and the stability of the melt pool. By exploiting the high-speed imaging rate, time-resolved ICI measurements revealed that molten pool fluctuations strongly influence the integrity of a layer. Defects resulting from poor process parameter regimes were also detected.10 Another in situ method of interest for incorporation into the SLM machine is integrated infrared (IR) thermography. The IR thermography was highly effective in identifying LoF defects; however, porosities were not detected effectively.11
To date, no individual NDT technique has proven to be fully adequate for inspection of defects in AM parts but only suitable for a given scope.12 Since there is no applicable standard yet, such testing is performed according to existing experience and the facilities available, usually at the manufacturer.13 The quality of components produced by AM (AM parts) is typically assessed by either destructive testing or X-ray computed tomography (XCT) after manufacturing is completed.5 XCT has been used for porosity measurements of SLM samples. However, there still is the need for increased resolution for the detection of small pores to allow for higher accuracy and precision in pore measurements.14 XCT enables visualization of the inner structure, although the resolution is limited by the sample size. Sample sizes of several millimeters enable XCT data resolution of about tens of micrometers.13–16
In this article, a benchmarking of several complementary NDT techniques is proposed for specific complex parts. The configuration of the part to be inspected has a great influence on which techniques are selected because defects may occur in areas that are difficult to access by a probe or detector.
Experimental Setup
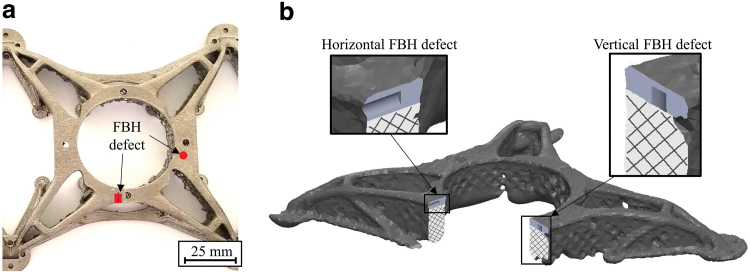
Figure 1 depicts the sample used in this work. Its geometry was chosen with the objective of not favoring any of the techniques compared. It was produced in an SLM machine with a 400 W fiber laser, a beam focus diameter of 60 μm, a scan speed of 1 m/s, and a deposited layer thickness of 25 μm, under an Argon atmosphere. The gas-atomized AISI 316L stainless steel powder had 90% of its particles with a diameter below 46 μm and was supplied by LPW Technologies.
FIG. 1.
Part produced by selective laser melting with identification of defects: (a) photograph of the produced; (b) schematic representation of the produced artificial defects: horizontal and vertical FBH with 4 mm diameter. FBH, flat bottom hole. Color images are available online.
Specimens were removed for inspection using five different NDT techniques: dye penetrant inspection, IR thermography, immersion ultrasonic testing, eddy current (EC) testing, and X-ray microcomputed tomography. A vertical flat bottom hole (V-FBH) defect with 4 mm of diameter was intentionally produced from the bottom of the part, leaving the upper surface of the part intact. A horizontal flat bottom hole (H-FBH) defect was also produced with 4 mm of diameter. A schematic representation of each defect is presented in Figure 1.
It is important to emphasize that regarding V-FBH, despite its large dimension, it properly simulates a horizontal delamination defect, since the defect depth is not relevant for the reliability of the ultrasonic and thermography techniques. In fact, both NDT techniques are only sensible to the material discontinuities, and thus for those techniques, the FBH can be assumed as an effective simulation of a delamination or internal circular crack with 4 mm diameter. The abovementioned NDT techniques were performed before and after the FBH defect production.
Dye penetrant inspection was performed on the component that had been previously cleaned and rinsed with water. Two sets of dye penetrant liquids were used, one with high sensitivity (level 4) and another with medium sensitivity (level 2). According to the common procedure in the dye penetrant tests,17 a dwell time of 15 min was established between applying the penetrant liquid and the developer. The excess penetrant liquid was removed from the surface first with a dry cloth and then with a damp cloth.
For high-sensitivity inspection (level 4), a KD-Check PR-1 solvent cleaner was used to remove any dirt and grease on the surface under test to unblock all possible defects; for medium-sensitivity inspection (level 2), FLUXO S190 was used. The red dye penetrant liquids for high- and medium-sensitivity tests were KD-Check RDP-1 and MR68NF, respectively. To reveal the defects, a white KD-Check SD-1 developer was applied for the high-sensitivity penetrant, and MR70 was applied for the medium-sensitivity penetrant. The inspection procedure was performed according to ISO 3452-1:2013 and ISO 3059:2012.
A passive thermography test was performed using an IRSX-I336 IR camera to acquire transient temperature images during the tests. The camera with a temperature measurement ranges from −25°C to +135°C, can measure with a noise equivalent temperature difference of 30 mK, and has an accuracy of 2°C. The spectral range varies from 7.5 to 13 μm and the camera has a frame acquisition rate of 9 Hz. An electrical current was imposed between the two extreme points of the sample to promote internal heating of the material and, consequently, an increase in the temperature of the part. This heating is due to the Joule effect and thus it is more pronounced in defective areas due to their reduced section area. A Keithley power supply of 720 W supplied the electrical current. Tests were carried out where the current was varied from 10 to 50 A in 10 A increments, and with exposure times of 1, 3, and 5 min.
EC tests were applied to measure the electrical conductivity field of the material18 using an absolute helical shielded EC probe, with 3 mm diameter operating in bridge mode and Olympus Nortec 500C impedance measurement equipment. The test was performed in an XY moving table with a working envelope of 2760 × 1960 × 2000 mm and a maximum resolution of ±0.01 mm that allowed mapping of the surface under inspection.
For the ultrasonic inspection, we used a General Electric Krautkramer USM 36. This equipment allows the time (s) or the space (mm) traveled by the sound waves to be read as a function of the gain (dB) set by the user. A commercial immersion probe with 6.35 mm diameter piezoelectric (Olympus) operating at 10 MHz was used to inspect the specimens with 3 mm of water as a coupling fluid.
Nondestructive X-ray microcomputed tomographic (XμCT) imaging was performed on the sample using a Thermo Fisher Scientific HeliScan MicroCT. The sample was scanned with a source voltage of 100 kV and a current of 50 μA using a space filling trajectory.19 At the time of scanning, the HeliScan MicroCT was in its high-resolution mode and low X-ray flux, which restricted the maximum tube voltage to 100 kV. The total scan time was 316 min, including a 30-min warm-up and stabilization. The reconstructed tomogram has a voxel size of 64.3 μm and a field of view of 2750 × 2750 × 1261 voxels. The sample was mounted vertically to minimize the projected thickness of the material. This minimizes the X-ray flux necessary to illuminate each radiograph. Given the region of interest and desired spatial resolution, the specimen mounting geometry was selected such that it was not possible to scan the whole sample in one scan using the HeliScan.
Results and Discussion
Dye penetrant testing
Dye penetrant was applied aiming to detect surface defects that are imperceptible by visual inspection. Dye penetrant inspection is a multiapplication technique; it can be easily adapted to different part sizes and geometries, requiring short inspection times at a low cost when compared with other NDT techniques. When applied to the sample surface, the penetrant liquid seeps into the cavities of superficial defects by capillarity. Excess dye penetrant is removed, and a developer is applied to absorb the liquid retained inside the defects; the developer reveals a colored pattern indicative of a defect on the surface under test. According to the American Society of Metals,20 the technique is classified on the basis of the penetrant type: fluorescent (Type I), visible (Type II), water washable (Method A), postemulsifiable-lipophilic (Method B), solvent removable (Method C), and postemulsifiable-hydrophilic (Method D). Penetrants are also divided into five levels of sensitivity: ultralow (Level 1/2), low (Level 1), medium (Level 2), high (Level 3), and ultrahigh (Level 4).
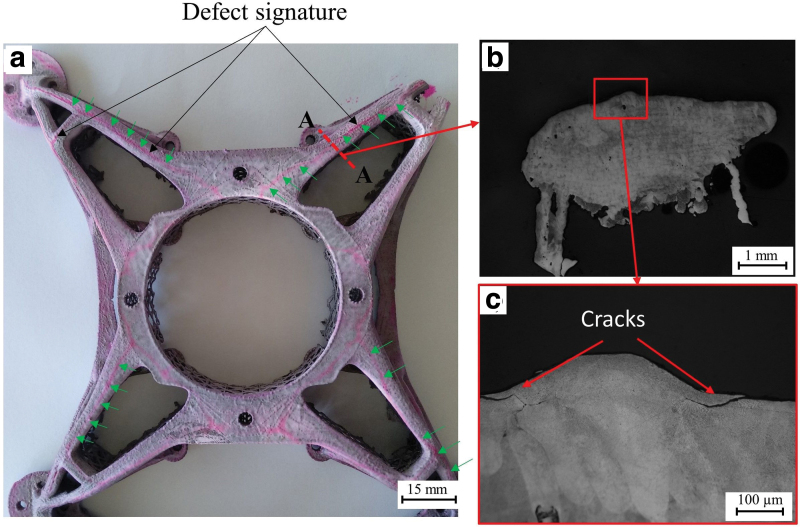
In this study, dye penetrants of sensitivity levels 2 and 4 were used because of the surface roughness of the AM part, which is a constraint of the dye penetrant inspection technique. Figure 2 shows the results obtained with dye penetrant level 4, a highly sensitive penetrant that is widely used. However, this penetrant identifies the surface roughness of the AM part as a defect and does not distinguish it from actual surface defects. Therefore, a less sensitive dye penetrant is preferable to detect small defects while filtering the effect of the surface condition.
FIG. 2.
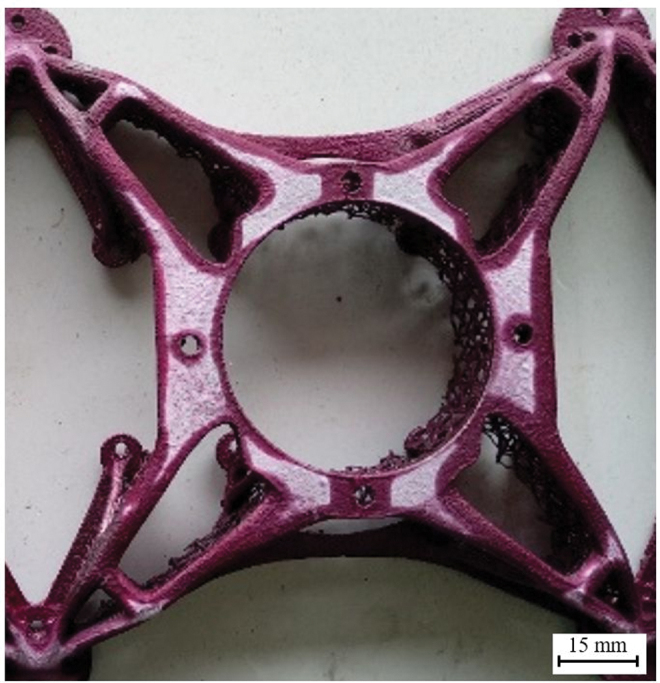
Result of level 4 dye penetrant test. Color images are available online.
The sensitivity level 2 penetrant revealed the presence of a defect (Fig. 3). To confirm and characterize the morphology of this defect, the part was cut perpendicular to the defect and observed by optical microscopy. A crack between layers was identified on both sides of the last layer, and the penetrant test with sensitivity level 2 proved to be adequate for its detection. The dye penetrant test is not able to detect fully enclosed defects. Likewise, the FBH defects are not superficial and were not inspected with this technique.
FIG. 3.
Result of level 2 dye penetrant test: (a) macrograph; (b) micrograph of cross-section A-A; (c) detail of the area in (b) indicated by the red square that reveals the previously identified cracks at high magnification. Color images are available online.
Thermography
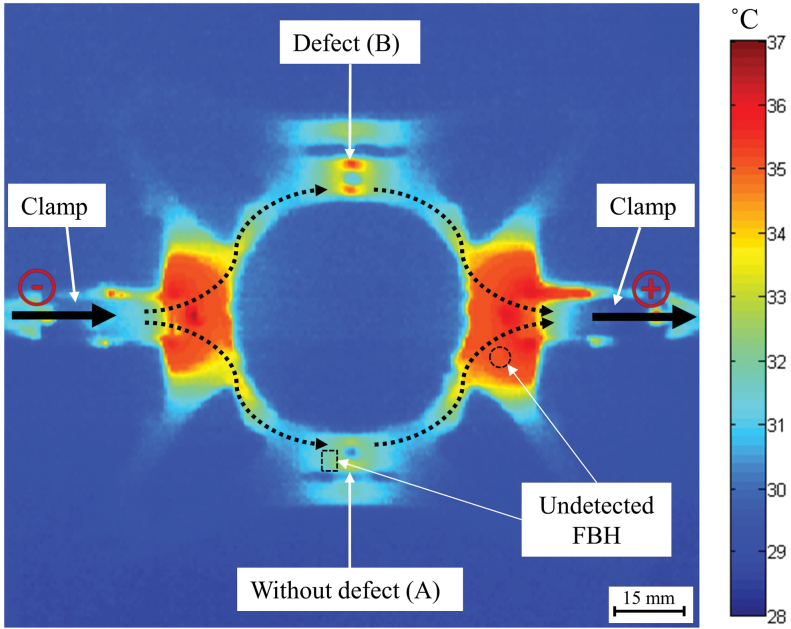
Thermography tests were conducted with volumetric heating by Joule effect using an electric DC current of 50 A. The resultant temperature field is affected by the continuity of the material, leaving a thermal signature. If a heterogeneity produces a change in the thermal conductivity of the specimen, it alters the heat flow and can be observed with an IR thermographic camera. Tests were performed with an external power source that applied an electrical current to the part ends, as shown in Figure 4, to internally excite the material.
FIG. 4.
Result of thermography test with a 50 A current intensity. Zone A no defect detected; zone B with a defect. Color images are available online.
The current intensity was increased during these tests: low values (<20 A) induce a homogeneous heating propagation, and no defects were detectable. By increasing the current intensity (>30 A), a sharp variation of temperature is observed in specific zones that correspond to areas where defects are present. Furthermore, it was observed that the temperature gradient in the defective zones was higher at the beginning of the current imposition, and at longer exposure times (3–5 min) the part temperature tends to homogenize and the defects are not visible. Due to the symmetry of the part, zones A and B should have attained the same temperature in the absence of defects. However, since zone B has a lack of material, a higher temperature is observed because of the resistance to the current flow and the resulting heat accumulation (Fig. 5). Nondestructive thermography with internal excitation detects such defects by localized variation of the thermal flow and uses a simple inspection setup. Regarding the FBH defect, it was not possible to detect it with the thermography due to its location. When compared with the defect zone (B), the adjacent region of both FBH defects has enough cross-sectional area for the current to flow, and thus, no significant temperature increase was observed.
FIG. 5.
Part details: (a) Zone A without a defect; (b) zone B with a defect. Color images are available online.
Ultrasound testing
Surface, as well as geometric, irregularity prevents adequate contact between the probe and the surface, and so, the immersion technique was preferred among the other ultrasonic techniques. The tests were performed in an XY scanning device with a spatial resolution of 0.25 × 0.25 mm with the reflected echo amplitude plotted along the Z-axis obtaining a C-scan. An RGB color scale was used to represent the reflected acoustic power detected by the probe, where the higher intensity is represented with red, and the lower intensity zones are represented with blue.
A signal-to-noise ratio (SNR) of 11.6 dB was calculated according to Equation (1), from the acquisition performed on the part surface, as plotted in Figure 6c. In NDT, its commonly accepted that SNR values above 3 dB are enough to assume that there is a significative differentiation of the defect from the noise.
FIG. 6.
Ultrasonic C-scan pattern of the tested part: (a) without the FBH defect; (b) with the FBH defect; representation of the signal amplitude along the dashed line depicted in (c). Color images are available online.
| (1) |
where s (V) is the vector that represents the signal, r (V) is the vector that represents the noise, and n (−) the length of each vector.
With the speed of the longitudinal sound waves in the stainless steel of 5750 m/s and the used frequency of 10 MHz, the wavelength calculated with Equation (2) is of 0.575 mm.
| (2) |
where λ (m) is the wavelength, v (m/s) is the sound velocity in a specific material, and f (Hz) is the frequency.
Theoretically, it is possible to detect defects that have a perpendicular dimension to the direction of the wave propagation equally or bigger than the wavelength. However, it is common to use as a standard that the technique can only detect defects that are at least twice the size of the wavelength. Since the most common porosity in SLM is microporosity with diameters below 100 μm, it is not expected to detect those kinds of defects with the performed test. To detect 100-μm-sized defects, a frequency of 115 MHz should be used, which is not common in ultrasound testing.
To evaluate the capability of the ultrasonic tests in the detection of the artificial delamination defect (FBH defects), the specimen was tested before and after the production of the defects. Before the production of the FBH defects, this part did not present any defect that could be identified with the ultrasonic (US) technique. Figure 6a and b shows the ultrasonic C-scans performed on this specimen, before and after the introduction of the FBH defect, respectively. Both results were accomplished by using the exact same experimental conditions and inspection parameters described in the previous chapter. It can be observed in Figure 6b a highlighted zone that is related to the presence of the FBH defect.
During the wave propagation, part of the acoustic power detected by the probe is due to the reflection in the upper surface of the specimen, then the remaining of it travels through the part until the next material discontinuity, which, in a zone without defect, is the lower surface of the part. However, if the part has an internal defect, the sound wave will encounter more discontinuities, which will promote a reflection wave with more intensity. In addition, the waves that are reflected in the defect surfaces travel a shorter distance than those that go through the whole thickness, which means that the attenuation in those waves is less pronounced.
Immersive ultrasonic testing proved feasible for detecting defects in AM parts, independent of the surface condition of the part. However, it is difficult to apply to nonplanar surfaces due to the need for keeping the probe perpendicular and at a constant distance from the surface.
Eddy currents testing
Eddy currents (EC) testing was performed to assess its potential for defect detection and to compare it with other techniques when applied to AM parts. EC usually can detect superficial and subsuperficial defects based on a local change in electrical conductivity within the material. It can identify defects such as cracks, inclusions, and pores. Moreover, it might also be applied to verify microstructural homogeneities or dissimilarities of materials.21 According to the EC inspection theory, the induced current does not flow homogeneously through the material thickness but tends to concentrate on the surface due to the skin effect. The standard penetration depth, δ (mm), is defined by Equation (3), where f (s−1) is the excitation frequency, μr (−) is the relative magnetic permeability (μr = μ/μ0), and σ (%IACS) is the electrical conductivity, expressed in percent International Annealed Copper Standard.22
| (3) |
The most significative results were obtained with a test frequency of 100 kHz. The relative magnetic permeability of the AISI 316L stainless steel is ∼1.0 (−) and the electrical conductivity is 2.3%IACS, leading to the calculated penetration depth of 0.62 mm.
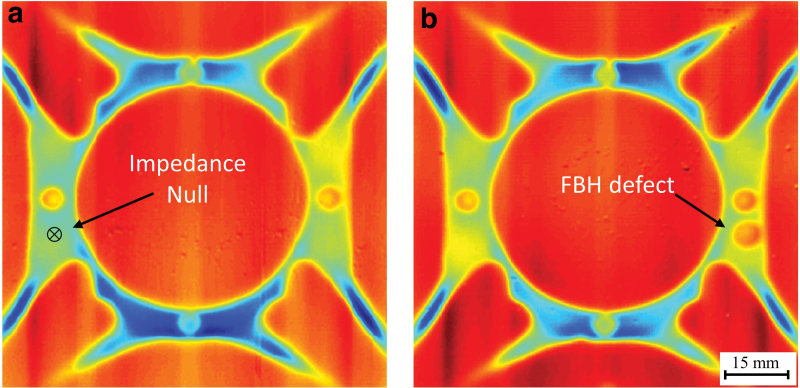
EC testing of SLM parts shows no features of interest; assuming the distance between the probe and the part, lift-off, is constant, surface roughness will not negatively affect the results. However, EC tests are difficult to be applied to nonplanar surfaces or surfaces with a nonconstant curvature.23 Often parts produced by AM have complex geometries that can make it difficult to apply EC testing. For this specific part, the obtained results in the planar upper surface (Fig. 7) clearly show the presence of the V-FBH defect. In this C-scan, the real part of the impedance is displayed in the XY plane with a resolution of 0.25 mm. The impedance reference was defined over the surface in the spot depicted in Fig. 7a). The lift-off used was 2 mm throughout the planar surface (where it was approximately planar). To maintain the lift-off constant on the planar surface, a acrylic rigid sheet was used, its thickness corresponds to the lift-off value vertical.
FIG. 7.
Eddy current test result (C-scan with the real part of the electric impedance measured displayed). (a) Without the FBH defect; (b) with the FBH defect. Color images are available online.
X-ray computed tomography
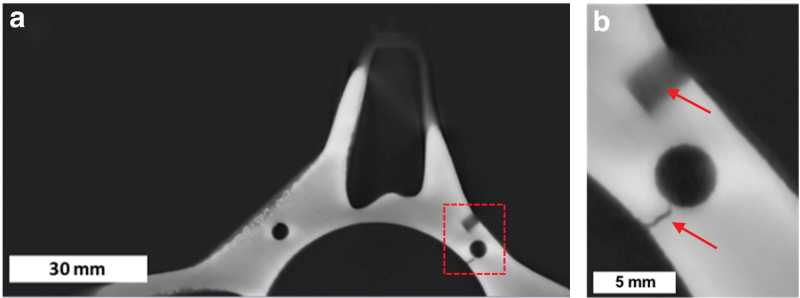
The CT scan allowed for easy detection of the FBH as well as cracks (Fig. 8a). The HeliScan is capable of imaging at higher resolutions and potentially captures porosity/defects, however, this would require the sample to be sectioned into smaller pieces. Specifically, for investigating XμCT as a nondestructive imaging method, it was decided not to physically section the sample.
FIG. 8.
Slice from the X-ray microcomputed tomogram: (a) overall view. (b) Zoomed-in image showing the horizontal-FBH defect and a crack not previously known. Color images are available online.
A small subvolume of a region-of-interest was taken from the larger data set using software (Avizo). The subsampled data were segmented and visualized in three-dimensional. Accurate segmentation of the component was challenging due to imaging artifacts, a phenomenon known as beam hardening. The presence of support structures in the part causes the appearance of gaps that could be misinterpreted as a defect. Given these artifacts, defects in the size range of the H-FBH were easily identified (Fig. 8b). Besides the artificial defect, an actual crack was also found in the XμCT, which was not detected with any of the other techniques used, evidencing the superior sensitivity of the technique. This crack is not in a strut but represents a type of defect usually seen in struts.
Comparison of different NDT methods
Dye penetrant testing was able to detect superficial defects, such as cracks and LoF, that may be imperceptible by visual inspection. One of the main advantages of this technique is the fact that it can examine the entire accessible surface of the part, regardless of the geometric complexity typical of the parts produced by AM. It is an expedite and low-cost technique.
Thermography with internal excitation was suitable for the detection of a substantial lack of material. However, in some cases, part symmetry may be a requirement to enable the analysis of the results of this technique. This particular internal excitation technique may require several tests to impose electric current according to different orientations.
Regarding the immersive ultrasonic technique, it has proven to be feasible for the detection of deep defects such as the induced VFBH, independently of the surface condition of the part. However, it is difficult to apply onto nonplanar surfaces and since most of the available ultrasonic probes have a range of frequency between 20 kHz and 50 MHz, it is theoretically limited to the detection of defects >230 μm.
Despite the high potential of the EC technique, the complex geometry of the parts was seen to be a major problem regarding its application. However, it was observed that the surface roughness does not negatively affect the results when the correct set of test parameters is used. Moreover, this technique was able to detect subsuperficial defects as the V-FBH.
The XμCT was seen to be the most versatile NDT technique, being able to detect most of the defects expected to appear in a part produced by AM. Compared with the other techniques, it is one of the most suitable techniques for this kind of process, but also the most expensive and time-consuming; Superficial cracks found with the dye penetrant (DP) test, however, were too small for the CT scan to detect them.
Table 1 summarizes the applicability of the NDT techniques evaluated in this study for these defects and the artificially machined FBH defect.
Table 1.
Summary of the Applicability of Each Nondestructive Testing Technique
| NDT | Real defects |
Artificial defects |
|||
|---|---|---|---|---|---|
| Pores | Cracks | Lack of fusion | FBH | Horizontal hole | |
| DP |

|

|

|

|

|
| IR |

|

|

|

|

|
| US |

|

|

|

|

|
| EC |

|

|

|

|

|
| CT |

|

|

|

|

|
 : not possible;
  : possible;
  /
/ : usually possible/not possible, but it depends on the position or orientation of the defect.
CT, computed tomography; DP, dye penetrant; EC, Eddy currents; FBH, flat bottom hole; IR, infrared; NDT, nondestructive testing; US, ultrasonic.
Conclusions
From the evaluation of different NDT techniques for the inspection of an AISI 316L SLM-fabricated part, the following can be concluded:
In dye penetrants, low-sensitivity liquids (level 2) are less hindered by surface roughness and are thus able to identify small defects such as superficial cracks with more than 5 μm thickness. This technique is limited to superficial defects but has great potential for parts with complex geometries.
Regarding ultrasonic inspection, the immersive technique is preferred due to the surface roughness and irregular geometry. Although it is limited to the detection of defects >230 μm.
EC inspection required automated motion to reduce the handling noise (lift-off effect) limiting the scanning routes. Only planar or locally surfaces were able to provide reliable readings. However, the surface roughness does not negatively affect the results, and defects near the surface were detected.
For the thermography tests, the part must be painted to maintain a constant emissivity, which can be an issue. The analysis assisted by the Joule effect is a technique that not only detects superficial defects but also density defects, that is, a substantial lack of material in depth.
CT scanning allowed for easy detection of the FBH defects as well as cracks. It was able to detect defects that other techniques failed to detect because it was on the bottom surface and therefore inaccessible. However, the main drawback is that XμCT is the most expensive and time-consuming technique.
Further developments in NDT are needed to increase the reliability of the inspection of SLM AM parts. This may require customization and tailoring of existing NDT techniques for the specific needs of AM, or it may require new or disruptive NDT techniques. There is no single technique capable of identifying all potential defects in an SLM part. The main obstacles to NDT were the geometric complexity and surface roughness of the part.
Acknowledgments
This work was developed within the scope of the research project “Programa PT2020, SLM-XL—fabrico através de tecnologias laser, Lisboa-01-0247-feder-003346,” funded by “Fundo Europeu de Desenvolvimento Regional (FEDER)” through “Programa Operacional Regional de Lisboa (POR Lisboa 2020)” and “Programa Operacional Competitividade e Internacionalização.”
M.A.M., R.M.M., J.P.O., and T.G.S. acknowledge FCT-MCTES for its financial support via the project UIDB/00667/2020 (UNIDEMI). V.R.D. acknowledges Fundaçäo para a Ciência e Tecnologia/MCTES for funding the PhD grant SFRH/BD/139454/2018. T.A.R. acknowledges Fundaçäo para a Ciência e Tecnologia-MCTES for funding the PhD grant SFRH/BD/144202/2019.
The authors also acknowledge the technical support of the Portuguese companies ADIRA Metal-Forming Solutions, SA, MCG—Manuel da Conceição Graça, Lda, and INEGI—Institute of Science and Innovation in Mechanical and Industrial Engineering.
Author Disclosure Statement
No competing financial interests exist.
Funding Information
The Smart-WAAM project has received funding from EIT RawMaterials, supported by the European Institute of Innovation and Technology (EIT), a body of the European Union, under the Horizon Europe, the EU Framework Programme for Research and Innovation.
This research was developed with the financial support of Portuguese Fundação para a Ciência e Tecnologia, IDMEC under LETA-UID/EMS/50022/2020.
References
- 1. DebRoy T, Wei HL, Zuback JS, et al. Additive manufacturing of metallic components—process, structure and properties. Prog Mater Sci 2018;92:112–224. [Google Scholar]
- 2. Rodrigues TA, Duarte V, Miranda RM, et al. Current status and perspectives on wire and Arc additive manufacturing (WAAM). Materials (Basel) 2019;12:1121. [DOI] [PMC free article] [PubMed] [Google Scholar]
- 3. Koester LW, Taheri H, Bigelow TA, et al. Nondestructive testing for metal parts fabricated using powder-based additive manufacturing. Mater Eval 2018;76:514–524. [Google Scholar]
- 4. Rieder H, Spies M, Bamberg J, et al. On- and off-line ultrasonic inspections to characterize components build by SLM additive manufacturing. 7th International Symposium on NDT in Aerospace. Breman, Germany, 2015. [Google Scholar]
- 5. Cerniglia D, Montinaro N. Defect detection in additively manufactured components: Laser ultrasound and laser thermography comparison. Procedia Struct Integr 2018;8:154–162. [Google Scholar]
- 6. Everton SK, Hirsch M, Stravroulakis P, et al. Review of in-situ process monitoring and in-situ metrology for metal additive manufacturing. Mater Des 2016;95:431–445. [Google Scholar]
- 7. Lu QY, Wong CH. Additive manufacturing process monitoring and control by non-destructive testing techniques: Challenges and in-process monitoring. Virtual Phys Prototyp 2018;13:39–48. [Google Scholar]
- 8. Hooper PA. Melt pool temperature and cooling rates in laser powder bed fusion. Addit Manuf 2018;22:548–559. [Google Scholar]
- 9. Berumen S, Bechmann F, Lindner S, et al. Quality control of laser- and powder bed-based Additive Manufacturing (AM) technologies. Phys Procedia 2010;5:617–622. [Google Scholar]
- 10. Kanko JA, Sibley AP, Fraser JM. In situ morphology-based defect detection of selective laser melting through inline coherent imaging. J Mater Process Technol 2016;231:488–500. [Google Scholar]
- 11. Bartlett JL, Heim FM, Murty YV, et al. In situ defect detection in selective laser melting via full-field infrared thermography. Addit Manuf 2018;24:595–605. [Google Scholar]
- 12. Chauveau D. Review of NDT and process monitoring techniques usable to produce high-quality parts by welding or additive manufacturing. Weld World 2018;62:1097–1118. [Google Scholar]
- 13. Lopez A, Bacelar R, Pires I, et al. Quintino, non-destructive testing application of radiography and ultrasound for wire and arc additive manufacturing. Addit Manuf 2018;21:298–306. [Google Scholar]
- 14. Thompson A, Maskery I, Leach RK. X-ray computed tomography for additive manufacturing: A review. Meas Sci Technol 2016;27:072001. [Google Scholar]
- 15. Cai X, Malcolm AA, Wong BS, et al. Measurement and characterization of porosity in aluminium selective laser melting parts using X-ray CT. Virtual Phys Prototyp 2015;10:195–206. [Google Scholar]
- 16. Rometsch PA, Pelliccia D, Tomus D, et al. Evaluation of polychromatic X-ray radiography defect detection limits in a sample fabricated from Hastelloy X by selective laser melting. NDT E Int 2014;62:184–192. [Google Scholar]
- 17. Senthil SM, Parameshwaran R, Nathan SR, et al. Non-destructive testing and evaluation of friction stir welded AA6063 circularly butted pipes. Russ J Nondestruct Test 2019;55:957–966. [Google Scholar]
- 18. Santos TG, Miranda RM, Vilaça P, et al. Microstructural mapping of friction stir welded AA 7075-T6 and AlMgSc alloys using electrical conductivity. Sci Technol Weld Join 2011;16:630–635. [Google Scholar]
- 19. Kingston AM, Myers GR, Latham SJ, et al. Sheppard, space-filling X-ray source trajectories for efficient scanning in large-angle cone-beam computed tomography. IEEE Trans Comput Imaging 2018;4:447–458. [Google Scholar]
- 20. American Society for Metals, ASM International, Handbook Committee. Nondestructive Evaluation and Quality Control. Geauga County, OH: ASM International, 1989. [Google Scholar]
- 21. Santos TG, Vilaça P, Miranda RM. Electrical conductivity field analysis for evaluation of FSW joints in AA6013 and AA7075 alloys. J Mater Process Technol 2011;211:174–180. [Google Scholar]
- 22. Jiles D. Introduction to the Principles of Materials Evaluation. Boca Raton, FL: CRC Press, 2008. [Google Scholar]
- 23. Machado MA, Rosado L, Pedrosa N, et al. Novel eddy current probes for pipes: Application in austenitic round-in-square profiles of ITER. NDT E Int 2017;87:111–118. [Google Scholar]


