

Abstract
Hydrazine is a rodent carcinogen and is classified as a probable human carcinogen by IARC. Though hydrazine is positive in both in vitro and in vivo DNA strand break (comet) assays, hydrazine was reported to be negative in an in vitro mutation Muta Mouse lung epithelial cell (FE1) test, as well as in a regulatory‐compliant, in vivo Big Blue mouse mutation test. In this article, mechanistic studies explored the cellular response to hydrazine. When tested in a regulatory‐compliant mouse lymphoma assay, hydrazine yielded unusual, weakly positive results. This prompted an investigation into the transcriptional response to hydrazine in FE1 cells via RNA sequencing. Amongst the changes identified was a dose‐dependent increase in G2/M DNA damage checkpoint activation associated genes. Flow cytometric experiments in FE1 cells revealed that hydrazine exposure led to S‐phase cell cycle arrest. Clonogenic assays in a variety of cell lines harboring key DNA repair protein deficiencies indicated that hydrazine could sensitize cells lacking homology dependent repair proteins (Brca2 and Fancg). Lastly, hprt assays with hydrazine were conducted to determine whether a lack of DNA repair could lead to mutagenicity. However, no robust, dose‐dependent induction of mutations was noted. The transcriptional and cell cycle response to hydrazine, coupled with functional investigations of DNA repair‐deficient cell lines support the inconsistencies noted in the genetic toxicology regulatory battery. In summary, while hydrazine may be genotoxic, transcriptional and functional processes involved in cell cycle regulation and DNA repair appear to play a nuanced role in mediating the mutagenic potential.
Keywords: clonogenic assay, differentially expressed genes, DNA repair pathways, hprt assay, hydrazine
1. INTRODUCTION
Hydrazine hydrate (H2N‐NH2; CAS # 302‐01‐2) is naturally occurring and is produced by Azotobacter agile during nitrogen fixation and in tobacco plants (IARC, 1999). Additionally, hydrazine is used in a number of industrial applications. Occupational exposure to hydrazine primarily occurs via inhalation during its manufacture and use in the jet fuel industry (IARC, 1999). In addition, hydrazine is used in the synthesis of pharmaceuticals; it may arise as an impurity or degradant. Moreover, hydrazine is also generated during the metabolism of isoniazid (Brewer et al., 2019) and hydralazine (Tafazoli et al., 2008), which are used in treating tuberculosis and hypertension, respectively.
Hydrazine has been shown to be carcinogenic in rodent studies (Matsumoto et al., 2016; Steinhoff et al., 1990). Following oral administration in rodents, hydrazine leads to lung and liver tumors; with exposure via inhalation, it leads to nose, thyroid, lung and colon tumors (IARC, 1999). Due to inadequate evidence of carcinogenicity in humans, hydrazine has been classified by IARC as a group 2A carcinogen (a probable human carcinogen) (IARC, 2018; Morris et al., 2015).
Genotoxicity associated with the formation of reactive species that leads to DNA adducts has been considered relevant for carcinogenicity. It is proposed that hydrazine interacts with endogenously‐occurring formaldehyde, leading to the formation of an intermediate (hydrazone), which is then metabolized to a methylating agent (diazomethane) (IARC, 2018). Such agents could be responsible for generating DNA adducts in vitro, as well as in vivo; N7‐methylguanine and O 6‐methylguanine species were identified in the liver of mice, rats, and hamsters following hydrazine exposure (IARC, 1999). Additionally, hydrazine may react with pyrimidines in DNA to saturate the 5,6 double bond, forming N 4‐amino cytosine, which can then lead to the loss of pyrimidines via pyrimidine ring opening (Kimball, 1977).
Standard assays used in determining genotoxicity and mutagenicity have been conducted with hydrazine. Our previous results confirmed the results of others showing that hydrazine is positive in the bacterial mutation (Ames) test, as well as in an vitro gene mutation yeast test (CERI, 2007; IARC, 1999; Nicolette et al., 2020). Additionally, hydrazine has been found to be positive in the chromosomal aberration test in Chinese hamster ovary (CHO) cells, but not in human lymphocytes (CERI, 2007; IARC, 1999). Differential results were reported in the mouse lymphoma (L5178Y cell, thymidine kinase locus) test (CERI, 2007; IARC, 1999). Primarily positive results in the in vitro sister chromatid exchange test were noted in CHO and Chinese hamster lung‐derived cells, but there is a lack of in vivo concordance in mouse bone marrow and liver (CERI, 2007; IARC, 1999). Hydrazine induced unscheduled DNA synthesis in mouse hepatocytes (IARC, 2018), which is associated with DNA nucleotide excision repair. Additionally, DNA single‐strand breaks and alkali‐labile sites (identified by the comet assay) occur following exposure to both rat and human primary lung cells cultured in vitro (Robbiano et al., 2006). Testing at the hprt locus in CHO cells for gene mutation was reported to be negative (Hsie et al., 1981).
Despite the positive Ames test and DNA damage data, recent in vitro and in vivo mutation studies have been negative (Nicolette et al., 2020). We demonstrated that hydrazine did not increase mutations in vitro in Muta Mouse FE1 lung epithelial cells, which are derived from a tissue that has been shown to be sensitive to carcinogenic effects of hydrazine. Additionally, hydrazine was not mutagenic in a good laboratory practice‐compliant (GLP) 28‐day Big Blue mouse study that explored mutation frequencies in both lung and liver at doses approximating those that induced tumors (Matsumoto et al., 2016; Nicolette et al., 2020).
In this article, we sought to add mechanistic insight to clarify the genotoxicity (and apparent lack of mutagenicity in mammalian cells) of hydrazine. We conducted a GLP‐compliant mouse lymphoma assay, using L5178Y/TK+/− cells to clarify historical data with hydrazine. We also explored the transcriptional response to hydrazine in FE1 cells using RNA sequencing. In these studies, we noted a dose‐dependent increase in differentially expressed genes (DEGs) that were primarily associated with the G2/M DNA damage checkpoint activation, suggestive of a cell cycle arrest, which was confirmed by flow cytometry. To better understand whether essential DNA repair proteins play a role in mediating the cellular response to hydrazine, we then performed clonogenic assays in a variety of cell lines harboring key DNA repair protein deficiencies. We also completed hprt assays in selected cell lines, exploring whether DNA repair protein deficiency could lead to mutation at sub‐cytotoxic doses.
2. MATERIALS AND METHODS
2.1. Test item
Hydrazine monohydrate was purchased from Sigma‐Aldrich (CAS No. 7803‐57‐8; batch SHBG7164V, St. Louis, MO) for all tests. It was stored at ambient temperature at the testing facilities and protected from light. The formula weight was 50.6 g/mol. Dose formulations were adjusted for the presence of the monohydrate in all studies except the DNA repair mutant clonogenic assays.
2.2. In vitro mammalian cell gene mutation test (L5178Y/TK +/−) mouse lymphoma assay
The mouse lymphoma assay was conducted under GLP conditions in accordance with OECD 490, using the semi‐solid agar format as described earlier (Lloyd & Kidd, 2012). Mouse lymphoma L5178Y/TK+/− cells, clone 3.7.2C (heterozygous at the normally diploid thymidine kinase [TK] locus) were obtained from the American Type Culture Collection (ATCC, repository number CRL‐9518, Manassas, VA) (OECD 490, 2016). The assay was conducted by exposing L5178Y/TK+/− cells to concentrations of hydrazine monohydrate, as well as concurrent methyl methanesulfonate (MMS, Sigma‐Aldrich) and dimethylbenz(a)anthracene (DMBA, Sigma‐Aldrich) (positive control), and water (vehicle control). Hydrazine and MMS were dissolved in water and DMBA was dissolved in DMSO. Experiments were conducted in the presence or absence of S9 (Aroclor 1254‐induced rat liver S9, Lot number 3784, obtained from Moltox in Boone, NC).
L5178Y/TK+/− cells were exposed for 4 h in the presence and absence of S9 using duplicate cultures. Cells from selected dose levels were cultured in triplicate with 2–4 μg/mL trifluorothymidine (TFT; procured from Sigma Aldrich) at a density of 1 × 10⁶ cells/100 mm plate in agar‐containing cloning medium. The cloning efficiency was determined concurrently. Cultures were incubated under standard conditions for 11 days.
The total number of colonies per culture was determined for the vehicle plates and the total relative growth calculated. The total number of colonies per TFT plate was then determined for those cultures with ≥10% total growth. The induced mutant frequency (IMF) was defined as the mutant frequency of the hydrazine culture minus the mutant frequency of the vehicle control cultures. A result was considered positive if a concentration‐related increase in mutant frequency was observed in the treated cultures and one or more treatment conditions with 10% or greater total growth exhibited induced mutant frequencies of ≥90 mutants/106 clonable cells (based on the average mutant frequency of duplicate cultures and referred to as the Global Evaluation Factor [GEF]) (Moore et al., 2006). Sizing was performed on colonies at doses that met the GEF positive response criterion. Small colonies, reflective of chromosome aberrations and sometimes referred to as σ, are ≤0.63 mm and large colonies, indicative of point mutations in genes and sometimes referred to as λ, are >0.63 mm (Moore et al., 1985b).
2.3. FE1 cell culture and dose selection
FE1 mouse lung epithelial cells (White et al., 2003) were seeded from a thawed cryovial and maintained with biweekly passaging in Complete (serum‐containing) medium (DMEM/F‐12 medium; Life Technologies, Grand Island, NY) containing 2% fetal bovine serum (Sigma‐Aldrich), penicillin/streptomycin (Sigma‐Aldrich; 100 units/100 μg per mL), and murine epidermal growth factor (ScienCell, Carlsbad CA; 1 ng/mL) in a humidified atmosphere of 5% CO2 at 37°C. FE1 cells were maintained in culture to support exponential growth in all experiments and harvested with Accutase (Millipore Sigma, Burlington, MA). Cell growth and morphology were monitored with an IX73 inverted microscope (Olympus, Waltham, MA). Prior to conducting experiments with FE1 cells, hydrazine‐induced cytotoxicity was evaluated at 24 h using Cell Titer Glo (Promega, Madison, WI). In these experiments, hydrazine was added to Exposure (serum‐free) medium. The TC90 was determined to be 8 mM in these cells. Based on this toxicity profile, dose levels of 1, 4, 6, and 10 mM were selected.
2.4. FE1 cell dosing in support of differential expression of genes via RNA sequencing
FE1 cells were plated on 6‐well tissue culture dishes at a density of 60,000 cells/well in Complete medium. The following day, cells in six replicate wells were treated for 4 h with 0, 1, 4, 6, or 10 mM hydrazine monohydrate in Exposure (serum‐free) medium [DMEM/F‐12 medium containing penicillin/streptomycin (as included in the Complete medium), and murine epidermal growth factor (as included in the Complete medium)]. Immediately following treatment, total RNA from three replicate wells of naive and hydrazine‐treated FE1 cells was isolated by Qiazol extraction, DNase I treatment followed by RNeasy column purification (Qiagen, Redwood City, CA), and evaluated for quality (RIN scores ≥9) by an Agilent 2100 Bioanalyzer (Santa Clara, CA). For the remaining three replicate wells from each treatment, dosing solutions were removed after 4 h and replaced with untreated Complete medium for an additional 20 h, after which total RNA was isolated as above. The total number of samples was 32; the 4‐h, 4 mM timepoint dose had two additional replicates.
2.5. RNA‐Seq data generation
Total RNA/sample (1 μg/sample) was used as input for RNA‐Seq library construction using the TruSeq Stranded mRNA Library Prep Kit (Illumina, San Diego, CA). Libraries (32) were normalized, pooled, and loaded on a NextSeq500 for paired end read sequencing at 2 × 75 bp using a HI Output flowcell according to manufacturer's protocols (Illumina, San Diego, CA). FastQ files were generated and uploaded to Array Studio (11.3.1.1) (OmicSoft, a Qiagen Company, Cary, NC) for analysis. On average, 10 million next‐generation sequencing (NGS) reads were generated per sample. OSA4 was used for alignment of RNA‐Seq reads to the mouse reference genome (Mouse B6.0) and the GeneModel Ensembl.R83 Build. The percentage of total reads uniquely mapped to the mouse reference genome was between 72% and 84% for all 32 samples (average 78%), supporting good quality for the RNA‐Seq reads. The NGS short reads mapped well onto 43,432 Ensembl.R83 annotated genes of the mouse reference genome, including 21,968 protein‐coding sequences. Raw Illumina RNA‐Seq FASTQ files are available in the Gene Expression Omnibus (GEO) database Accession No. GSE215974.
2.6. Gene expression analysis
DEGs for each dose level and timepoint were identified by running the VOOM (R) differential analysis model on the raw counts within Array Studio (Qiagen, Redwood City, CA). Gene expression changes associated with treatment were determined relative to untreated by comparison of the mean of expression raw counts of compound‐treated samples to the mean of expression raw counts of the corresponding un‐treated samples with an absolute value of fold change ≥2 and p < .05. Principal component analyses (PCA), Canonical Pathway Analysis, and Causal Analysis were conducted using Ingenuity Pathway Analysis (IPA) version 46901286 (Qiagen) (Kramer et al., 2014).
2.7. FE1 cell preparation for flow cytometry analysis
For flow cytometry experiments, FE1 cells were seeded in T225 flasks, two per dose, at a density of 5500 cells/cm2 in Complete medium and maintained for 24 h. Flasks were washed twice with room temperature PBS (Gibco) and medium was refreshed with Exposure medium (defined as before), murine epidermal growth factor (ScienCell, Carlsbad, CA; 1 ng/mL) and 0, 1, 4, 6, and 10 mM hydrazine from a freshly prepared 1 M stock of compound. Flasks were returned to incubator for a 4‐h exposure. One set of flasks was immediately processed for flow cytometry while the duplicate set was washed two times with room temperature PBS, followed by the addition of Complete medium. These flasks were returned to the incubator for a 20h recovery period, followed by processing for flow cytometry. For cell collection, medium and ice‐cold PBS washes were collected by centrifugation to capture floating cells and flasks were treated with Accutase to detach the cell monolayer. Cell suspensions were generated with addition of Complete medium and added to appropriate tubes containing previously collected floating cells. Following centrifugation, cell pellets were washed two times with ice‐cold PBS.
Following the second wash, cell pellets were resuspended in a small volume of ice‐cold PBS and resuspended pelleted cells were permeabilized by drop‐wise addition to ice‐cold methanol while vortexing (1:10) to a final methanol concentration of 90%. Samples were stored at −20°C until further processing/staining. Once all samples reached this point, cells were pelleted by centrifugation, washed with ice‐cold PBS to remove methanol, and stained with DAPI at 10 μg/mL in PBS/0.1% Triton X‐100 (Sigma‐Aldrich) for at least 30 min. Stained cells were analyzed on a FACSCanto II (Becton Dickinson, San Jose, CA) using 405 nm excitation for DAPI and the resulting data were analyzed using FlowJo version 10.6.2 (Becton, Dickinson & Company, Ashland, OR). Non‐nucleated cellular debris was excluded by gating out low scatter signal events, as well as events with no or low DAPI fluorescence. Single cell populations were separated from aggregates by gating DAPI area versus DAPI height and 20,000 events were collected in this gate. Cell cycle modeling was performed using the Watson model. Model constraints of the G1 and G2 coefficient of variance (CV) as well as the peak positions were applied and adjusted to minimize the root‐mean‐square deviation (RMSD) values. Percentages from the model for the G1, S, and G2 phases were exported and tabulated in a spreadsheet.
2.8. DNA repair mutant clonogenic assays
The DNA repair mutant clonogenic assays were conducted at Toxys Europe in The Netherlands.
2.8.1. Test chemicals
All test chemicals for the assays involving DNA repair mutant cells were ordered from Sigma‐Aldrich (Schnelldorf, Germany). Hydrazine monohydrate and the positive controls, N‐ethyl‐N‐nitrosourea (ENU) and N‐methyl‐N‐nitrosourea (MNU) were dissolved in DMSO. Cisplatin (Sigma‐Aldrich) and mitomycin C (MMC) were dissolved in PBS and MNU was dissolved in deionized water.
2.8.2. Cell lines and culturing
All cell lines were obtained from the Department of Human Genetics, Leiden University Medical Center, The Netherlands. Table 1 contains a summary of the cell types used in the assays. Wild‐type CHO cells (AA8) and AA8‐derived mutant cell lines were cultured in DMEM/F‐12 (Gibco, Bleiswijk, The Netherlands). Wild‐type Hamster Lung Fibroblasts (V79) and V79‐derived mutant cell lines were cultured in F10 medium (Gibco). Mouse embryonic fibroblast cell lines were grown in DMEM. Culture media were supplemented with 10% fetal bovine serum (FBS) (Gibco) and 0.5 mg/mL penicillin/streptomycin (Gibco). Mouse embryonic stem (mES) cells were cultured in mES knockout medium (Gibco) containing 10% FBS, 2 mM Glutamax, 1 mM sodium pyruvate, 100 μM β‐mercaptoethanol, leukemia inhibitory factor (LIF), and 0.5 mg/mL penicillin/streptomycin (Gibco).
TABLE 1.
Mutant hamster and mouse cell lines with deficiencies in DNA repair pathways
| Cell line | Mutation | Species | DNA repair pathway | Positive control | Reference |
|---|---|---|---|---|---|
| AA8 | None, wild‐type | Chinese hamster ovary | N/A | (Thompson et al., 1982) | |
| EM9 | Xrcc1 | Chinese hamster ovary (AA8) | BER | MMS | (Thompson et al., 1982) |
| UV5 | Ercc1 | Chinese hamster ovary (AA8) | NER | Cisplatin | (Yang et al., 1991) |
| UV20 | Xpd | Chinese hamster ovary (AA8) | NER | Cisplatin | (Yang et al., 1991) |
| UV61 | Csb | Chinese hamster ovary (AA8) | NER | Cisplatin | (Yang et al., 1991) |
| UV40 | Fancg | Chinese hamster ovary (AA8) | HR | Cisplatin | (Busch et al., 1996; Liu et al., 1997) |
| XR‐1 | Xrcc4 | Chinese hamster ovary (AA8) | NHEJ | MMC | (Temviriyanukul et al., 2012) |
| V79 | None, wild‐type | Hamster lung fibroblasts | N/A | (Zdzienicka & Simons, 1987) | |
| V‐C8 | Brca2 | Hamster lung fibroblast (V79) | HR | Cisplatin | (Zdzienicka & Simons, 1987) |
| XR‐V9B | Ku80 | Hamster lung fibroblast (V79) | NHEJ | MMC | (Stamato et al., 1983) |
| MEF | None, wild‐type | Mouse embryonic stem cells | N/A | (Temviriyanukul et al., 2012) | |
| IB10 | None, wild‐type | Mouse embryonic stem cells | N/A | (Hendriks et al., 2014) | |
| Xpv | Pol eta (Xpv) | Mouse embryonic stem cells | TLS | Cisplatin | (de Wind et al., 1995) |
| Msh2 | Msh2 | Mouse embryonic stem cells | MMR | MNU | (Thompson et al., 1982) |
Abbreviations: BER, base excision repair; HR, homologous recombination; MMR, mismatch repair; NER, nucleotide excision repair; NHEJ, non‐homology end‐joining; TLS, translesion synthesis.
2.8.3. Cell viability
The Alamar Blue stain (Sigma‐Aldrich, R7017, Germany) was used to determine cell viability. Cells were seeded in 96‐well plates at low density to support logarithmic growth. One day after seeding, cells were exposed to increasing concentrations of hydrazine monohydrate in serial, 2‐fold dilutions for dose range finding experiments. MMC, MMS, MNU, and cisplatin (Sigma‐Aldrich) were used as reference genotoxic agents for the final cell viability measurements. Cells were exposed to hydrazine continuously for 24, 48, and 72 h. Immediately after the exposure time was reached, the Alamar Blue solution in fresh cell culture medium was added to the wells to a final concentration of 0.001% (1 mg/L). Fluorescence, using an excitation wavelength of 530 nm and an emission wavelength of 590 nm, was determined after 3 h using a Fluoroskan plate reader (Thermo Fisher Scientific Bleiswijk, The Netherlands).
2.8.4. Clonogenic assays
Initial cytotoxicity screening with hydrazine using Alamar Blue cell viability scoring at 48 h and 72 h was used to select the doses tested in the various proficient and specific DNA repair‐deficient cell lines in clonogenic assays (data not shown). Selected compound concentrations induce low (10%), medium (25%), and high (50%) levels of cytotoxicity. These levels of cytotoxicity were chosen to allow for anticipated changes in sensitivity, but not necessarily robust toxicity, as this work was focused on characterizing cell death. The selected concentrations appear in Table 2. The top concentration, either 5 or 10 mM was considered to be a reasonable dose for determining potential differences in hydrazine sensitivity between the wild‐type and mutant cells. Additionally, there was interest in not going above 10 mM, as the OECD has provided general guidance to not exceed this level in in vitro genetic toxicology assays. Cells were seeded in 24‐well plates at 50% confluence. After 1 day, 60%–70% confluent cell cultures were exposed to five compound concentrations for 3 h. After 3 h exposure, cells were trypsinized, counted, and seeded at low cell density (200 cells/well for the low concentration, 500/well cells for the medium concentration, and 1000 cells/well cells for the high concentration) in 6‐well plates containing complete cell culture medium containing 10% FBS. Medium was not replaced during the clonogenic survival assay. After 7–10 days, the plates were washed with 0.9% NaCl and the colonies were dried and stained with methylene blue (Sigma‐Aldrich, M9140). Relative cell survival was calculated by relating the fraction of seeded cells that after exposure were able to form a colony to the fraction of untreated control cells that were able to form colonies. The validity of the various tests was verified by exposure of the different DNA repair mutant cell lines to the relevant reference, positive control, genotoxic chemicals. Significance (*p < .05, **p < .01) was calculated using a t‐test, whereby each mutant cell line was compared to the respective wild‐type cell line.
TABLE 2.
Selected concentrations for compounds tested in the clonogenic survival assay
| Compound | Stock concentration | Wild‐type cell line | Final compound concentrations |
|---|---|---|---|
| Hydrazine monohydrate | 20.62 M | IB10 | 0, 0.63, 1.25, 2.5, 5, 10 mM |
| Hydrazine monohydrate | 20.62 M | AA8, V79, and MEF | 0, 0.31, 0.63, 1.25, 2.5, 5 mM |
| MMC | 2.81 mM | AA8, V79 | 0, 0.0036, 0.0071, 0.0141 mM |
| MMS | 11.8 M | AA8 | 0, 0.075, 0.150, 0.300 mM |
| MNU | 100 mM | IB10 | 0, 1, 3, 5, 7, 9 mM |
| Cisplatin | 3.3 mM | AA8 | 0, 0.00125, 0.0025, 0.005 mM |
| Cisplatin | 3.3 mM | MEF | 0, 0.00031, 0.00063, 0.00125, 0.0025, 0.005 mM |
Abbreviations: MMC, mitomycin C; MMS, methyl methanesulfonate; MNU, N‐nitroso‐N‐methylurea.
2.9. DNA repair mutant hprt assays
The DNA repair mutant hprt assays were conducted at Toxys Europe in The Netherlands.
Based upon preliminary data from the clonogenic assay, hprt assays with hydrazine and the positive control, ENU, were conducted using AA8, XR‐1, UV5, V79, and V‐C8 cell lines, corresponding to the wild‐type and DNA repair pathways: NHEJ, NER, and HR. Selection of mutant cell lines included the testing of a line that was consistently showing hypersensitivity in the clonogenic assay (V‐C8, associated with HR) and two lines that were not showing enhanced cytotoxicity (XR‐1, associated with NHEJ and UV5, associated with NER). The selected concentration range for hydrazine, 0.31–5 mM, was based on the results of the clonogenic survival assay, which aimed to focus on sub‐cytotoxic doses, as doses approximating toxicity (or exceeding 10 mM, per OECD) would otherwise lead to lower levels of mutations due to cell death. In the hprt mutation assay (described in Johnson, 2012), hypoxanthine–aminopterin–thymidine (HAT) selected cells were treated for 3 h with hydrazine monohydrate. After dosing, the medium was refreshed and the next day, cells were passaged. In total, the cells were passaged at least three times to fix the mutations. Afterwards, 100 cells/well were seeded at clonal density in a 6‐well plate to determine the plating efficiency and 0.5 million cells were seeded in 100 mm dishes to select for hprt mutants using 6‐TG. For VC8, 200 cells were seeded in a 6‐well plate to determine plating efficiency. After 5 days, the 6‐TG‐containing medium was replaced with fresh 6‐TG‐containing medium.
One week after plating, the colonies of cells cultured in the absence of 6‐TG were washed with 0.9% NaCl, dried, and stained with methylene blue to determine the cloning efficiency of the cells after treatment. After 1 week after plating, the colonies of cells in the presence of 6‐TG were washed, stained, and counted to determine the frequency of hprt mutant colonies. The absolute hprt mutant frequency per million cells was calculated by dividing the number of 6‐TG resistant colonies by the cloning efficiency and subsequently diving this number by the number of seeded cells. Data are presented as mean ± standard deviation (SD) of minimally two independent experiments performed in triplicate. Statistical analysis comparing a given mutant cell line versus the respective wild‐type cell line was performed with two‐way analysis of variance (ANOVA) in GraphPad Prism (version 9.1.0, San Diego, CA). p values < .05 were considered to be significant.
3. RESULTS
3.1. Hydrazine with metabolic activation induces an unusual pattern of mutant frequency induction
The initial cytotoxicity range‐finding study performed in L5178Y/TK+/− cells warranted testing hydrazine at concentrations ranging from 0.08 to 10 mM without S9 and from 0.1 to 10 mM with S9. (The top dose of 10 mM is based off the top concentration that is recommended by OECD for in vitro genetic toxicity assays.) No visible precipitate was observed at the beginning or end of the 4 h exposure period with these doses. Cells dosed at all concentrations exhibited 27%–99% relative suspension growth (RSG) and were cloned. The cloning efficiency of the L5178Y/TK+/− cells was 87% and 69% with and without S9, respectively. The relative total growth (RTG) of the cloned cells ranged from 23% to 92% and 12% to 117% with and without S9, respectively (Table 3).
TABLE 3.
Mouse lymphoma assay induced mutant frequency data with colony sizing
| 4‐hour exposure of hydrazine with S9 | |||||
|---|---|---|---|---|---|
| Concentration (mM) | Relative total growth (% of control) a | Mutant frequency (per 106 clonable cells) a | Induced mutant frequency (per 106 clonable cells) a | Small colonies (≤0.63 mm) | Large colonies (>0.63 mm) |
| 0 | 100 | 43.5 | NA | 22.7 | 20.8 |
| 0.1 | 81 | 54 | 10.5 | NA | NA |
| 0.5 | 83.5 | 77.5 | 34.5 | NA | NA |
| 1.0 | 73 | 105.5 | 61.5 | NA | NA |
| 1.4 | 55.5 | 133 | 89.5 | 84.2 | 49 |
| 4 | 28 | 180 | 136.5 | 116.6 | 63.6 |
| 6 | 24.5 | 160 | 116.5 | 117.4 | 42.8 |
| 7 | 26 | 140.5 | 97 | 86.1 | 54.3 |
| 10 | 23.5 | 131 | 88 | 81.1 | 50.1 |
| Positive | 14 | 412 | 368.5 | 283 | 97.8 |
| 4‐hour exposure of hydrazine without S9 | |||
|---|---|---|---|
| Concentration (mM) | Relative total growth (% of control) | Mutant frequency (per 106 clonable cells) b | Induced mutant frequency (per 106 clonable cells) b |
| 0 | 100 | 49.5 | NA |
| 0.08 | 102 | 43.5 | −6.5 |
| 0.2 | 114.5 | 40.5 | −9 |
| 0.3 | 84.5 | 48 | −1 |
| 0.6 | 98 | 41 | −8.5 |
| 1.2 | 86.5 | 61.5 | 11.5 |
| 2.5 | 49.5 | 113.5 | 64.5 |
| 5 | 29 | 84 | 34.5 |
| 10 | 14 | 76.5 | 27.5 |
| Positive | 10.5 | 412 | 362 |
Mean of two replicate cultures. Positive control: 7,12‐dimethylbenz(a)anthracene (DMBA).
Mean of two replicate cultures. Colony sizing not performed due to negative response. Positive control: methyl methanesulfonate (MMS).
Hydrazine was negative in the assay without S9. With S9, hydrazine induced a marginally positive response at doses ≥1.4 mΜ (IMF ranging from 90 to 137 per 106 clonable cells). However, above a dose of 4 mM, the IMF decreased with dose. In this arm (with S9), the limiting toxicity was at the top dose of 10 mM, which exhibited 23% RTG. Notably, at this dose, the IMF was below the GEF of 90 mutants/106 clonable cells.
TFT‐resistant colonies from the positive and vehicle control cultures, as well as the five hydrazine cultures at concentrations at 1–10 mM with S9 were sized. In comparison to the vehicle control, hydrazine with S9 led to an increase in both small and large colonies, although there was a larger (>5‐fold) increase in the number of smaller colonies (Table 3).
3.2. Hydrazine dynamically regulates genes associated with cell cycle regulation in FE1 cells
Gene expression changes with an absolute fold change value of ≥2 and p < .05 following 4 h hydrazine treatment showed a dose‐dependent increase in number and magnitude. DEGs from the 4‐h hydrazine treatment plus 20 h recovery (washout) group were lower in number, magnitude, and significance across all doses. No obvious directionality bias in DEGs was evident for either group (Figure 1a). PCA illustrates dose‐dependent separation of 4 h hydrazine treated cells from untreated cells. All four doses of the 4 h hydrazine plus 20 h recovery were similar to vehicle (Figure 1b). Hydrazine treatment at 1 mM for 4 h resulted in minimal gene expression changes that did not map to canonical pathways. Hydrazine exposure of 4 and 6 mM showed dose‐dependent changes in the G2/M DNA Damage Checkpoint Regulation, Mitotic Roles of Polo‐Like Kinase and Kinetochore Metaphase Signaling canonical pathways, indicating an inhibitory effect of hydrazine treatment on cell cycle progression (Table 4). The 10 mM hydrazine dose impacted these pathways as well, but to a lesser extent. Additional gene expression changes at this dose were indicative of general cytotoxicity.
FIGURE 1.
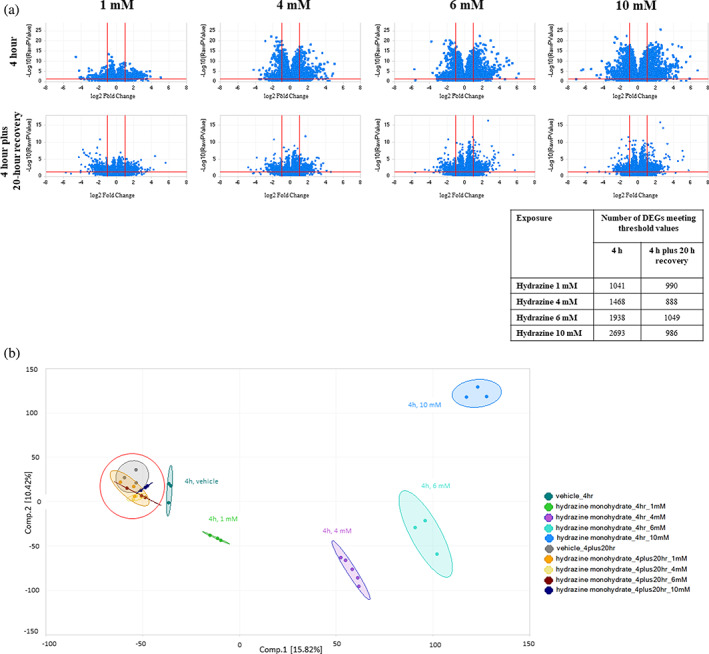
Volcano plots show differentially expressed genes following hydrazine exposure (1–10 mM) in FE1 cells at 4 h or 4 h with a 20h recovery period. Differentially expressed genes had both an absolute log2 fold change value ≥1, and a p‐value <.05, indicated by the red lines. Inset includes number of differentially expressed genes meeting the cut‐off threshold (a). Two‐component PCA analysis of log2 fragments per kilobase of exon per million mapped fragments (FPKM) values from RNA‐Seq dataset, containing 32 total samples. Percentages represent variance captured by each principal component. All samples in 4 h plus 20h recovery groups are within red circle (b)
TABLE 4.
Canonical pathways impacted by hydrazine in FE1 cells with impacted genes in alphabetical order and corresponding differential expression by dose level
| a. G2/M DNA damage checkpoint regulation | Linear fold change versus vehicle | ||||
|---|---|---|---|---|---|
| Symbol | Entrez gene name | 1 mM | 4 mM | 6 mM | 10 mM |
| Aurka | Aurora kinase A | −3.4 | −5.1 | −3.2 | |
| Bora | BORA aurora kinase A activator | −2.7 | −3.3 | ||
| Ccnb1 | Cyclin B1 | −3.0 | −3.2 | −2.4 | |
| Cdc25B | Cell division cycle 25B | −2.0 | |||
| Cks2 | CDC28 protein kinase regulatory subunit 2 | −2.5 | −2.7 | −2.8 | |
| Gadd45a | Growth arrest and DNA damage inducible alpha | 4.4 | 5.5 | 5.3 | |
| Mdm2 | MDM2 proto‐oncogene | 3.3 | 6 | ||
| Myt1 | Myelin transcription factor 1 | 2.3 | |||
| Plk1 | Polo like kinase 1 | −4.5 | −4.5 | ||
| Rprm | Reprimo, TP53 dependent G2 arrest mediator homolog | 4.1 | 4.4 | 6.9 | |
| Skp2 | S‐phase kinase‐associated protein 2 | −2.3 | |||
| Sfn | Stratifin | −3.7 | −3.8 | ||
| Wee1 | WEE1 G2 checkpoint kinase | −2.3 | |||
| b. Mitotic roles of polo‐like kinase | Linear fold change versus vehicle | ||||
|---|---|---|---|---|---|
| Symbol | Entrez gene name | 1 mM | 4 mM | 6 mM | 10 mM |
| Ccnb1 | Cyclin B1 | −3.0 | −3.2 | ||
| Cdc20 | Cell division cycle 20 | −2.8 | −2.6 | ||
| Cdc25b | Cell division cycle 25B | −2.0 | |||
| Esp1 | Extra spindle pole bodies like 1, separase | −2.6 | −3.5 | ||
| Fzr1 | Fizzy and cell division cycle 20 related 1 | −2.2 | −2.7 | ||
| Kif11 | Kinesin family member 11 | −2.0 | |||
| Kif23 | Kinesin family member 23 | −3.1 | −3.2 | ||
| Plk1 | Polo like kinase 1 | −4.5 | −4.5 | ||
| Plk5 | Polo like kinase 5 (inactive) | 5.5 | 11.2 | ||
| Ppm1j | Protein phosphatase, Mg2+Mn2+ dependent 1 J | 2.7 | |||
| Ppp2r2b | Protein phosphatase 2 regulatory subunit B beta | 2.9 | |||
| Ppp2r2c | Protein phosphatase 2 regulatory subunit B gamma | 3.1 | 3.6 | ||
| Prc1 | Protein regulator of cytokinesis 1 | −2.3 | −2.7 | ||
| Wee1 | WEE1 G2 checkpoint kinase | −2.3 | |||
| c. Kinetochore metaphase signaling pathway | Linear fold change versus vehicle | ||||
|---|---|---|---|---|---|
| Symbol | Entrez gene name | 1 mM | 4 mM | 6 mM | 10 mM |
| Bub1b | BUB1 mitotic checkpoint serine threonine kinase B | −2.3 | −2.2 | ||
| Ccnb1 | Cyclin B1 | −3.0 | −3.2 | −2.4 | |
| Cdc20 | Cell division cycle 20 | −2.8 | −2.6 | ||
| Cdca8 | Cell division cycle associated 8 | −2.1 | −2.2 | ||
| Cenpc | Centromere protein C | −2.4 | |||
| Cenpe | Centromere protein E | −2.1 | −2.1 | ||
| Cenpl | Centromere protein L | −2.6 | −4.2 | −5.2 | |
| Dnali1 | Dynein axonemal light intermediate chain 1 | −2.6 | |||
| H2ac18/H2ac19 | H2A clustered histone 18 | −3.7 | −3.3 | ||
| Espl1 | Extra spindle pole bodies like 1, separase | −2.6 | −3.5 | ||
| H2ax | H2A.X variant histone | −2.3 | −2.9 | −3.3 | |
| Incenp | Inner centromere protein | −2.2 | −3.0 | −2 | |
| Kif2c | Kinesin family member 2C | −2.8 | −3.4 | −2.5 | |
| Knl1 | Kinetochore scaffold 1 | −2.1 | |||
| Mxd3 | MAX dimerization protein 3 | −2.3 | −3.0 | −3.1 | |
| Nek2 | NIMA related kinase 2 | −2.5 | −2.6 | ||
| Pp1 | Protein phosphatase 1 regulatory subunit 10 | −4 | |||
| Plk1 | Polo like kinase 1 | −4.5 | −4.5 | ||
| Ska2 | Spindle and kinetochore associated complex subunit 2 | −2.4 | |||
| Spdl1 | Spindle apparatus coiled‐coil protein 1 | −2.5 | |||
Gadd45a (growth arrest and DNA damage inducible alpha), Dact1 (disheveled binding antagonist of beta catenin 1), and Tppp (tubulin polymerization promoting protein), which function in inhibition of proliferation by affecting cell cycle transitions showed dose‐dependent up‐regulation. Pif1, a 5′‐to‐3′ DNA helicase that plays a role in repair‐associated DNA synthesis, Plk1 (Polo‐like kinase 1), Aurka (Aurora kinase A), multiple histone genes, and Jade2, involved in histone acetylation, were consistently down‐regulated. These changes underlie the inferred upstream regulators NUPR1 (nuclear protein 1), TP53, p38 MAPK, and p21. Genes associated with ER stress, including Ddit3 (DNA damage inducible transcript 3), Trib3 (tribbles pseudokinase 3), and Chac1 (ChaC glutathione specific gamma‐glutamylcyclotransferase 1) were also consistently up‐regulated. These changes underlie the inferred upstream regulators ATF4 (activating transcription factor 4) and peroxide.
The 1 mM, 4 h hydrazine dose plus 20 h recovery resulted in minimal gene expression changes, which did not map to any canonical pathways. The 4, 6, and 10 mM doses with 20 h recovery showed gene expression changes indicative of glutathione mediated detoxification. These included the upregulation of Abcb1 (efflux transporter), glutathione peroxidase and multiple glutathione‐S‐transferase and aldehyde dehydrogenase genes. Top inferred upstream regulators were BADH1 (bromo adjacent homology domain containing 1), TOX3 (TOX High Mobility Group Box Family Member 3), and USP3 (ubiquitin specific peptidase 3) associated with chromatin structure organization and cell cycle regulation.
3.3. Hydrazine promotes an increase in S‐phase DNA content in FE1 cells
After 4 h of hydrazine (1–10 mM) exposure, there was a 5%–10% increase in S‐phase DNA content, as compared to the DMSO control (Figure 2a‐e). This was accompanied by a concomitant decrease in G1‐phase DNA content. There was negligible change in the percentage of G2/M‐phase cells. Following a 20‐h recovery period post hydrazine dosing (4–10 mM), the percentage of S‐phase cells remained ~15% higher than the DMSO control cells (Figure 2f‐j). However, at the lowest dose of 1 mM hydrazine with the 20 h recovery phase, the DNA content measured in the various cell cycle phases was similar to the DMSO control. Consistent with the 4 h samples, the G1‐phase DNA content was reduced in comparison to the control. The percentage of G2/M‐phase DNA content at 4–10 mM was slightly lower (2–7%) than the control.
FIGURE 2.
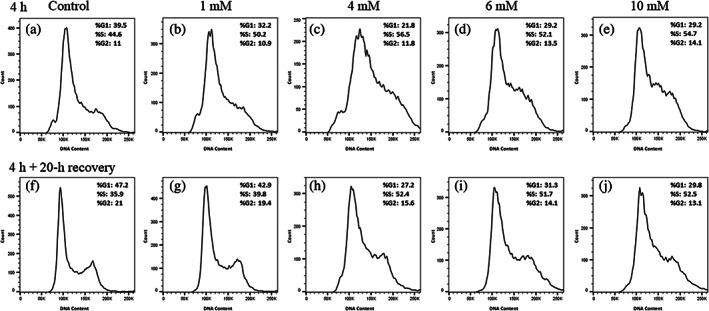
Cell cycle analysis plots show a dose‐dependent S‐phase cell cycle arrest after 4 h hydrazine treatment in exposure media (panels a–e), which is sustained after a 20 h recovery phase in complete media (panels f–j). Data were fit using the Watson algorithm. %DNA content is indicated in an inset within each panel.
3.4. Hydrazine reduces the clonogenicity of DNA repair mutant cell lines deficient in homologous recombination
Initial cytotoxicity screening with hydrazine using Alamar Blue cell viability scoring was used to select the doses tested in the various proficient and specific DNA repair‐deficient cell lines in clonogenic assays (data not shown). Hydrazine induced levels of cytotoxicity at millimolar ranges (>50%). Depending on the respective wild‐type cell line's sensitivity, the final concentrations of hydrazine selected for the clonogenic assays ranged from 0 to 5 mM in most cell lines and went up to 10 mM in the IB10 and Msh2−/− cell lines.
In comparison to the clonogenic assay results in the respective wild‐type cell lines (AA8 or V79), hydrazine led to consistently statistically significant increased cytotoxicity in the clonogenic survival in each of the UV40 (Fancg) and V‐C8 (Brca2) mutant cell lines (Figure 3a), which are associated with homologous recombination. Additionally, and in comparison to wild‐type MEFs, hydrazine led to a reduction in the clonogenicity of Xpv−/− cells, relating to translesion synthesis (Figure 3b). In the case of the translesion synthesis pathway, we did not see consistent statistical significance in mutant cell line sensitivity (with respect to the wild‐type cell line) across the doses. Apart from the increased toxicity noted in these DNA repair mutant or deficient cells, there were no other differences in clonogenicity in the other DNA repair mutant cell lines tested (Figure 3c‐f). A summary of the data with hydrazine and positive controls is provided in Figure 3g.
FIGURE 3.
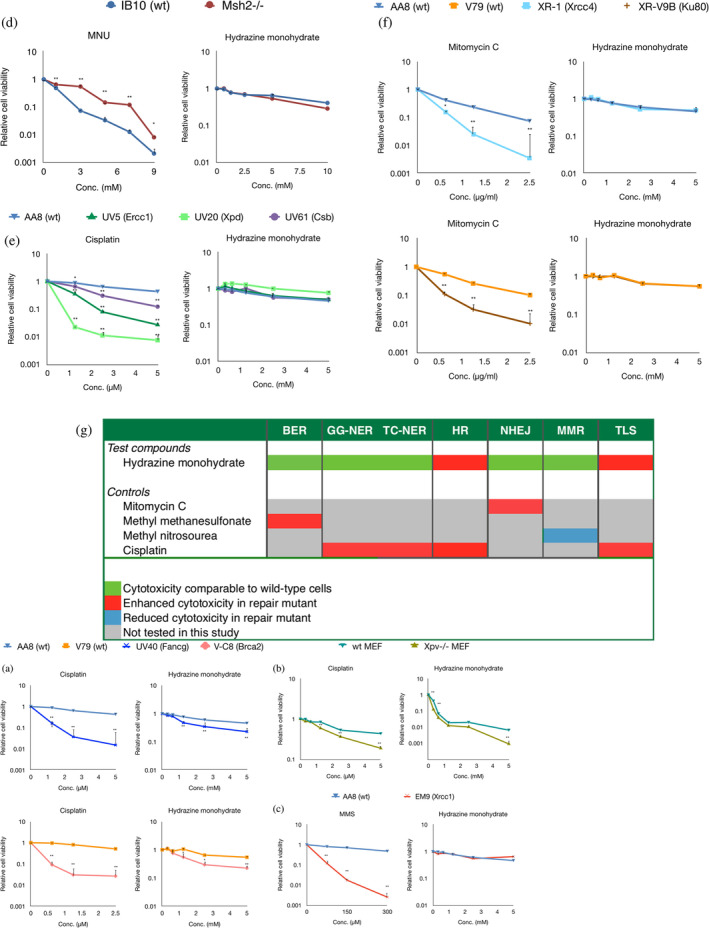
Clonogenic survival assays in DNA repair mutant cell lines show unique cytotoxicity profiles in response to a 3‐h hydrazine exposure. HR mutant (a) and TLS mutant (b) cells are more sensitive to hydrazine than the respective parental cells. BER mutant (c), MMR mutant (d), NER mutant (e), and NHEJ mutant (f) cells do not show altered cytotoxicity in response to hydrazine. Respective positive controls reflect validity of experiments (a–f). Significance (*p < .05, **p < .01) was calculated using a t‐test, comparing the wild‐type parental with the mutant cell line. Summary of cytotoxicity profiling in DNA repair mutant cell lines (g).
3.5. NHEJ, NER, and HR DNA repair mutant cells exposed to hydrazine do not exhibit enhanced mutation in the hprt assay
Cells deficient in NHEJ (XR‐1), NER (UV5), and HR (V‐C8) and their parental cell lines were exposed to hydrazine at doses ranging from 0 to 5 mM and to the positive control, ENU (0–2 mM). Relative to the vehicle control, exposure to the positive control gave rise to a robust increase of 90–200‐fold in mutant frequency (Figure 4a,b). Exposure to hydrazine led to small increases in the mutant frequency in the HR‐deficient cells. Notably, these increases were minimal and below 4‐fold, as compared to the vehicle control. Statistical analysis showed that there was no difference between the hydrazine and vehicle control mutation frequencies.
FIGURE 4.
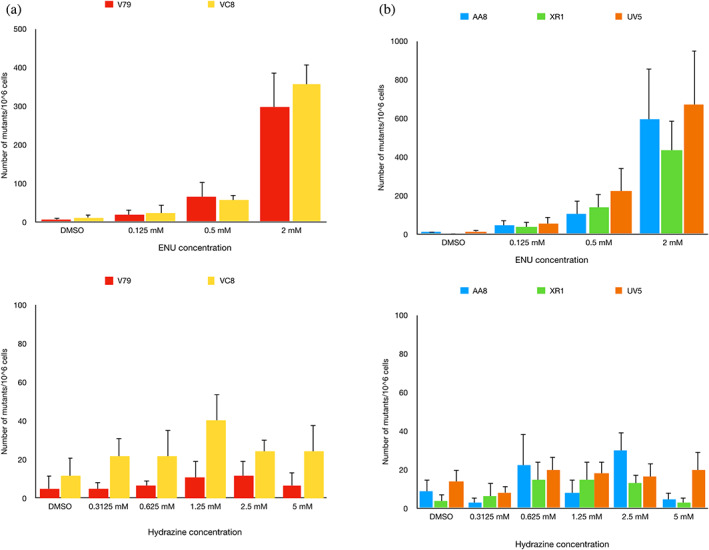
Hprt assays carried out in (a) HR mutant (VC8), (b) NER mutant (UV5), and NHEJ mutant (XR‐1) cells do not reveal increased mutagenicity following a 3‐h hydrazine exposure. Significance was evaluated using two‐way analysis of variance (ANOVA). Statistical comparisons were conducted between the wild‐type parental with the mutant cell line. ENU is included as a positive control; positive results indicate experimental validity. p‐values <.05 were considered to be significant. ENU, N‐ethyl‐N‐nitrosourea.
4. DISCUSSION
While hydrazine is a probable human carcinogen based upon rat carcinogenicity data, studies indicate the mechanism by which this occurs (i.e., mutagenic or non‐mutagenic) is less clear. Hydrazine is associated with the induction of DNA single‐strand breaks and alkali‐labile sites (comet assay). However, hydrazine failed to induce gene mutation in in vitro FE1 mouse cell and in vivo Big Blue mouse mutation studies (Nicolette et al., 2020). The lack of a hydrazine‐induced increase in mutation frequency measured in the organs for which carcinogenicity has been noted prompted us to explore additional mechanistic experimental work.
In the mouse lymphoma assay, our data showed an unusual and non‐robust dose response; notably, the cultures at 4 mM and above revealed no difference in their RTG values. Moreover, the highest mutant frequency was noted at 4 mM; after this, there was a declining dose response. The sizes of the colonies at ≥1 mM were mostly small, with the largest frequencies occurring between 0.2 and 0.4 mm. As the smaller size colonies have been associated with chromosomal aberrations (Moore et al., 1985a), these data generally support the reported positive chromosomal aberration findings in CHO cells (IARC, 1999). Despite this, chromosome aberrations were not detected in rat liver cells; these findings may be attributed to differences in metabolic capacity or reductions in managing potential oxidative stress in these cells (Hafner et al., 2019; Lane, 1992; Whitwell et al., 2015).
As it has been noted that the mouse lymphoma Tk mutants can result from recombination, deletion, and or aneuploidy (Wang et al., 2009), we decided to explore whether differentially expressed genes could provide further insight into understanding mechanism. The upregulation of GADD45 is associated with the response to genotoxic stress and, in particular, to alkylating agents (Tamura et al., 2012), which is consistent with hydrazine's capacity to generate N7‐methylguanine and O 6‐methylguanine DNA adducts. Moreover, GADD45 has been implicated in regulating the G2/M cell cycle checkpoint (Wang et al., 1999) and DNA repair following genotoxicity. More recently, GADD45 has been associated with the recruitment of base excision and or nucleotide excision repair (Niehrs & Schafer, 2012). It has been noted that GADD45 may be, at least transiently, induced by DNA double‐strand breaks and bound to chromatin undergoing homology‐dependent repair (Lee et al., 2012). Other research indicates that the NER pathway may be initially stimulated by BRCA1, which, in turn can interact with GADD45, potentially linking these DNA repair pathways together. In our clonogenic assays, it is notable that we did not detect any hypersensitization of the cells harboring NER or BER deficiencies. Nonetheless, it may be interesting to consider potential dependencies for the NER and HR pathways in the context of hydrazine exposure.
Other differentially‐regulated genes included those associated with oxidative stress and chromatin remodeling. Additional research exploring the cellular toxicity in primary rat hepatocytes revealed that biomarkers of oxidative stress were also increased following exposure to hydrazine (Hussain & Frazier, 2002). Indeed, these biomarkers showed a depletion of reduced glutathione, with a concomitant increase in oxidized glutathione, together with increased reactive oxygen species (Hussain & Frazier, 2002). These data suggest that hydrazine mediates a transcriptional response involving genes associated with cell cycle regulation, as well as an oxidative stress response. The oxidative stress response to hydrazine (both in vitro and in vivo) has been well‐documented by others and our data provide additional support (Richards et al., 2004).
Functionally, hydrazine led to a S‐phase cell cycle arrest, which was also supported by the differentially expressed genes regulated in response to hydrazine exposure, including Plk1 and Aurka. The down‐regulation of these genes has been previously reported in cycling cells exposed to DNA‐damaging agents (Goldenson & Crispino, 2015; Winkles & Alberts, 2005). Based on the current understanding of DNA repair, HR is considered a high‐fidelity DNA repair pathway, which is highly active during the late S phase and lesser so during the G2 phase of the cell cycle (Moynahan & Jasin, 2010).
Our clonogenic data suggest that the HR pathway supports the repair of hydrazine‐induced DNA damage, as when this pathway is deficient, cells are sensitized to hydrazine in comparison to the control. The hypersensitivity of the HR‐deficient cell line and suggestive but statistically inconsistent results in TLS‐deficient cell line suggested that additional DNA repair pathways may play a role in mitigating the cellular response to hydrazine. Beyond cytotoxicity in the specific DNA repair mutant cells, we have also shown that in the HR‐deficient cell line, there is no enhanced mutagenicity in an hprt assay at sub‐cytotoxic doses of hydrazine. This may suggest that we are still below a potential threshold above which mutations could occur; however, the assays were conducted to not exceed 10 mM and to avoid robust toxicity. At concentrations approaching robust toxicity, cells may be overwhelmed by the damage induced and die, such that no mutations would persist. Functionally, NHEJ could compensate for the loss of HR; we would have anticipated that there might have be an increase in mutations due to the more error‐prone DNA repair pathway's activity. Further work may be needed to explore the combinations of additional DNA repair protein deficiencies in the hprt assay to understand compensatory potential.
These data illustrate how some genetic toxicology assays may give rise to positive (or in some cases, equivocal) in vitro genotoxicity tests, but then may result in a negative in vivo mutation test, referencing our previous work (Nicolette et al., 2020). Taking a step back, we should be clear that a chemical can be genotoxic but may not be an in vivo mutagen. Positive results in chromosome damage tests in vitro or in vivo may require risk assessors in some situations to apply a linear extrapolation model to establish an acceptable exposure, where for other situations (e.g., exposure to genotoxic but non‐mutagenic impurities in pharmaceuticals), a nonlinear approach is appropriate (ICH M7). Depending on the relative susceptibilities to DNA damage and follow‐on DNA repair associated with given test system, there may be differential responses.
Based on the results, we recommend the inclusion of mechanistic data to support enhanced and more quantitative risk assessment, as opposed to hazard assessment, particularly when equivocal data are present. The additional mechanistic work may provide the opportunity to clarify these equivocal or less than clear genotoxicity or mutagenicity findings. Importantly, the mechanistic data generated with hydrazine add to the weight of evidence building in supporting that some genotoxic carcinogens may work through unique, nonlinear response mechanisms. Oftentimes, however, the data needed to support such assessments, which would otherwise allow for a more quantitative (and less qualitative) evaluation, are lacking (Johnson et al., 2014). As addressed by Hengstler et al., nonlinear response or threshold‐based mechanisms may largely be attributed to four processes, which include metabolic deactivation, DNA repair, cell cycle arrest, and apoptosis (Hengstler et al., 2003). For example, vinyl acetate is carcinogenic in rodents at highly toxic doses (Hengstler et al., 2003). At lower doses, in vivo, vinyl acetate may undergo metabolic deactivation (De Flora, 1984); it is only when threshold levels of vinyl acetate are exceeded that carcinogenesis takes place (Hengstler et al., 2003). Likewise, the genotoxic carcinogen, N‐nitrosodimethylamine (NDMA), may be metabolized to induce DNA adducts, like O 6‐alkyl‐guanine (Encell et al., 1996), potentially giving rise to DNA replication errors and genomic instability. However, in response to the formation of these DNA adducts, the DNA repair enzyme, methylguanine DNA‐methyltransferase, can restore DNA integrity in an error‐free manner, which can result in nonlinear dose response or “practical threshold,” as has recently been described (Johnson et al., 2021). These two examples highlight the need to incorporate additional mechanistic experimental studies (including those conducted in this manuscript) for an enhanced and more quantitative risk assessment (MacGregor et al., 2015a, 2015b). In advocating for this enhanced experimental approach, we acknowledge that not all scientific queries may require additional work. It is in the case studies where equivocal data exist that we would consider performing more investigative studies.
In summary, while we have explored some of the processes described by Hengstler et al., we have not been able to characterize a practical threshold for hydrazine. Nevertheless, hydrazine is known to induce DNA damage. The lack of mutations previously noted (Nicolette et al., 2020) and results from this current investigative work provide novel insight into understanding the response to hydrazine, although there are additional avenues to be explored. Future work may focus on the role of the TLS pathway in response to hydrazine, which appeared to show sensitivity in the clonogenic assay. Taken together, the findings from the mouse lymphoma assay, transcriptomic profiling, cell cycle analyses, clonogenic, and hprt assays in DNA repair mutant cell lines highlight a combination of molecular and functional approaches to explore genotoxic agents, particularly when equivocal data exist.
AUTHOR CONTRIBUTIONS
All authors have been or are current employees of AbbVie and may own AbbVie stock. Meredith Crosby, currently employed at Regeneron Pharmaceuticals, contributed to this article as an employee of AbbVie and the views expressed do not necessarily represent the views of Regeneron Pharmaceuticals Inc. AbbVie sponsored and funded the mouse lymphoma and DNA repair clonogenic and hprt assays. Authors contributed to the design, participated in the collection, analyses, and interpretation of data, as well as in the writing, reviewing, and approval of the final publication.
Meredith E. Crosby and Rita Ciurlionis developed the experimental plans. Alison Kondratiuk, Rita Ciurlionis, and Timothy G. Brayman evaluated the cytotoxicity in the FE1 cell line. Rita Ciurlionis conducted experiments with hydrazine to elucidate differential gene expression via RNAseq. Timothy G. Brayman performed the flow cytometric experiments with FE1 cells to explore the cell cycle. Alison Kondratiuk contributed to the methods text, created data tables, and reviewed the manuscript. Meredith E. Crosby, John J. Nicolette, and Rita Ciurlionis worked in collaboration with contributing scientists, drafted and revised the manuscript.
CONFLICT OF INTEREST
There are no conflicts of interest.
ACKNOWLEDGMENTS
The authors would like to acknowledge: Remco Derr and Giel Hendriks of Toxys B.V. (Leiden, Netherlands) for the conduct and supportive interpretation of the DNA repair mutant clonogenic and the hprt assays; Ryan Duggan of AbbVie for his flow cytometric data analysis expertise.
Crosby, M.E. , Ciurlionis, R. , Brayman, T.G. , Kondratiuk, A. & Nicolette, J.J. (2022) Exploring the molecular and functional cellular response to hydrazine via transcriptomics and DNA repair mutant cell lines. Environmental and Molecular Mutagenesis, 63(7), 336–350. Available from: 10.1002/em.22508
Accepted by: B. Engelward
Contributor Information
Meredith E. Crosby, Email: meredith.crosby@regeneron.com.
Rita Ciurlionis, Email: rita.ciurlionis@abbvie.com.
REFERENCES
- Brewer, C.T. , Yang, L. , Edwards, A. , Lu, Y. , Low, J. , Wu, J. et al. (2019) The isoniazid metabolites hydrazine and pyridoxal isonicotinoyl hydrazone modulate heme biosynthesis. Toxicological Sciences, 168, 209–224. [DOI] [PMC free article] [PubMed] [Google Scholar]
- Busch, D.B. , Zdzienicka, M.Z. , Natarajan, A.T. , Jones, N.J. , Overkamp, W.J.I. , Collins, A. et al. (1996) A CHO mutant, UV40, that is sensitive to diverse mutagens and represents a new complementation group of mitomycin C sensitivity. Mutation Research/DNA Repair, 363(3), 209–221. [DOI] [PubMed] [Google Scholar]
- CERI . (2007) Hazard assessment report: hydrazine. Japan: Chemicals Evaluation Research Institute. [Google Scholar]
- De Flora, S. (1984) Detoxification of genotoxic compounds as a threshold mechanism limiting their carcinogenicity. Toxicologic Pathology, 12, 337–343. [DOI] [PubMed] [Google Scholar]
- de Wind, N. , Dekker, M. , Berns, A. , Radman, M. & te Riele, H. (1995) Inactivation of the mouse Msh2 gene results in mismatch repair deficiency, methylation tolerance, hyperrecombination, and predisposition to cancer. Cell, 82(2), 321–330. [DOI] [PubMed] [Google Scholar]
- Encell, L. , Foiles, P.G. & Gold, B. (1996) The relationship between N‐nitrosodimethylamine metabolism and DNA methylation in isolated rat hepatocytes. Carcinogenesis, 17, 1127–1134. [DOI] [PubMed] [Google Scholar]
- Goldenson, B. & Crispino, J.D. (2015) The aurora kinases in cell cycle and leukemia. Oncogene, 34, 537–545. [DOI] [PMC free article] [PubMed] [Google Scholar]
- Hafner, A. , Bulyk, M.L. , Jambhekar, A. & Lahav, G. (2019) The multiple mechanisms that regulate p53 activity and cell fate. Nature Reviews. Molecular Cell Biology, 20, 199–210. [DOI] [PubMed] [Google Scholar]
- Hendriks, G. , Morolli, B. , Calléja, F.M.G.R. , Plomp, A. , Mesman, R.L.S. , Meijers, M. et al. (2014) An efficient pipeline for the generation and functional analysis of human BRCA2 variants of uncertain significance. Human Mutation, 35(11), 1382–1391. [DOI] [PMC free article] [PubMed] [Google Scholar]
- Hengstler, J.G. , Bogdanffy, M.S. , Bolt, H.M. & Oesch, F. (2003) Challenging dogma: thresholds for genotoxic carcinogens? The case of vinyl acetate. Annual Review of Pharmacology and Toxicology, 43, 485–520. [DOI] [PubMed] [Google Scholar]
- Hsie, A.W., O'Neill, J.P., Machanoff, R., Schenley, R.L & Brimer, P.A. (1981) Screening for mutagenic response of four coded chemicals by the CHO/HGPRT system. In: F. de Serres, & J. Ashby, (Eds.). Evaluation of short‐term tests for carcinogens Report of the international collaborative program (Progress in Mutation Research, Volume 1). Amsterdam: Elsevier, pp. 602–607.
- Hussain, S.M. & Frazier, J.M. (2002) Cellular toxicity of hydrazine in primary rat hepatocytes. Toxicological Sciences, 69, 424–432. [DOI] [PubMed] [Google Scholar]
- IARC . (1999) Re‐evaluation of some organic chemicals, hydrazine and hydrogen peroxide (volume 71). Lyon, France: IARC. [PMC free article] [PubMed] [Google Scholar]
- IARC . (2018) Some chemicals (volume 115). Lyon, France: IARC. [Google Scholar]
- Johnson, G.E. , Soeteman‐Hernandez, L.G. , Gollapudi, B.B. , Bodger, O.G. , Dearfield, K.L. , Heflich, R.H. et al. (2014) Derivation of point of departure (PoD) estimates in genetic toxicology studies and their potential applications in risk assessment. Environmental and Molecular Mutagenesis, 55, 609–623. [DOI] [PMC free article] [PubMed] [Google Scholar]
- Johnson, G.E. , Dobo, K. , Gollapudi, B. , Harvey, J. , Kenny, J. , Kenyon, M. et al. (2021) Permitted daily exposure limits for noteworthy N‐nitrosamines. Environmental and Molecular Mutagenesis, 62, 293–305. [DOI] [PubMed] [Google Scholar]
- Johnson G.E. (2012) Mammalian cell HPRT gene mutation assay: test methods. Methods in Molecular Biology, 817, 55–67. [DOI] [PubMed] [Google Scholar]
- Kimball, R.F. (1977) The mutagenicity of hydrazine and some of its derivatives. Mutation Research, 39, 111–126. [DOI] [PubMed] [Google Scholar]
- Krämer, A. , Green, J. , Pollard, J., Jr. & Tugendreich, S. (2014) Causal analysis approaches in ingenuity pathway analysis. Bioinformatics, 30, 523–530. [DOI] [PMC free article] [PubMed] [Google Scholar]
- Lane, D.P. (1992) Cancer. p53, guardian of the genome. Nature, 358, 15–16. [DOI] [PubMed] [Google Scholar]
- Lee, B. , Morano, A. , Porcellini, A. & Muller, M.T. (2012) GADD45alpha inhibition of DNMT1 dependent DNA methylation during homology directed DNA repair. Nucleic Acids Research, 40, 2481–2493. [DOI] [PMC free article] [PubMed] [Google Scholar]
- Liu, N., Lamerdin, J.E., Tucker, J.D., Zhou, Z.Q., Walter, C.A., Albala, J.S., et al. (1997) The human XRCC9 gene corrects chromosomal instability and mutagen sensitivities in CHO UV40 cells. Proceedings of the National Academy of Sciences, 94(17), 9232–9237. [DOI] [PMC free article] [PubMed] [Google Scholar]
- Lloyd, M ., & Kidd D. (2012) The mouse lymphoma assay. Methods in Molecular Biology, 817, 35–54. [DOI] [PubMed] [Google Scholar]
- MacGregor, J.T. , Frotschl, R. , White, P.A. , Crump, K.S. , Eastmond, D.A. , Fukushima, S. et al. (2015a) IWGT report on quantitative approaches to genotoxicity risk assessment II. Use of point‐of‐departure (PoD) metrics in defining acceptable exposure limits and assessing human risk. Mutation Research, Genetic Toxicology and Environmental Mutagenesis, 783, 66–78. [DOI] [PubMed] [Google Scholar]
- MacGregor, J.T. , Frotschl, R. , White, P.A. , Crump, K.S. , Eastmond, D.A. , Fukushima, S. et al. (2015b) IWGT report on quantitative approaches to genotoxicity risk assessment I. Methods and metrics for defining exposure‐response relationships and points of departure (PoDs). Mutation Research, Genetic Toxicology and Environmental Mutagenesis, 783, 55–65. [DOI] [PubMed] [Google Scholar]
- Matsumoto M, Kano H, Suzuki M, Katagiri T, Umeda Y, & Fukushima S. (2016) Carcinogenicity and chronic toxicity of hydrazine monohydrate in rats and mice by two‐year drinking water treatment. Regulatory Toxicology and Pharmacology, 76, 63–73. [DOI] [PubMed] [Google Scholar]
- Moore, M.M. , Clive, D. , Howard, B.E. , Batson, A.G. & Turner, N.T. (1985a) In situ analysis of trifluorothymidine‐resistant (TFTr) mutants of L5178Y/TK+/− mouse lymphoma cells. Mutation Research, 151, 147–159. [DOI] [PubMed] [Google Scholar]
- Moore, M.M. , Clive, D. , Hozier, J.C. , Howard, B.E. , Batson, A.G. , Turner, N.T. et al. (1985b) Analysis of trifluorothymidine‐resistant (TFTr) mutants of L5178Y/TK+/− mouse lymphoma cells. Mutation Research, 151, 161–174. [DOI] [PubMed] [Google Scholar]
- Moore, M.M. , Honma, M. , Clements, J. , Bolcsfoldi, G. , Burlinson, B. , Cifone, M. et al. (2006) Mouse lymphoma thymidine kinase gene mutation assay: follow‐up meeting of the International Workshop on Genotoxicity Testing—Aberdeen, Scotland, 2003—assay acceptance criteria, positive controls, and data evaluation. Environmental and Molecular Mutagenesis, 47, 1–5. [DOI] [PubMed] [Google Scholar]
- Morris, J.K. , Wald, N.J. & Springett, A.L. (2015) Occupational exposure to hydrazine and subsequent risk of lung cancer: 50‐year follow‐up. PLoS One, 10, e0138884. [DOI] [PMC free article] [PubMed] [Google Scholar]
- Moynahan, M.E. & Jasin, M. (2010) Mitotic homologous recombination maintains genomic stability and suppresses tumorigenesis. Nature Reviews. Molecular Cell Biology, 11, 196–207. [DOI] [PMC free article] [PubMed] [Google Scholar]
- Nicolette, J. , Murray, J. , Sonders, P. , Kondratiuk, A. & Crosby, M. (2021) In vitro and in vivo mammalian mutation assays support a nonmutagenic mechanism of carcinogenicity for hydrazine. Environmental and Molecular Mutagenesis, 62, 4–17. [DOI] [PubMed] [Google Scholar]
- Niehrs, C. & Schafer, A. (2012) Active DNA demethylation by Gadd45 and DNA repair. Trends in Cell Biology, 22, 220–227. [DOI] [PubMed] [Google Scholar]
- OECD 490 . (2016) TG490: In vitro mammalian cell gene mutation tests using the thymidine kinase gene. In: OECD guidelines for the testing of chemicals, section 4. Paris, France: Organization for Economic Co‐operation and Development. [Google Scholar]
- Richards, V.E, Chau, B., White, M.R., & McQueen, C.A. (2004) Hepatic gene expression and lipid homeostasis in C57BL/6 mice exposed to hydrazine or acetylhydrazine. Toxicological Sciences, 82(1), 318–332. [DOI] [PubMed] [Google Scholar]
- Robbiano, L. , Baroni, D. , Novello, L. & Brambilla, G. (2006) Correlation between induction of DNA fragmentation in lung cells from rats and humans and carcinogenic activity. Mutation Research, 605, 94–102. [DOI] [PubMed] [Google Scholar]
- Stamato, T.D. , Weinstein, R. , Giaccia, A. & Mackenzie, L. (1983) Isolation of cell cycle‐dependent gamma ray‐sensitive Chinese hamster ovary cell. Somatic Cell Genetics, 9(2), 165–173. [DOI] [PubMed] [Google Scholar]
- Steinhoff, D. , Mohr U., & Schmidt, W.M. (1990) On the question of the carcinogenic action of hydrazine—evaluation on the basis of new experimental results. Experimental Pathology, 39(1), 1–9. [DOI] [PubMed] [Google Scholar]
- Tafazoli, S., Mashregi, M., & O'Brien, P.J. (2008) Role of hydrazine in isoniazid‐induced hepatotoxicity in a hepatocyte inflammation model. Toxicology and Applied Pharmacology, 229(1), 94–101. [DOI] [PubMed] [Google Scholar]
- Tamura, R.E, de Vasconcellos, J.F., Sarkar, D., Libermann, T.A, Fisher, P.B., & Zerbini, L.F. (2012) GADD45 proteins: central players in tumorigenesis. Current Molecular Medicine, 12(5), 634–651. [DOI] [PMC free article] [PubMed] [Google Scholar]
- Temviriyanukul, P. , van Hees‐Stuivenberg, S. , Delbos, F. , Jacobs, H. , de Wind, N. & Jansen, J.G. (2012) Temporally distinct translesion synthesis pathways for ultraviolet light‐induced photoproducts in the mammalian genome. DNA Repair, 11(6), 550–558. [DOI] [PubMed] [Google Scholar]
- Thompson, L.H. , Brookman, K.W. , Dillehay, L.E. , Carrano, A.V. , Mazrimas, J.A. , Mooney, C.L. et al. (1982) A CHO‐cell strain having hypersensitivity to mutagens, a defect in DNA strand‐break repair, and an extraordinary baseline frequency of sister‐chromatid exchange. Mutation Research/Fundamental and Molecular Mechanisms of Mutagenesis, 95(2–3), 427–440. [DOI] [PubMed] [Google Scholar]
- Wang, J., Sawyer, J.R., Chen, L., Chen, T., Honma, M., Mei, N. et al. (2009) The mouse lymphoma assay detects recombination, deletion, and aneuploidy. Toxicological Sciences, 109(1), 96–105. [DOI] [PubMed] [Google Scholar]
- Wang, X.W., Zhan, Q., Coursen, J.D., Khan, M.A., Kontny, H.U., Yu, L. et al. (1999) GADD45 induction of a G2/M cell cycle checkpoint. Proceedings of the National Academy of Sciences, 96(7), 3706–3711. [DOI] [PMC free article] [PubMed] [Google Scholar]
- White, P.A. , Douglas, G.R. , Gingerich, J. , Parfett, C. , Shwed, P. , Seligy, V. et al. (2003) Development and characterization of a stable epithelial cell line from Muta Mouse lung. Environmental and Molecular Mutagenesis, 42, 166–184. [DOI] [PubMed] [Google Scholar]
- Whitwell, J. , Smith, R. , Jenner, K. , Lyon, H. , Wood, D. , Clements, J. et al. (2015) Relationships between p53 status, apoptosis and induction of micronuclei in different human and mouse cell lines in vitro: implications for improving existing assays. Mutation Research, Genetic Toxicology and Environmental Mutagenesis, 789–790, 7–27. [DOI] [PubMed] [Google Scholar]
- Winkles, J.A. & Alberts, G.F. (2005) Differential regulation of polo‐like kinase 1, 2, 3, and 4 gene expression in mammalian cells and tissues. Oncogene, 24, 260–266. [DOI] [PubMed] [Google Scholar]
- Yang, A.L. , Zdzienicka, M.Z. , Simons, J.W. & Waters, R. (1991) The repair of 4‐nitroquinoline‐1‐oxide induced DNA adducts in hypersensitive Chinese hamster mutants: Lack of repair of UV induced (6–4) photoproduct correlates with reduced repair of adducts at the N2 of guanosine. Mutagenesis, 6(6), 449–453. [DOI] [PubMed] [Google Scholar]
- Zdzienicka, M.Z. & Simons, J.W. (1987) Mutagen‐sensitive cell lines are obtained with high frequency in V79 Chinese cells. Mutation Research/Fundamental and Molecular Mechanisms of Mutagenesis, 178(2), 235–244. [DOI] [PubMed] [Google Scholar]