Abstract
During the germinal center (GC) reaction, B cells undergo profound transcriptional, epigenetic and genomic architectural changes. How such changes are established remains unknown. Mapping chromatin accessibility during the humoral immune response we show that OCT2 was the dominant transcription factor linked to differential accessibility of GC regulatory elements. Silent chromatin regions destined to become GC-specific super-enhancers contained pre-positioned OCT2 binding sites in naïve B cells. These pre-loaded super-enhancer “seeds” featured spatial clustering of regulatory elements enriched in OCT2 DNA binding motifs that became heavily loaded with OCT2 and its GC specific co-activator OCA-B in GC B cells. Super-enhancers with high abundance of pre-positioned OCT2 binding preferentially formed long-range chromatin contacts in GCs, to support expression of GC-specifying factors. Gain in accessibility and architectural interactivity of these regions were dependent on recruitment of OCA-B. Prepositioning key regulators at super-enhancers may represent a broadly used strategy for facilitating rapid cell fate transitions.
Keywords: OCT2, OCA-B, BCL6, chromatin accessibility, chromatin architecture, germinal center B cell
Introduction
The germinal center (GC) reaction is a transient and dynamic micro-anatomic structure wherein B-cells undergo rapid phenotypic changes to enable immunoglobulin affinity maturation. Upon T-cell dependent activation, a subset of B cells migrate to the interior of follicles to form GCs. In the GC dark zone, B cells referred to as centroblasts exhibit extremely high rates of proliferation and mutate the variable regions of immunoglobulin genes through somatic hypermutation1. Subsequently, centroblasts migrate to the GC light zone, where they compete for affinity dependent selection by T-cells. GC B cells (GCBs) undergoing selection in the light zone are referred to as centrocytes, and those with sufficiently high-affinity B cell antigen receptors (BCRs) bind antigen and interact strongly with cognate T follicular helper (Tfh) cells. T-cell help can trigger re-entry to the dark zone for additional rounds of somatic hypermutation, or terminal differentiation into antibody secreting plasma cells1.
Emergence of the unique GC phenotype is linked to profound epigenetic reprogramming2. For example, many enhancers are toggled from an active to a poised state through recruitment of HDAC3 and LSD1 by the BCL6 transcriptional repressor during transition from Naïve B cells to centroblasts3,4. Moreover, GCBs manifest profound changes in 3D chromatin architecture during NB to GCB transition, including the formation of GC specific enhancer networks5.
Reorganization of the GC epigenome coincides with extensive transcriptional reprogramming, leading to upregulation or repression of several thousand genes6. These GC-specific events are likely initiated by several transcription factors (TFs)7. However, the mechanisms and the sequence of events through which specific TFs engage chromatin to enable the GC program remains unclear7,8. Indeed, several hundred individual TFs are upregulated or downregulated in GCBs. Although the repressive effect of several transcriptional regulators of the GC phenotype such as BCL6, EZH2, and FOXO1 is now established in the dark zone program in particular2, less is known about the transcriptional activators that initiate GC reprogramming. Here, we leverage chromatin accessibility, transcriptome, and chromatin interaction profiling, coupled with computational analysis and functional experiments to explore how chromatin programming is organized during the humoral immune response.
Results
Differential accessibility defines B cells transiting the GC
To define the chromatin accessibility regulatory landscape of B cells transiting the GC reaction in humans we performed assay for transposase-accessible chromatin sequencing (ATAC-seq) and RNA sequencing (RNA-seq) in sorted GC centroblasts (CBs), GC centrocytes (CCs), naïve B cells (NBs), memory B cells (MBs), and plasma cells (PCs) (Fig. 1a, extended data Fig. 1a, 2a-d). We then constructed a chromatin accessibility atlas, consisting of 76,237 distinct ATAC-seq DNA elements reproducible between cell type biological replicates. Among these, distal DNA elements located more than 2.0 kb 5’ or 3’ from the nearest gene TSS exhibited greater dynamic range of variability compared to promoter elements (extended data Fig. 2e). Accordingly, hierarchical clustering (Fig. 1b) and principal component analysis (extended data Fig. 2f) of distal element accessibility clustered B cells according to developmental stage, with greater accuracy than promoter accessibility (Adjusted Rand Index, 0.94 distal vs 0.64 promoter, p<2.2×10⁻¹⁶).
Figure 1. An Atlas of differentially accessible DNA elements defines B cells transiting the humoral immune response.
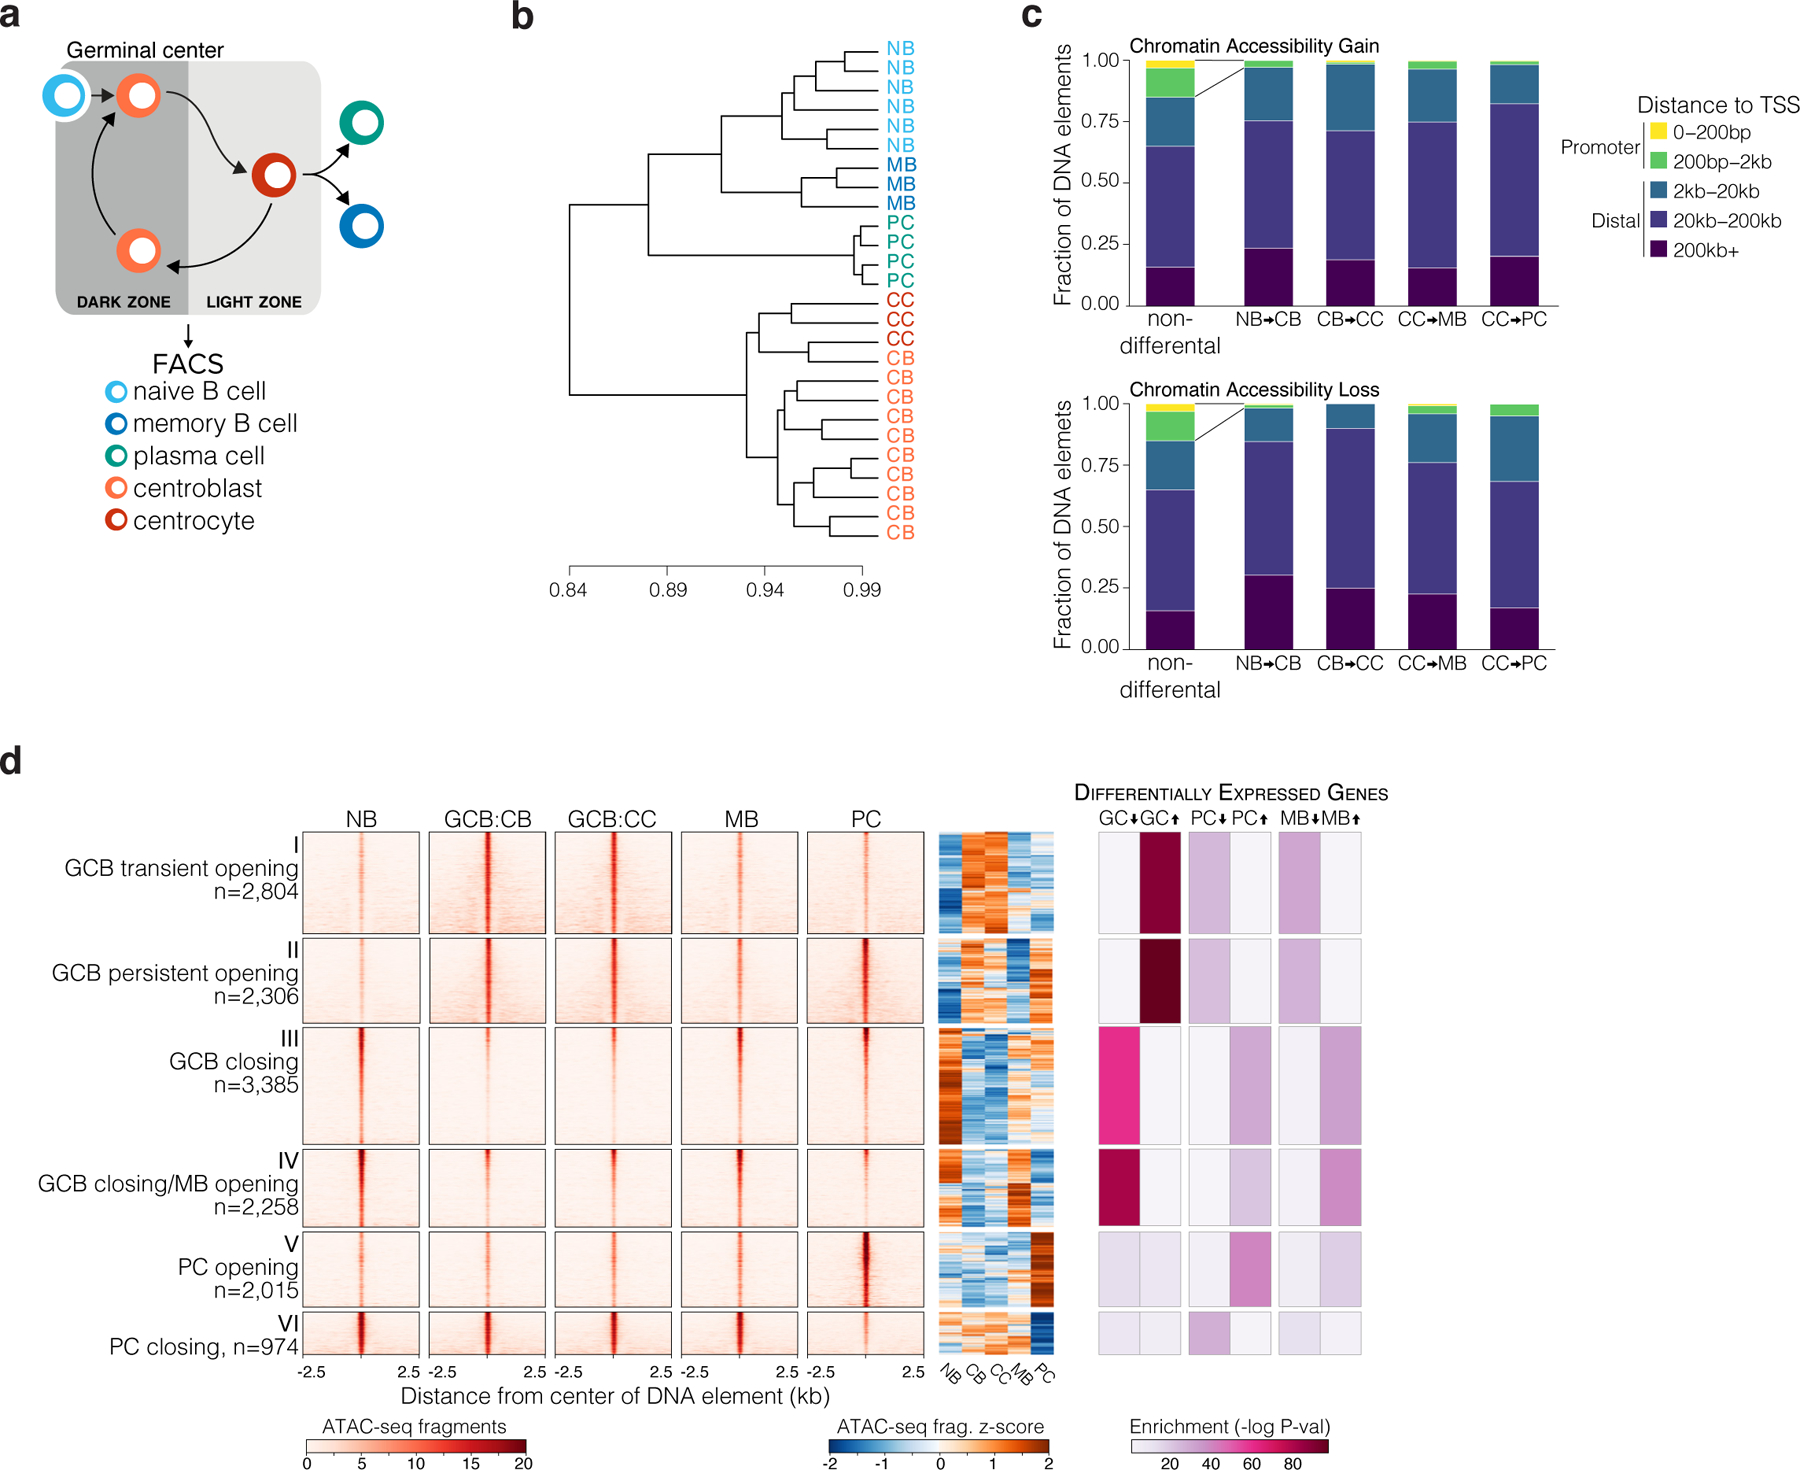
a, Illustration of cell fate transitions during the humoral immune response for B-cell populations isolated by FACS for sequencing studies. b, unsupervised hierarchical clustering dendrogram of distal DNA element chromatin accessibility across biological replicate B cell populations. NB: naïve B cell (n=6); CB: GCB centroblast (n=10); CC: GCB centrocyte (n=2); PC: plasma cell (n=4); MB: memory B cell (n=3). c, Bar plot showing the fractional proportion of elements according to genomic distance to nearest gene transcription start site for all non-differential DNA elements or differentially accessible sites that increase (top) or decrease (bottom) in accessibility during the indicated cell type transition. d, ATAC-seq insertion heat maps centered on K-means clustered (k=6) differentially accessible DNA elements (n= 13,658 sites) for the transitions indicated in (c), and enrichment of differentially expressed genes as determined by RNA-seq for genes with nearest gene TSS to respective DNA elements. Enrichment P values were computed by Fisher’s exact test with False Discovery Rate correction. RNA-seq was performed using at least 3 biological replicates per B-cell population.
To uncover the regulatory circuits that accompany B cell phenotypic transitions, we identified the most differentially accessible elements (DAEs n=13,658, FDR<1×10⁻⁴, absolute log2FC >1.5). DAEs were preferentially gene distal (>2kb from nearest TSS) compared to non-differential sites (Fig 1c). Unbiased k-means clustering of DAEs revealed six clusters with distinct patterns of accessibility. Cluster I and II represented 5,110 accessible elements gained in GCBs (GCB de novo sites). Of these, 2,306 (cluster I) were also accessible in PCs, whereas 2,804 (cluster II) were only open in GCBs, and became less accessible upon GC exit (Fig. 1d). 5,643 NB elements were decommissioned (clusters III and IV) in GCBs, of which 3,385 became accessible again in MBs, and 2,258 became accessible in both MBs and PCs. The remaining two clusters (clusters V and VI) captured elements that were newly accessible or decommissioned specifically in PCs. Importantly, DAEs were significantly associated with differential expression of nearby genes (Fig. 1d). The transition between NB and GCB involved some of the most profound differences in chromatin accessibility (n=10,753 DAEs, clusters I, II, III and IV) (extended data Fig. 2g).
GC B cell de novo accessibility is linked to binding of OCT2
Considering that gain of accessibility at TF DNA motifs generally reflects nucleosome displacement associated with TF binding, we developed a computational method to quantify TF accessibility remodeling and infer the relative contribution of 221 B cell TFs to the gain and loss in gene-distal accessibility occurring in GCBs (Fig. 2a-b). The most significant increase in accessibility between NB and GCB occurred at OCT2 recognition sequences (Fig. 2b, FDR<0.01).
Figure 2. De novo chromatin accessibility in GC B-cells is most strongly linked to DNA elements bound by OCT2.
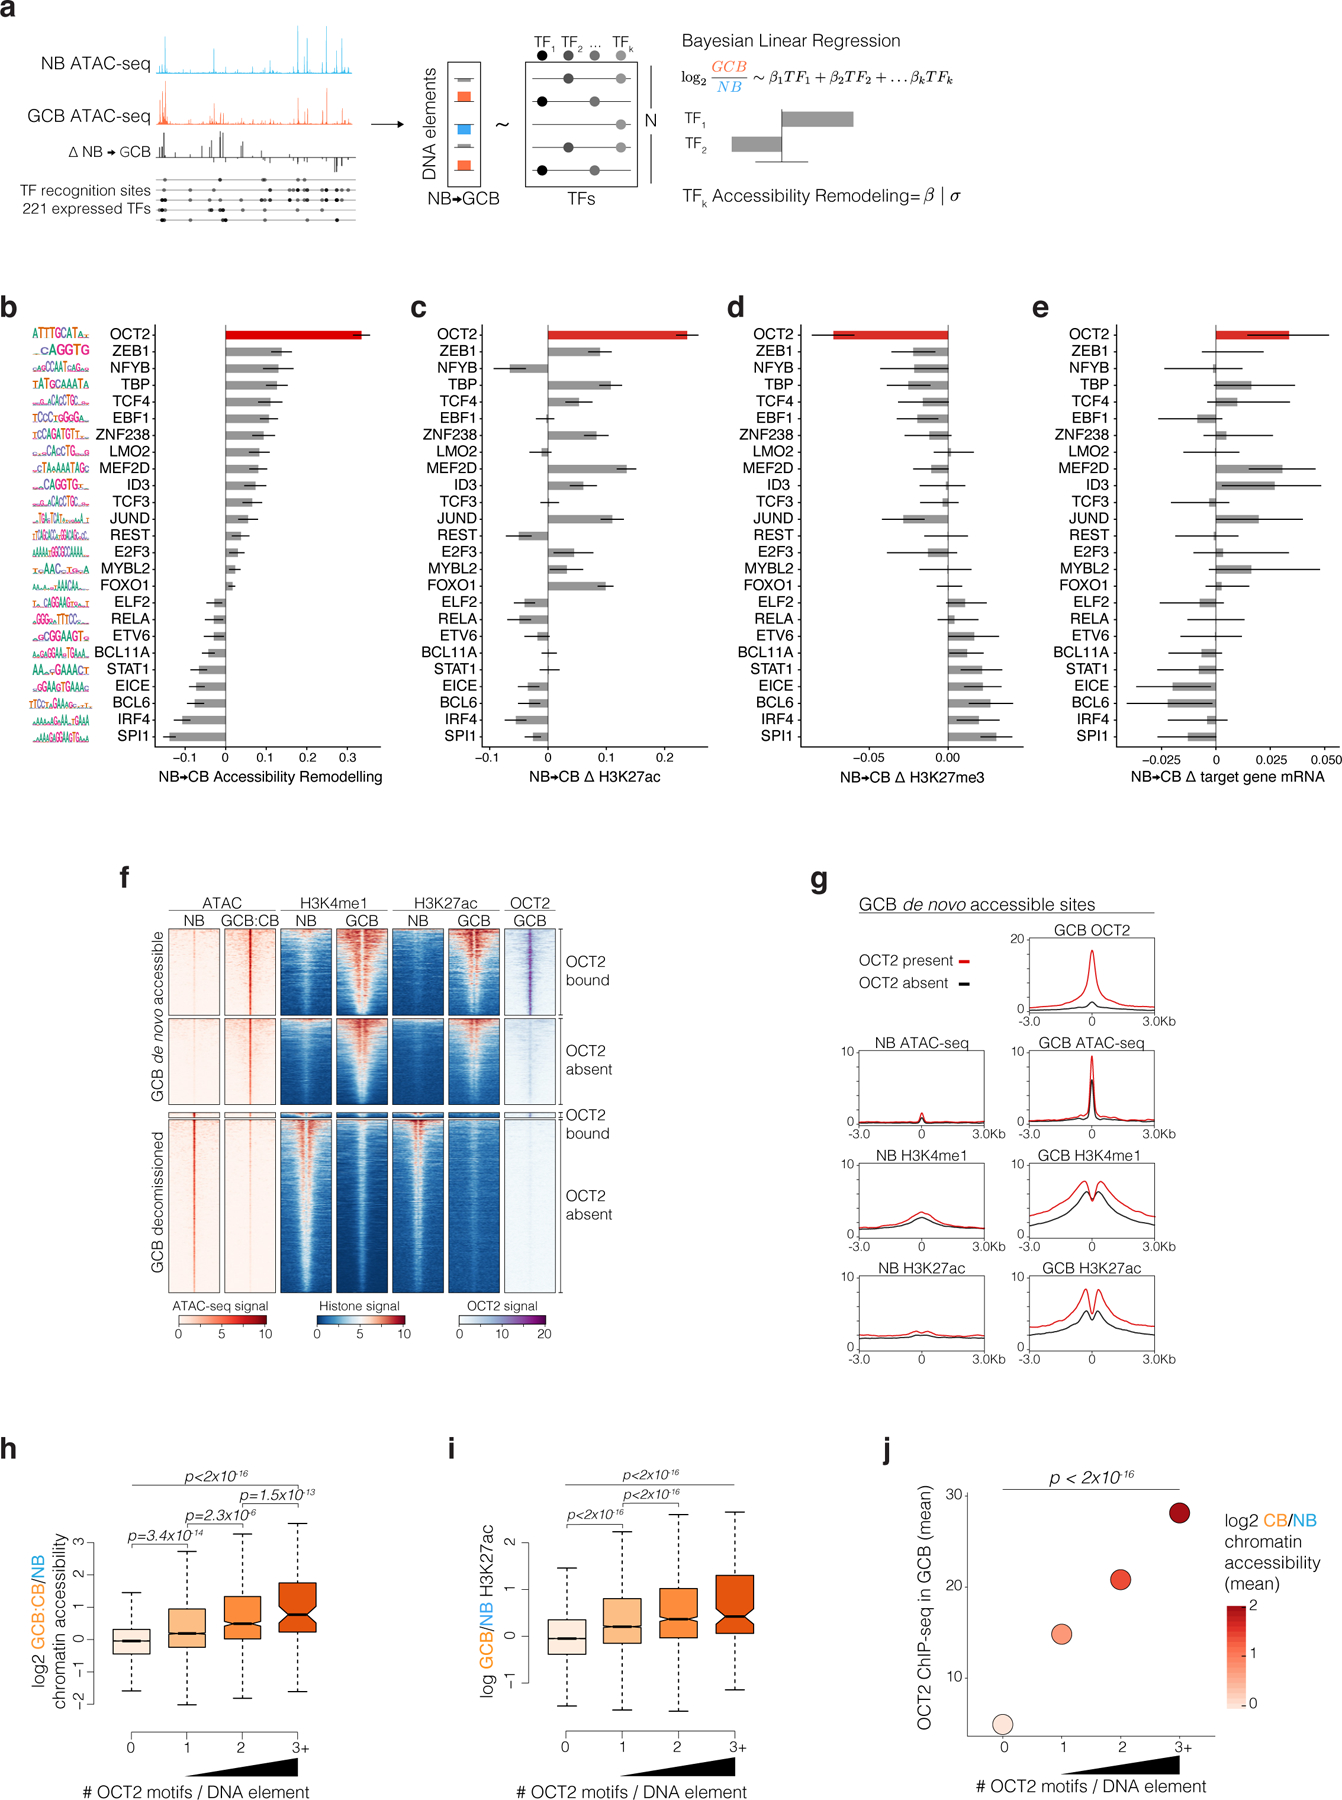
a, Strategy to quantify TF accessibility remodeling in GCBs relative to NBs. The top significant TFs identified from individual regressions of accessibility changes on TF DNA motifs are included in a Bayesian multiple linear regression using horseshoe regularization. Posterior means for the coefficients of each TF motif defines the TF accessibility remodeling score. b, bar plot of GCB vs NB accessibility remodeling scores for expressed TFs using gene-distal DNA elements (n=66,677). Motif logos (left) represent position weight matrices used to map motifs in accessible sites. c, TF motif multiple regression effect estimates for histone H3K27ac log2 fold-changes in biological replicate GCBs (n=4) relative to NBs (n=4) across gene-distal DNA elements (n=66,677). d, TF motif Bayesian multiple regression effect size estimates for repressive H3K27me3 log2 fold-changes in biological replicate GCBs (n=3) relative to NBs (n=3) across gene-distal DNA elements (n=66,677). e, TF motif multiple regression effect size estimates for nearest TSS gene expression log2 fold-changes in biological replicate GCBs (n=6) relative to NBs (n=6). f, ATAC-seq insertion and ChIP-seq enrichment (signal/input) heatmaps centered on differentially accessible elements (DAEs) in GCB vs NB. OCT2-bound DAEs contain an OCT2 ChIP-seq peak in GCBs. g, density plots centered on GCB de novo accessible sites comparing OCT2 binding in GCBs and H3K4me1 abundance, H3K27ac abundance and ATAC-seq insertions in NBs and GCBs. h, Box plot of GCB vs NB accessibility and H3K27ac (i) log2 fold-changes for elements containing 0 (n=57627), 1 (n=7799), 2 (n=1110) or >=3 (n=141) OCT2 motifs. Pair-wise comparison adjusted P values computed by Tukey’s test and P values (top) computed by type II ANOVA. j, Bayesian regression posterior estimates for accessibility log2 fold-changes (color scale) and GCB OCT2 ChIP-seq enrichment at DNA elements with indicated number of OCT2 recognition sequences. P values are computed by type II ANOVA. Box plot center lines represent medians, box limits indicate upper/lower quartiles, whiskers are minimum/maximum values within 1.5 x inter-quartile range of 1st and 3rd quartile, and notches approximate 95% confidence intervals (CI) of the median.
OCT2 was also the TF motif most significantly associated with gain in the activating mark H3K27ac9,10 in GCBs vs NBs, with concomitant reduction in repressive mark H3K27me34, and transcriptional activation of nearby genes (Fig. 2c-e). OCT2 was the only TF for which all four of these parameters were highly significantly coordinated. However, the chromatin accessibility score also identified (albeit to lesser extent) TFs involved in GC formation such as ZEB1 and ID311,12. TF binding sequences that significantly lost accessibility included BCL6, IRF4, and ETS-IRF composite elements (EICE)13. IRF4 itself, as well as genes at EICE sites, were repressed during the GC reaction, whereas BCL6 mediates transcriptional repression in GCBs13,14.
OCT2 is known to contribute to GC formation15, however our analyses suggest a broader role than previously described. To assess OCT2 binding genome-wide, we performed chromatin immunoprecipitation sequencing (ChIP-seq) for OCT2 in GCBs and identified 21,895 OCT2 binding peaks (FDR < 1×10⁻⁵), which enriched for a single high-significance motif matching the reference ATGCAAAT OCT2 motif (extended data Fig. 3a). Most OCT2-bound DAEs (91.2%) gained (rather than lost) accessibility in GCBs, whereas a majority of DAEs not bound by OCT2 (70%) showed reduced accessibility in GCBs (extended data Fig. 3b). Histones immediately adjacent to these OCT2-bound GCB newly accessible sites featured de novo H3K4me19 and H3K27ac, and the abundance of both marks was significantly higher for newly accessible sites bound by OCT2, compared to newly accessible sites without OCT2 binding (Fig. 2f,g). Differential chromatin accessibility, differential H3K27ac abundance, and OCT2 binding increased with the number of OCT2 recognition sequences contained within gene distal sites (Fig. 2h,i, extended data Fig. 3c; Fig. 2j). Similar findings were observed in ATAC-seq profiles of primary murine NB and GCB cells16 (extended data Fig. 3d-i). These observations suggest that OCT2 binding may be linked to GC-specific enhancer establishment. As described before17, we observed no detectable protein expression difference of OCT2 in GCBs relative to NBs, but 17-fold increase of the OCT2 cofactor OCAB in GCBs vs NBs (extended data Fig. 3j). Thus, the effect of OCT2 on chromatin may be through its association with OCAB in GCBs.
Gain of accessibility is preprogrammed by OCT2 in NBs
Since OCT2 expression was relatively similar in NBs and GCBs, we wondered whether the change in chromatin accessibility in GCBs was due to redistribution of OCT2 binding throughout the genome as compared to NBs. We therefore performed ChIP-seq for OCT2 in NBs. De novo motif discovery of the resulting peaks recovered a single high-significance motif, which matched the reference OCT2 motif (p<10−16, extended data Fig. 4a). Comparing NBs vs GCBs, OCT2 was present at 5,089 peaks harboring an OCT2 DNA motif (direct sites) in NBs and 10,055 direct sites in GCBs (Fig. 3a). Notably, 83% of OCT2 direct targets in NBs were also bound by OCT2 in GCBs. We refer to these as “OCT2 pre-positioned” sites (Fig. 3a). GCBs acquired an additional 5,819 direct sites that were not bound by OCT2 in NBs, referred to here as “GCB de novo” OCT2 sites. In both cell types, the vast majority (93%) of OCT2 direct sites were localized to gene distal regions (extended data Fig. 4b). Examples of pre-positioned and GCB de novo OCT2 binding sites are shown for the DNMT1, S1PR2 and MYBL1 genes (Fig. 3b and extended data Fig. 4c), which are induced in GCB and contribute to GC formation18–20.
Figure 3. Gain of chromatin accessibility is preprogrammed by OCT2 in naïve B cells.
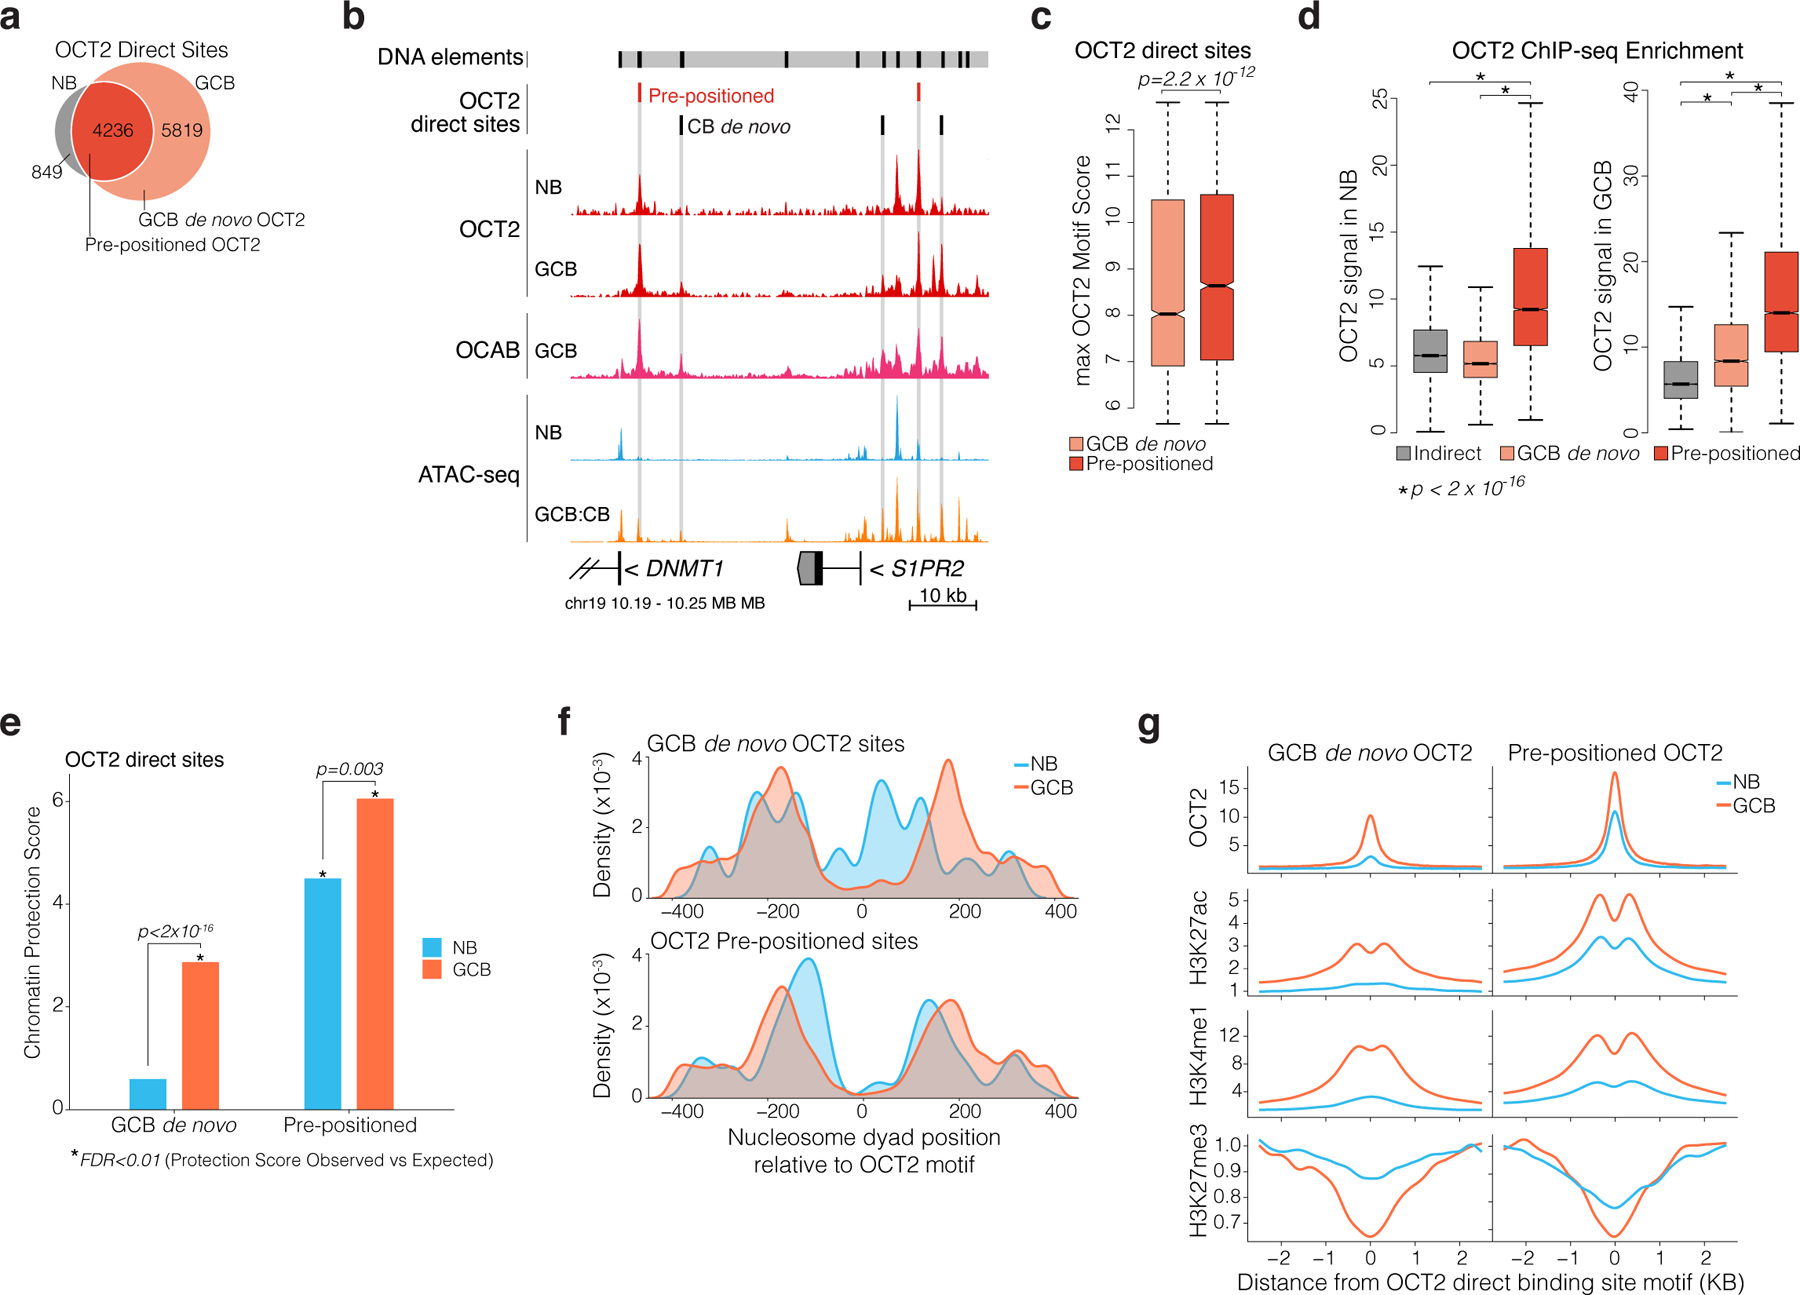
a, Venn diagram of OCT2 ChIP-seq peak overlap in NBs and GCBs. Direct sites contain an OCT2 DNA motif. OCT2 pre-positioned sites refer to direct sites bound by OCT2 in NBs and GCBs. b, genome browser tracks for OCT2 and OCAB ChIP-seq enrichment, normalized ATAC-seq insertions, and OCT2 direct sites in NBs and GCBs. Y-axis scale is identical across all ATAC-seq samples and all ChIP-seq samples. c, boxplot comparing maximum OCT2 motif score in pre-positioned (n=4236) and GCB de novo (n=5819) OCT2 binding sites. P value is computed by Mann-Whitney U-test. D, boxplot comparing OCT2 ChIP-seq enrichment/input in NBs and GCBs across OCT2 indirect (n=3732), pre-positioned (n=4236), and GCB de novo (n=5819) sites. **indicates p<2×10⁻¹⁶ by Mann-Whitney U-test. E, Barplots comparing ATAC-seq chromatin protection scores computed using HINT22 for GCB de novo and pre-positioned OCT2 sites in NBs and GCBs. P values are computed by Mann-Whitney U-test. *indicates sites with significant observed vs. expected protection at 1% false discovery rate. f, density plots of NB and GCB nucleosome dyad positions relative to OCT2 DNA motif in pre-positioned and GCB de novo OCT2 sites in NBs and GCBs. Nucleosome position and occupancy are computed from ATAC-seq data using NucleoATAC42. g, read density plots of ChIP-seq enrichment/input for OCT2, H3K27ac, H3K4me1, and H3K27me3 in GCBs and NBs at pre-positioned and GCB de novo OCT2 sites. Box plots center lines represent medians, box limits indicate upper/lower quartiles, whiskers are minimum/maximum values within 1.5 x inter-quartile range of 1st and 3rd quartile, and notches approximate 95% CI of the median.z
We observed that GCB de novo OCT2 sites were located significantly closer to pre-positioned OCT2 sites than other accessible sites (extended data Fig. 4d). Reciprocally, newly accessible sites in GCBs exhibited more spatial clustering compared to sites that maintained accessibility across NBs and GCBs, or that were newly decommissioned in GCBs (p < 2 × 10⁻²², extended data Fig. 4e). Accordingly, the likelihood of observing a GCB de novo OCT2 site increased with the fraction of DNA elements in a cluster containing a pre-positioned OCT2 site (p=1.2×10⁻⁹). Thus, GCBs acquire de novo OCT2 binding sites that are clustered around pre-positioned OCT2 sites.
To assess potential mechanisms that might explain pre-positioning of OCT2 in NBs we quantified all OCT2 direct binding site motif scores, as an indicator of OCT2 binding affinity21. We found that OCT2 pre-positioned sites contained higher affinity OCT2 DNA recognition sequences compared to GCB de novo OCT2 sites (p<2.2×10⁻¹², Fig. 3c). In both NBs and GCBs, OCT2 ChIP-seq enrichment was greater at OCT2 pre-positioned sites compared to GCB de novo or indirect sites (p<1×10⁻⁶, Fig. 3d). Indeed, ATAC-seq TF footprinting22 revealed protection of OCT2 pre-positioned sites in both NBs and GCBs, (although with greater protection in GCBs, Fig. 3e), whereas in contrast GCB de novo sites were only highly protected in GCBs (protection score p<2×10⁻¹⁶, Fig. 3e, extended data Fig. 4f). This difference was further reflected by examination of nucleosome positioning.
Specifically, OCT2 pre-positioned sites were nucleosome depleted and flanked by well-positioned nucleosomes in both NB and GCBs (although nucleosomes shifted even further from the OCT2 motif in GCBs, Fig. 3f). In marked contrast, GCB de novo OCT2 sites were occupied by nucleosomes in NBs and subsequently evicted in GCBs (Fig. 3f). Thus, high affinity OCT2 DNA sequences may help pre-position OCT2 in NBs for later functional relevance in GCBs, where they facilitate engagement of surrounding low-affinity OCT2 sites to establish GCB-specific enhancer activation patterning. Consistent with this notion, OCT2 pre-positioned sites manifested the greatest degree of gain of H3K4me1 and H3K27ac as well as loss of H3K27me3, as compared to GCB de novo OCT2 sites (Fig. 3g, extended data Fig 4g-h).
OCA-B enables de novo OCT2 binding near pre-positioned sites
One potential explanation for the chromatin profiles of pre-positioned vs de novo OCT2 sites could be through OCT2 recruitment of the OCA-B coactivator15,23,24. Notably, OCA-B was shown to alleviate DNA sequence requirements of OCT2, facilitating its binding to less optimal sites25. Along these lines, we observed significant motif divergence in GCB de novo OCT2 binding sites at positions 2,3,4, and 8 of the octamer element, consistent with alternate motif sequences near OCT2 pre-positioned sites that OCT2 binds in the presence of OCA-B and that restrict OCT2 binding in the absence of OCA-B25 (extended data Fig. 5a).
To further investigate the potential contribution of OCA-B to chromatin effects associated with OCT2 binding, we performed ChIP-seq for OCA-B in purified human GCBs and identified 14,431 OCAB peaks (FDR<1×10⁻⁵). De novo motif discovery recovered the consensus OCT2 DNA motif (extended data Fig. 5b), and 85.7% of OCA-B peaks overlapped an OCT2 ChIP-seq peak in GCB. OCA-B was found at a greater fraction of OCT2 direct sites (80.0%) compared to OCT2 indirect sites (56.1%) or sites not bound by OCT2 in GCBs (8.8%, p<2×10⁻¹⁶, Fig. 4a). Furthermore, OCT2 and OCA-B ChIP-seq enrichment were strongly correlated across OCT2 direct sites in GCBs (r=0.87, p<2×10⁻¹⁶, Fig. 4b). Like OCT2, OCA-B enrichment was greater at OCT2 pre-positioned and GCB de novo OCT2 sites compared to OCT2 indirect sites (p<2×10⁻¹⁶), with OCT2 pre-positioned sites also showing stronger enrichment compared with GCB de novo OCT2 sites (p<2×10⁻¹⁶, Fig. 4c). Similar distributions of OCT2 and OCA-B recruitment were observed by using ChIP-seq for OCAB in murine GCBs and OCT2 in murine splenic B cells26 (extended data Fig. 5c-d). Hence the effect of OCT2 binding, even if present in NBs, is mainly functionally relevant in GCBs, likely through the actions of OCA-B and particularly focused on licensing and activating putative gene enhancers.
Figure 4. OCA-B recruitment by OCT2 is required to induce GC-specific chromatin accessibility and gene expression.
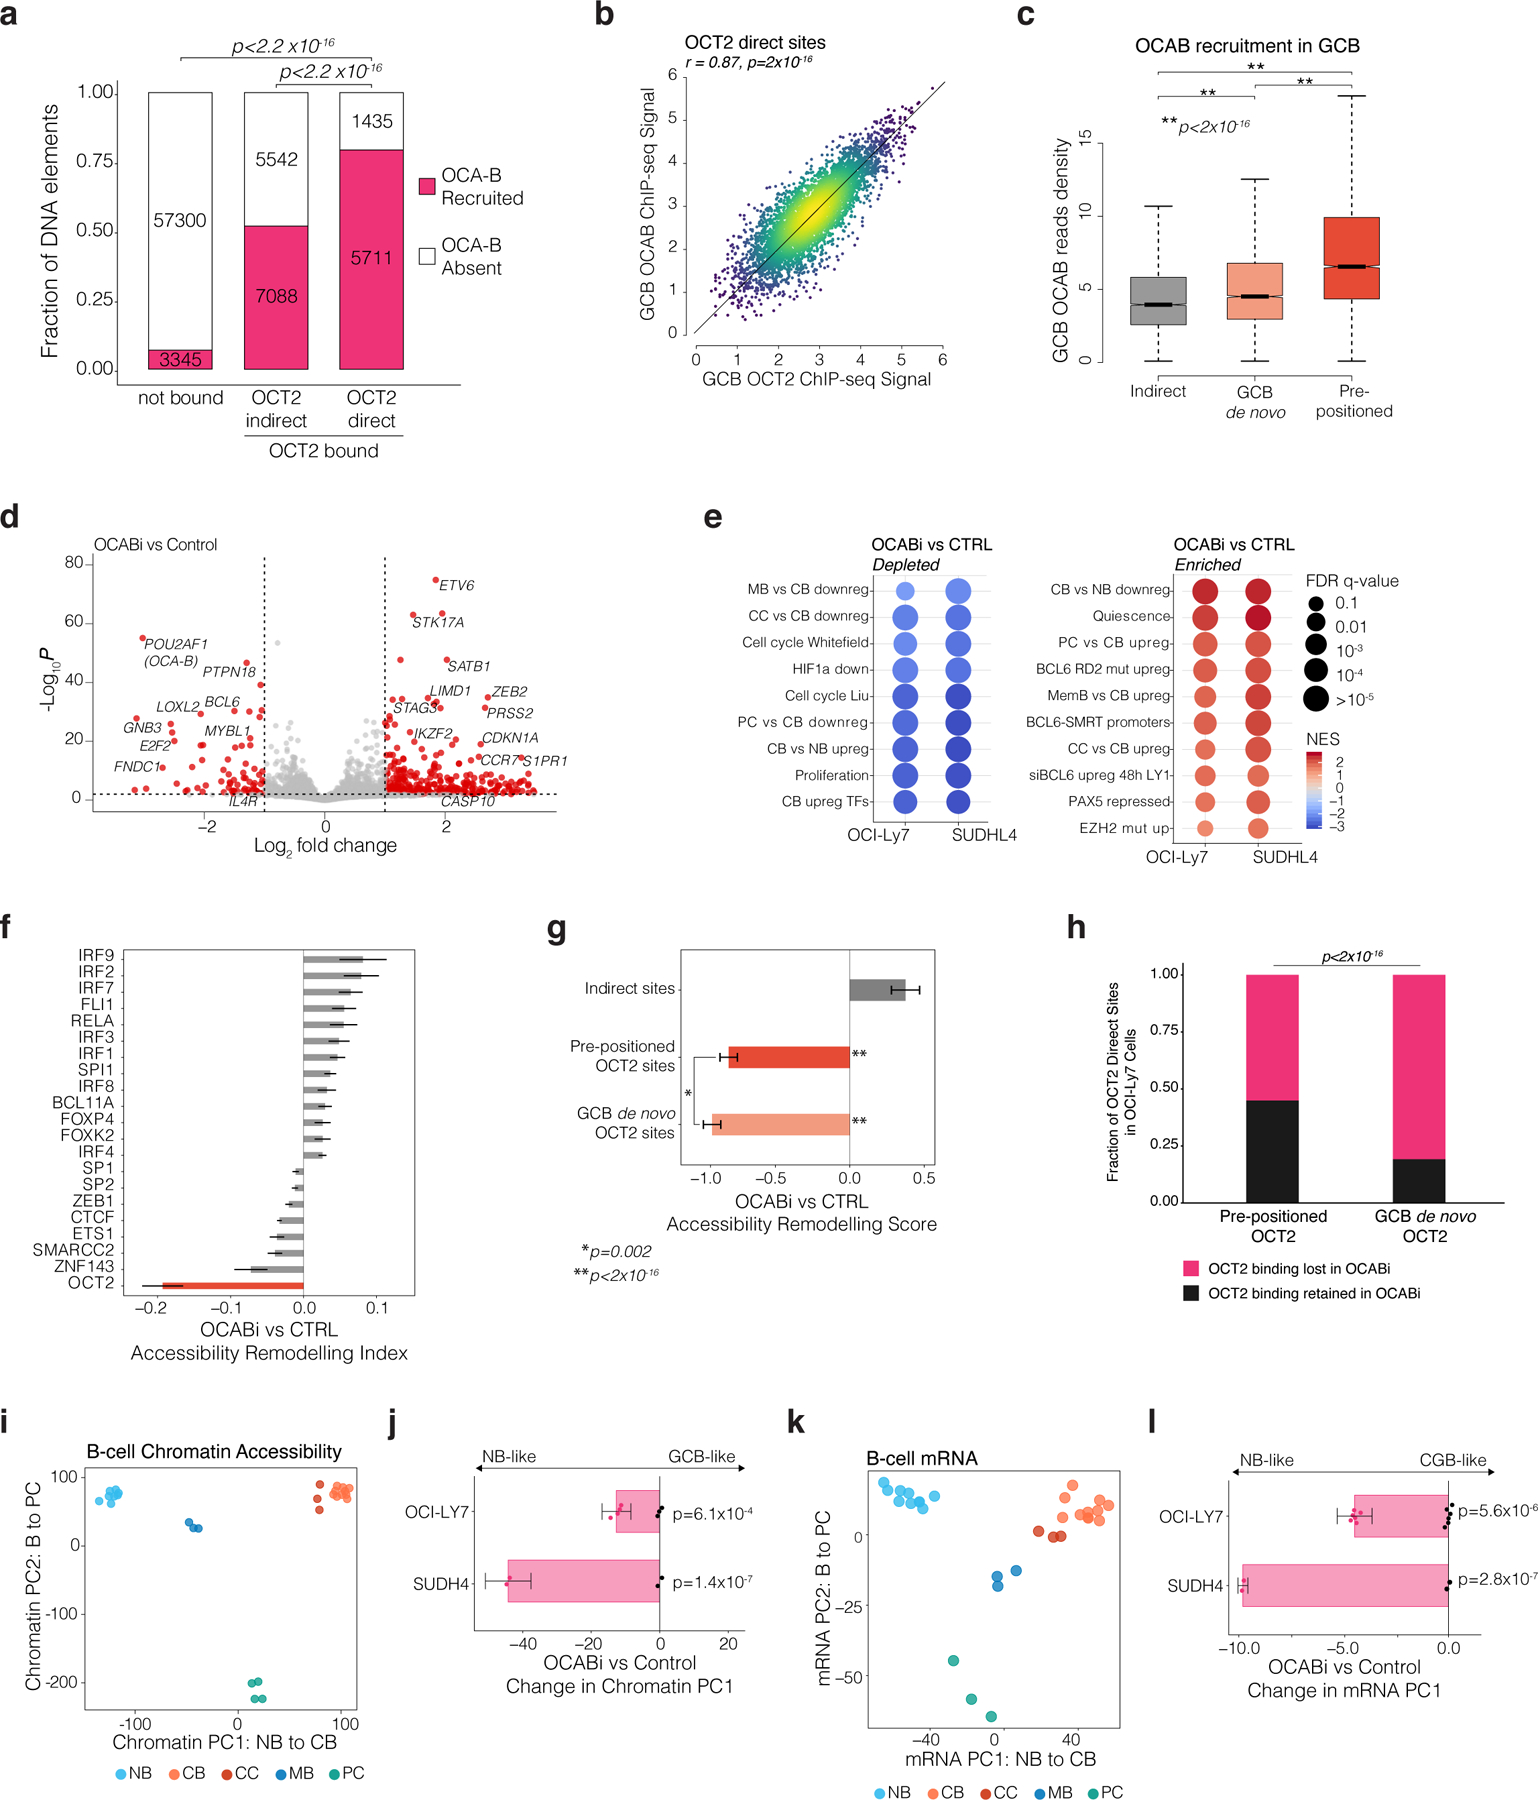
a, bar plot showing the fraction of sites containing an OCAB ChIP-seq peak. P values calculated by chi-square test with Bonferroni correction. b, scatter plot OCT2 and OCAB ChIP-seq enrichment/input across OCT2 direct sites in GCBs. c, boxplot comparing OCAB enrichment/input in GCBs across OCT2 indirect (n=3732), pre-positioned (n=4236), and GCB de novo (n=5819) sites. Box plots center lines represent medians, box limits indicate upper/lower quartiles, and whiskers are minimum/maximum values within 1.5x inter-quartile range of 1st and 3rd quartile. P values computed by Mann-Whitney U-test. d, volcano plot of differentially expressed genes in OCABi versus control OCI-Ly7 (OCABi n = 4, control n=3) and SUDHL4 (OCABi n=2, control n=2). Red points indicate genes differentially expressed at FDR<0.01 and absolute log2 FC>1. e, Gene set enrichment analysis (GSEA)43 dot plot showing gene sets with depletion/enrichment in OCABi vs Control OCI-Ly7 and SUDHL4 cells. Color scale indicates normalized enrichment score and dot diameter encodes FDR q-value. f, TF accessibility remodeling scores for OCABi versus control OCI-Ly7 (OCABi n = 4, control n=3) and SUDHL4 (OCABi n=2, control n=2). Top 21 significant (FDR<0.001) TF motifs shown. g, bar plot showing OCABi vs Control TF accessibility remodeling for NB pre-positioned (n=3636), GCB de-novo OCT2 (n=3510), or OCT2 indirect (n=3732) sites. *P values by Tukey’s HSD; **P values by F-test comparing to sites with no OCT2 binding (n=65,359). Error bars show 95% CIs. h, bar plot showing fraction of sites with OCT2 binding by ChIP-seq in OCABi (n=2) versus control (n=2) OCI-Ly7 cells. P value computed by Fisher’s exact test. i, PCA of B cell chromatin accessibility using 13,658 DAEs between B cell subtypes. j, bar plot showing mean difference in Chromatin PC1 loading between OCABi versus control cells. P values computed by two-sample t-test. Error bars show 95% CIs. k, PCA of B cell gene expression using 3,838 differentially expressed genes between B cell subtypes. l, Bar plot of mean difference in mRNA PC1 loading between OCABi versus control cells. P values computed by two-sample t-test. Error bars show 95% CIs.
GC-specific accessibility and gene expression require OCA-B
To determine whether OCA-B is required for GC-specific transcriptional reprogramming and chromatin accessibility around OCT2 pre-positioned sites we used CRISPR-I to knockdown OCA-B in two GCB-derived cell lines (extended data Fig. 6a). PCA using chromatin accessibility and gene expression clustered both cell lines with primary GCBs (extended data Fig. 6b-c), supporting their use as GCB surrogates. OCAB knockdown (referred to as OCABi) led to reduced cell growth compared to non-targeting control sgRNAs, as previously observed (extended data Fig. 6d-e)15. OCAB mRNA abundance was significantly reduced in both cell lines (extended data Fig. 6f-g). Unsupervised hierarchical clustering of OCABi chromatin accessibility and gene expression profiles revealed robust differences induced by depletion of OCA-B (extended data Fig. 6h-i).
Comparing OCABi vs control, we found 939 and 838 genes significantly up and down-regulated, respectively (FDR<0.01, absolute FC > 2, Fig. 4d). OCA-B knockdown led to a broad decrease in expression of genes normally upregulated during the NB>GCB transition (FDR<0.001, Fig. 4d-e), including GC-specific TFs. Genes expressed at higher levels in centroblasts relative to PCs, MBs, or centrocytes, as well as cell cycle and proliferation genes were also significantly reduced by OCA-B knockdown (FDR<0.001, Fig. 4e). Key GC regulatory factors such as MEF2B and BCL627, as well as HOXC4, IRF8, AICDA, and MYBL120,28–30 were down-regulated. We also observed derepression of genes usually down-regulated in GCBs (Fig. 4d-e), a likely secondary effect of decreased BCL6 expression. Indeed, BCL6 target genes were significantly derepressed in OCABi vs control cells (Fig. 4e)4,31, e.g., CDKN1A and S1PR1(Fig. 4d)4,27.
From the chromatin perspective, OCAB depletion led to increased accessibility for 940 and decreased accessibility for 1113 DNA elements (FDR<0.01). The most significant loss in accessibility upon OCAB depletion occurred at OCT2 recognition sequences (Fig. 4f) even though expression of OCT2 itself remained unchanged. Pre-positioned OCT2 sites and GCB de novo OCT2 sites exhibited significant loss of accessibility (p < 10−7), with no loss in accessibility at OCT2 indirect sites (Fig. 4g). Notably, there was significantly greater accessibility decrease at GCB de novo OCT2 sites compared to pre-positioned OCT2 sites (p=0.002), suggesting that lower affinity OCT2 binding sites may be most dependent on OCAB for chromatin remodeling (Fig. 4g). Confirming this finding, OCT2 ChIP-seq in OCI-Ly7 cells captured 81% of OCT2 direct sites identified in NB and GCB (n=10,055 sites), only 32% of which were retained after OCAB-knockdown. Notably, OCT2 binding in OCAB depleted cells was preferentially retained at pre-positioned sites vs GCB de novo sites (Fig. 4h). Moreover, GCB de novo OCT2 sites were 3.43 times more likely than OCT2 pre-positioned sites to show a loss of OCT2 binding in OCAB-depleted cells (99% CI = 3.02– 3.91, p<2.2×10⁻¹⁶). Thus, OCT2 de novo binding is reliant on OCA-B, consistent with the known role of OCA-B in stabilizing OCT2 binding to DNA and enabling binding to motifs with imperfect octamer sequences25.
To further test the hypothesis that OCAB is a critical mediator of GC-specific chromatin accessibility patterning, we performed PCA based on the 13,658 DAEs that defined B cell subpopulations (Fig. 4i). Principal component 1 (PC1) delineated the trajectory from NB to GCB chromatin states, whereas PC2 reflected the transition to the plasma cell lineage. Projecting the accessibility profiles of OCABi and control onto the PCs defined in primary B cells yielded a partial reversal of the GCB-like chromatin state towards a NB-like chromatin state (Fig. 4j, extended data Fig. 6j-l). Similar results were obtained by PCA of RNA-seq data using the 3,838 differentially expressed genes among B cell subsets (Fig. 4k), where OCAB CRISPRi induced shifting towards a NB-like transcriptional program (Fig. 4l, extended data Fig. 6m-n). Collectively, these data suggest that OCAB plays a key role in helping OCT2 drive specific chromatin accessibility patterning and gene expression programs that define the GC phenotype.
OCAB is sufficient for formation of GCB chromatin architecture
Given that GCB-derived cells require OCAB to maintain GC-specific chromatin accessibility and gene expression, and that OCAB is strongly induced in GCBs26 and recruited to OCT2 direct sites, we hypothesized that expression of Ocab in B cells might initiate chromatin and transcriptional changes that accompany the GC transition. To test this hypothesis, we ectopically expressed of Pou2af1 in mouse splenic B cells (extended data Fig. 7a-b) and performed chromatin accessibility and gene expression analyses (n=5 mice per group). We identified 784 sites and 741 sites with increased and decreased accessibility (respectively) relative to control (FDR<0.1, Fig. 5a). Chromatin accessibility in ectopically expressed Pou2af1 cells (referred to as mOCAB) was most significantly associated with Oct2-Ocab sites (as defined by mouse GCB Ocab ChIP-seq26 peaks that contain an Oct2 motif), and putative Oct2 sites (ATAC-seq peaks containing an Oct2 DNA motif, FDR<0.001, Fig. 5b). Notably, sites with increasing chromatin accessibility in mOCAB relative to control were enriched for Oct2-Ocab sites (NES=2.49, FDR<2×10⁻¹⁶, Fig. 5c). Using ATAC-seq of murine NBs and GCBs16, we found that GCB newly accessible sites also became highly accessible in mOCAB vs control (NES=2.37, FDR<2×10⁻¹⁶, Fig. 5d). Reciprocally, we observed depletion of sites that lose accessibility in GCB cells (NES=1.07, FDR=6.7×10⁻⁸, Fig. 5e). In addition, accessibility remodeling scores increased for Id3, Zeb1, and Tcf3 (FDR<0.001, Fig. 5b), which also increased during the transition from NB to GCB in mouse (extended data Fig. 3f) and human (Fig. 2b). Reciprocally, forced expression of OCAB led to decreased accessibility at sites containing Spi1, Bcl11a, and Rela DNA motifs (FDR<0.001, Fig. 5b), all of which decreased significantly in mouse and human GCBs (extended data Fig. 3f, Fig. 2b). However, among all these TF-motifs, only those for Oct2 were significantly associated with greater mOCAB ChIP-seq enrichment (p<2.2×10⁻¹⁶, Fig. 5f), suggesting that chromatin accessibility changes at other TF-motifs were more likely indirect effects of OCAB. Finally, mOCAB expression led to upregulation of canonical GC TFs required for the GCB phenotype, such as Mef2b, Eaf2, Bcl6, and downregulation of the Bcl6 target gene Cdkn1a (Fig. 5g). Altogether, these findings demonstrate that OCAB is both necessary and sufficient to initiate formation of the GCB chromatin landscape.
Figure 5. OCAB expression is sufficient to drive GC-specific chromatin accessibility and gene expression in murine splenic B cells.
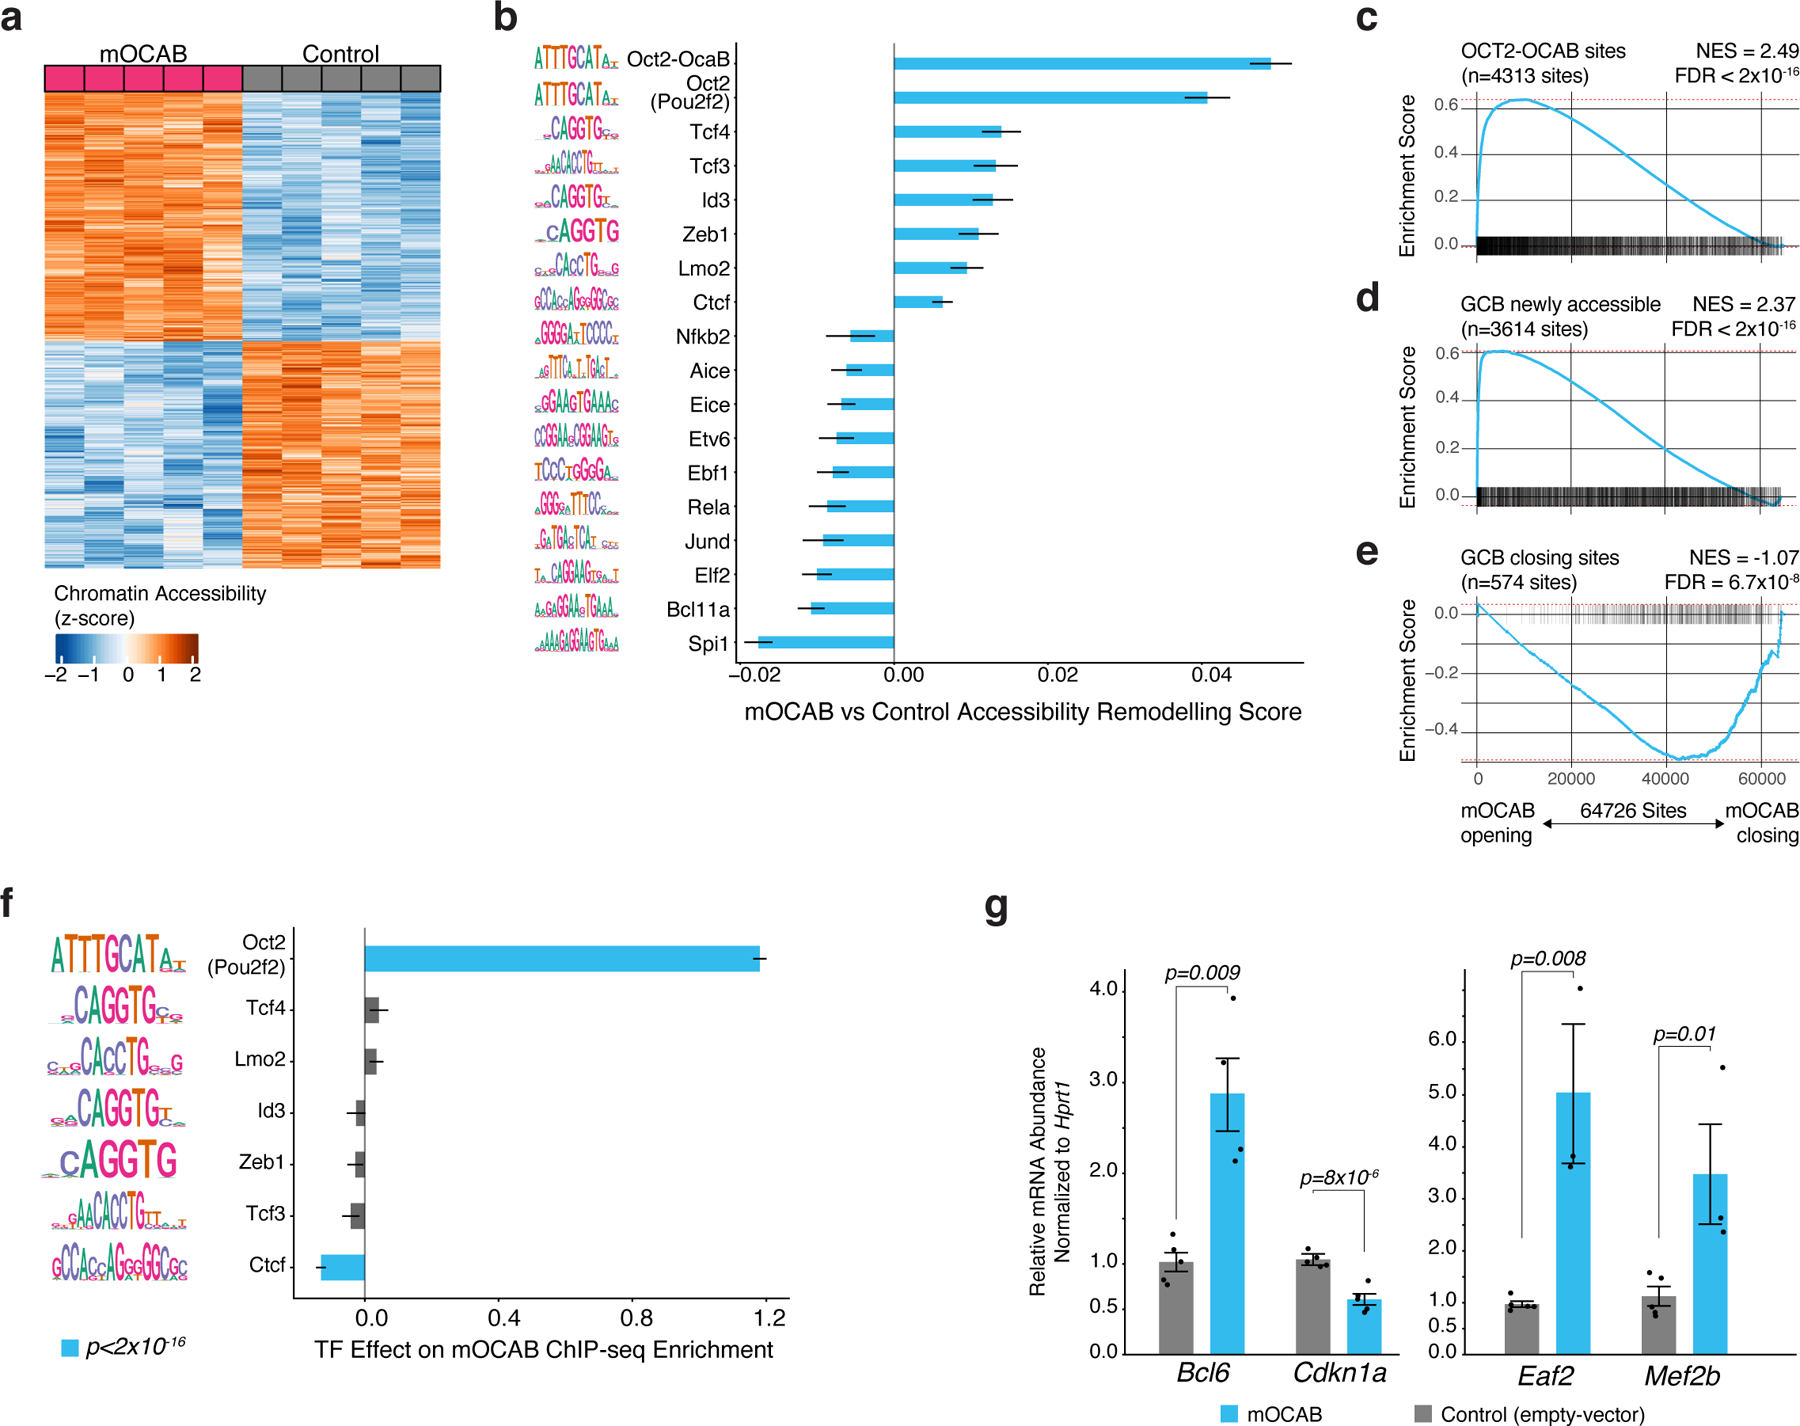
a, heatmap of chromatin accessibility in control and mOCAB-expressing mouse splenic B cells for 784 sites and 741 sites with increased and decreased accessibility (respectively) in mOCAB relative to control. Splenic B cells from n=5 mice were stimulated with LPS ex vivo and transduced with a GFP vector containing Pou2af1 (mOCAB) or GFP only (control). b, TF accessibility remodeling in mOCAB (n=5) relative to control (n=5) murine splenic B cells for DNA mapped across 64,726 accessible sites. TF motifs with FDR<0.001 are shown. Error bars represent 95% CI of the mean. c, results of Peak-set Enrichment Analysis testing enrichment of OCT2-OCAB, GCB newly accessible (d), or GCB closing (e) peak-sets across 64,726 DNA elements in mouse B cells ranked by accessibility log2 fold-change in mOCAB (n=5) vs control (n=5). OCT2-OCAB sites defined as DNA elements that contain a mouse GCB OCAB ChIP-seq26 peak with an OCT2 motif. Differentially accessible sites were determined using mouse NB and GCB ATAC-seq data16 (Extended Data Fig 3d). Enrichment statistics were computed by GSEA43 applied to peaks (see Methods). f, bar plot showing effect estimates for TF motifs on GCB OCAB ChIP-seq enrichment across DNA elements (n=64,726) in mouse B cells. g, bar plot showing mRNA abundance relative to Hprt for Bcl6, Cdkn1a, Eaf2, and Mef2b in mOCAB (n=5) and control (n=5) GFP+ viable mouse B cells. P values are calculated by Welch t-test and error bars show standard error of the mean (SEM).
OCT2-OCAB enhancers contact promoters of GC-upregulated genes
GC-specific enhancers exhibit significant gain in looping in GCBs5. We wondered whether OCT2-OCAB complexes may play a role in enabling enhancer-promoter interactions of GC genes. We performed H3K27Ac Hi-ChIP in OCI-Ly7 cells, to identify chromatin interactions associated with this activating histone mark32. Reflecting the state of GCBs, OCT2 and OCAB were present in OCI-Ly7 cells at 88% of OCT2 pre-positioned sites, based on ChIP-seq in OCI-Ly7 cells. H3K27Ac Hi-ChIP identified 5939 high-confidence H3K27ac loops (FDR<0.01). Of these, 1,717 H3K27ac loops contained at least one OCT2 direct binding site with OCAB present (OCT2-OCAB sites) in one of their anchors (regions of DNA that interact to form loops), accounting for 29% of all H3K27ac loops, and 39% of all enhancer-promoter (EP) loops. HiChIP contact enrichment was significantly greater for EP loops anchored by OCT2-OCAB sites, compared to EP loops not anchored by an OCT2-OCAB site (Fig. 6a). Moreover, 63% of loops involving OCT2-OCAB sites were EP-loops, compared to 39% of loops not anchored by an OCT2-OCAB site (extended data Fig. 8a). Notably, a significantly higher fraction of OCT2-OCAB EP loops were anchored to promoters of GCB upregulated genes (extended data Fig. 8a). Thus, enhancers containing OCT2-OCAB preferentially interact with promoters of genes up-regulated in GCBs.
Figure 6. OCAB is required for GC-specific enhancers to interact with promoters of GC upregulated genes via intermediate and long-range looping.
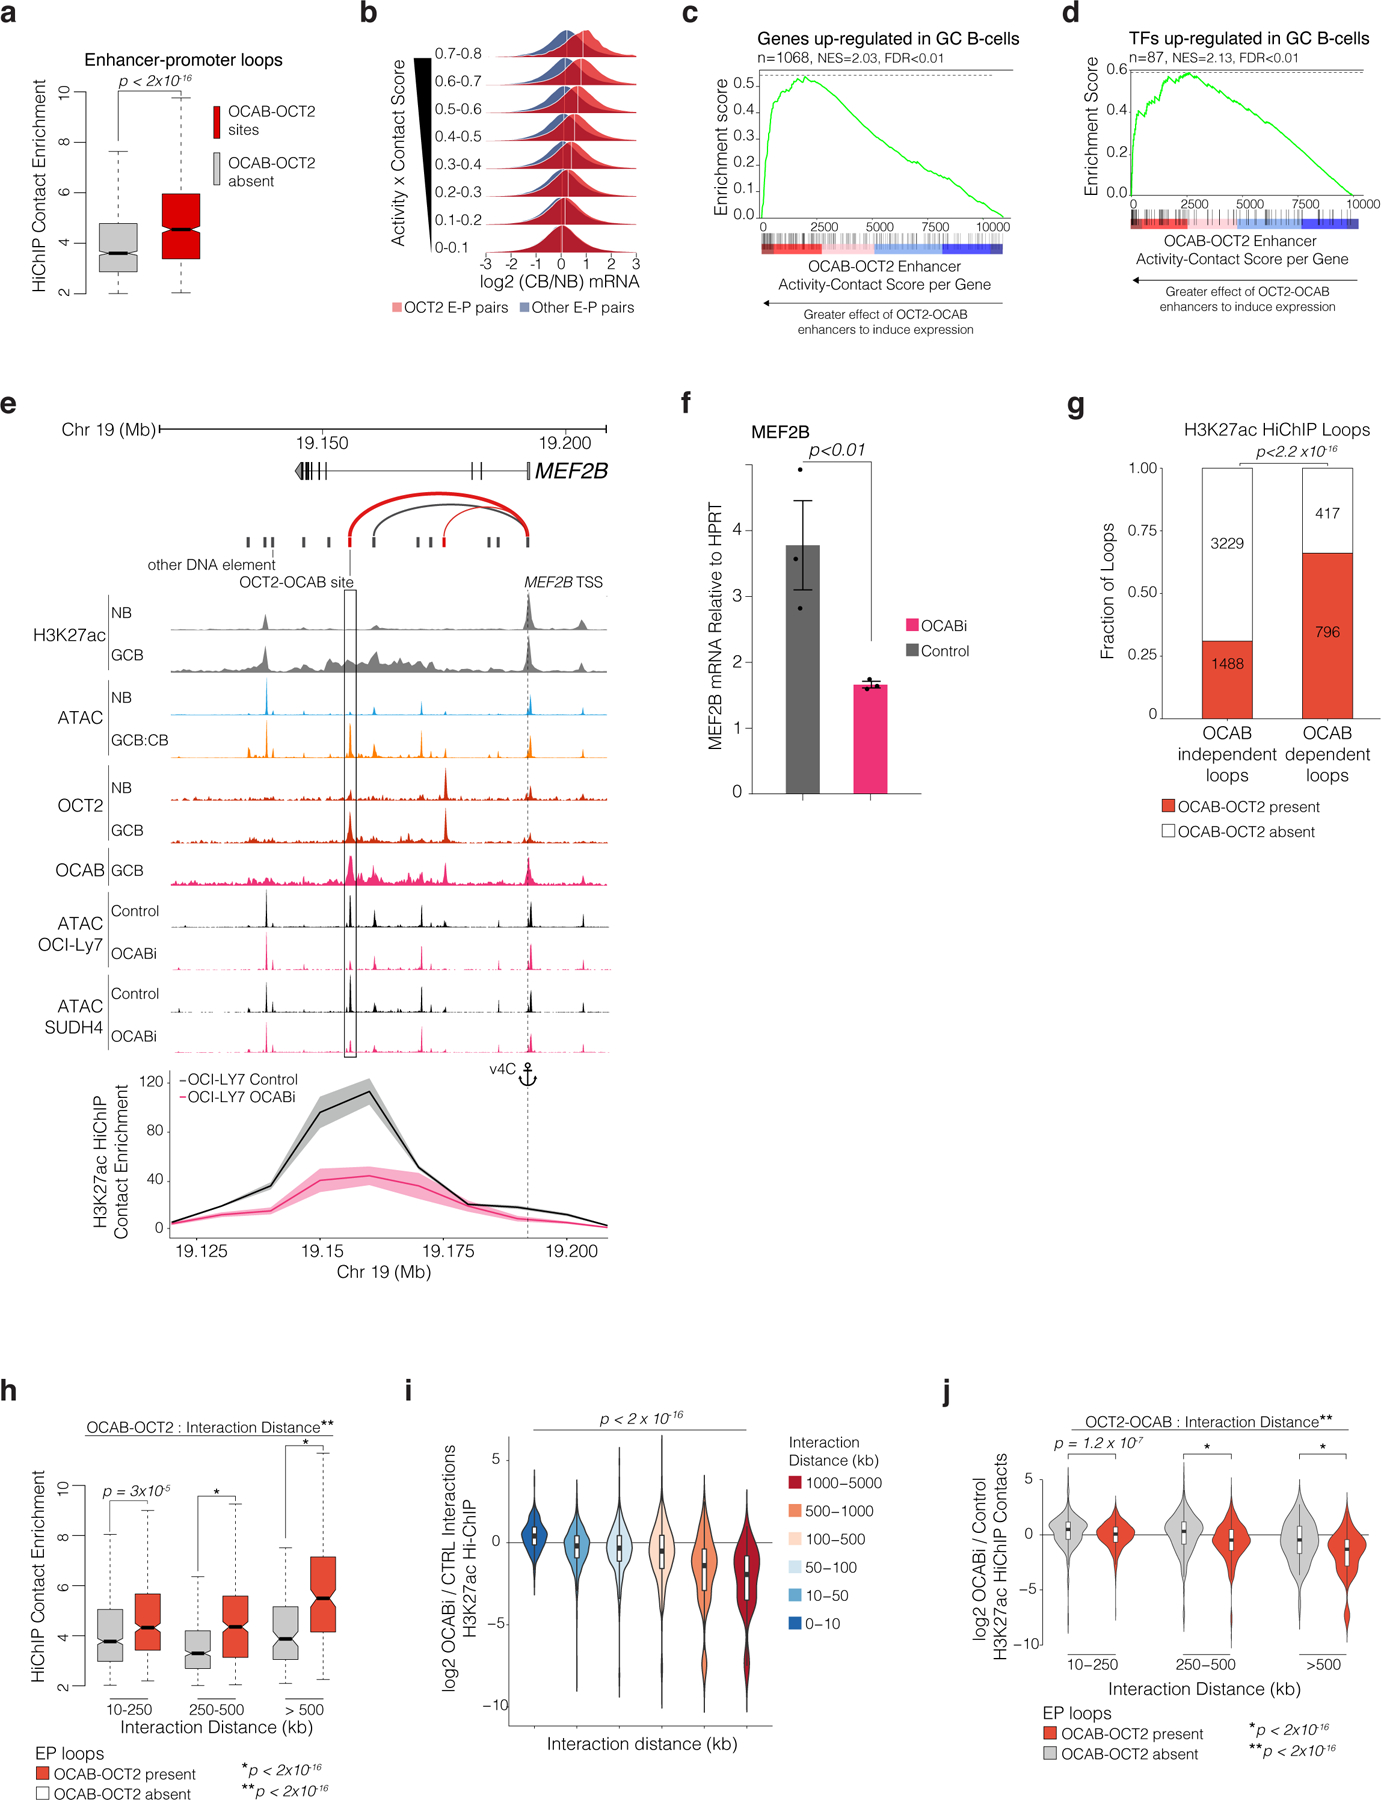
a, boxplot comparing H3K27ac HiChIP contact enrichment in OCI-Ly7 cells (n=3) for EP-loops with/without OCT2-OCAB. P values calculated by Mann-Whitney U-test. b, density plots of posterior predictive distributions of gene expression log2 fold-change in GCBs vs NBs by aggregate enhancer activity-contact score for enhancers with/without OCT2-OCAB. White lines indicate mean log2 fold-change. c-d, GSEA using genes ranked by aggregate per-gene enhancer activity-contact score, with/without OCT2-OCAB and showing enrichment for genes/TFs up-regulated in GCBs (FDR<0.01, log2 FC>1.5). e, UCSC genome browser tracks showing ATAC-seq elements with (red) and without (black) OCT2-OCAB. Arcs represent enhancer-gene pairs; line weight indicates activity-contact score; Lower panel: virtual 4C plot showing H3K27ac HiChIP contact enrichment between the MEF2B promoter (anchor) and surrounding 10kb regions for OCABi (n=2) and Control (n=3) OCI-LY7 cells. Shaded area represents 95% CIs. f, Bar plot showing mean MEF2B expression versus HPRT by qPCR in OCABi (n=3) and Control (n=3) OCI-LY7 cells from 3 independent experiments. P values calculated using student’s t-test. g, bar plot showing fraction of OCT2-OCAB-anchored loops among loops with unchanged (OCAB-independent) or significantly decreased (OCAB-dependent) H3K27ac contact enrichment in OCABi (n=2) versus Control OCI-Ly7 (n=3) cells. P value calculated by Fisher’s exact test. h, box plots comparing HiChIP contact enrichment for loops with (n=1,717) or without (n=4,222) OCT2-OCAB anchor, by interaction distance. *P value by type III ANOVA F-test, **P value for OCT2-OCAB/distance interaction by likelihood ratio test. i, violin and box plots comparing log2 fold-change in H3K27ac HiChIP contact enrichment between OCABi and Control OCI-Ly7 cells at increasing distances between loop anchors. P value by Spearman rank correlation test. j, violin plots showing H3K27ac HiChIP log2 fold-changes in OCABi versus Control for loops with indicated distance between anchor mid-points, with/without OCT2-OCAB. *P value by ANOVA F-test **P value for OCT2-OCAB/distance statistical interaction by likelihood ratio test. Violin plots include minimum/maximum values. Box plots show center line as median, box limits as upper/lower quartiles, whiskers as minimum/maximum values within 1.5x inter-quartile range of 1st and 3rd quartile, and notches as approximate 95% CIs.
An integrated enhancer activity score33 based on H3K27ac ChIP-seq, Hi-ChIP and ATACs revealed a stronger association between active enhancer-promoter loops containing OCT2-OCAB sites to induce upregulation of genes in GCBs relative to NBs, compared to enhancers that lacked OCT2-OCAB sites (Fig. 6b). This effect was not observed for other key GCB TFs, such as PU.134, FOXO135, and MEF2B34 (extended data Fig. 8b). Furthermore, we found significant enrichment for genes and TFs upregulated in GCBs vs NBs when ranking genes by OCT2-OCAB activity-contact scores (FDR<0.01, Fig. 6c-d). An example of OCT2-OCAB EP contacts is shown at the MEF2B locus (Fig. 6e), where the most distal OCT2-OCAB enhancer was sensitive to OCAB depletion and showed gain in accessibility in GCBs vs NBs (Fig. 6e). Loss of OCAB in OCI-Ly7 cells also led to a significant reduction in enhancer looping between this distal OCT2-OCAB sites and the MEF2B promoter (FDR<0.01, Fig. 6e). Indeed, MEF2B expression was significantly decreased by OCAB depletion (FDR<0.01, Fig. 6f). Hence OCT2-OCAB complexes preferentially localize to GC-specific enhancers that experience robust changes in enhancer looping to promoters that drive differential expression of GC-specific genes.
GCB long-range enhancer-promoter interactions require OCAB
To determine whether OCAB was required for connectivity of GC-specific enhancers we performed H3K27ac HiChIP in OCI-LY7 cells after OCAB CRISPRi. We found significant reduction in contacts for 1,213 H3K27ac loops in OCAB knockdown vs controls (extended data Fig. 8c). OCT2-OCAB sites were present in 61.9% of OCAB-sensitive contacts, compared to 31% of loops that were not sensitive to OCAB depletion (Fig. 6g). Moreover OCT2-OCAB loops experienced significantly greater loss of contact enrichment than other loops (P = 2.8×10⁻¹⁵), the magnitude of which increased with number of OCT2-OCAB sites present in loop anchors (p = 2.7×10⁻¹⁶). Thus, enhancer loops containing OCT2-OCAB sites at their anchor points were preferentially sensitive to decrease in OCAB.
Strikingly, among EP loops, OCT2-OCAB binding sites were most significantly differentially enriched at intermediate (250 – 500kb) and long range (>500kb) EP contacts (1.57 and 2.1 increased, p<2.2×10⁻¹⁶ Fig. 6h). Accordingly, among H3K27ac contacts, greater interaction distances were significantly associated with OCAB dependency (p< 2×10⁻¹⁶, Fig. 6i). This effect was specific to EP loops anchored by OCT2-OCAB as compared to enhancers that lacked an OCT2-OCAB complex (p< 2×10⁻¹⁶, Fig. 6j). Moreover, the difference in OCAB dependency of interactions for enhancers with OCT2-OCAB compared to enhancers without OCT2-OCAB sites was associated with greater interaction distance (p< 2×10⁻¹⁶, Fig. 6j). Thus, OCAB is required for GC-specific enhancers to interact with promoters of GC upregulated genes via intermediate and long-range looping.
GC super-enhancers are seeded by OCT2 in NBs and require OCAB
Expression of GC master regulatory factors such as BCL6 is driven by GC specific super-enhancers (SE)5, and as noted earlier is associated with OCT2 prepositioned binding sites that gain clusters of de novo OCT2-OCAB sites in GCBs. We wondered whether this mechanism may explain how specific pre-designated sites in the genome become SEs in GCBs. Along these lines, clustered GC de novo OCT2 binding sites featured significantly higher abundance of H3K27ac as compared to GCB newly accessible sites that were not clustered (p<2×10⁻²² Fig. 7a). Indeed, clusters most significantly enriched for GC de novo accessibility (n=44 clusters, p<0.001) were near GCB induced genes (FDR<1×10⁻¹⁶), including critical TFs such as BCL6, ID2, and EBF1 (p<0.01, Fig. 7b)7. These clusters were significantly enriched for OCT2-OCAB sites (p<2×10⁻¹⁶) and OCT2-OCAB binding was significantly associated with greater spatial clustering (p<2×10⁻¹⁶, extended data Fig. 9a) and H3K27ac gain (p<2×10⁻¹⁶, extended data Fig. 9b), as compared to distal sites not bound by OCT2-OCAB. One such cluster localized to the SE near the BCL6 gene (extended data Fig. 9c)5.
Figure 7. GC specific super-enhancers are seeded by OCT2 in NBs and require OCAB to interact with promoters of GC master regulator genes.
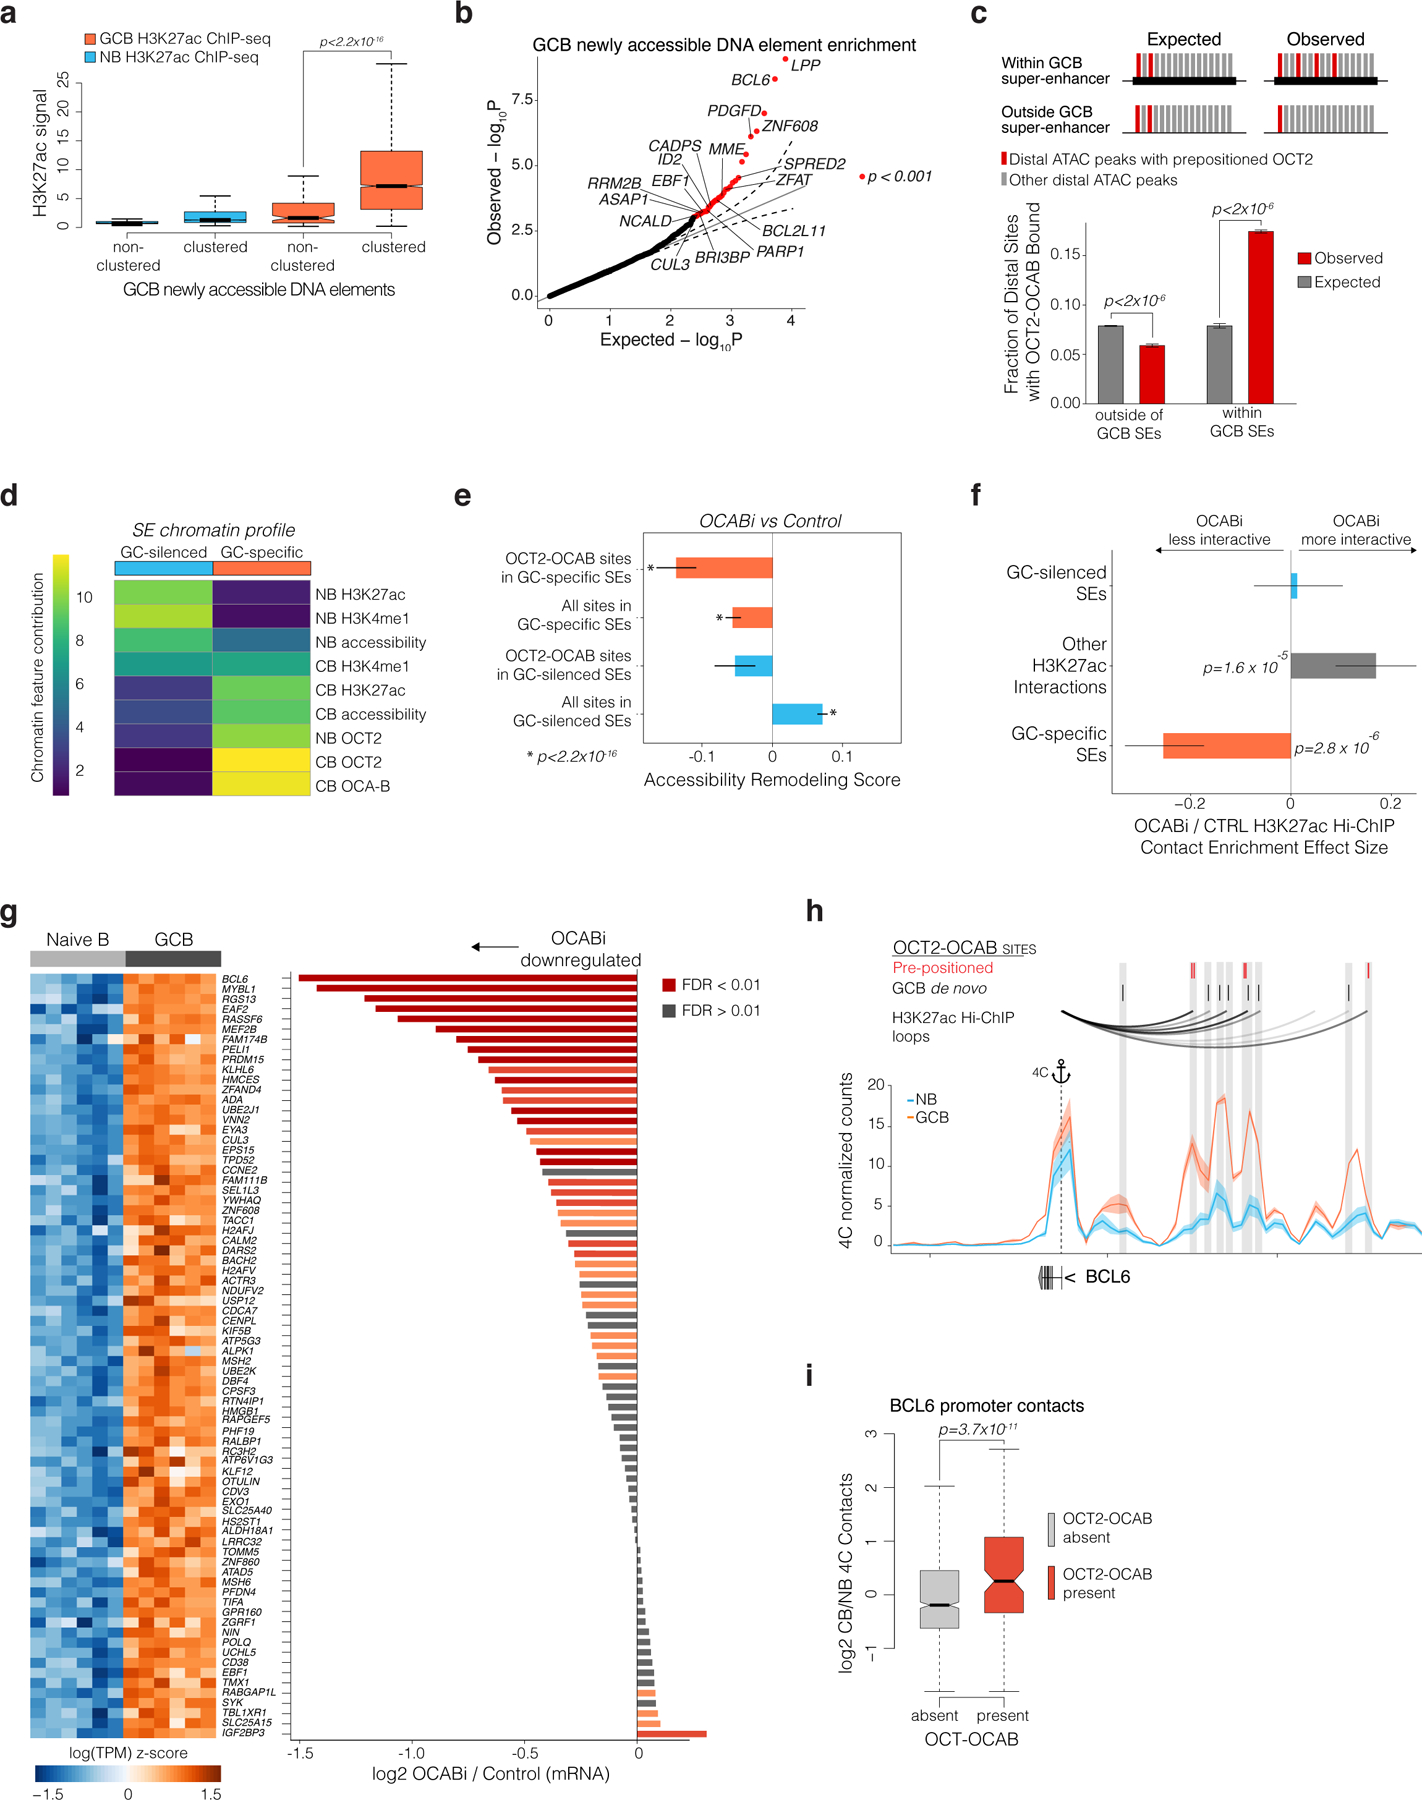
a, boxplot of H3K27ac ChIP-seq enrichment/input for clustered/non-clustered GCB newly accessible sites. P values are calculated by Mann-Whitney U test. b, quantile-quantile plot of observed/expected P values (gamma-poisson regression) for density of GCB newly accessible sites in 500kb windows around gene TSS. Red indicates FDR < 0.01. c, illustration of analysis and bar plot comparing observed/expected fractions of sites within/outside of GCB super-enhancers that contain a pre-positioned OCT2 site. P values are calculated by permutation test and error bars show 95% CI of the mean. d, heatmap of non-negative matrix factorization mixture coefficients distinguishing super-enhancer class. e, bar plot showing OCABi (n=4 OCI-Ly7, n=2 SUDHL4) vs Control (n=3 OCI-Ly7, n=2 SUDHL4) accessibility remodeling scores for OCT2-OCAB sites or all sites in GC-specific/GC-silenced SEs. P values are calculated by F-test and error bars show 95% CIs of the mean. f, bar plot showing OCABi (n=2) vs Control (n=3) HiChIP contact effect estimates for EP-loops anchored by GC-specific/GC-silenced SEs, or outside of SEs. P values are calculated by F-test and error bars show 95% CIs of the mean. g, heatmap of mRNA abundance in NBs/GCBs for GC-specific SE target genes. Right: bar plot showing gene expression log2 fold change in OCABi (OCI-Ly7 n = 4, SUDHL4 n=2) vs control (OCI-Ly7 n=3, SUDHL4 n=2). Genes shown are GCB/NB differentially expressed genes with GSEA leading edge enrichment for OCABi/control log2 fold changes. h, arcs showing HiChIP loops in OCI-Ly7 cells (top), and 4C-seq contacts between the BCL6 promoter (anchor) and the BCL6 SE in NBs/GCBs (n=3). Shaded area represents 95% CI of the mean. i, box plot of GCB/NB (n=2) differential 4C contacts between the BCL6 promoter and interaction domains44 with/without an OCT2-OCAB site. P values are calculated by Welch’s t test. Box plots show center line as median, box limits as upper/lower quartiles, whiskers as minimum/maximum values within 1.5x inter-quartile range of 1st and 3rd quartile, and notches as approximate 95% CIs.
Mapping SEs in GCBs and NBs (extended data Fig. 9d-e) by H3K27ac ChIP-seq revealed gain of 494 de novo SEs in GCBs, as well as loss of 501 NB SEs (extended data Fig. 9d). Strikingly, we observed >2-fold enrichment in the observed vs expected fraction of OCT2 pre-positioned sites within GC SEs (p<10−6, Fig. 7c), which in contrast were depleted outside of GC SEs (p<10−6, Fig. 7c). Thus, pre-positioned OCT2 sites may “seed” latent GC-specific SEs in NBs that become active in GCBs upon induction of OCAB. Accordingly, we confirmed that GC-specific SEs are already enriched for OCT2 binding in NB cells, even though they first become accessible and marked by H3K4me1 and H3K27ac in GCBs (Fig. 7d, extended data Fig. 9c). Thus, pre-positioned OCT2 sites and strong OCAB enrichment are characteristic features of de novo SEs in GCBs.
Indeed, OCAB depletion led to significantly decreased accessibility of DNA elements in GC-specific SEs, especially those containing OCT2-OCAB sites (Fig. 7e). OCAB knockdown also led to increased accessibility of NB-specific SEs that are normally repressed in GCBs (p<2×10⁻¹⁶). There was no OCT2 or OCAB binding to these NB-cell SEs, suggesting that these were indirect effects. Importantly, GC-specific SEs formed longer-range EP loops than GC-silenced SEs or typical enhancers (extended data Fig. 9f). OCAB depletion led to GC-specific SEs becoming less interactive (Fig. 7f, and extended data Fig. 9g-h), while interactivity of GC-silenced SEs was not significantly affected, suggesting a critical role for OCAB in nucleating formation and activation of GC-specific SEs.
Ranking GC-specific SEs by change in interactivity following OCAB depletion identified the BCL6 SE as the most affected (extended data Fig. 9i). Overall, genes with promoters contacting GC-specific SEs were significantly downregulated after OCAB depletion (Fig. 7h, extended data Fig. 9j). The BCL6 SE was i) the most differentially loaded for H3K27Ac in GCBs vs NBs; ii) the most heavily loaded for OCT2 in GCBs; and iii) overall the most interactive regulatory region in the GCB genome, with 13 EP loops between the BCL6 promoter and its SE (extended data Fig. 9k-m).
The BCL6 SE is exclusively present and active in GCBs5. Yet our data suggest that the BCL6 SE is already present as a latent regulatory region in NBs, thanks to at least three OCT2 pre-positioned binding sites (Fig. 7h). The BCL6 SE then becomes functional in GCBs due to subsequent upregulation and binding of OCAB to these OCT2 prepositioned sites. In turn this may facilitate further GC de novo clustered binding of OCT2 and OCAB and enable long range interactions with the BCL6 TSS. Indeed comparing the architecture of the BCL6 locus in GCBs vs NBs by 4C5 underlined the significant gains in connectivity between BCL6 SE and promoter occurring around OCT2-OCAB binding sites (Fig. 7h), compared to accessible SE DNA elements that lack OCT2-OCAB binding (Fig. 7i). To further test the functional relevance of pre-positioned OCT2 binding sites, we performed CRISPR-i targeting the OCT2-E1 pre-positioned site within the BCL6 SE (Fig. 8A), which manifests the most significant gain of 3D looping to the BCL6 TSS in GCBs relative to NBs (extended data Fig. 10a). OCT2-E1 CRISPR-i yielded significant reduction in BCL6 expression, similar to the effect of OCAB or OCT2 knockdown (Fig. 8b). OCT2-E1 CRISPRi impeded OCAB recruitment, H3K27ac abundance, and interaction with the BCL6 TSS (Fig. 8c-f), similar to OCAB or OCT2 depletion (Fig. 8g). Thus, binding of an OCT2-OCAB complex to the prominent OCT2 pre-positioned site within the BCL6 SE is required for enhancer-promoter interaction and transcriptional upregulation of BCL6.
Figure 8. Binding of an OCT2-OCAB complex to the prominent OCT2 pre-positioning site within the BCL6 super enhancer is required for enhancer looping and transcriptional upregulation of BCL6.
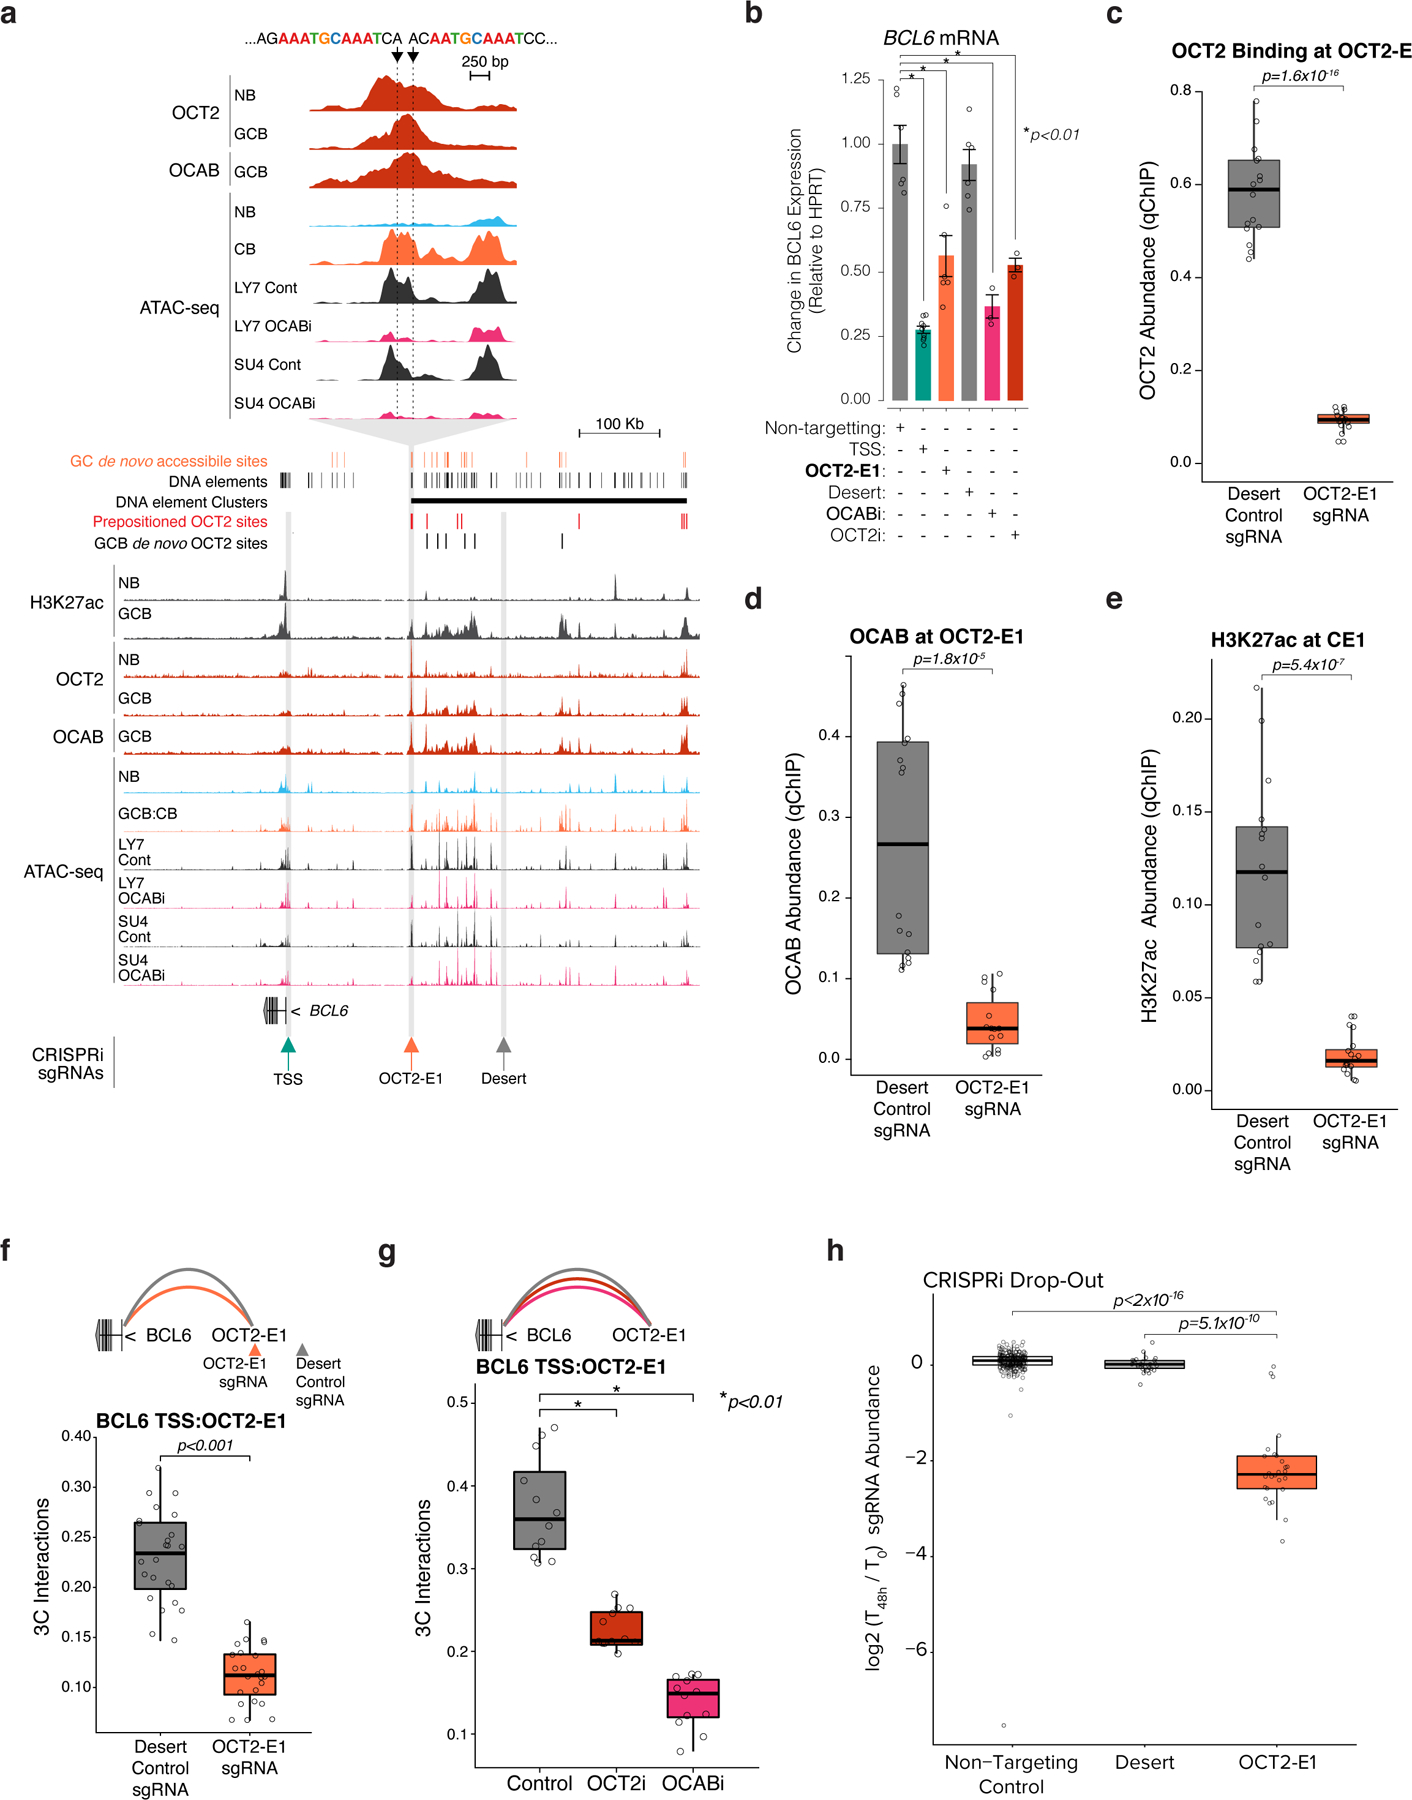
a, genome browser tracks showing GC newly accessible sites, all DNA elements identified in B cells, DNA element clusters, pre-positioned OCT2 sites, and GCB de novo OCT2 sites (top); H3k27ac, OCT2, and OCAB ChIP-seq and ATAC-seq. Arrows at BCL6 TSS (TSS), a predominant OCT2 pre-positioned site (OCT2-E1, inset), and a silent region (desert). b, BCL6 expression in GFP+ viable OCI-Ly7 CRISPRi cells transduced with control sgRNAs or sgRNAs targeting TSS, OCT2-E1, desert, OCAB TSS (OCABi), or OCT2 TSS (OCT2i). Expression levels from GFP+ viable cells from at least 3 independent experiments were measured by qPCR. Bar plot shows fold change relative to mean of control cells and data points show independent experiments. *indicates moderated t-test p<0.01. Error bars show SEM. c, box plots of OCT2, OCAB (d), and H3K27ac (e) abundance at OCT2-E1 by qChIP in OCI-Ly7 CRISPRi cells (n=4 independent experiments) with sgRNAs targeting desert or OCT2-E1 (n=4 sgRNAs). Box plots show center line as median, box limits as upper/lower quartiles, whiskers as minimum/maximum values within 1.5x inter-quartile range of 1st and 3rd quartile, and notches as approximate 95% CIs. P values are calculated by Mann-Whitney U test. f-g, box plots showing 3C contacts between OCT2-E1 and TSS for OCI-Ly7 CRISPRi cells after transduction with sgRNAs targeting desert, OCT2-E1, (n=4 sgRNAs), non-targeting control, OCABi, or OCT2i (n=3 sgRNAs). P values are calculated by Mann-Whitney U test. h, Box plots showing results of a CRISPRi drop-out screen45 for non-targeting control sgRNAs or sgRNAs targeting desert or OCT2-E1. sgRNAs were counted and the moderated log2 fold change was computed for each sgRNA using DESeq2. P values are calculated by Mann-Whitney U test.
Discussion
Our study defining the dynamic chromatin accessibility regulatory landscape of human B cells transiting the GC reaction indicates that OCT2 pre-programs the NB genome, enabling the later emergence of the canonical GC transcriptome and phenotype. This pre-programmed regulatory potential at OCT2 sites in NBs is rendered functional in GCBs by the formation and spatial expansion of OCT2-OCAB complexes to establish the chromatin architecture of GC-specific enhancers and super-enhancers and their regulation of GC-specific TFs and effector molecules. OCT2-OCAB complexes drive activation of GC-specific enhancers and induce expression of a network GC master regulators, including MEF2B, BCL6, and others. Indeed, BCL6 expression was dependent on OCAB through the binding of an OCAB-OCT2 complex at OCT2 pre-positioned sites within the BCL6 super-enhancer, and loss of OCAB led to significant de-repression of genes normally repressed by BCL6 in GCBs4,31.
B cells in GCs acquire a highly distinct enhancer repertoire featuring thousands of GC de novo enhancers, but the regulatory logic and chromatin dynamics enabling these changes has remained unclear. We show that the entire GC-specific enhancer repertoire does not occur entirely de novo, but rather is programmed into mature B cells by OCT2 binding to high affinity DNA motifs prior to the GC reaction. These NB pre-positioned OCT2 sites lack H3K4me1 and H3K27ac enhancer marks in NBs. Following BCR engagement and T-cell costimulation, it is believed that OCAB is upregulated by IRF4 in a subset of mature NBs following a transient burst in IRF4 expression13,36. Once expressed, OCAB binds OCT2 to enhance and modulate its DNA binding. Previous in vitro studies have demonstrated that the POUS and POUHD DNA binding domains enable OCT2 sampling of alternate, lower affinity binding sites, and that binding of these alternate sites requires OCAB25. Our results fully support this model. Indeed, we observe low OCT2 affinity sites near high-affinity pre-positioned OCT2 sites that define clusters of OCT2 binding at GC-specific super-enhancers. Our study also revealed the role of clustered OCT2 binding in enabling the enhancer looping activity of critical GC-specific super-enhancers, providing a final step in establishing the GC phenotype by inducing expression of GC master regulators including BCL6, MEF2B, and IRF8. OCAB may facilitate recruitment of chromatin remodelers or cofactors necessary for enhancer loop formation, such as the Mediator complex37. The precise mechanism by which OCT2-OCAB enable enhancer looping requires further study.
While known38, the precise mechanism through which OCT2/OCAB contribute to GC formation has remained unclear7. It was recently reported that OCT2 controls several pathways critical for normal B cell function15. Here, we show that OCT2-OCAB localize most specifically to GC-specific super-enhancers in GCBs. We found strong OCT2-OCAB enrichment at transient de novo accessible sites in GCBs that were decommissioned in PCs, as well as persistent de novo accessible sites that remained open in PCs. Resembling the function of pioneer TFs, OCT2 pre-programs epigenetic changes to enable cell state transition. However, while pioneer factors preferentially target full and partial binding motifs amid DNA sequences with high intrinsic nucleosome occupancy39, OCT2 preferentially binds near the mid-point between neighboring nucleosomes to high-affinity DNA motifs that apparently feature low intrinsic nucleosome occupancy40. A preference for binding DNA near the nucleosome entry-exit points was recently shown for the structurally similar TF OCT441. Similar to the requirement of OCT2 for OCA-B to mediate the GCB chromatin accessibility patterning, OCT4 requires the cofactor BRG1 to remodel chromatin and regulate the pluripotency network. Thus, cell-type specific interaction between a POU TF and a designated cofactor may represent a mechanism for establishing cell fate.
Altogether, we find that GC-specific de novo enhancer formation and transcriptional activation is pre-programmed into NBs and realized in GCBs by the cofactor OCAB. We propose a mechanism whereby lineage-restricted TFs bookmark potential cell fates that are elicited by cooperative binding of context-specific cofactors, giving rise to epigenetic reprogramming and cell-type-specific enhancer looping that enable profound transcriptional changes. We propose that similar mechanisms may exist in other cell types, particularly when major shifts in transcriptional programming are required.
METHODS
EXPERIMENTAL MODEL AND SUBJECT DETAILS
Isolation and ex vivo infection of mouse splenic B cells
The Research Animal Resource Center of the Weill Cornell Medical College approved all mouse procedures. For all mice experiments, mice were between 2 and 4 months old and harmonic representation of male and female was used. Mice were housed in air-filtered cages, 1 to 5 mice per cage, provided with standard rodent food, given free access to food and water, on a 12:12 light/dark cycle. Temperature was kept at 22°C (20–26°C) and humidity at 45% (40–60%).
Mouse splenocytes from C57BL/6J (https://www.jax.org/strain/000664) were enriched using the EasySep™ Mouse B Cell IsolationKit (Stem Cell Technologies #19854), and plated in RPMI 10% FBS + (100 U/mL Penicillin and 100 μg/mL Streptomycin) + 55mM 2-Mercaptoethanol. Cells were pre-incubated for 6 hours in the presence of 25 μg/mL lipopolysaccharide (LPS). Cells were spinfected with retrovirus pRetroX-IRES-ZsGreen1 (empty vector as control, Takara Bio Catalog No. 632520) or with pRetroX-mOcab-IRES-ZsGreen1 that expressed the mouse Pou2af1 gene in the presence of 8 μg/mL polybrene (Millipore TR-1003) at 800 rcf for 90 min at 24 °C. Cultures were collected and GFP+ viable cells were isolated by FACS on a BD Aria II sorter 3 days after infection, and RNA extracted using TRIzol (Invitrogen 15596026), as per the manufacturer’s instructions. Additional cells, collected 3 days after infection were further processed for ATAC-seq.
Isolation of human B cell populations by FACS
The Institutional Review Board at Weill Cornell Medical College approved all use of human tissue (IRB#0805009767). All individuals provided informed consent and no compensation n was provided to tissue donors. Primary cells were isolated from fresh deidentified human tonsillectomy specimen tonsillar lymph nodes by density gradient centrifugation and cryopreserved in 90% fetal bovine serum (FBS) with 10% DMSO. Cellular populations were sorted on a BD Influx cytometer. Prior to cell sorting, lymphocytes were resuspended in 90% Iscove’s Modified Dulbecco’s Medium (12330053, Thermo Fisher Scientific) with 10% FBS for 1 hour at 37°C. Lymphocytes were then labeled with anti-CD20 (0.01 dilution), anti-CD10 (0.05 dilution), anti-CD44 (0.025 dilution), anti-CD27 (0.03 dilution), anti-CD38 (0.03 dilution), anti-IgD (0.03 dilution), and anti-CXCR4 (0.1 dilution) conjugated flourochromes (Supplementary Table 1). DAPI was used to exclude non-viable cells. All antibodies used were commercially available and validated by the manufacturers and used according to the manufacturer’s instructions. When possible, positive and negative control populations were used for validation of the antibody.
Cell lines
Human DLBCL cell lines were cultured in medium containing 80% Iscove’s Modified Dulbecco’s Medium (12440053, Thermo Fisher Scientific) with 20% FBS (OCI-Ly7) or 90% RPMI-1640 (11875085, Thermo FisherScientific) with 10% FBS (SU-DHL-4), each supplemented with 1% glutamine, and 1% penicillin/streptomycin (15140122, Thermo Fisher Scientific). OCI-Ly7 were obtained from Ontario Cancer Institute in June 2011. SU-DHL-4 cells were obtained from ATCC (CRL-2957). HEK293T (CRL-3216, ATCC) cells were cultured in complete DMEM (11995040, Thermo Fisher Scientific) supplemented with 10 % FCS and 1% penicillin/streptomycin (15140122, Thermo Fisher Scientific).
METHOD DETAILS
ChIP and ChIP-seq library preparation
ChIP-seq was performed as described62 with the following modifications. 2 × 10⁷ cells were fixed in 1% formaldehyde for 10 min at room temperature, and fragmentation of fixed chromatin was obtained from isolated nuclei by sonication (Branson Sonifiers, Branson). To enrich for short chromatin fragments (200 – 700 bp), 5μg of antibody was added to the chromatin lysate and incubated overnight at 4 °C. The following day. Dynabeads protein A (10002D, Thermo Fisher Scientific) was added and incubated with rotation at 4 °C for 1.5 hours. Enriched DNA was isolated through extensive wash steps, subsequent reverse cross-linking, and purification using DNA Clean & Concentrator Kit (D4014, Zymo Research). ChIP-seq libraries were prepared from 2–5 ng ChIP DNA. After end-repair (End-ItTM End-Repair Kit, ER0720, Lucigen), A-tailing (3′→5′ exo- Klenow Fragment, M0212S, NEB), and ligation (Quick LigationTMKit, M2200S, NEB) with barcodes (NEXTflexChIP-Seq Barcodes, PerkinElmer #NOVA-514121), barcoded DNA was amplified by 12 cycles of PCR using Phusion® High-Fidelity DNA Polymerase (M0530S, NEB). Libraries were then sequenced on Illumina HiSeq 2500 as 50-bp single-end runs at the Genomics Resource Center at the Rockefeller University. Antibodies used were OCT2: sc-233, Santa Cruz; OCA-B: sc-955, Santa Cruz.
Histone ChIPs, including H3K4me1, H3K27ac and H3K27me3 in human NBs and GCBs and human cell lines were performed as described previously9. Human GC B-cell and naïve B-cell histone ChIP-seq raw sequence data generated by the Blueprint Consortium were downloaded from the European Genome-phenome Archive (EGA).
ATAC-seq
ATAC-seq profiles were collected for primary human lymphocytes and DLBCL cell lines. Populations of cells were isolated as above and ATAC-seq was performed as previously described according to the omni-ATAC-seq method. (Fifty thousand cells were resuspended in 1ml of ATAC-seq resuspension buffer (RSB; 10 mM Tris-HCl pH 7.4, 10 mM NaCl, and 3 mM MgCl2 in water) and centrifuged at 500 r.c.f. and 4°C for 5 min. Supernatant was aspirated by pipetting and cells were resuspended in 50ul of ATAC-seq RSB containing 0.1% NP40, 0.1% Tween-20, and 0.01% digitonin and incubated on ice for 3 min. Following lysis, 1 ml of ATAC-seq RSB containing 0.1% Tween-20 was added, and nuclei were centrifuged at 500 r.c.f. and 4°C for 10 minutes. Supernatant was then aspirated by pipetting and nuclei were resuspended in 50 μl of transposition mix (25 μl 2× TD buffer, 2.5 μl tagment DNA enzyme, 16.5 μl PBS, 0.5 μl 1% digitonin, 0.5 μl 10% Tween-20, and 5 μl water) and incubated at 37 °C for 30 min in a thermomixer with shaking at 1,000 r.p.m. Reactions were cleaned up with Zymo DNA Clean and Concentrator kit (cat# D5205). ATAC-seq DNA libraries were prepared as described previously, and library concentration was checked by qPCR using the KAPA Library Quantification Kit. DNA libraries were sequenced on a Hi-Seq 2000 (Illumina) or Hi-Seq 4000 (Illumina) at the Weill Cornell Epigenomics Core Facility.
RNA-seq and qPCR
Total RNA was extracted from >= 5×10⁵ cells using Trizol (LifeTechnologies) and RNeasy isolation kit (Qiagen) according to the manufacturer’s instructions. RNA concentration was determined using Qubit (LifeTechnologies) and integrity was verified using Agilent 2100 Bioanalyzer (Agilent Technologies). Paired-end sequencing libraries were prepared using the TruSeq Stranded mRNA sample kit (Illumina). Pair-end sequencing was performed on Illumina HiSeq2000 (paired-end 50bp reads), or Illumina HiSeq4000 (paired-end 75bp reads).
For qPCR, total RNA was reverse transcribed with oligo-dT primers using the Verso cDNA kit (Thermo Fisher Scientific) according to the manufacturer’s protocol. Real-time quantitative RT-PCR (qPCR) was performed using PerfeCTa SYBR Green FastMix Reaction Mixes on a QuantStudio 6 Flex PCR System. Expression was quantified relative to mean of control samples using the Δ/ΔCt method after normalization to HPRT.
Generation of CRISPRi Cell Lines
CRISPRi OCI-Ly7 and SU-DHL-4 cell lines were generated by lentiviral transduction of pHR-SFFV-dCas9-BFP-KRAB followed by flow sorting for BFP high populations. Cells were expanded and sorted again after 1–2 weeks, and this was repeated 2–3 times. pHR-SFFV-dCas9-BFP-KRAB (46911, Addgene) was a gift from Stanley Qi and Jonathan Weissman.
CRISPRi-mediated interference
Individual gRNA oligos were ordered from IDT and cloned into pLKO5.C+E.sgRNA.EFS.GFP for qPCR, ATAC-seq, RNA-seq, HiChIP, and drop-out experiments. gRNA sequences are listed in Supplementary Table 2. gRNA constructs were lentivirally transduced into OCI-Ly7 or SU-DHL-4 CRISPRi cell lines. GFP+ cells were isolated by FACS on a BD Influx cytometer using BD FACSDiva 9.0 software 2 days after transduction. For drop-out curves, cells were infected with GFP-tagged constructs at an infection rate of 20–50% and the fraction of GFP positive cells was monitored by FACS every 3–4 days using FlowJo version 9. The fraction of GFP positive cells was normalized to the fraction of GFP positive cells at day 3–4. Custom R code was used for analysis of FACS data and plotting of results.
Hi-ChIP
HiChIPs were performed as previously described using an H3K27ac antibody50. Post-ChIP DNA was quantified by Qubit (Thermo Fisher): 50ng and 17ng of total post-ChIP DNA was used for GC and NB samples respectively for library preparation. Following biotin pull-down the samples were tagmented with Tn5 (Illumina) as previously described50 and libraries were generated using 6 and 8 cycles of PCR amplifications for GC and NB samples respectively. After dual size selection with Ampure XP beads, libraries size was measured by BioAnalyzer. Libraries were sequenced on a HiSeq4000 platform on PE50 mode.
Immunoblotting
Lysates of DLBCL lymphoma cell lines and isolated cell populations were prepared using 25 mM Tris, pH 7.4, 150 mM NaCl, 0.5% NP-40, 0.1% SDS and complete protease inhibitor cocktail (Roche) lysis buffer. Protein lysates were resolved by SDS–PAGE, transferred to PVDF membrane and probed with primary antibodies to the following: BOB-1/OBF-1 (1:100, Cell Signaling Technology #33483S) and Oct2 (1:500, Thermo Scientific #RB-9297) and GAPDH (1:10000, Santa Cruz, sc-25778). Membranes were then incubated with corresponding HRP-conjugated secondary antibodies, and signal was detected using enhanced chemiluminescence (ChemiDoc Touch, Bio-Rad Laboratories).
Ex vivo infection of mouse B cells
Mouse splenocytes were enriched using the EasySep™ Mouse B Cell IsolationKit (Stem Cell Technologies #19854), and plated in RPMI 10% FBS + (100 U/mL Penicillin and 100 μg/mL Streptomycin) + 55mM 2-Mercaptoethanol. Cells were pre-incubated for 6 hours in the presence of 25 μg/mL lipopolysaccharide (LPS). Cells were spinfected with retrovirus pRetroX-IRES-ZsGreen1 (empty vector as control, Takara Bio Catalog No. 632520) or with pRetroX-mOcab-IRES-ZsGreen1 that expressed the mouse Pou2af1 gene in the presence of 8 μg/mL polybrene (Millipore TR-1003) at 800 rcf for 90 min at 24 °C. Cultures were collected at different time points after infection, and RNA extracted using TRIzol (Invitrogen 15596026), as per the manufacturer’s instructions. Additional cells, collected 3 days after infection were further processed for ATAC-seq.
QUANTIFICATION AND STATISTICAL ANALYSIS
ATAC-seq alignment, filtering, and peak calling
Paired-end ATAC-seq reads were trimmed to remove adapter sequences using NGmerge with the options “-z -u 41 -a”51. Trimmed read pairs were aligned to version 38 of the human reference genome (hg38) using bowtie2 with the following options: “-X2000 --local --mm -k 4“. Aligned reads were sorted and filtered to exclude reads mapping to mitochondrial DNA and black-listed regions, and duplicate read pairs were removed using the “MarkDuplicates” program in picard tools (http://broadinstitute.github.io/picard). This resulted in the final aligned, sorted, and filtered BAM file that was used for all subsequent analysis. The ATAC-seq processing and alignment pipeline is available at https://github.com/DoaneAS/atacflow. ATAC-seq library quality was assessed from the aligned and filtered libraries by computing the fraction of reads in peaks (FRIP-score) using a set of universal DHS regions provided by ENCODE (https://storage.googleapis.com/encode-pipeline-genome-data/hg38/ataqc/reg2map_honeybadger2_dnase_all_p10_ucsc.hg19_to_hg38.bed.gz). ATAC-seq samples with FRIP-score >= 0.3 were retained for analysis. In addition to standard quality metrics, we assessed TSS enrichment, TSS chromatin accessibility and TSS nucleosome positioning (see Nucleosome mapping below) using ATAC-seq data and confirmed the expected correlations with transcript abundance (Extended data Fig. 1B-E). ATAC-seq peaks were called from Tn-5 corrected insertions using MACS2 callpeak with option “-g hs --nomodel -- shift −75 --extsize 150 --keep-dup all --call-summits”.
ChIP-seq Alignment and Peak Calling
ChIP-seq libraries were aligned to GRCh38 v24 “no-alt” or mm10 reference genomes for human and mouse samples, respectively, and filtered for quality and PCR duplicates according to Encode 3 uniform processing pipeline52, available at https://github.com/ENCODE-DCC/chip-seq-pipeline2. ChIP-seq library quality was measured using the Non-Redundant Fraction (NRF) and PCR Bottlenecking Coefficients 1 (PBC1) and 2 (PBC2), as defined previously52. Libraries with NRF>0.9, PBC1>0.9, and PBC2>10 were retained for analysis. MACS 2.0 was used for ChIP-seq peak calling and for generating fold change over control signal tracks according to Encode 3 uniform processing guidelines52. Alignment and peak calling were performed for MINT-ChIP libraries53 as described previously53.
B-cell chromatin accessibility peak atlas
Reproducibility of ATAC-seq called peaks was defined using a 1% Irreproducibility Discovery Rate (IDR) as described. A B cell chromatin accessibility atlas containing 500 bp disjoint genomic intervals (DNA elements) was constructed from called peak summits that were reproducible across biological replicates using an iterative peak-ranking method as previously described49. To quantify accessibility across samples, the number of single-base Tn5-corrected insertions that fell within each 500 bp interval was counted from ATAC-seq bam files using the command “pyatac counts” in the nucleoATAC package42.
Differential accessibility between conditions was computed using DESeq2. Normalization factors included in the call to DESeq2 were computed by quantile normalization with GC sequence content bias correction using the R package EDASeq. The chromatin accessibility log2 fold changes reported and used in all analysis were computed and shrunken using the “lfcShrink” function with option “type=ape” in the DESeq2 R package. Differentially accessible DNA elements were identified at FDR<0.01 unless noted otherwise. For clustering of ATAC-seq data, a normalized counts matrix was computed using the varianceStabilizingTransformation function in DESeq2 after inclusion of the above normalization factors. Sample dendrograms were produced using pearson correlation with average-linkage hierarchical clustering. The Adjusted Rand Index (ARI) was used to compare the grouping of samples obtained from unsupervised clustering to known sample cell types. To compare the ARI for distal and promoter sites, 1000 sites were sampled without replacement from all distal or all promoter sites and the ARI was computed from the resulting clustering result. This procedure was repeated for 500 iterations, and the resulting ARIs for distal and clustered sites were compared by t-test.
All gene-based annotation was performed using Gencode Release 32 (GRCh38.p13, https://www.gencodegenes.org/human/release_32.html). DNA elements were assigned to genes according to the nearest TSS of a protein coding gene with mean expression >=1 TPM in any one cell type, unless noted otherwise. DNA elements were classified as distal elements unless they were located within 2.5kb of a gene promoter.
To assess ChIP-seq abundance for each ATAC-seq DNA element, mean fold enrichment over input was computed over 1kb or 500bp regions centered on ATAC-seq peak summits, for histone ChIP-seq or TF ChIP-seq, respectively. Super-enhancers were mapped from ChIP-seq target and input bam files using ROSE with default parameters.
Nucleosome mapping
Nucleosome position and occupancy in genomic regions within 1 kilobase of accessible chromatin were determined using the nucleoATAC python package42. ATAC-seq bam files were pooled by cell type, and peaks were called using MACS2 “callpeak” with options “-g hs --nomodel --shift −75 --extsize 150 --keep-dup all –broad-cutoff 0.1”. The resulting peaks were expanded by 500bp in the 5’ and 3’ directions using bedtools and the resulting bed file was used as the input ranges in the call to nucleoATAC. The “nucmap_combined.bed.gz” output from nucleoATAC was used to define nucleosome positions for subsequent analysis.
DNA motif analysis and TF footprinting
De novo motif discovery was performed using ChIP-seq peak summits or ATAC-seq peak summits as input to HOMER findMotifsGenome.pl with the following options: -bits -size 150 -len 8,10,12,14 -mis 3 -mask. Divergence between similar motifs was computed using the R package motifDiverge54. Known motifs were mapped to DNA elements using the R package motifMatchR55.
To estimate patterns of accessibility associated with TF binding, and considering the potential TF protection of DNA from TN5 transposition as well as the sequence bias of TN5, pooled replicate ATAC-seq bam files were analyzed using HINT with default options for ATAC-seq data56 and using the B-cell peaks atlas genomic coordinates.
Accessibility Remodeling regression models
Known transcription factor motifs were identified in genomic DNA sequences using the R package motifMatchR version 1.8.0 (https://bioconductor.org/packages/release/bioc/html/motifmatchr.html) with the options “p.cutoff=1e-6”. A filtered and curated collection of human transcription factor motifs were obtained from chromVARmotifs (“human_pwms_v2”, https://github.com/GreenleafLab/chromVARmotifs)55. AP-1-IRF (AICE) and ETS-IRF (EICE) composite motifs were obtained from Homer collection (“homer_pwms”, https://github.com/GreenleafLab/chromVARmotifs) bZIP:IRF and PU.1-IRF(ETS:IRF), respectively. Transcription factors were filtered to include those with transcript abundance > 1 TPM in at least one B-cell type (see RNA-seq methods).
To calculate change in accessibility remodeling, we first performed a linear regression of the shrunken log2 fold change on each TF motif independently, resulting in 1 regression model for each of 221 expressed TFs. Hypothesis testing of estimated coefficients was performed by Wald-test with a heteroskedasticity-consistent robust covariance estimator, using the “sandwhich” package in R. TF coefficient estimate P values were corrected for multiple-hypothesis testing and significant TFs (FDR q-value<1e-5) were retained for Bayesian multiple regression.
Because the transcriptional networks that drive cellular reprogramming are most often due to a small number of cell type-specific master regulators57,58, the activity of most expressed TFs are expected to have a modest impact on cell-type specific changes in accessibility. We incorporated this information by setting a horseshoe prior on the covariates (TFs) in a Bayesian multiple regression of change in accessibility on the TFs identified by linear regression above. Bayesian multivariate regression with NUTS MCMC sampler was performed in R using the BRM package and RSTAN.
Spatial clustering of peaks
Peak clusters were defined using community detection on a weighted graph of site-site distances bounded at 50kb. The edge weight w between peaks i and j was defined as , where Di,j is the distance in base pairs between the center of peaki and peakj. Peak clusters were identified using the the infoMAP community detection algorithm in the R package iGraph, and intra-community edges were used to generate a graph of peak clusters for further analysis. Peak “coreness” was computed using iGraph package in R. The k-core of graph is a maximal subgraph in which each vertex has at least degree k. The coreness of a vertex (peak) is k if it belongs to the k-core but not to the (k+1)-core.
Projection of cell line accessibility onto principle components of cell state transitions.
Principal components analysis (PCA) was performed on our B-cell normalized ATAC-seq profiles across differentially accessible elements between B-cell phenotypes. The accessibility profiles of control and OCABi OCI-Ly7 and SUDH4 cells were then projected onto the principal components defined from B cells. Differences in the loading of a PC between OCABi and control were tested for significance by two-sample t-test.
genralized low rank models and Non-negative matrix factorization
We computed the quantile-normalized ATAC-seq insertion density, as well as ChIP-seq enrichment for activating histone marks H3K4me1 and H3K27ac, and binding of OCT2 and OCA-B for each 500bp DNA element. For histone marks only, the 500bp region was expanded by 250bp in the forward and reverse direction to capture neighboring nucleosomes. A matrix was constructed containing ATAC-seq counts normalized by variance stabilized transformation and ChIP-seq fold enrichment/input, for each gene-distal DNA element overlapping a GC or NB called super-enhancer. This matrix was quantile normalized and matrix factorization was performed using the H2O package in R and specifying a Huber loss function, and non-negative regularization.
Identifying loci enriched for differentially accessible sites
FishHook59 (https://github.com/mskilab/fishHook) was used to model background chromatin accessibility and nominate differentially accessible regulatory hotspots during the transition from NB to GCB. A negative binomial generalized linear model was used to model genome-wide density of differentially accessible elements (DEs) across the intersection of an eligible territory (atlas of accessible sites in B cells) and set of hypothesis intervals (+/− 250KB of the TSS for genes expressed >= 1 TPM in at least one stage of B cell development) as a function of genomic covariates represented by the fractional overlap with all accessible sites in B cells and all reference genome TSS. The maximum likelihood fit of a fishHook model, implemented as a gamma-Poisson regression, assigns weights to covariates and an expected DE density to each hypothesis interval. An enrichment value is computed at each hypothesis interval as the ratio of observed to expected DE density. The model is further used to define a cumulative distribution function (CDF) for DE density at each interval. Each interval is then assigned a one-sided P value as the probability that the DE density is greater or equal to the observed density.
RNA-seq Analysis
Paired-end sequencing reads were aligned to human reference genome GRCh38 (hg38) without alternate alleles using STAR. RSeQC (http://rseqc.sourceforge.net) was used to verify library quality. Samples with at least 20 million uniquely mapping reads were retained for analysis, and the percent of mRNA bases per sample ranged from 70–83%.
To quantify transcript abundance, a decoy-aware transcriptome was generated from Gencode Release 32 transcriptome using Salmon version 1.1.046. Quantification was performed using the “salmon quant” command and options “-l A --validateMappings --numGibbsSamples 10 – gcBias”. Transcript-level quantification and bias corrections were summarized to the gene-level using the tximeta Bioconductor package, and differential expression analysis was performed using gene counts and average transcript lengths with DESeq2. For differential expression analysis of cell line CRISPRi studies, baseline differences between cell lines were accounted for by including a cell line covariate (OCI-Ly7 or SUDHL4) in the DESeq2 design.
HiChIP Analysis
H3K27ac HiChIP sequencing reads were trimmed for adapter sequences using ngTrim. Trimmed reads were aligned to hg38 and filtered to generate a file of paired end tags (PETS) using the HiC-Pro pipeline60. Loops were called using cLoops with default HiChIP parameters. The H3K27ac contact frequency for each loop was defined as the ratio of supporting paired-end tags (PETs) to the mean PETs of nearby permuted regions, as defined in cLoops61. To confirm H3K27ac contact enrichment for a set of loops and compare between control and OCABi OCI-Ly7 cells, we used APA with 5kb bin size. The peak to lower-left ratio (P2LL ratio) was computed using juicer apa with default parameters. Significance testing was performed by paired t-test with Holm-Bonferroni multiple-testing correction. Fold changes in OCABi / Control were computed for pairs of loop anchors using paired-end tag (PETs) raw counts as input to a GLM in the R package edge-R. Virtual 4C plots were generated from VC-SQRT corrected PETs, and library size normalization was applied across samples using quantile normalization.
To estimate the regulatory input of ATAC-seq DNA elements to a gene’s expression, ATAC-seq DNA elements, GC B-cell H3K27ac ChIP-seq, OCI-Ly7 H3K27ac HiChIP, and GC B-cell mRNA abundance was used to estimate an activity by contact model as described33. To estimate the regulatory contribution of OCT2-OCAB sites and non-OCT2-OCAB sites for a gene’s change in expression in GCB vs NB cells, the aggregate activity contact score for enhancers with OCT2-OCAB sites and for enhancers without OCT2-OCAB sites was calculated for each gene.
4C-seq Analysis
Published naïve and GC B-cell 4C-seq sequencing reads5 were obtained from SRA and aligned to hg38 as described44. Differential cis-contacts were computed using the 4C-ker package, and resulting normalized contacts and log2 fold changes were used for 4C plots.
Statistical analysis
All P values calculated from statistical tests with symmetrically distributed test statistics represent two-sided hypothesis testing. All statistical analysis was performed in R version 3.8 unless noted otherwise.
Extended Data
Extended data Figure 1.
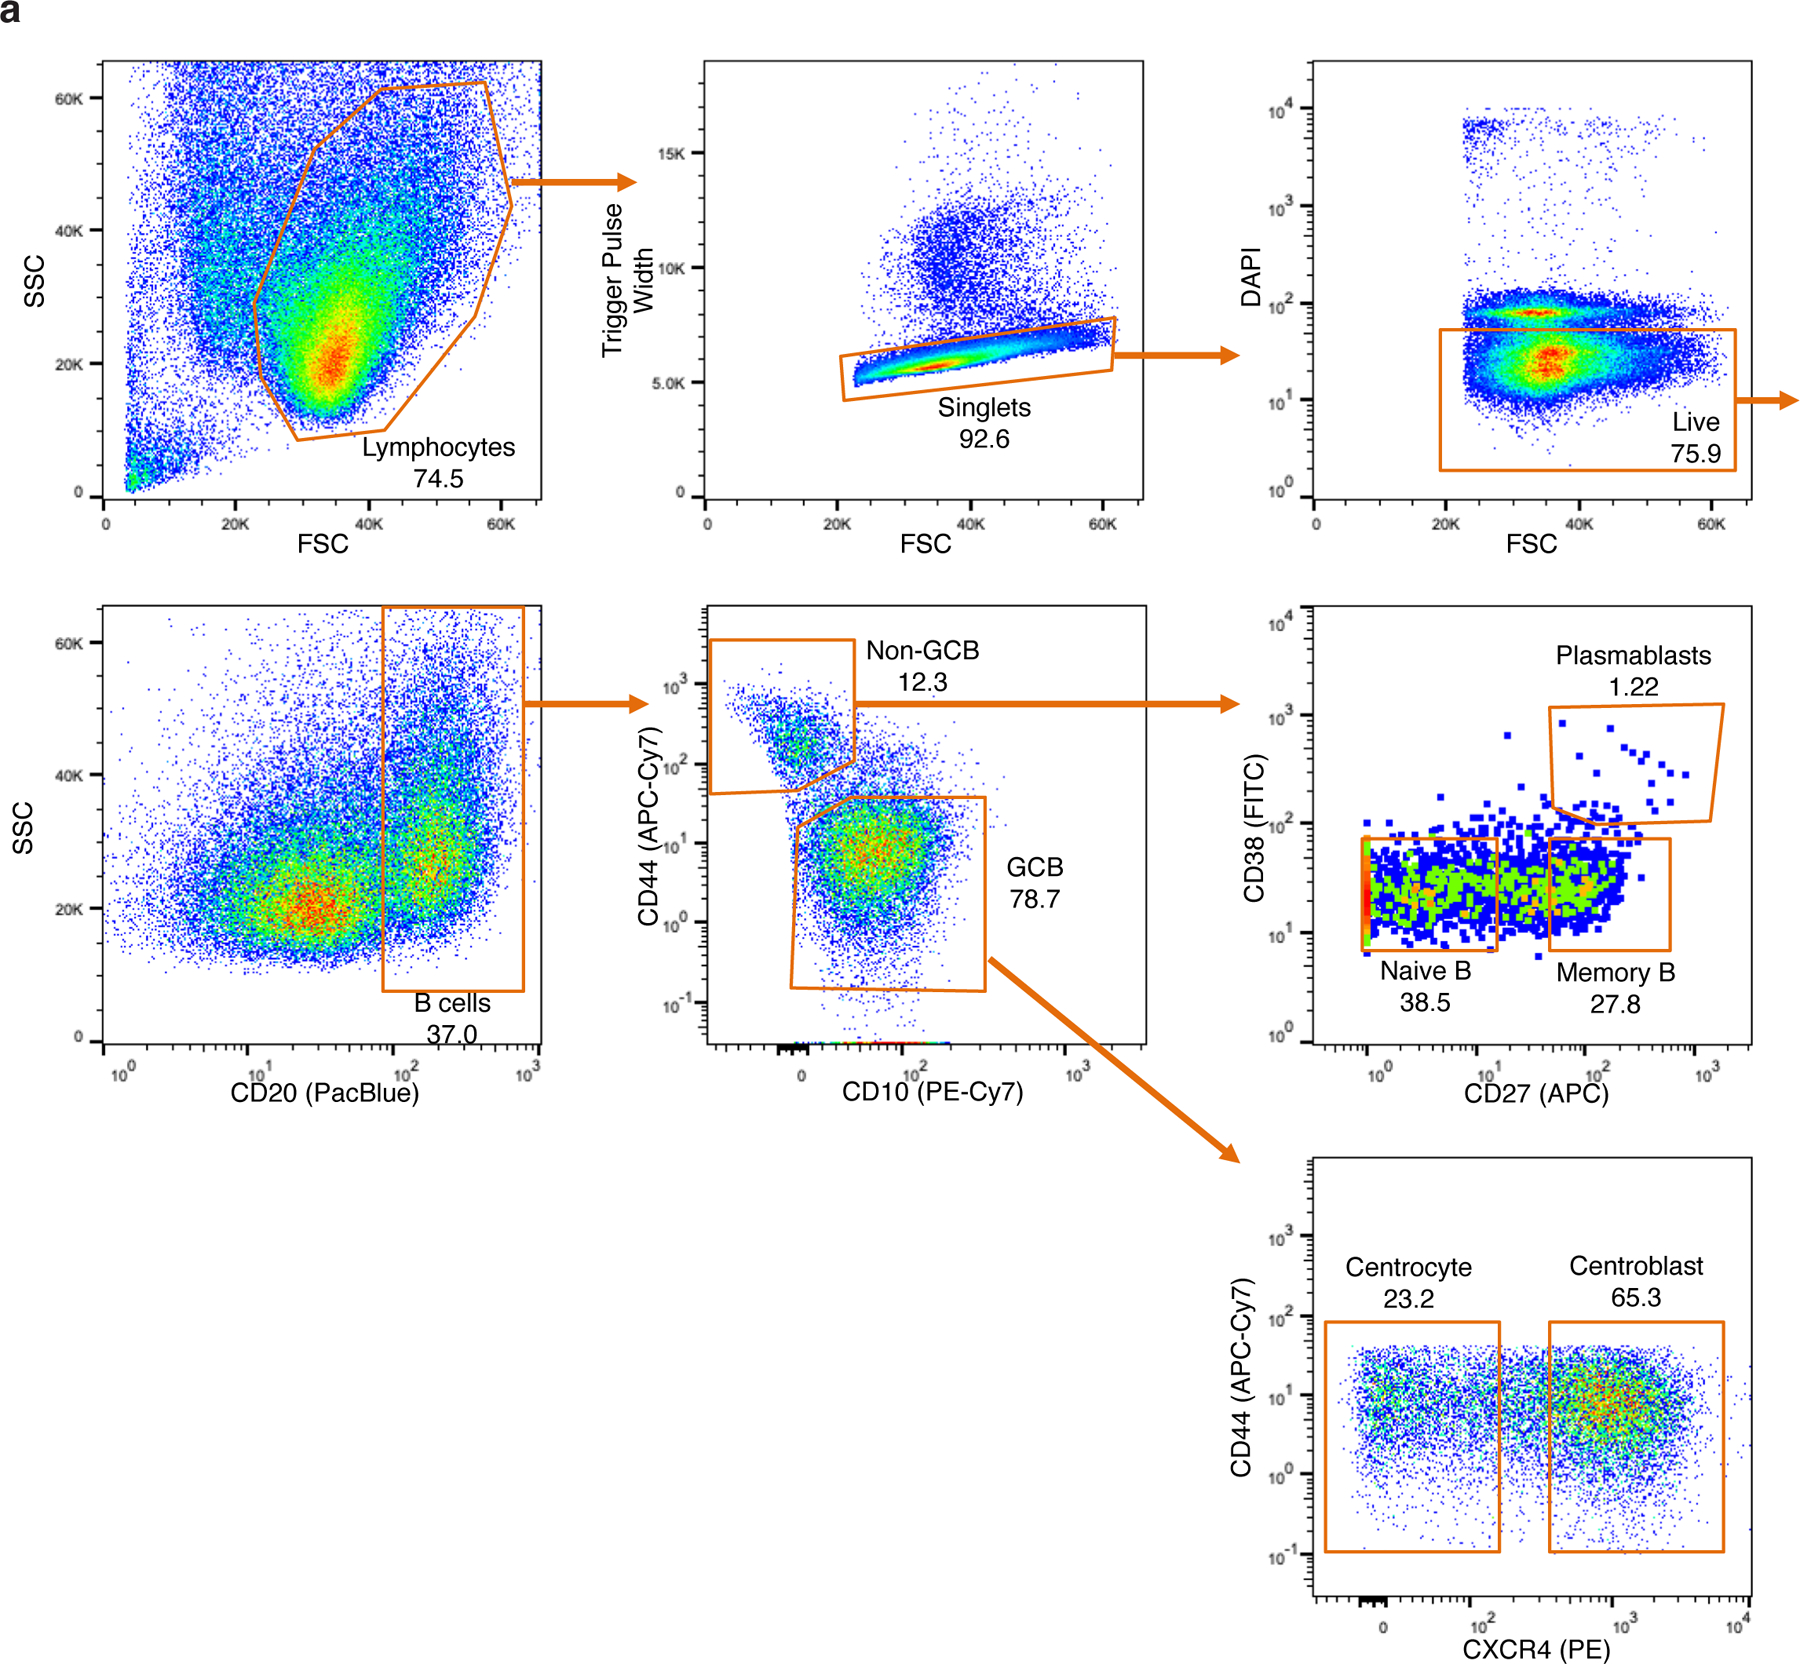
related to Figure 1. a, Gating strategy used for the isolation of naïve B cells (NB), memory B cells (MB), plasmablasts (PC), germinal center centroblasts (GCB), and germinal center centrocytes (CC) from human tonsillar lymphocytes using multiparameter fluorescence activated cell sorting (FACS). Lymphocytes were isolated from fresh human tonsils by density gradient centrifugation. Within 24 hours, cells were either sorted by FACS or cryopreserved for cell sorting on a later date (see Methods). Prior to sorting, lymphocytes were labeled with anti-CD20, anti-CD10, anti-CD44, anti-CD27, anti-CD38, and anti-CXCR4 conjugated flourochromes. DAPI was used to exclude non-viable cells. For isolation of NBs, centroblasts, and centrocytes only, anti-IgD was used in place of anti-CD38 and anti-CD27, and NBs were CD20+CD44+CD10-IgD+. Details of antibodies used for cell sorting are listed in Extended data Table 1. SSC: side scatter, FSC: forward scatter.
Extended data Figure 2.
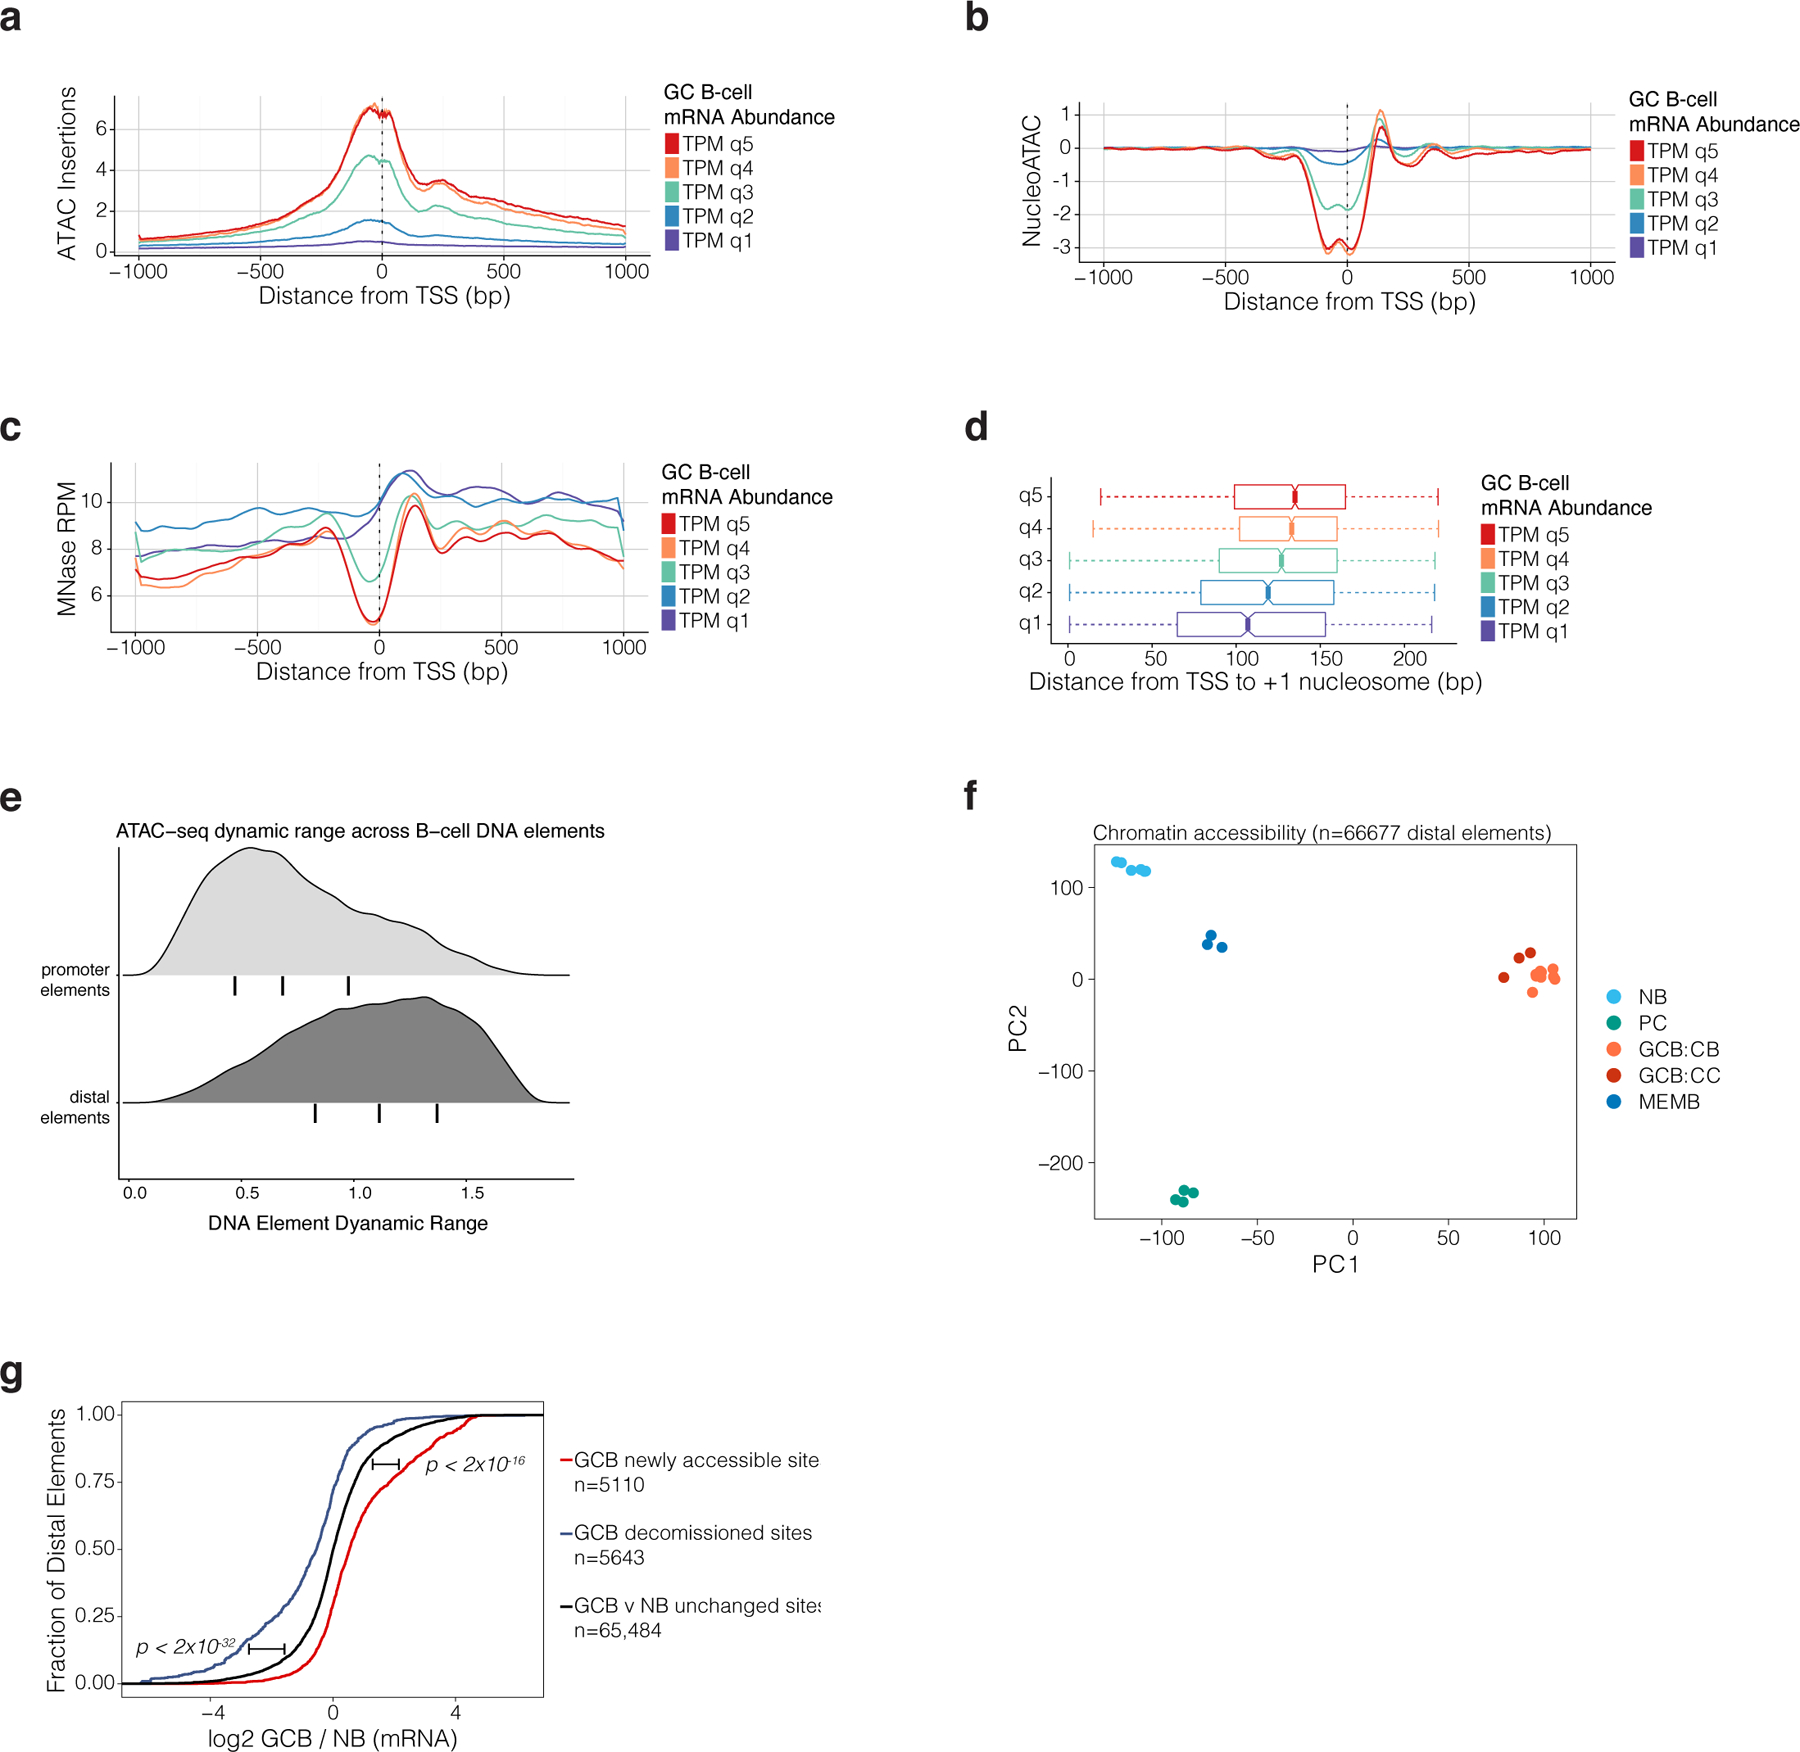
related to Figure 1. a, ATAC-seq insertion profiles in GCBs for 2kb regions centered on gene transcription start sites. Mean profile is shown for genes by quintile of mRNA abundance in GCBs. mRNA abundance represented as TPM (transcripts per kilobase million) as estimated by Salmon46. b, NucleoATAC42 estimates of nucleosome position and occupancy for gene TSS according to a gene’s mRNA abundance quintile in GCBs. c, MNAse-seq reads per million mapped reads (RPM) according to a gene’s mRNA abundance quintile in GCBs. d, NucleoATAC estimates for the position of +1 nucleosome relative to the TSS of genes according to a gene’s mRNA abundance quintile in GCB (n=10 biological replicates). e, Density plots showing dynamic range of normalized ATAC-seq read counts in ATAC-seq peak-atlas sites across B-cell populations. Promoter elements are located <2kb from a gene TSS. Bars under density plots indicate inter-quantile range. f, principal components analysis (PCA) of ATAC-seq insertion counts in gene-distal peak-atlas elements across B cell populations. g, Cumulative probability distribution plot of GCB (n=13) vs NB (n=9) gene expression log2-fold changes (RNA-seq) for genes assigned to DNA elements that are differentially accessible (FDR<0.01) or unchanged in GCB (n=10) vs NB (n=6). Gene expression log2 fold changes are computed using DESEq247. P-values are calculated by Wilcoxon rank-sum test and bars adjacent to p-values indicate the comparison of newly accessible or decommissioned sites to unchanged sites.
Extended data Figure 3.
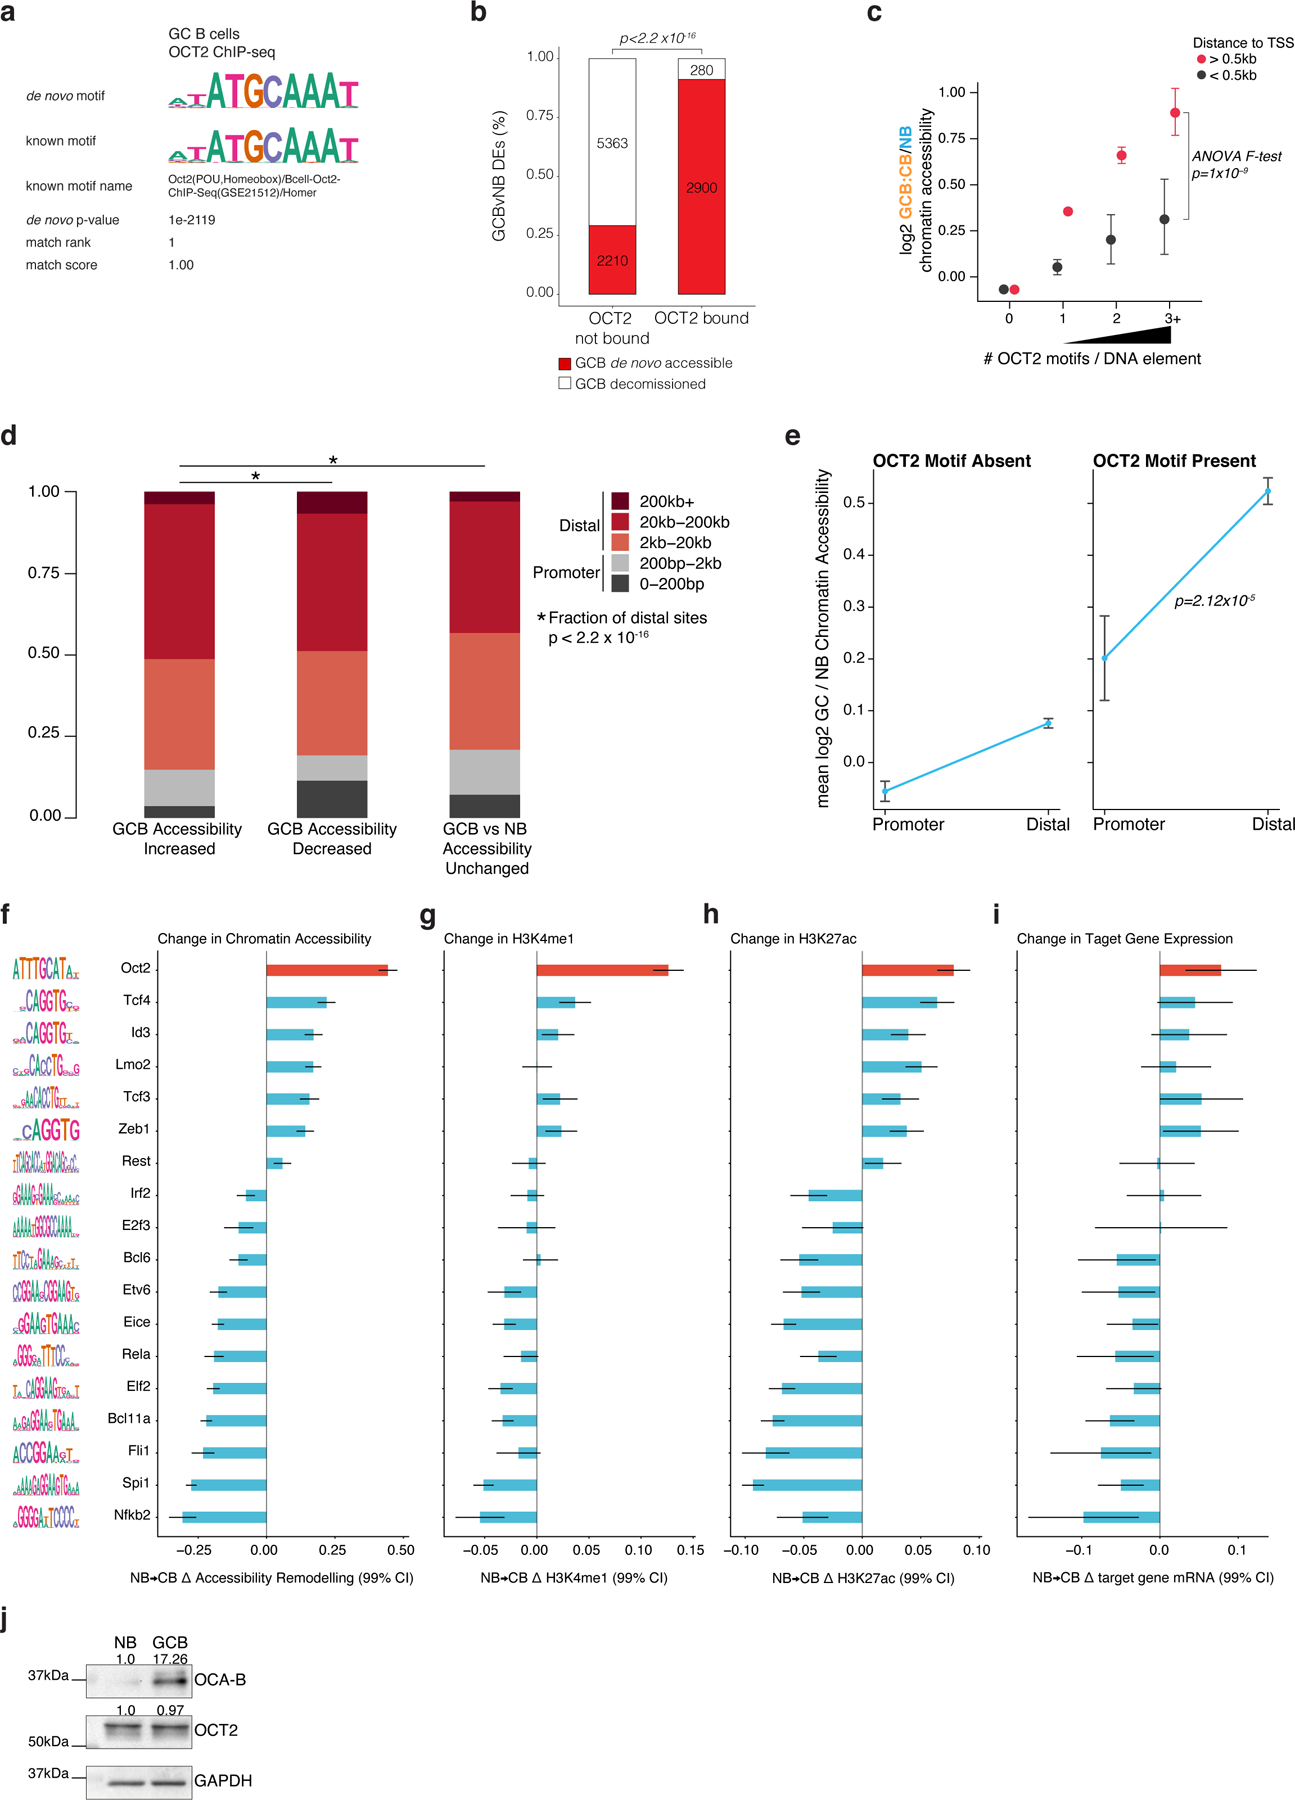
related to Figure 2. a, results of de novo motif discovery using GCB OCT2 peak summits as input to HOMER48. b, bar plot of the relative fraction of differentially accessible elements that are GCB de novo accessible or GCB decommissioned in sites not bound by OCT2 and sites bound by OCT2. Number of sites is indicated in each bar plot. P-value computed by Fisher’s exact test. c, scatter plot of Bayesian posterior mean log2 fold-change in chromatin accessibility for GCB (n=10 biological replicates) vs NB (n=6 biological replicates) at sites with 0, 1, 2, or >=3 OCT2 motifs, and distinguishing sites within 0.5kb of a gene TSS. P-value computed by ANOVA F-test. Error bars indicate 99% credible intervals. d, bar plot showing the fractional proportion of elements according to genomic distance to nearest gene transcription start site for DNA elements with differentially increased, decreased, or unchanged accessibility in mouse GCB (n=10 biological replicates) vs NB (n=4 biological replicates) (FDR<0.001). P-value computed by Fisher’s exact test. e, scatter plot showing the mean accessibility log2 fold-change in mouse GCB (n=10 biological replicates) relative to mouse NB (n=4 biological replicates) promoter and distal DNA elements lacking an OCT2 DNA motif or with an OCT2 DNA motif present. P-value computed by ANOVA for testing the null hypothesis that the difference in accessibility log2 fold-changes between promoter and distal elements does not depend on the presence of an OCT2 DNA motif. Error bars indicate 95% CIs. f, TF accessibility remodeling scores representing linear regression effect size estimates for TF motifs on the change in ATAC-seq chromatin accessibility in mouse GCB (n=4) relative to mouse NB (n=4). Error bars represent 95% CIs. Motif logos representing motif position weight matrices used to map TF motifs are plotted at left. g, TF motif linear regression effect size estimates for histone H3K4me1 log2 fold-changes in biological replicate GCBs (n=4) relative to NBs (n=4). Error bars represent 95% CIs. h, TF motif linear regression effect size estimates for histone H3K27ac log2 fold-changes in biological replicate GCBs (n=4) relative to NBs (n=4). Error bars represent 95% CIs. i, TF motif effect estimates for gene expression log2 fold-changes in mouse GCB (n=7) relative to NB (n=6). Genes assigned to DNA elements according to nearest TSS. Error bars represent 95% CIs. j, western blot for OCAB and OCT2 in human NBs and GCBs. Protein lysates were resolved by SDS–PAGE, transferred to PVDF membrane and probed with primary antibodies to the following: OCAB/BOB-1/OBF-1 (1:100, Cell Signaling Technology #33483S) and OCT2 (1:500, Thermo Scientific #RB-9297) and GAPDH (1:10000, Santa Cruz, sc-25778). Membranes were then incubated with corresponding HRP-conjugated secondary antibodies, and signal was detected using enhanced chemiluminescence (ChemiDoc Touch, Bio-Rad Laboratories). This blot was repeated independently with similar results for two biological replicate samples.
Extended data Figure 4.
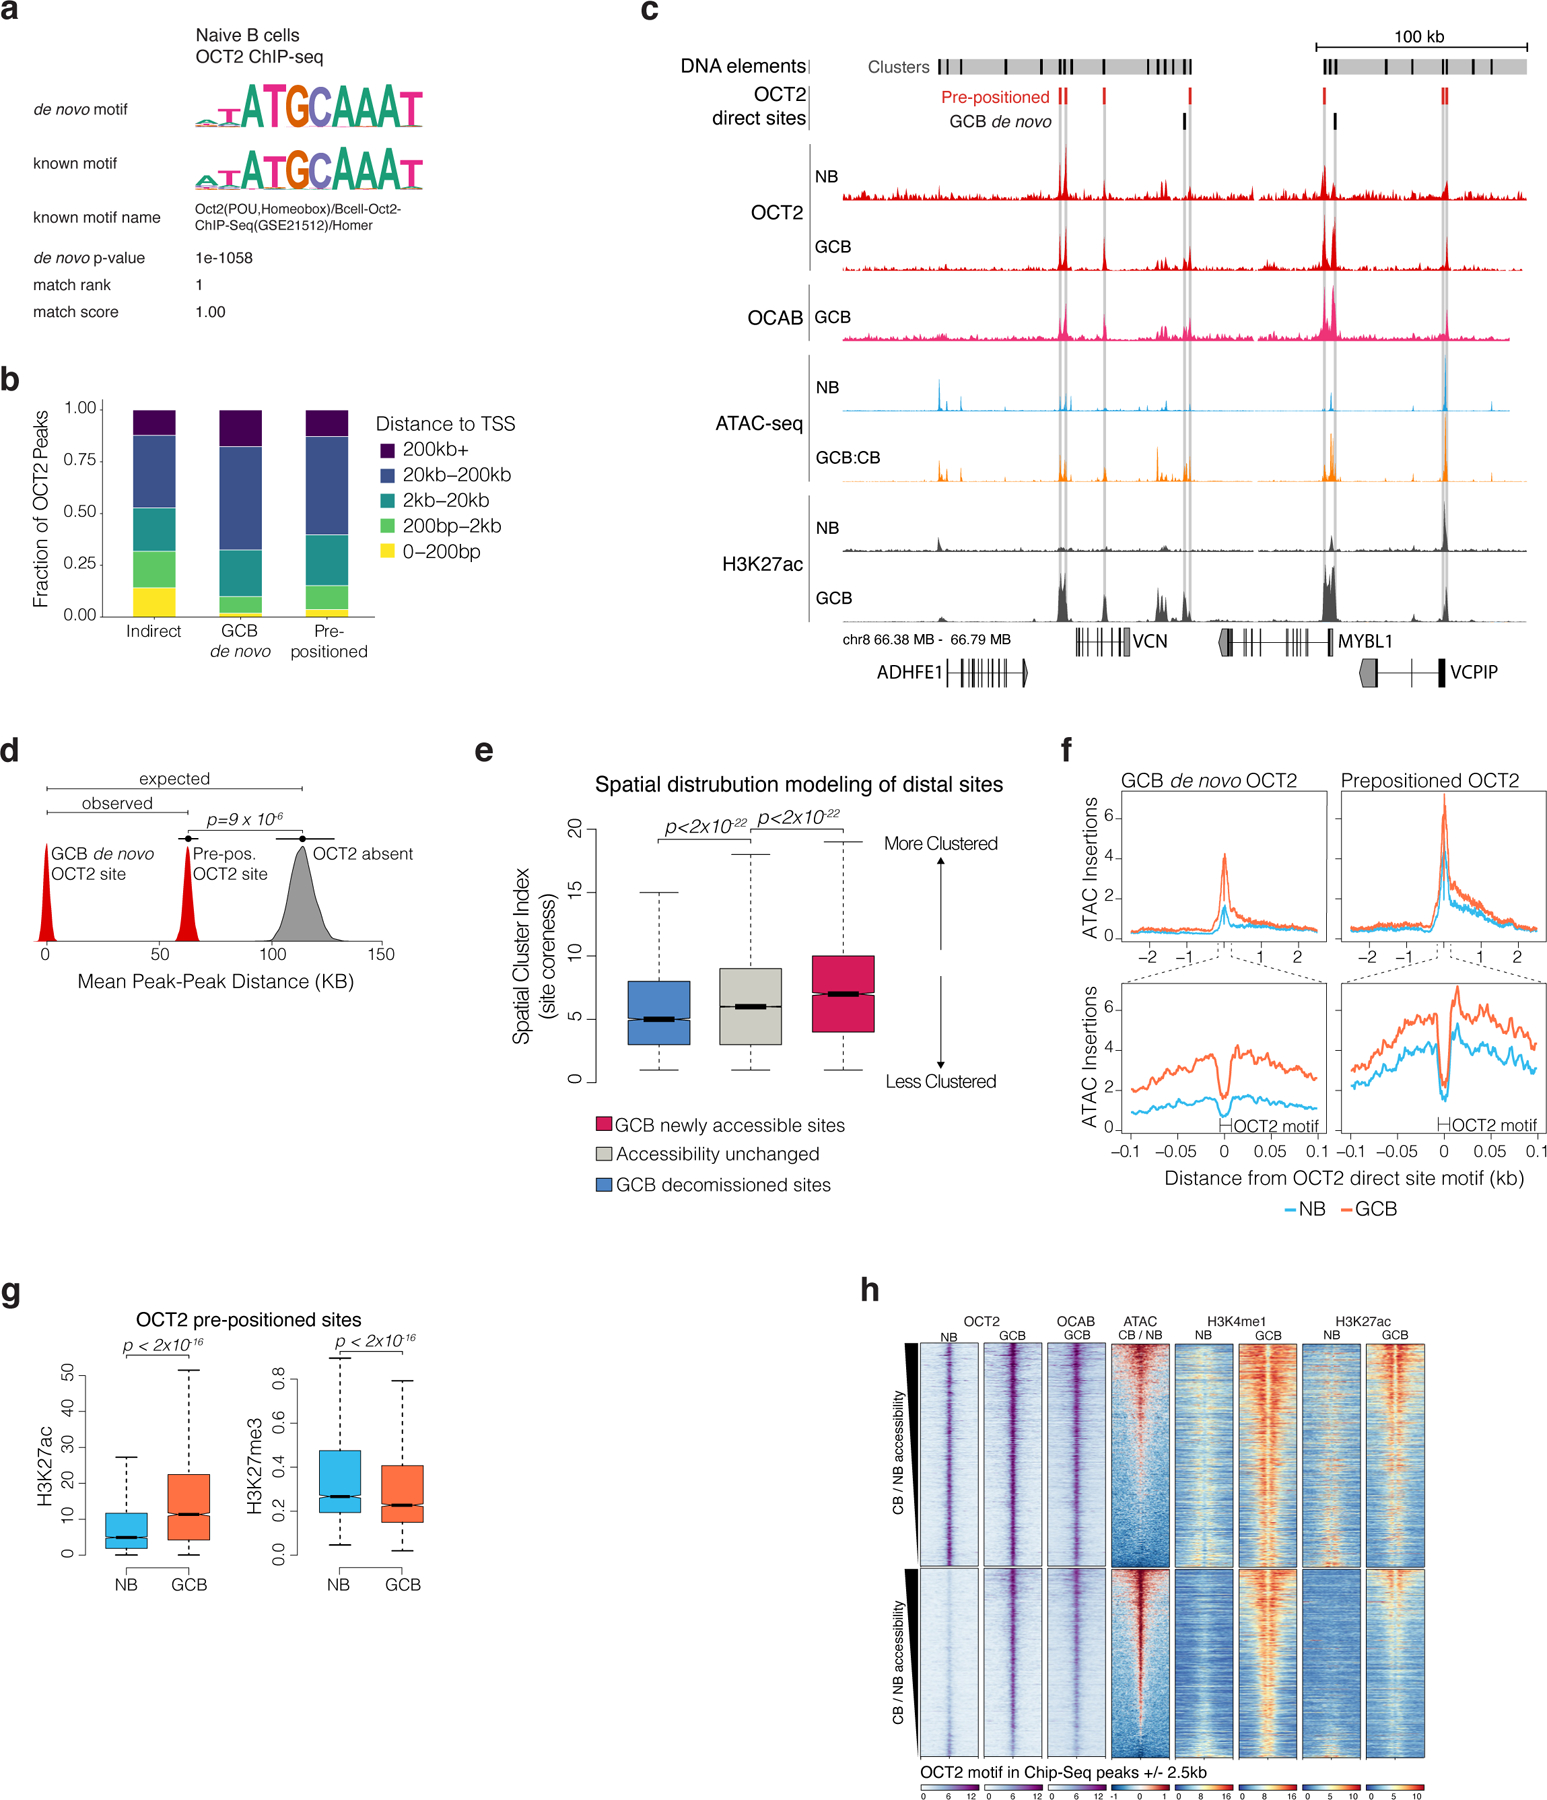
related to Figure 3. a, results of de novo motif discovery as reported by HOMER for OCT2 ChIP-seq in naïve B cells. b, bar plots comparing the genomic localization of indirect, pre-positioned, and GCB de novo OCT2 sites. c, genome browser plot of OCT2 ChIP-seq in NBs and GCBs, OCAB ChIP-seq in GCBs, and ATAC-seq in NBs and CBs. ChIP-seq tracks represent target/input fold enrichment and each sample is plotted using identical Y scale. ATAC-seq tracks were normalized to number of reads in peaks using the B-cell peak atlas and plots use identical Y scales across samples. d, density plots showing the mean distance to the nearest GCB de novo OCT2 site for pre-positioned OCT2 sites (red) or random sample of all ATAC-seq DNA elements in B cells (expectation, grey). Statistics were computed by resampling using the regioneR package in R. e, box plot comparing the cluster coreness as a measure of peak clustering for differentially accessible or unchanged sites in GCB (n=10 biological replicates) vs NB (n=6 biological replicates). Peak cluster coreness computed using a graph of peak-peak distances with clusters defined by infonet community detection. P-values computed by Wilcoxon rank-sum test. f, ATAC-seq insertion profiles in GCB and NB centered on the OCT2 motif in pre-positioned and GCB de novo OCT2 sites. g, boxplot comparing H3k27ac activating mark and H3K27me3 repressive mark in NB and GCB at OCT2 pre-positioned sites. P-values by by Mann-Whitney U test. h, read density heat maps showing ChIP-seq fold enrichment / input for OCT2, OCAB, and histones H3K4me1 and H3K27ac. ATAC-seq heatmaps show log2 (GCB / NB) insertions. Box plots show center line as median, box limits as upper and lower quartiles, whiskers as minimum and maximum values within 1.5 x inter-quartile range of 1st and 3rd quartile, and notches as approximate 95% CI of the median.
Extended data Figure 5.
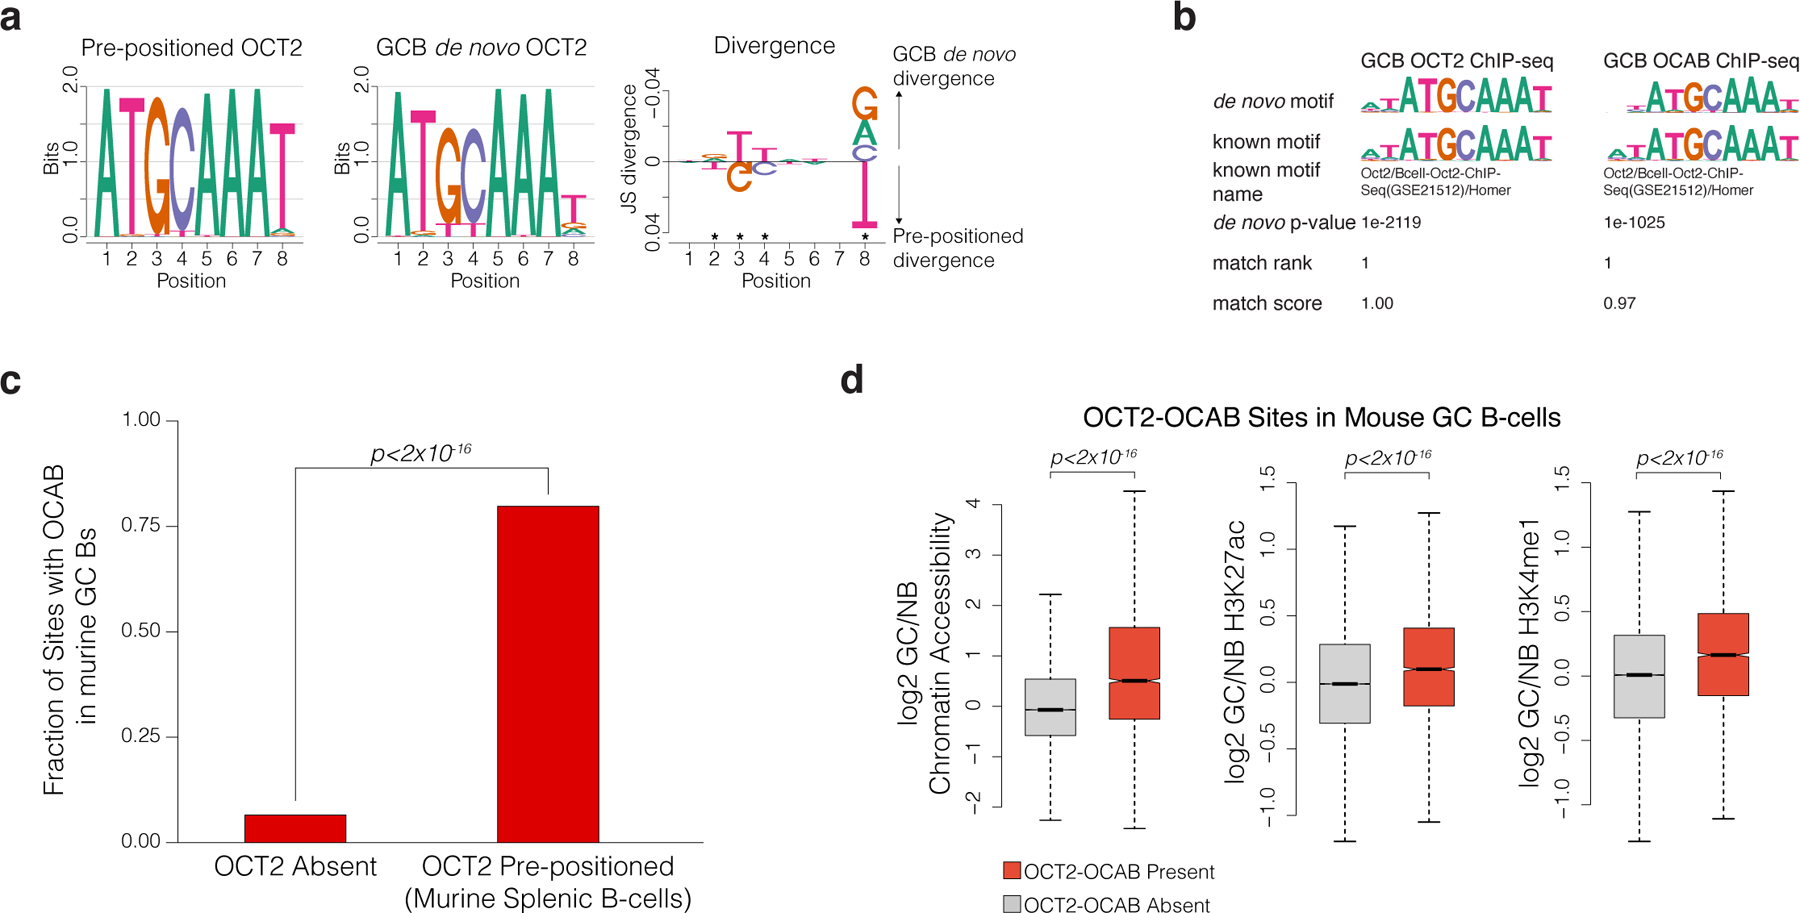
related to Figure 4. a, comparison of motif position weight matrices as defined from de novo motif discovery of pre-positioned and GCB de novo sites. Motif divergence was computed using the R package motifDiverge. Significant divergence indicated by *. b, results of de novo motif discovery as reported by HOMER for OCT2 ChIP-seq and OCAB ChIP-seq in GCBs. c, barplot showing the fraction of sites with OCAB recruitment in mouse GCBs and comparing sites with OCT2 direct binding in murine splenic B cells and sites in which OCT2 is absent. ChIP-seq data for OCT2 and OCAB were retrieved from GSE142040. P-value by Fisher’s exact test. d, boxplots of log2 fold changes in mouse GCB (n=10) vs NB (n=4) chromatin accessibility, mouse GCB (n=2) vs NB (n=2) histone H3K27ac, and mouse GCB (n=2) vs NB (n=2) histone H3K4me1 and comparing OCT2 direct sites in splenic B cells that recruit OCAB in GCBs (OCT2-OCAB sites) with all other accessible sites. P-values by Welch t-test. Box plots show center line as median, box limits as upper and lower quartiles, whiskers as minimum and maximum values within 1.5 x inter-quartile range of 1st and 3rd quartile, and notches as approximate 95% CI of the median.
Extended data Figure 6.
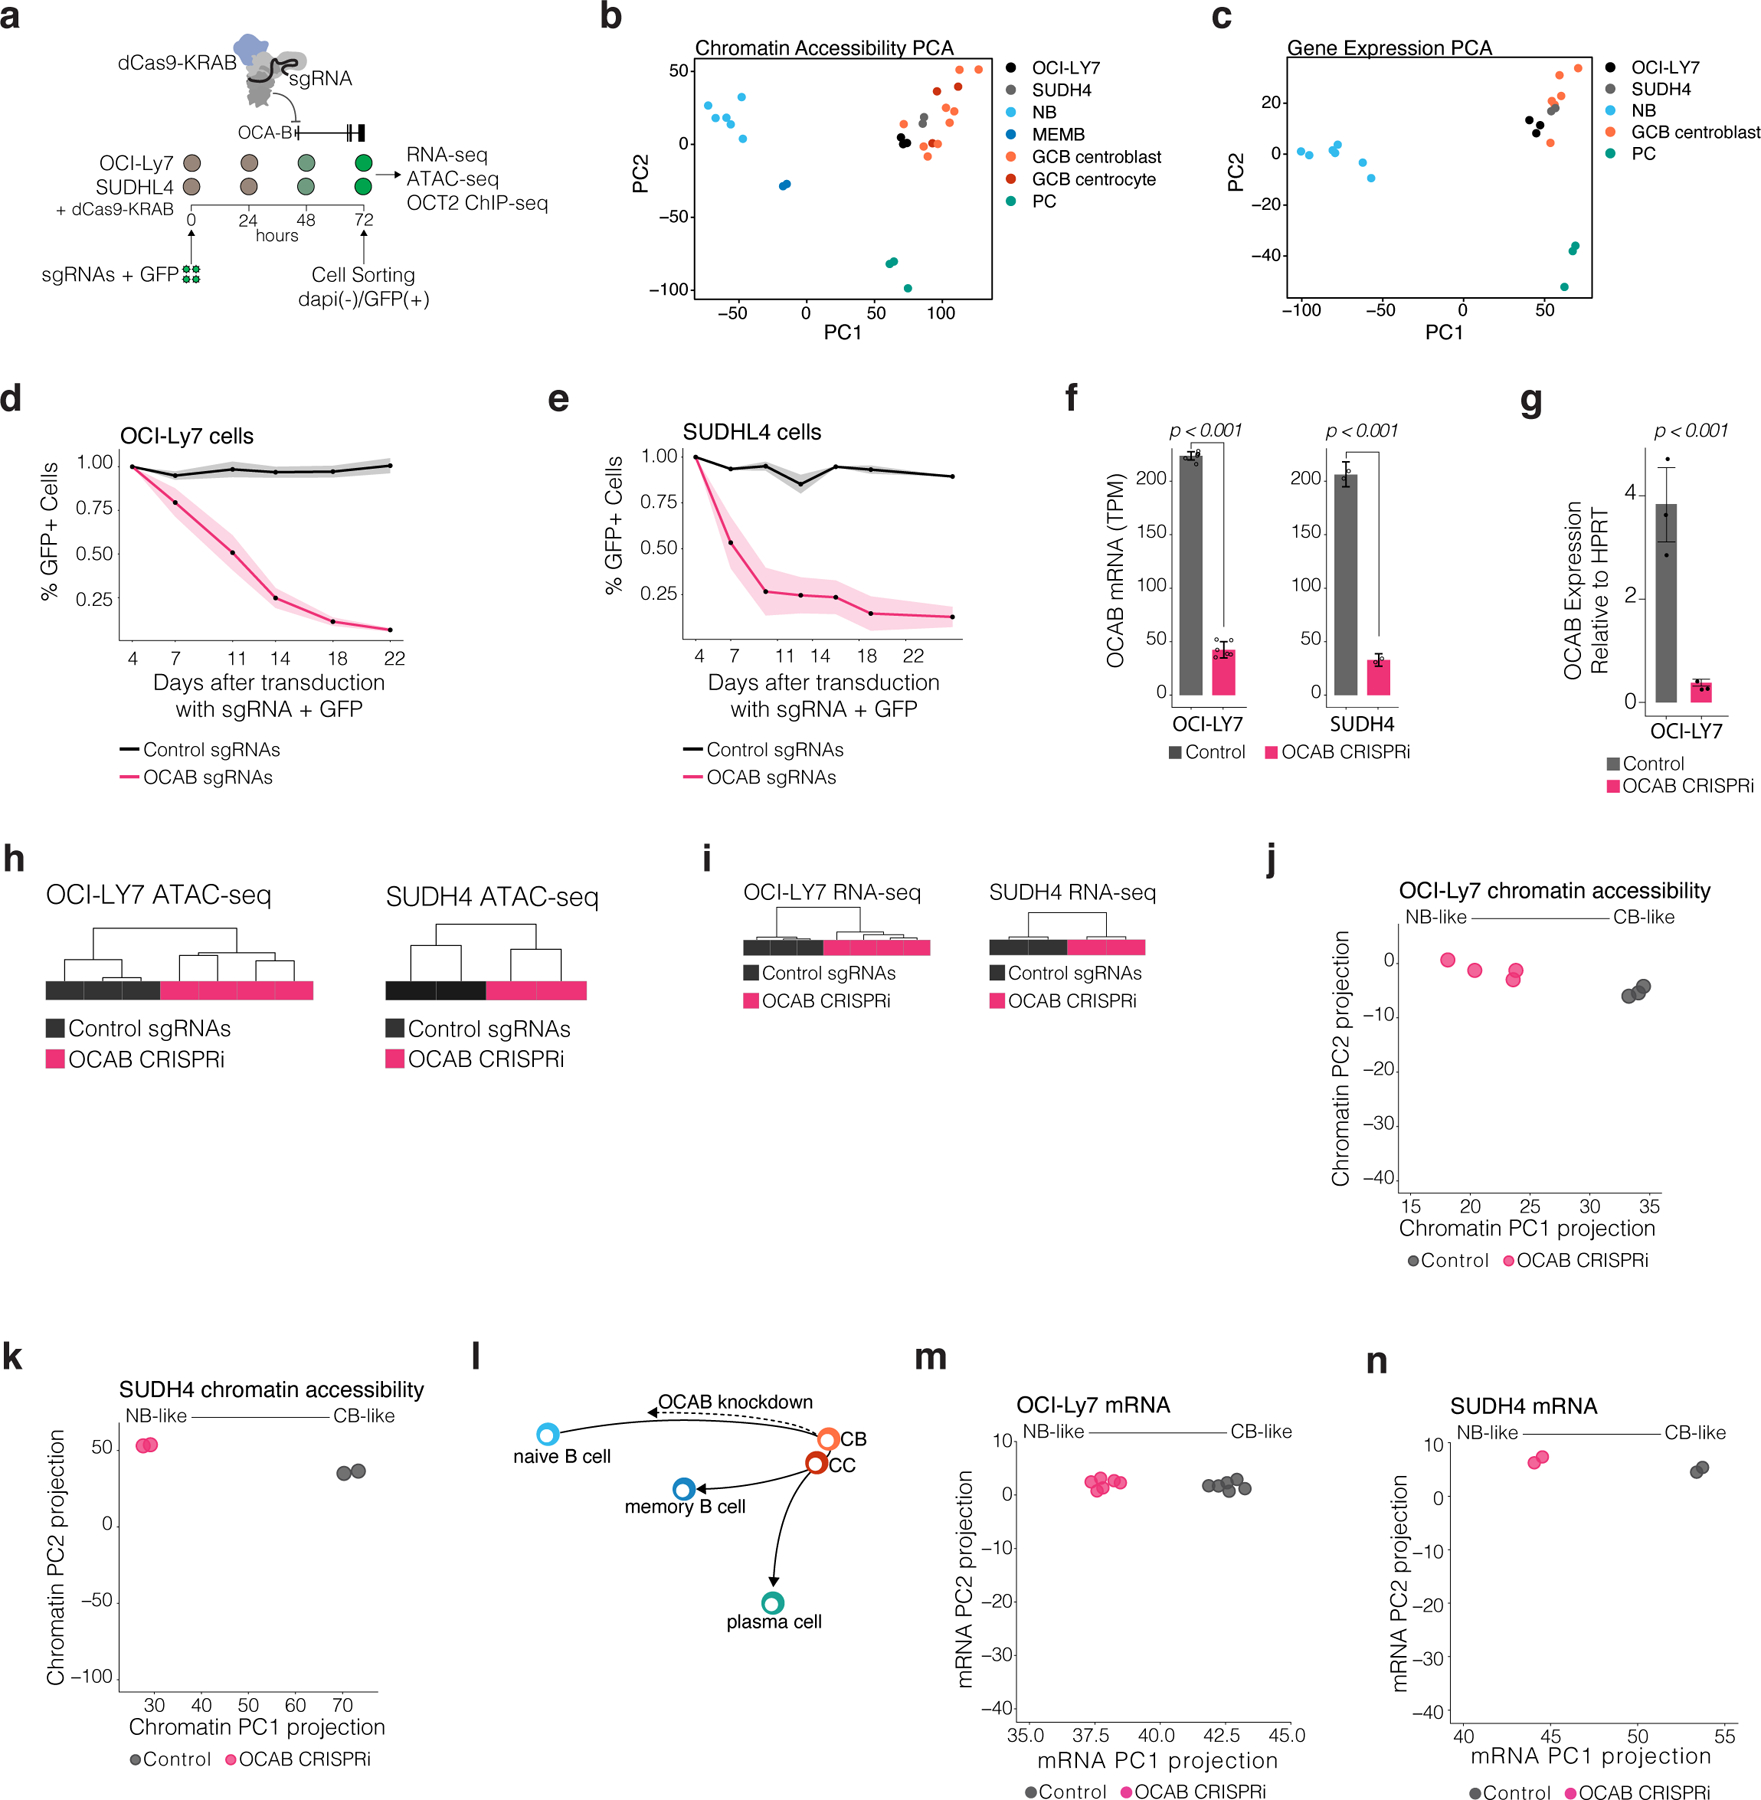
related to Figure 4. a, illustration of the experimental strategy for OCAB depletion in GCB-derived cells used for sequencing studies. Viable, GFP+ OCI-Ly7 and SUDHL4 cells expressing dCas9-KRAB were isolated by FACS for sequencing studies 72 hours after transduction with vector containing sgRNA and GFP. b, chromatin accessibility PCA of primary B cells and GCB-derived cell lines and using differentially accessible elements across B-cell phenotypes (FDR<0.001). c, gene expression PCA of primary B cells and GCB-derived cell lines using differentially expressed genes across B-cell phenotypes (FDR<0.001). d, plot showing the fraction of GFP+ viable OCI-Ly7 cells at indicated time points relative to 4 days after transduction with non-targeting control sgRNAs (n= 2 sgRNAs with 3 technical replicates each) or sgRNAs targeting OCAB (n=5 sgRNAs with 3 technical replicates each). Shaded area shows 95% CI of the mean across replicates. e, plot showing the fraction of GFP+ viable SUDH4 cells at indicated time points relative to 4 days after transduction with non-targeting control sgRNAs (n= 2 sgRNAs with 3 technical replicates each) or sgRNAs targeting OCAB (n=5 sgRNAs with 3 technical replicates each). Shaded area shows 95% CI of the mean across replicates. f, bar plot showing OCAB transcript abundance (TPM) in OCAB knockdown (n=6 replicate experiments) vs control (n=6 replicate experiments) OCI-Ly7 CRISPRi cells and OCAB knockdown (n=2 replicate experiments) vs control (n=2 replicate experiments) SUDHL4 CRISPRi cells. Transcript quantification was performed using Salmon selective alignment49. P-values by Welch t-test and error bars show standard error of the mean. g, OCAB transcript abundance relative to HPRT in control (n= 3 independent replicates) and OCABi (n= 3 independent replicates) OCI-Ly7 cells by qPCR. P-values by Welch t-test and error bars show standard error of the mean. h, unsupervised hierarchical clustering dendrogram using complete linkage clustering based on pearson correlation distance of OCABi and control OCI-Ly7 and SUDH4 ATAC-seq chromatin accessibility profiles. i, unsupervised hierarchical clustering dendrogram using complete linkage clustering based on pearson correlation distance of OCABi and control OCI-Ly7 and SUDH4 RNA-seq gene expression profiles. j, scatter plot showing OCI-Ly7 OCABi and control chromatin accessibility profiles projected onto a PCA of primary B cells chromatin accessibility profiles (Fig. 4I). k, scatter plot showing SUDH4 OCABi and control chromatin accessibility profiles projected onto a PCA of primary B cells chromatin accessibility profiles (Figure 4I). l, scatter plot showing OCI-Ly7 OCABi and control RNA-seq gene expression profiles projected onto a PCA of primary B-cell gene expression profiles (Figure 4K). m, scatter plot showing SUDH4 OCABi and control RNA-seq gene expression profiles projected onto a PCA of primary B-cell gene expression profiles (Figure 4K). n, illustration showing trajectories in B-cell development during the humoral immune response. Relative position of cell types and length of arcs is defined using mean ATAC-seq signal for each cell type. The arrow direction for arcs connecting cell types is inferred form the identity of each cell type.
Extended data Figure 7.

related to Figure 5. a, experimental design for forced expression of Pou2af1, the gene encoding OCAB in mouse. Splenic B cells from n=5 mice were stimulated with LPS ex vivo and transduced with a GFP vector containing Pou2af1 (mOCAB) or GFP only (control). b, expression of Pou2af1 in mOCAB (n=5) and control(n=5) B cells. Expression levels were measured by qPCR using cDNA generated from total RNA of GFP+ viable cells and normalized to that of Hprt1, calculated by the delta-delta Ct method (2−∆∆Ct) and represented as a fold change over the mean expression in control cells. The expression of each gene was measured in triplicate across 5 replicates. P-values by Welch’s t tes and error bars show standard error of the mean.
Extended data Figure 8.
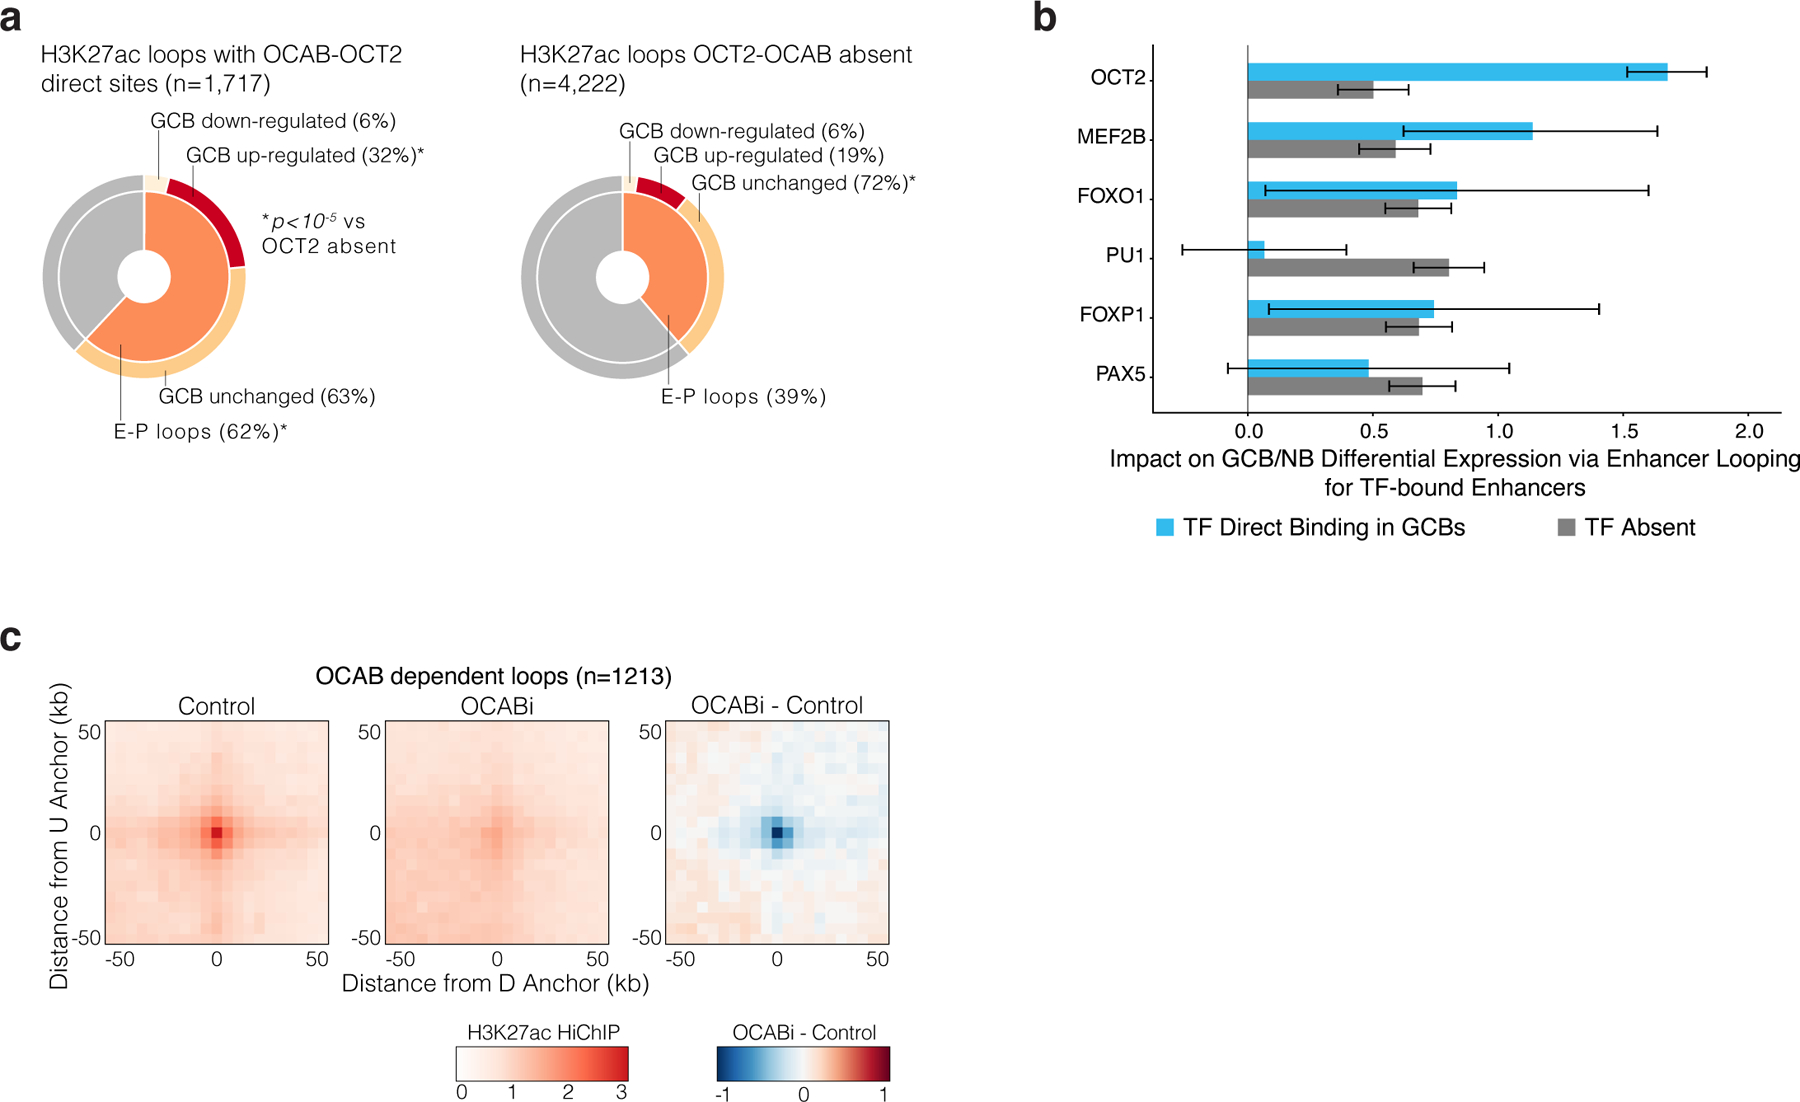
related to Figure 6. a, pie chart showing the fraction of H3K27ac HiChIP loops that form enhancer-promoter (E-P) contacts for loops anchored by an OCAB-OCT2 sites (left) or not anchored by an OCAB-OCT2 site (right). The inner circle represents the fraction of loops that form E-P contacts, and the outer circle distinguishes whether the promoter belongs to a gene whose expression is differentially increased, decreased, or unchanged in GCB vs NB. *Indicates significantly greater fraction for OCT2-OCAB loops compared to loops not anchored by OCT2-OCAB. P-values by Fisher’s exact test and * indicates FDR-corrected p<10-5. b, effect estimates for the contribution of enhancer activity score to a gene’s change in expression in biological replicate GCBs (n=6) relative to NBs (n=6) for enhancers with direct binding present or direct binding absent for the indicated TF. Effect sizes were computed from a linear regression of GCB / NB expression log2 fold-change on the total enhancer activity score per gene for enhancers with and without TF direct binding, and error bars show 95% CI for mean effect estimate. Activity-contact score was computed from OCI-Ly7 H3K27ac HiChIP (n=2 biological replicates), GCB H3K27ac ChIP-seq (n=4 biological replicates), and using the 76237 ATAC-seq DNA elements identified in B cells. c, APA plots showing aggregate contact enrichment vs local background in Control and OCABi OCI-Ly7 cells and the difference in contact enrichment between OCABi and Control. Plots centered on anchor mid-points of called loops that were sensitive to OCAB depletion at 1% FDR.
Extended data Figure 9.
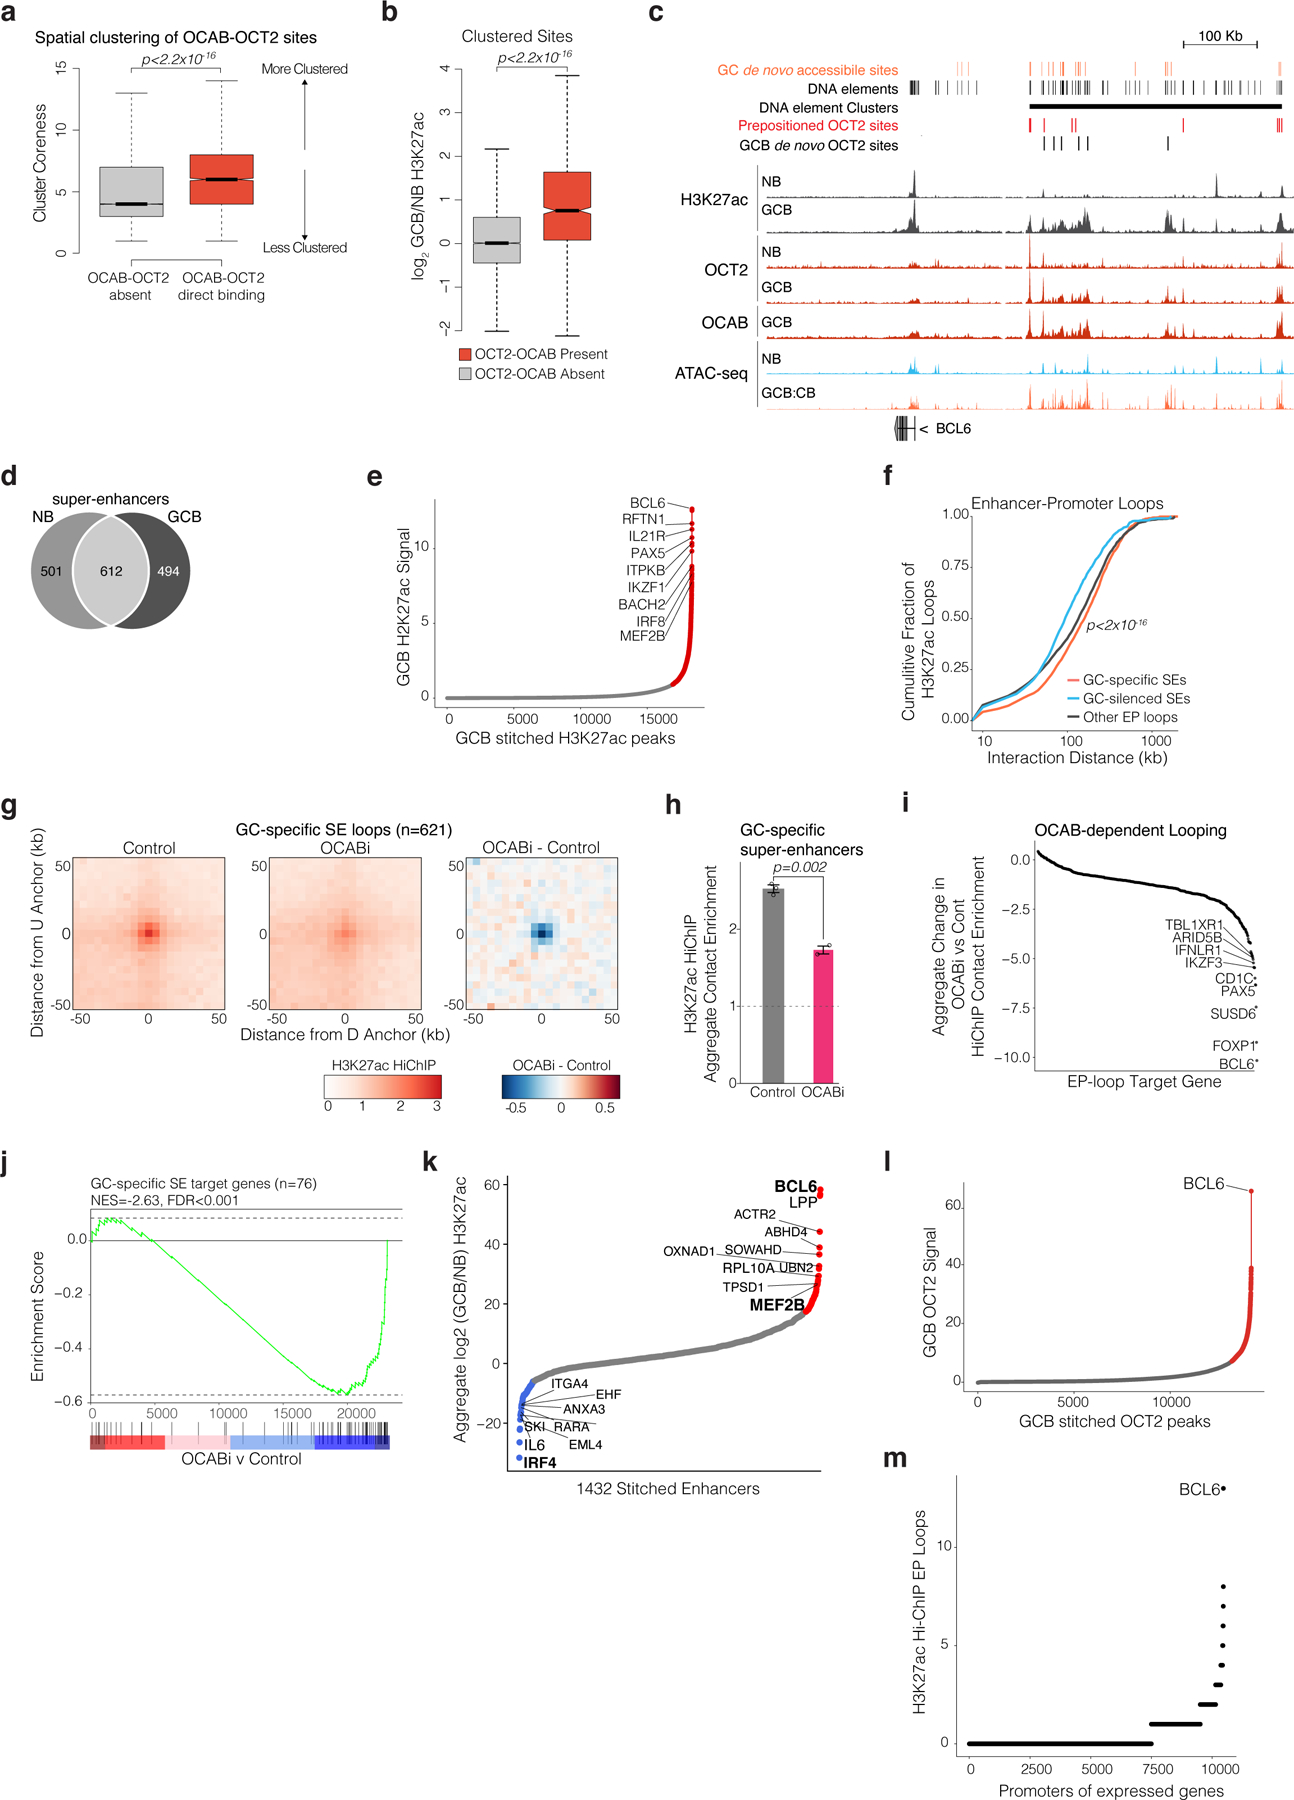
related to Figure 7. a, Box plots of cluster coreness comparing DNA elements that contain OCT2-OCAB binding (n=6768 sites) and DNA elements without OCT2-OCAB (n=69469 sites). Coreness was computed using a graph of peak-peak distances after applying info-map community detection and removal of inter-community edges and non-clustered peaks (no community assignment). P-values computed by Mann-Whitney U test. Box plots show center line as median, box limits as upper and lower quartiles, whiskers as minimum and maximum values within 1.5 x inter-quartile range of 1st and 3rd quartile, and notches as approximate 95% CI of the median. b, box plots showing histone H3K27ac ChIP-seq abundance log2 fold change in GCBs (n=4) vs NBs (n=4) for clustered DNA elements that contain an OCT2-OCAB site or no OCT2-OCAB site. P-value computed by Welch’s t-test. c, genome browser plot showing BCL6 and nearby SE and tracks for GC de novo accessible sites, B-cell DNA elements, DNA element clusters, NB pre-positioned and GCB de novo OCT2 sites, histone H3K27ac ChIP-seq in NBs and GCBs, OCT2 ChIP-seq in NBs and GCBs, OCAB ChIP-seq in GCBs, and ATAC-seq in NBs and GCBs. d, Venn diagram representing the genomic overlap of super-enhancers in NBs and GCBs. e, plot of super-enhancers called by ROSE using GCB H3K27ac ChIP-seq. Red points indicate called super-enhancers. f, empirical cumulative distribution function plot for contact distance of enhancer-promoter loops showing greater contact distance for GC-activated super-enhancers, as compared to GC-silenced super-enhancers or other enhancer-promoter loops. g, APA plots of GC-activated SE loops that contact a gene promoters. Pooled replicates of Control and OCABi OCI-Ly7 cells are shown, along with the difference in contact enrichment between OCABi and Control. h, Bar plot of APA scores showing H3K27ac HiChIP aggregate contact enrichment / local background for 621 GC-activated SE loops in OCI-Ly7 control (n=3 independent experiments) or OCABi (n=2 independent experiments). P-value by student’s t-test and error bars show standard error of the mean. i, GSEA enrichment plot for OCABi vs Control expression changes using GC-activated target genes gene set. j, Scatter plot showing the per-gene aggregate log2 fold change in OCI-Ly7 OCABi vs Control H3K27ac HiChIP contact enrichment. k, Scatter plot of aggregate log2 fold change in H3K27ac ChIP-seq in GCBs vs NBs for DNA elements within a super-enhancer. SEs above the 90th percentile are labeled red, and SEs below the 10th percentile are labeled blue. l, Super-enhancer analysis using the ROSE method with GCB OCT2 ChIP-seq signal over stitched GCB OCT2 ChIP-seq peaks. The top-ranked region by OCT2 abundance identified a BCL6 super-enhancer. m, scatter plot showing the number of called H3K27ac Hi-ChIP enhancer-promoter loops per gene promoter for genes expressed in OCI-Ly7 cells.
Extended data Figure 10.
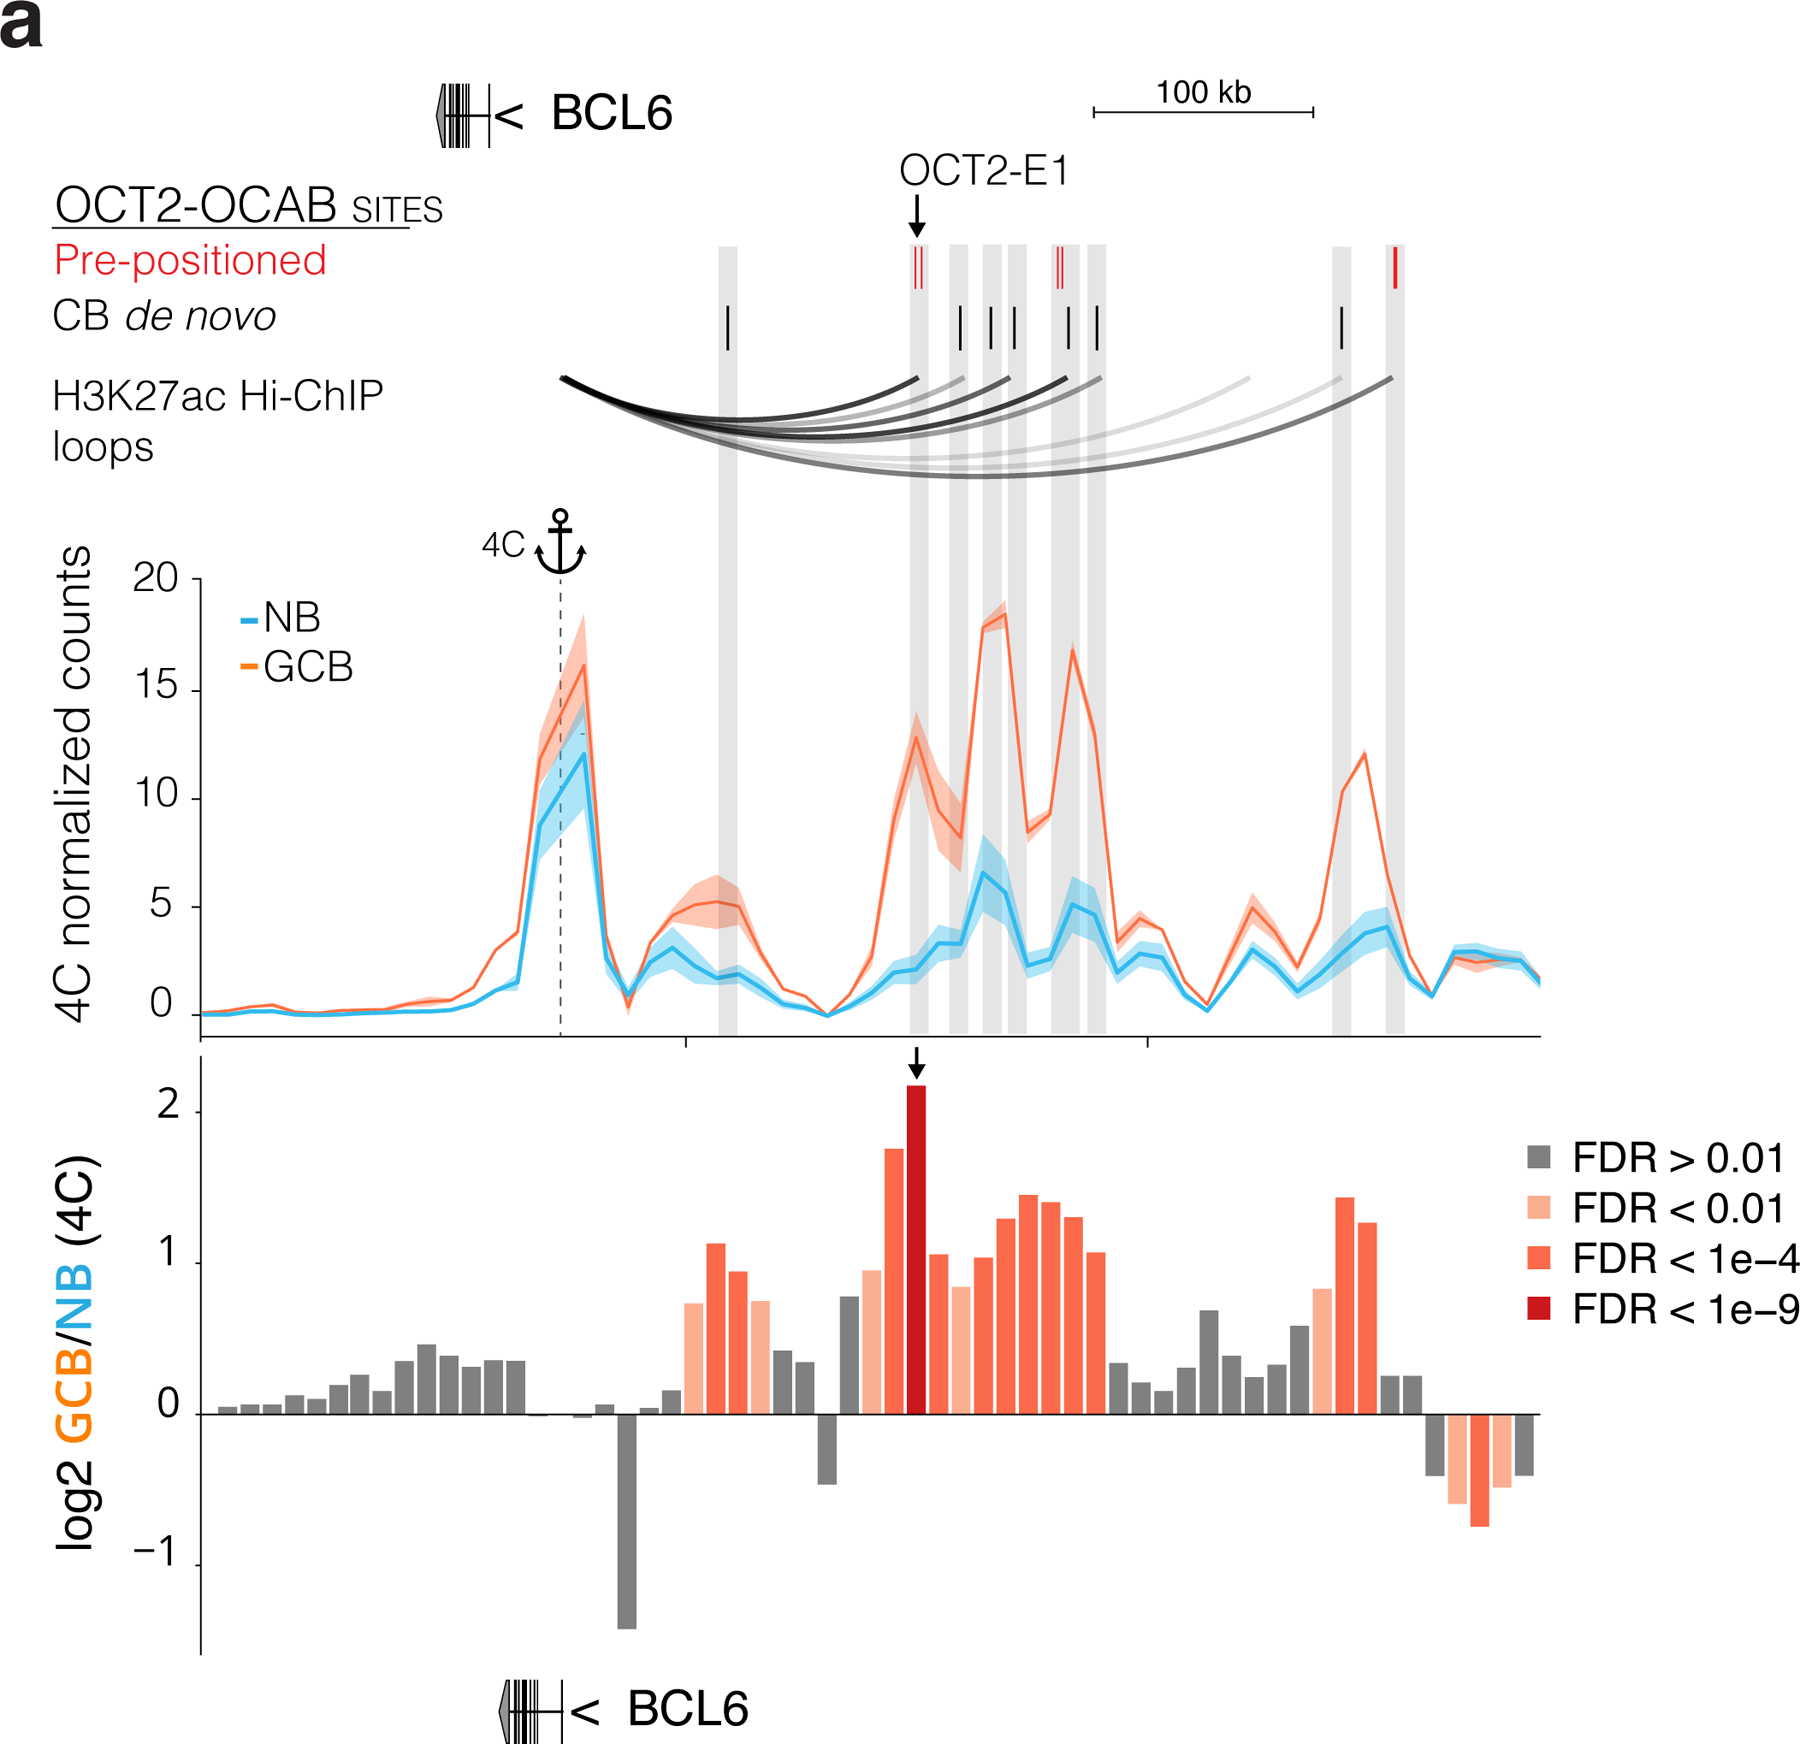
related to Figure 8. a, genome browser plot of a region on chromosome 3 containing BCL6 and adjacent super-enhancer. OCT2-OCAB sites are shown with Pre-positioned OCT2 sites in red and GCB de novo OCT2 sites in black. H3K27ac HiChIP called loops in OCI-Ly7 cells. Plot showing NB and GCB 4C contact enrichment representing interactions with the 4C anchor, located at the BCL6 TSS. Bar plot showing differential 4C contact enrichment with bars labeled according to FDR for differential contacts. Normalized and differential contact enrichment computed using 4C-ker44 and DESeq247.
Supplementary Material
Acknowledgements
A.S.D. is funded by NCI (1 F31 CA220981–01). A.M. and O.E. are funded by Leukemia and Lymphoma Society SCOR 7012–16 and SCOR 7021–20. O.E. is supported by Janssen and Eli Lilly research grants, NIH grants UL1TR002384, R01CA194547, and LLS SCOR grant 180078–02. A.M. is funded by NCI R35 CA220499, and NCI P01 CA229086, LLS TRP 6572– 19, The Chemotherapy Foundation and the Follicular Lymphoma Consortium. R.G.R. is supported by NIH grants R01AI148387 and R01CA178765 and Leukemia and Lymphoma Society SCOR 7021–20.
This study makes use of data generated by the Blueprint Consortium. A full list of the investigators who contributed to the generation of the data is available from www.blueprint-epigenome.eu. Funding for the project was provided by the European Union’s Seventh Framework Programme (FP7/2007–2013) under grant agreement no 282510 BLUEPRINT.
Footnotes
CODE AVAILABILITY
All code used for processing and primary analysis of sequencing data is available at https://github.com/DoaneAS/atacflow for ATAC-seq, https://github.com/DoaneAS/rnaflow and https://github.com/nf-core/rnaseq for RNA-seq, and https://github.com/nf-core/chipseq for ChIP-seq.
Yu, M. et al. RNA polymerase II–associated factor 1 regulates the release and phosphorylation of paused RNA polymerase II. Science 350, 1383–1386 (2015).
Competing Interests
AM receives research funding from Janssen and Daiichi Sankyo, has consulted for Constellation, Jubilant and Epizyme, and is on the advisory board of KDAC. O.E. is scientific advisor and equity holder in Freenome, Owkin, Volastra Therapeutics and OneThree Biotech. A.S.D., C.C., D.C.D.G., M.A.R., J.C.H., Y.J., N.Y., A.A., R.G.R, and E.A. declare no competing interests.
DATA AVAILABILITY
All sequencing data generated for this study is available in Gene Expression Omnibus (accession number GSE159314).
References
- 1.Mesin L, Ersching J & Victora GD Germinal Center B Cell Dynamics. Immunity 45, 471–482 (2016). [DOI] [PMC free article] [PubMed] [Google Scholar]
- 2.Mlynarczyk C, Fontán L & Melnick A Germinal center-derived lymphomas: The darkest side of humoral immunity. Immunol Rev 288, 214–239 (2019). [DOI] [PMC free article] [PubMed] [Google Scholar]
- 3.Hatzi K et al. Histone demethylase LSD1 is required for germinal center formation and BCL6-driven lymphomagenesis. Nat Immunol 20, 86–96 (2019). [DOI] [PMC free article] [PubMed] [Google Scholar]
- 4.Hatzi K et al. A Hybrid Mechanism of Action for BCL6 in B Cells Defined by Formation of Functionally Distinct Complexes at Enhancers and Promoters. Cell Reports 4, 578–588 (2013). [DOI] [PMC free article] [PubMed] [Google Scholar]
- 5.Bunting KL et al. Multi-tiered Reorganization of the Genome during B Cell Affinity Maturation Anchored by a Germinal Center-Specific Locus Control Region. Immunity 45, 497–512 (2016). [DOI] [PMC free article] [PubMed] [Google Scholar]
- 6.Agirre X et al. Long non-coding RNAs discriminate the stages and gene regulatory states of human humoral immune response. Nat Commun 10, 821 (2019). [DOI] [PMC free article] [PubMed] [Google Scholar]
- 7.Song S & Matthias PD The Transcriptional Regulation of Germinal Center Formation. Front Immunol 9, 2026 (2018). [DOI] [PMC free article] [PubMed] [Google Scholar]
- 8.Fernando TM et al. BCL6 evolved to enable stress tolerance in vertebrates and is broadly required by cancer cells to adapt to stress. Cancer Discov 9, CD-17–1444 (2019). [DOI] [PMC free article] [PubMed] [Google Scholar]
- 9.Jiang Y et al. CREBBP Inactivation Promotes the Development of HDAC3-Dependent Lymphomas. Cancer Discov 7, 38–53 (2017). [DOI] [PMC free article] [PubMed] [Google Scholar]
- 10.Zhang J et al. The CREBBP Acetyltransferase Is a Haploinsufficient Tumor Suppressor in B-cell Lymphoma. Cancer Discov 7, 322–337 (2017). [DOI] [PMC free article] [PubMed] [Google Scholar]
- 11.Arnold CN et al. A forward genetic screen reveals roles for Nfkbid, Zeb1, and Ruvbl2 in humoral immunity. Proc National Acad Sci 109, 12286–12293 (2012). [DOI] [PMC free article] [PubMed] [Google Scholar]
- 12.Chen S et al. Id3 Orchestrates Germinal Center B Cell Development. Mol Cell Biol 36, 2543–2552 (2016). [DOI] [PMC free article] [PubMed] [Google Scholar]
- 13.Ochiai K et al. Transcriptional Regulation of Germinal Center B and Plasma Cell Fates by Dynamical Control of IRF4. Immunity 38, 918–929 (2013). [DOI] [PMC free article] [PubMed] [Google Scholar]
- 14.Ci W et al. The BCL6 transcriptional program features repression of multiple oncogenes in primary B cells and is deregulated in DLBCL. Blood 113, 5536–5548 (2009). [DOI] [PMC free article] [PubMed] [Google Scholar]
- 15.Hodson DJ et al. Regulation of normal B-cell differentiation and malignant B-cell survival by OCT2. Proc National Acad Sci 113, E2039–E2046 (2016). [DOI] [PMC free article] [PubMed] [Google Scholar]
- 16.Yusufova N et al. Histone H1 loss drives lymphoma by disrupting 3D chromatin architecture. Nature 589, 299–305 (2021). [DOI] [PMC free article] [PubMed] [Google Scholar]
- 17.Sáez A-I et al. Analysis of Octamer-Binding Transcription Factors Oct2 and Oct1 and their coactivator BOB.1/OBF.1 in Lymphomas. Modern Pathol 15, 211–220 (2002). [DOI] [PubMed] [Google Scholar]
- 18.Shaknovich R et al. DNA methyltransferase 1 and DNA methylation patterning contribute to germinal center B-cell differentiation. Blood 118, 3559–3569 (2011). [DOI] [PMC free article] [PubMed] [Google Scholar]
- 19.Green JA et al. The sphingosine 1-phosphate receptor S1P2 maintains the homeostasis of germinal center B cells and promotes niche confinement. Nat Immunol 12, 672–680 (2011). [DOI] [PMC free article] [PubMed] [Google Scholar]
- 20.Golay J et al. The A-Myb transcription factor is a marker of centroblasts in vivo. J Immunol 160, 2786–93 (1998). [PubMed] [Google Scholar]
- 21.Lambert SA et al. The Human Transcription Factors. Cell 175, 598–599 (2018). [DOI] [PubMed] [Google Scholar]
- 22.Wang S et al. HiNT: a computational method for detecting copy number variations and translocations from Hi-C data. Genome Biol 21, 73 (2020). [DOI] [PMC free article] [PubMed] [Google Scholar]
- 23.Sauter P & Matthias P Coactivator OBF-1 Makes Selective Contacts with Both the POU-Specific Domain and the POU Homeodomain and Acts as a Molecular Clamp on DNA. Mol Cell Biol 18, 7397–7409 (1998). [DOI] [PMC free article] [PubMed] [Google Scholar]
- 24.Gstaiger M, Knoepfel L, Georgiev O, Schaffner W & Hovens CM A B-cell coactivator of octamer-binding transcription factors. Nature 373, 360–362 (1995). [DOI] [PubMed] [Google Scholar]
- 25.Malik V, Zimmer D & Jauch R Diversity among POU transcription factors in chromatin recognition and cell fate reprogramming. Cell Mol Life Sci 75, 1587–1612 (2018). [DOI] [PMC free article] [PubMed] [Google Scholar]
- 26.Song S et al. OBF1 and Oct factors control the germinal center transcriptional program. Blood 137, 2920–2934 (2021). [DOI] [PubMed] [Google Scholar]
- 27.Hatzi K & Melnick A Breaking bad in the germinal center: how deregulation of BCL6 contributes to lymphomagenesis. Trends Mol Med 20, 343–352 (2014). [DOI] [PMC free article] [PubMed] [Google Scholar]
- 28.Park S-R et al. HoxC4 binds to the promoter of the cytidine deaminase AID gene to induce AID expression, class-switch DNA recombination and somatic hypermutation. Nat Immunol 10, 540–550 (2009). [DOI] [PMC free article] [PubMed] [Google Scholar]
- 29.Cattoretti G et al. Stages of Germinal Center Transit Are Defined by B Cell Transcription Factor Coexpression and Relative Abundance. J Immunol 177, 6930–6939 (2006). [DOI] [PubMed] [Google Scholar]
- 30.Dominguez PM et al. DNA Methylation Dynamics of Germinal Center B Cells Are Mediated by AID. Cell Reports 12, 2086–2098 (2015). [DOI] [PMC free article] [PubMed] [Google Scholar]
- 31.Huang C et al. The BCL6 RD2 Domain Governs Commitment of Activated B Cells to Form Germinal Centers. Cell Reports 8, 1497–1508 (2014). [DOI] [PMC free article] [PubMed] [Google Scholar]
- 32.Mumbach MR et al. HiChIP: efficient and sensitive analysis of protein-directed genome architecture. Nat Methods 13, 919–922 (2016). [DOI] [PMC free article] [PubMed] [Google Scholar]
- 33.Fulco CP et al. Activity-by-contact model of enhancer–promoter regulation from thousands of CRISPR perturbations. Nat Genet 51, 1664–1669 (2019). [DOI] [PMC free article] [PubMed] [Google Scholar]
- 34.Davis CA et al. The Encyclopedia of DNA elements (ENCODE): data portal update. Nucleic Acids Res 46, gkx1081-(2017). [DOI] [PMC free article] [PubMed] [Google Scholar]
- 35.Dominguez-Sola D et al. The FOXO1 Transcription Factor Instructs the Germinal Center Dark Zone Program. Immunity 43, 1064–1074 (2015). [DOI] [PubMed] [Google Scholar]
- 36.Willis SN et al. Transcription Factor IRF4 Regulates Germinal Center Cell Formation through a B Cell–Intrinsic Mechanism. J Immunol 192, 3200–3206 (2014). [DOI] [PubMed] [Google Scholar]
- 37.Schoenfelder S & Fraser P Long-range enhancer–promoter contacts in gene expression control. Nat Rev Genet 20, 437–455 (2019). [DOI] [PubMed] [Google Scholar]
- 38.Schubart K et al. B cell development and immunoglobulin gene transcription in the absence of Oct-2 and OBF-1. Nat Immunol 2, 69–74 (2001). [DOI] [PubMed] [Google Scholar]
- 39.Iwafuchi-Doi M & Zaret KS Pioneer transcription factors in cell reprogramming. Gene Dev 28, 2679–2692 (2014). [DOI] [PMC free article] [PubMed] [Google Scholar]
- 40.Zhu F et al. The interaction landscape between transcription factors and the nucleosome. Nature 562, 76–81 (2018). [DOI] [PMC free article] [PubMed] [Google Scholar]
- 41.Michael AK et al. Mechanisms of OCT4-SOX2 motif readout on nucleosomes. Science 368, 1460–1465 (2020). [DOI] [PubMed] [Google Scholar]
- 42.Schep AN et al. Structured nucleosome fingerprints enable high-resolution mapping of chromatin architecture within regulatory regions. Genome Res 25, 1757–1770 (2015). [DOI] [PMC free article] [PubMed] [Google Scholar]
- 43.Subramanian A et al. Gene set enrichment analysis: A knowledge-based approach for interpreting genome-wide expression profiles. P Natl Acad Sci Usa 102, 15545–15550 (2005). [DOI] [PMC free article] [PubMed] [Google Scholar]
- 44.Raviram R et al. 4C-ker: A Method to Reproducibly Identify Genome-Wide Interactions Captured by 4C-Seq Experiments. Plos Comput Biol 12, e1004780 (2016). [DOI] [PMC free article] [PubMed] [Google Scholar]
- 45.Chu C-S et al. Unique Immune Cell Coactivators Specify Locus Control Region Function and Cell Stage. Mol Cell 80, 845–861.e10 (2020). [DOI] [PMC free article] [PubMed] [Google Scholar]
- 46.Patro R, Duggal G, Love MI, Irizarry RA & Kingsford C Salmon provides fast and bias-aware quantification of transcript expression. Nat Methods 14, 417–419 (2017). [DOI] [PMC free article] [PubMed] [Google Scholar]
- 47.Love MI, Huber W & Anders S Moderated estimation of fold change and dispersion for RNA-seq data with DESeq2. Genome Biol 15, 550 (2014). [DOI] [PMC free article] [PubMed] [Google Scholar]
- 48.Heinz S et al. Simple Combinations of Lineage-Determining Transcription Factors Prime cis-Regulatory Elements Required for Macrophage and B Cell Identities. Mol Cell 38, 576–589 (2010). [DOI] [PMC free article] [PubMed] [Google Scholar]
- 49.Corces MR et al. The chromatin accessibility landscape of primary human cancers. Science 362, eaav1898 (2018). [DOI] [PMC free article] [PubMed] [Google Scholar]
- 50.Giammartino DCD et al. KLF4 is involved in the organization and regulation of pluripotency-associated three-dimensional enhancer networks. Nat Cell Biol 21, 1179–1190 (2019). [DOI] [PMC free article] [PubMed] [Google Scholar]
- 51.Gaspar JM NGmerge: merging paired-end reads via novel empirically-derived models of sequencing errors. Bmc Bioinformatics 19, 536 (2018). [DOI] [PMC free article] [PubMed] [Google Scholar]
- 52.Landt SG et al. ChIP-seq guidelines and practices of the ENCODE and modENCODE consortia. Genome Res 22, 1813–1831 (2012). [DOI] [PMC free article] [PubMed] [Google Scholar]
- 53.Rivas MA et al. Smc3 dosage regulates B cell transit through germinal centers and restricts their malignant transformation. Nat Immunol 22, 240–253 (2021). [DOI] [PMC free article] [PubMed] [Google Scholar]
- 54.Kostka D, Friedrich T, Holloway AK & Pollard KS motifDiverge: a model for assessing the statistical significance of gene regulatory motif divergence between two DNA sequences. Stat Interface 8, 463–476 (2015). [DOI] [PMC free article] [PubMed] [Google Scholar]
- 55.Schep AN, Wu B, Buenrostro JD & Greenleaf WJ chromVAR: inferring transcription-factor-associated accessibility from single-cell epigenomic data. Nat Methods 14, 975–978 (2017). [DOI] [PMC free article] [PubMed] [Google Scholar]
- 56.Li Z et al. Identification of transcription factor binding sites using ATAC-seq. Genome Biol 20, 45 (2019). [DOI] [PMC free article] [PubMed] [Google Scholar]
- 57.Tsankov AM et al. Transcription factor binding dynamics during human ES cell differentiation. Nature 518, 344–349 (2015). [DOI] [PMC free article] [PubMed] [Google Scholar]
- 58.Saint-André V et al. Models of human core transcriptional regulatory circuitries. Genome Res 26, 385–396 (2016). [DOI] [PMC free article] [PubMed] [Google Scholar]
- 59.Imielinski M, Guo G & Meyerson M Insertions and Deletions Target Lineage-Defining Genes in Human Cancers. Cell 168, 460–472.e14 (2017). [DOI] [PMC free article] [PubMed] [Google Scholar]
- 60.Servant N et al. HiC-Pro: an optimized and flexible pipeline for Hi-C data processing. Genome Biol 16, 259 (2015). [DOI] [PMC free article] [PubMed] [Google Scholar]
- 61.Cao Y et al. Accurate loop calling for 3D genomic data with cLoops. Bioinformatics 36, 666–675 (2019). [DOI] [PubMed] [Google Scholar]
- 62.Yu M et al. RNA polymerase II–associated factor 1 regulates the release and phosphorylation of paused RNA polymerase II. Science 350, 1383–1386 (2015). [DOI] [PMC free article] [PubMed] [Google Scholar]
Associated Data
This section collects any data citations, data availability statements, or supplementary materials included in this article.
Supplementary Materials
Data Availability Statement
All sequencing data generated for this study is available in Gene Expression Omnibus (accession number GSE159314).


