. 2022 Dec 28;11:e81856. doi: 10.7554/eLife.81856

Figure 1. Design and validation of ultra-compact dual-single guide RNA (sgRNA) CRISPR interference (CRISPRi) libraries.

(A) Schematic of growth screen used to compare single- and dual-sgRNA libraries. (B) Schematic of dual-sgRNA library sequencing strategies. (C) Comparison of growth phenotypes for DepMap essential genes between single- and dual-sgRNA libraries. Sequencing libraries were prepared using the strategy labeled ‘Sequencing amplicon without IBC’ in panel B. Growth phenotypes are reported as γ (log2 fold-enrichment of Tfinal over T0, per doubling) and well correlated between libraries (r=0.91). Only values between –1 and 0.1 are shown. (D) Comparison of growth phenotypes for DepMap essential genes between single- and dual-sgRNA libraries. In the violin plot, the violin displays the kernel density estimate, the central white point represents the median, and the central black bar represents the interquartile range (IQR). (E) Design of final dual-sgRNA library. (F) Comparison of target gene knockdown by dual-sgRNA library versus Dolcetto library. Target gene knockdown was measured by single-cell RNA-sequencing (Perturb-seq). For each library, the ‘mean of 3 elements’ was calculated as the mean knockdown of all three elements targeting each gene. The ‘best of 3 elements’ represents the element with the best knockdown per each gene. (G) Comparison of target gene knockdown across elements in dual-sgRNA library versus Dolcetto. In the box plot, the box shows the IQR, the line dividing the box shows the median value, and the whiskers extend to show 1.5× the IQR. Outlier observations >1.5× IQR are not shown.

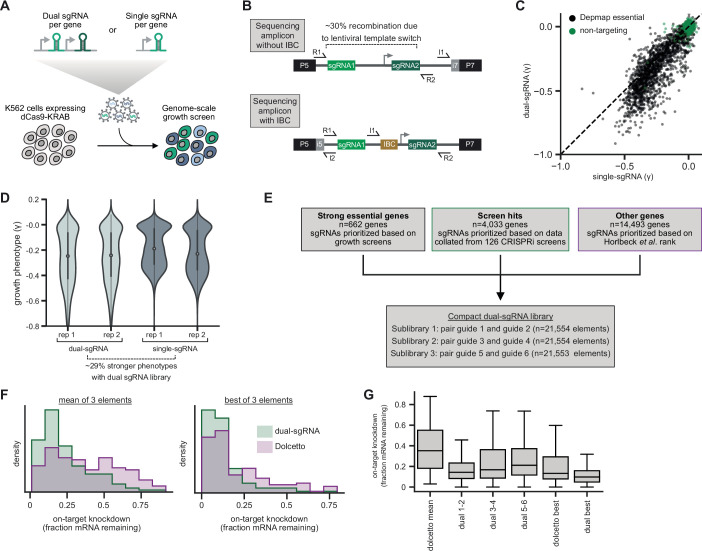
Figure 1.

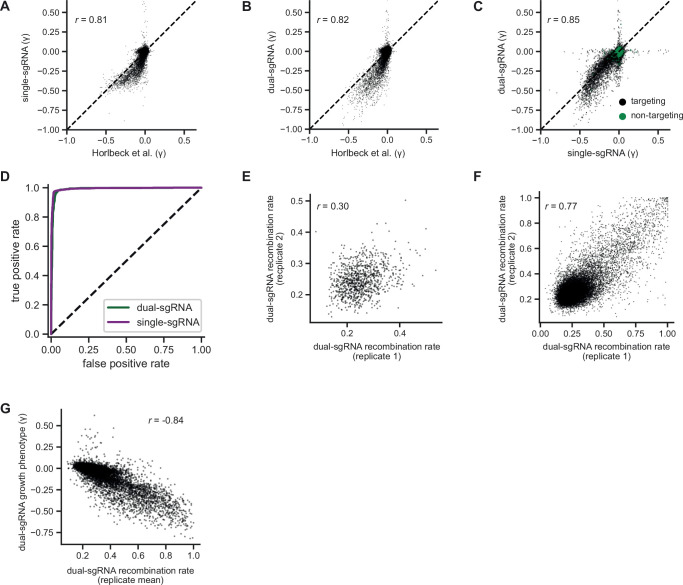
Figure 1—figure supplement 1. Additional comparisons of pilot single- and dual-single guide RNA (sgRNA) library screens.

Figure 1—figure supplement 1.

(A) Comparison of growth phenotypes for all elements between our pilot single-sgRNA library and Horlbeck et al. data, merged by gene name (n=20,228 elements). Growth phenotypes are reported as γ (log2 fold-enrichment of Tfinal over T0, per doubling) and correlated between experiments (r=0.82). (B) Comparison of growth phenotypes for all elements between our pilot dual-sgRNA library and Horlbeck et al. data, merged by gene name (n=20,228 elements). Growth phenotypes are reported as γ and correlated between experiments (r=0.83). (C) Comparison of growth phenotypes for all elements between our pilot single- and dual-sgRNA libraries, merged by gene name (n=21,239 with 20,228 targeting elements and 1011 non-targeting elements). Growth phenotypes are reported as γ and correlated between experiments (r=0.86). (D) Comparison of true and false-positive rates in single element screens. ‘Positives’ (n=1363 elements) were defined as genes with a K562 CRISPRi growth screen p-value <0.001 and γ<–0.05 (Horlbeck et al., 2016a), and ‘negatives’ were defined as non-targeting control sgRNA pairs (n=1011 elements). (E) Comparison of recombination rates for non-targeting dual-sgRNA elements between replicates of our K562 growth screen. Non-targeting elements with a growth phenotype (γ>0.05 or γ<−0.05) were excluded (n=973 elements). Recombination rates were weakly correlated between replicates (r=0.30). (f) Comparison of recombination rates for all dual-sgRNA elements between replicates of our K562 growth screen (n=20,387 elements). Recombination rates were strongly correlated between replicates (r=0.77). (G) Comparison of recombination rates and growth phenotypes for all dual-sgRNA elements in our K562 growth screen (n=20,387 elements). Growth phenotypes are reported as γ. Recombination rates were strongly anticorrelated with growth phenotypes (r=−0.84).