

Abstract
Background
The role of pharmacists has expanded beyond dispensing and packaging over the past two decades, and now includes ensuring rational use of drugs, improving clinical outcomes and promoting health status by working with the public and other healthcare professionals.
Objectives
To examine the effect of pharmacist‐provided non‐dispensing services on patient outcomes, health service utilisation and costs in low‐ and middle‐income countries.
Search methods
Studies were identified by electronically searching the Cochrane Central Register of Controlled Trials (CENTRAL) in The Cochrane Library (February 2010), MEDLINE (1949 to February 2010), Scopus (1960 to March 2010) and International Pharmaceutical Abstracts (1970 to January 2010) databases. An update of this review is currently ongoing. The search was re‐run September 2012 and the potentially relevant studies are awaiting classification.
Selection criteria
Randomised controlled trials, non‐randomised controlled trials, controlled before‐after studies and interrupted time series analyses comparing 1. pharmacist‐provided non‐dispensing services targeted at patients versus (a) the same services provided by other healthcare professionals, (b) the same services provided by untrained health workers, and (c) usual care; and 2. pharmacist‐provided non‐dispensing services targeted at healthcare professionals versus (a) the same services provided by other healthcare professionals, (b) the same services provided by untrained health workers, and (c) usual care in low‐ and middle‐income countries. The research sites must have been located in low or middle income countries according to World Bank Group 2009 at the time of the study, regardless of the location or the origin of the researchers.
Data collection and analysis
Two authors independently reviewed studies for inclusion in the review. Two review authors independently extracted data for each study. Risk of bias of the included studies was also assessed independently by two authors.
Main results
Twelve studies comparing pharmacist‐provided services versus usual care were included in this review. Of the 12 studies, seven were from lower middle income countries and five were from upper middle income countries. Eleven studies examined pharmacist‐provided services targeted at patients and one study evaluated pharmacist interventions targeted at healthcare professionals. Pharmacist‐provided services targeting patients resulted in a small improvement of clinical outcomes such as blood pressure (‐25 mm Hg/‐6 mm Hg and ‐4.56 mm Hg/‐2.45 mm Hg), blood glucose (‐39.84 mg/dl and ‐16.16 mg/dl), blood cholesterol (‐25.7 mg/dl)/ triglyceride levels (‐80.1 mg/dl) and asthma outcomes (peak expiratory flow rate 1.76 l/min). Moreover, there was a small improvement in the quality of life, although four studies did not report the effect size explicitly. Health service utilisation, such as rate of hospitalisation and general practice and emergency room visits, was also found to be reduced by the patient targeted pharmacist‐provided services. A single study examined the effect of patient targeted pharmacist interventions on medical expenses and the cost was found to be reduced. A single study that examined pharmacist services that targeted healthcare professionals demonstrated a very small impact on asthma symptom scores. No studies assessing the impact of pharmacist‐provided non‐dispensing services that targeted healthcare professionals reported health service utilisation and cost outcomes. Overall, five studies did not adequately report the numerical data for outcomes but instead reported qualitative statements about results, which prevented an estimation of the effect size.
Studies for the comparison of patient targeted services provided by pharmacists versus the same services provided by other healthcare professionals or untrained healthcare workers were not found. Similarly, studies for the comparison of healthcare professional targeted services provided by pharmacists versus the same services provided by other healthcare professionals or untrained healthcare workers were not found.
Authors' conclusions
Pharmacist‐provided services that target patients may improve clinical outcomes such as management of high glucose levels among diabetic patients, management of blood pressure and cholesterol levels and may improve the quality of life of patients with chronic conditions such as diabetes, hypertension and asthma. Pharmacist services may reduce health service utilisation such as visits to general practitioners and hospitalisation rates. We are uncertain about the effect of educational sessions by pharmacists for healthcare professionals due to the imprecision of a single study included in this review. Similarly, conclusions could not be drawn for health service utilisation and costs due to lack of evidence on interventions delivered by pharmacists to healthcare professionals. These results were heterogenous in the types of outcomes measured, clinical conditions and approaches to measurement of outcomes, and require cautious interpretation. All eligible studies were from middle income countries and the results may not be applicable to low income countries.
Plain language summary
The effect of using pharmacists to provide services other than medicine dispensing in low‐ and middle‐income countries
Researchers in The Cochrane Collaboration conducted a review to evaluate the effect of using pharmacists to provide services other than medicine dispensing in low‐ and middle‐income countries. After searching for all relevant studies, they found 12 studies that met their requirements. Their findings are summarised below.
The use of pharmacists to provide services other than dispensing medication
Traditionally, the main role of the pharmacist has been to prepare and dispense medicines. Recently, however, the number of tasks that are expected of them has grown.They are now often expected to make sure that patients use their medicines properly, help patients solve medicine‐related problems and to give health information that can help patients improve their health.
All of the studies in this review took place in middle income countries, either at outpatient departments, community pharmacies or primary healthcare centres.
In 11 of the studies, pharmacists gave education and counselling to patients with chronic illnesses such as asthma and diabetes. Pharmacists gave the patients information about how to use their medicines properly and about possible side effects of the medicines, and helped them to identify and solve problems with their medicines. They also gave the patients information about the disease and advice about self‐management and the importance of a healthy lifestyle. The patients who were given these services were compared to patients who were given the usual pharmacist services without education or counselling.
In one study, pharmacists gave education to general practitioners (GPs) about care of children with asthma. These GPs were compared to GPs who were given usual pharmacist services.
No studies were found where pharmacist‐provided services were compared to the services provided by other health workers.
What happens when pharmacists provide services other than dispensing medication?
When pharmacists give education and counselling to patients with chronic illnesses:
· patients may experience small improvements in health outcomes such as blood pressure levels and glucose levels (low quality evidence),
· patients may use health services less (for instance fewer visits to the doctor, fewer stays in hospital) (low quality evidence),
· patients probably experience small improvements in quality of life (moderate quality evidence),
· patients’ medication costs may be lower (low quality evidence).
When pharmacists give education and counselling about asthma care to GPs:
· their patients may experience slightly fewer asthma symptoms (low quality evidence).
Summary of findings
Background
Over the past two decades the role of pharmacists has expanded beyond medication dispensing (for example giving medicines to patients), packaging (for example counting and putting pills in a bottle to be given to patients) and compounding (WHO 1998). Pharmacists are increasingly considered as a part of the healthcare system whether in community pharmacies, primary health centres or hospitals (Ghani 2010; WHO 1998).
In light of factors such as socio‐economic status; lifestyle; accessibility; management of acute, chronic and recurrent illness; public health and environmental factors; health sector reforms; availability of new products; and demographic and epidemiological factors there is a trend towards self‐medication and self‐care (WHO 1998). Pharmacists can play an important role in self‐medication and self‐care by providing and interpreting information regarding appropriate health care and medication choices and they promote the rational use of drugs. Furthermore, increased health demand, an increasingly complex range of medicine uses, and poor adherence to prescribed medication have provided additional opportunities for pharmacists to deliver patient targeted services (WHO 2006). The concept of “the seven star pharmacists” was developed by a WHO consultative group, which states that the well‐rounded pharmacist should be a compassionate caregiver, decision‐maker, active communicator, lifelong learner and good manager, and should possess the qualities of a good leader, teacher and researcher (WHO 1997). According to Hepler and Strand 1990, pharmacists are responsible for providing ‘pharmaceutical care’ to improve patients' quality of life; this involves a) identifying potential and actual drug‐related problems, b) resolving actual drug‐related problems, and c) preventing potential drug‐related problems (Hepler 1990). Recently, the concept of medication therapy management (MTM) has been used to further describe collaborative methods to achieve optimal patient outcomes and promote safe and effective medicine use (APAaNAoCDS 2008). MTM services are focused on patient centred care rather than product centred care and are targeted to prevent medication‐related morbidity and mortality. They can be considered as an activity when pharmacists (including but not limited to hospital and community pharmacists) are reimbursed for reviewing patients’ medications and advising them and their carers about necessary changes but without dispensing. MTM services include a medication regimen review, the provision of personal medication records, the construct of a medication‐related action plan (which may include therapeutic recommendations, a provider referral), documentation and follow‐up as needed.
Various patient targeted services, which may be either drug or health‐related, are performed by pharmacists. Pharmacists can compile and maintain information on a patient’s drug history, assist physicians in the rational prescribing of drugs, ensure a patient's understanding of the dosing regimen and method of administration, and help in improving patient adherence (Lipton 1994; WHO 1994). In addition, they may collect and maintain information on all medicines, particularly newly introduced medicines, and provide advice to all healthcare professionals, as necessary (Lipton 1992; WHO 1994). From a public health standpoint, pharmacists may be actively involved in health promotion campaigns like tobacco control; moderate alcohol use; nutrition and healthy lifestyle; routine immunization; management and prevention of infectious diseases such as HIV/AIDS, tuberculosis and diarrhoea; and in the management of mental health and other chronic diseases (Aderemi‐Williams 2007; Rosen 1978; WHO 1994).
Contrary to the situation in high income countries, pharmacists are underutilised for patient care in low‐ and middle‐income countries; and the importance of their role as healthcare professionals in hospitals, community pharmacies and healthcare teams has not been well recognized (Anderson 2002). Moreover, although the World Health Organization (WHO) is trying to promote Good Pharmacy Practice (GPP) in all countries, pharmacy practice in low‐ and middle‐income countries is very poor as compared to that in high income countries (Ghani 2010, Smith 2009). GPP is the national standard set for “the promotion of health, the supply of medicines, medical devices, patient self‐care, and improving prescribing and medicine use by pharmacists’ activities” (FIP 1997). Major barriers for effective pharmacy practice in low‐ and middle‐income countries include an acute shortage of qualified pharmacists, the preference of pharmacists to work in urban areas rather than rural areas, failure to implement the separation of dispensing practices between doctors’ clinics and pharmacies, especially in countries where the pharmacists are not the sole dispenser and doctors are allowed to dispense as well, weak regulatory enforcement of drug sales, irrational use of medicines, reliance on untrained health workers for delivery of services, and general poverty (Fabricant 1987; Geest 1987; WHO 1994). Furthermore a focus on profits, which is characteristic of certain dispensing practices, rather than the provision of optimal health care promotes irrational use and prescribing of drugs; this issue may not be unique to low‐ and middle‐income countries. The marketing strategies (the push) of pharmaceutical companies to promote sales combined with the demand for (the pull) or the desirability of modern medicines and their role in preventing diseases are also causes of the irrational use of drugs (Fabricant 1987; Geest 1987; le Grand 1999; WHO 1994). In addition, cultural norms such as the prestige of physicians and the prevalence of polypharmacy, including combining traditional medicines with allopathic medicines, contribute to the irrational use of drugs. The public health consequences of this kind of haphazard drug utilisation result in lethal effects due to inappropriate self‐medication (for example underdosing or overdosing, inappropriate medication selection), antibiotic resistance due to overusage as well as undertherapeutic‐dosage usage, drug dependence due to the use of tranquillizers and painkillers, and high risk of infection due to the improper usage of injections (Geest 1982; Kamat 1998; le Grand 1999). With the serious and widespread public health problem of the irrational use of medicines (Holloway 2006) and the need to improve health outcomes, it is necessary to examine the impact of pharmacists' clinical patient care interventions in addition to standard dispensing and compounding in low‐ and middle‐income countries (WHO 2009).
Why it is important to do this review
Previous systematic reviews have focused on high and low‐ and middle‐income countries, specific settings such as ambulatory care, acute care and long‐term care, and specific patient groups (Beney 2000; Blenkinsopp 2003; Christensen 2006; Horn 2006; Kaboli 2006; Kane 2003; Nkansah 2010; Royal 2006; Singhal 1999; Tully 2000). None of these reviews have evaluated the effects of pharmacist interventions on patient outcomes, health service utilisation and costs by focusing solely on low‐ and middle‐income countries.
The protocol for this review was based on the Cochrane review entitled “Expanding the roles of outpatient pharmacists: effects on health service utilization, costs, and patient outcomes” published in 2000, which included eligible studies published from 1966 to 1999 (Beney 2000) and the updated version of that review, which included studies published up until 2008 (Nkansah 2010). However, the updated review (Nkansah 2010) included only randomised controlled trials whereas the original review (Beney 2000) included a broad range of study designs such as controlled before and after studies, non‐randomised controlled trials and interrupted time series analyses. Few studies (Gonzalez‐Martin 2003; Paulos 2005; Sookaneknun 2004) included in the reviews (Beney 2000; Nkansah 2010) were from low‐ and middle‐income countries and the applicability of the findings of those reviews to low‐ and middle‐income countries are uncertain. Our review includes a broad range of study designs such as randomised controlled trials, controlled before and after studies, non‐randomised controlled trials and interrupted time series analyses.This review, differs from the other two reviews (Beney 2000; Nkansah 2010) by (i) focusing solely on low‐ and middle‐income countries, according to the World Bank’s country classification (World Bank Group 2009), and (ii) by searching for studies with a variety of designs that were published up until January 2010 that met the inclusion criteria.
Objectives
The aim of this systematic review was to evaluate the effect of pharmacist‐provided non‐dispensing services on patient outcomes, health service utilisation and costs in low‐ and middle‐income countries.
The following main research questions were examined.
1. In low‐ and middle‐income countries, what are the effects of the delivery of patient targeted services by pharmacists on patient outcomes, the use of health services and costs compared to:
a. delivery of the same services by other healthcare professionals?
b. delivery of the same services by untrained health workers?
c. usual care?
2. In low‐ and middle‐income countries, what are the effects of the delivery of healthcare professional targeted services by pharmacists on patient outcomes, the use of health services and costs compared to:
a. delivery of the same services by other healthcare professionals?
b. delivery of the same services by untrained health workers?
c. usual care?
Methods
Criteria for considering studies for this review
Types of studies
All studies that met the following inclusion criteria were included in this review.
1. Randomised controlled trials (RCT) randomising either patients or pharmacists or practices (pharmacies) or geographical areas
2. Non‐randomised controlled trials (NRCT)
3. Controlled before‐after studies (CBA) (with at least two intervention sites and two control sites)
4. Interrupted time series analyses (ITS) (with clearly defined dates and at least three data points before as well as after the intervention)
Types of participants
The participants included in this review were pharmacists (or pharmacies) delivering services in outpatient settings other than or in addition to drug compounding and dispensing. Studies analysing services to patients in hospitals or nursing homes were excluded. Studies of pharmacists delivering services to an outpatient pharmacy attached to a clinic or hospital, community pharmacies or primary health centres were included in the review. In studies that were randomised by pharmacy or geographical area, the pharmacy services could have been delivered by pharmacists or pharmacy technicians. Therefore, the profession of the individuals who actually delivered the pharmacy services was determined. The research sites or pharmacies must had been located in low or middle income countries at the time of the study regardless of the location or the origin of the researchers. The low‐ and middle‐income countries were selected according to the World Bank’s country classification (World Bank Group 2009).
Types of interventions
All pharmacist‐provided non‐dispensing services were considered as an intervention. However, there is no agreed upon terminology that defines pharmacist‐provided non‐dispensing services, and various terms have been used interchangeably to refer to the same services for example non‐distributive or non‐dispensing services. In this review, this term refers to drug‐related patient targeted services delivered by pharmacists other than drug compounding and dispensing. Other services not related to pharmaceutical products, such as the selling of cosmetics, were excluded. To be included, educational or counselling sessions had to be extended or patients had to be continuously followed‐up compared to the one to two minute basic counselling typically offered. The content of each intervention including recipients, format, source, timing, setting, and cost were noted, when available.
Types of outcome measures
Our outcomes of interest included patient outcomes (clinical outcomes, quality of life) and healthcare process outcomes such as health service utilisation (rate of hospitalisation and number of general physician visits) and costs. Subjective outcomes such as self‐reporting of symptom or satisfaction level were not included in this review. Studies were included only if they reported objective measurement of an outcome. If the study measured only subjective outcomes, it was excluded. We did not include adverse effects as we did not anticipate that any studies would measure them.
Search methods for identification of studies
Studies were identified by electronically searching the following databases: the Cochrane Central Register of Controlled Trials (CENTRAL) in The Cochrane Library (2010), MEDLINE (1949 to September 2010), Scopus (1960 to 2010) and International Pharmaceutical Abstracts (1970 to January 2010). An update of this review is currently ongoing. The search was re‐run September 2012 and the potentially relevant studies are awaiting classification (Characteristics of studies awaiting classification). In MEDLINE, a broad search was conducted by using the MeSH headings ‘pharmacy’, ‘pharmacist’ and various publication types such as ‘randomised controlled trial’, ‘controlled clinical trial’ along with synonyms for ‘low or middle‐income countries’ and names of low‐ and middle‐income countries according to the World Bank’s list (World Bank Group 2009). The search strategies were modified according to the database indicated in Appendix 2. In addition, the reference lists of all eligible studies were checked.
Data collection and analysis
Selection of studies
Two review authors independently selected the trials to be included in the review. Disagreements were resolved by discussion of the articles by at least two of the authors of the review. Two phases of study selection were performed. Firstly, only titles and abstracts were assessed for inclusion. In the next phase, the full texts of potentially eligible studies were reviewed thoroughly. Only studies excluded in the second phase were presented in the Characteristics of excluded studies, with the reason for exclusion. In the case of ambiguity, further information was sought from the authors to make a decision about eligibility. References were managed using Endnote X3.
Data extraction and management
Data from the eligible studies were independently extracted by two authors using an electronic data extraction checklist. The included studies are presented in the Characteristics of included studies table. Studies that were excluded are presented in the Characteristics of excluded studies table with the reasons for exclusion.
Assessment of risk of bias in included studies
Risk of bias was assessed independently by two authors using the Cochrane Effective Practice and Organisation of Care (EPOC) data extraction checklist for each included study design. The discrepancies were adjudicated by discussion of the studies.
1. Randomised controlled trials (RCTs) and controlled trials without random allocation (quasi‐RCTs): sequence generation; concealment of allocation (protection against selection bias); similar baseline outcome measurements, similar baseline characteristics, blinded assessment of outcome(s) (protection against detection bias); incomplete outcome data adequately addressed, protection against contamination, free from selective outcome reporting and free from other risks of bias.
2. Interrupted time series analyses (ITS): intervention independent of other changes, shape of the intervention effect pre‐specified, intervention unlikely to affect data collection, knowledge of the allocated interventions adequately prevented during the study, incomplete outcome data adequately addressed, study free from selective outcome reporting and study free from other risks of bias.
3. Controlled before and after studies (CBA): sequence generation; concealment of allocation (protection against selection bias); baseline outcome measurement similar, baseline characteristics similar, blinded assessment of primary outcome(s) (protection against detection bias); incomplete outcome data adequately addressed, protection against contamination; free from selective outcome reporting and free from other risks of bias.
The risk of bias for outcomes was summarized either as low risk of bias, high risk of bias or unclear risk of bias for each individual study. For included studies, the risk of bias characteristics are described in the Characteristics of included studies table.
Measures of treatment effect
Results for baseline (pre‐intervention) and end‐of‐study (post‐intervention) periods were reported, if available, in the Data and analyses tables. Where possible, pre‐post intervention differences for each outcome for the control and intervention groups and the difference in the pre‐post intervention change between study groups were calculated. For each outcome, statistical significance was provided in the significance column and, if available, whether the results were statistically significant were reported. The outcomes reported in each study are listed in the Characteristics of included studies table and the results for each outcome are reported in the Data and analyses tables.
Assessment of heterogeneity
As variations in outcomes and interventions were anticipated, the results were not statistically combined.
Sensitivity analysis
No sensitivity analysis was conducted as quantitative synthesis of results was not anticipated.
Results
Description of studies
The full texts of 77 studies were retrieved (Figure 1). Of these, two studies were multiple reports and 63 studies did not meet the review inclusion criteria. Twelve studies were included. All of these were randomised controlled trials (RCT). Of the 12 studies, seven were from lower middle income countries and five were from upper middle income countries. Details of the included studies are presented in the Characteristics of included studies table.
1.
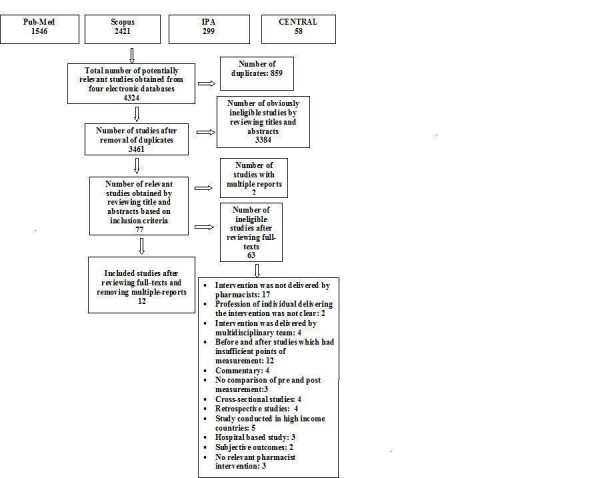
Prisma flow chart.
Characteristics of the interventions
Of the 12 included studies, 11 examined pharmacist interventions targeted at patients (Abdelhamid 2008; Adepu 2007; Arun 2008; Ebid 2006; Gonzalez‐Martin 2003; Lugo 2007; Paulos 2005; Petkova 2008; Petkova 2009; Sookaneknun 2004; Suppapitiporn 2005) and one study evaluated a pharmacist intervention targeted at healthcare professionals (Zwarenstein 2007).
All studies involved comparisons between pharmacist‐provided non‐dispensing services and usual care. Comparisons of pharmacist‐provided services targeted at patients versus services delivered by other healthcare professionals or untrained healthcare workers were not found. Similarly, comparisons of pharmacist‐provided services targeted at healthcare professionals versus services delivered by other healthcare professionals or untrained healthcare workers were not found. Eleven of 12 studies were randomised by patient and one study was cluster randomised by general practice.
In 11 studies targeted at patients, the main aim of the pharmacist intervention was patient education and counselling (Abdelhamid 2008; Adepu 2007; Arun 2008; Ebid 2006; Gonzalez‐Martin 2003; Paulos 2005; Petkova 2008; Petkova 2009; Lugo 2007; Sookaneknun 2004; Suppapitiporn 2005). The main content of educational sessions and counselling included information about the mechanism of disease and associated risk factors, pharmacotherapy (dosage, duration, route of administration, possible adverse effects of medications and training on using medication devices) and non‐pharmacological measures of controlling disease including lifestyle, diet modifications and self‐management. Four of 11 studies involved complete pharmaceutical care follow‐up by providing patient education; pharmaceutical therapy optimisation; monitoring of disease control; compliance assessment; identifying and resolving drug‐related problems; and maintaining manual records for each patient by recording personal data such as drug therapy, adherence to treatment, lifestyle, drug‐related problems and other clinical variables such as blood pressure and level of triglycerides (Ebid 2006; Lugo 2007; Paulos 2005; Sookaneknun 2004). Specifically designed educational booklets explaining the disease, medication and lifestyle modifications were also provided to patients in seven of 11 studies (Adepu 2007; Ebid 2006; Lugo 2007; Paulos 2005; Petkova 2008; Sookaneknun 2004; Suppapitiporn 2005). Counselling using a booklet and a special medication container were also provided to the patients in one study (Suppapitiporn 2005). Details are in Table 3.
1. Comparison between interventions (Analysis 1c).
| Patient Outcomes (∆I ‐ ∆C) | Health Service utilisation (∆I ‐ ∆C) | Costs (∆I ‐ ∆C) | ||||||
| Intervention | Blood Glucose Outcome | Blood Pressure (BP) Outcome | Blood Cholesterol | Asthma/COPD outcome | Arthritis Outcome | Rate of Hospitalisation | GP Visits | Medication Cost |
| Counselling/ Patient Education |
Arun et al 2008 Fasting plasma glucose: ‐39.84 mg/dl † Suppapitiporn et al 2005 Fasting Plasma Glucose (FPG) mg%: ‐19.26† HbA1c (mg %): ‐1.23† |
No studies |
Gonzalez et al 2003 PAQLQ score emotion: 1.3† activities:2.1† symptoms: 1.7† Spirometric values FVC: ‐.14‡ FEV1: ‐.1‡ |
No studies | No studies | No studies | No studies | |
| Counselling/ Patient Education + Booklet |
Adepu et al 2007 Random Blood Glucose level (BGL): ‐53.71 mg/dl QOL significantly improved in I group as compared to C group * Suppapitiporn et al 2005 Fasting Plasma Glucose (FPG) mg%: ‐10.44† HbA1c (mg %): ‐.99† |
No studies | No studies |
Petkova et al 2008 PEF (l/min.): 1.76† QOL: 0.61† |
Petkova et al 2009 Small but statistically significant improvement in QOL (Arthritis interference in patient’s daily routine) in I group as compared to C group* |
Petkova et al 2008 <2‐3 times: 19.2%† >6 times: ‐4.6%† |
Petkova et al 2008 ‐15.7%† |
No studies |
|
Counselling + Drug Review |
No studies | No studies | No studies |
Abdeilhamid et al 2008 non‐significant improvement in Peak Expiratory Flow rate* |
No studies |
Abdeilhamid et al 2008 decreased significantly in intervention group (P<0.05) while non‐significantly increased (P>0.05) in control group |
No studies | No studies |
| Pharmaceutical care plan with scheduled follow‐up +Patient education +Booklet | No studies |
Lugo de Ortellado et al 2007 Systolic BP: ‐25 mmHg† Diastolic BP: ‐‐6†mmHg Sookaneknun et al 2004 Systolic BP: ‐4.56 † mmHg Diastolic BP: ‐2.45 mmHg† |
Paulos et al 2005 Blood Cholesterol : ‐25.7 mg/dl† Blood Triglyceride Systolic BP : ‐80.1 mg/dl † QOL: significant improvement* |
Ebid et al 2006 HRQOL: Significant improvement in I group as compared to C group for both patients of asthma and COPD* |
No studies |
Ebid et al 2006 Number of ER visits and hospitalisation for both patients of asthma and COPD: Significantly decreased in I group as compared to C group* |
Ebid et al 2006 Number of visits to PCs or OPCs: Significantly decreased in I group as compared to C group for both patients of asthma and COPD* |
Ebid et al 2006 Significantly reduced in I group as compared to C group for both patients of asthma and COPD* |
| Counselling + Booklet+ Special medication container |
Suppapitiporn et al 2005 Fasting Plasma Glucose (FPG) mg%: ‐26.25 † HbA1c (mg %): ‐1.08† |
No studies | No studies | No studies | No studies | No studies | No studies | No studies |
| Counselling + Special medication container |
Suppapitiporn et al 2005 Fasting Plasma Glucose (FPG) mg%: ‐7.57† HbA1c (mg%): ‐0.75† |
No studies | No studies | No studies | No studies | No studies | No studies | No studies |
| Notes | I = Intervention (∆I ‐ ∆C): Change due to intervention (intervention versus control group) C = Control * Exact value not reported †Significant ‡ Not significant QOL: Quality of Life |
|||||||
Four of 11 studies were conducted in the outpatient departments of hospitals (Abdelhamid 2008; Ebid 2006; Gonzalez‐Martin 2003; Suppapitiporn 2005), five studies took place in a community pharmacy (Adepu 2007; Lugo 2007; Paulos 2005; Petkova 2008; Petkova 2009), one study was conducted in primary health centres (Arun 2008; Sookaneknun 2004) and one study took place in both a primary health centre and community pharmacy (Sookaneknun 2004). The duration of the intervention ranged from 20 to 50 minutes with three to 11 interventions conducted over a period of nine weeks to six months.
One of 12 studies targeted healthcare professionals. In this study, pharmacists provided educational sessions to general practitioners (GPs) which contained eight key messages aimed at improving diagnosis, prescribing and follow‐up care for children with asthma. The intervention was academic detailing and tools such as visual aids were used (Table 4). Educational sessions were conducted in general practices. The duration of the intervention was 30 minutes and two interventions were conducted over 12 weeks (Zwarenstein 2007).
2. Comaprison between interventions (Analysis 2c).
| Patient Outcomes (∆I ‐ ∆C) | Health Service utilisation (∆I ‐ ∆C) | Costs (∆I ‐ ∆C | ||||||
| Intervention | Blood Glucose Outcome | Blood Pressure (BP) Outcome | Blood Cholesterol | Asthma/COPD outcome | Arthritis Outcome | Rate of Hospitalisation | GP Visits | |
| Academic detailing to GP + visual aids | No studies | No studies | No studies |
Zwarenstein et al 2007 Asthma symptom score: ‐0.85 † |
No studies | No studies | No studies | No studies |
| Notes | I = Intervention (∆I ‐ ∆C): Change due to intervention (intervention versus control group) C = Control * Exact value not reported †Significant ‡ Not significant |
|||||||
The control group received usual care in each of the 12 studies. Usual care entailed traditional care provided by pharmacies or primary healthcare units without comprehensive pharmaceutical care and follow‐up or patient education or counselling. However, in one of the studies the control group received the intervention at the end of the study ( Adepu 2007). In one study there was one control group and four intervention groups (Suppapitiporn 2005). In this study, diabetic drug counselling was provided by a pharmacist to all intervention groups; one group had an additional diabetes booklet, another had special medication containers and the third group was provided with diabetes education, a diabetes booklet and special medication containers.
Characteristics of providers delivering the intervention
In all studies, the interventions were performed either by practicing pharmacists or research pharmacists. In four studies, a single pharmacist provided the intervention (Abdelhamid 2008; Paulos 2005; Sookaneknun 2004, Suppapitiporn 2005; Zwarenstein 2007). However, the number of pharmacists was not clear in most of the studies (Adepu 2007; Arun 2008; Ebid 2006; Gonzalez‐Martin 2003; Lugo 2007). In two studies the intervention was delivered by both a pharmacist and pharmacy students who had passed an examination in pharmaceutical care (Petkova 2008; Petkova 2009).
Target population
All 11 studies targeted patients based on their disease state. Three targeted patients with asthma (Abdelhamid 2008; Gonzalez‐Martin 2003; Petkova 2008), three selected patients suffering from type‐2 diabetes mellitus (Adepu 2007; Arun 2008; Suppapitiporn 2005) and one targeted patients with asthma or chronic obstructive pulmonary disease (COPD) (Ebid 2006). Lugo 2007; Paulos 2005; Petkova 2009 and Sookaneknun 2004 selected patients with hypertension, dyslipidemia, rheumatoid arthritis or osteoarthritis and hypertension respectively.
In a study examining pharmacist interventions with GPs, participants were selected based on their location, in Mitchells Plain, Cape Town South Africa (Zwarenstein 2007). The main aim of the study was to improve diagnosis, prescribing and follow‐up care provided by GPs for children with asthma.
The number of participants ranged from 21 to 360 patients and 43 general practices. One patient targeted study included pediatric patients and another study targeted participants aged 14 years and over. The other studies targeted adults aged 18 years and over.
Characteristics of countries
Single studies were conducted in Sudan, Egypt, Paraguay and South Africa (Characteristics of included studies). In addition, two studies were conducted in each of Chile, Thailand, Bulgaria and India. Of the 12 studies, seven were from lower middle income countries and five were from upper middle income countries. Eligible studies conducted in low income countries were not identified (Characteristics of excluded studies).
Risk of bias in included studies
The analysis of the risk of bias present in the included studies is presented in the Risk of bias in included studies table under each study in the section presenting the Characteristics of included studies. A graphical representation of risk of bias is given in Figure 2 and Figure 3.
2.
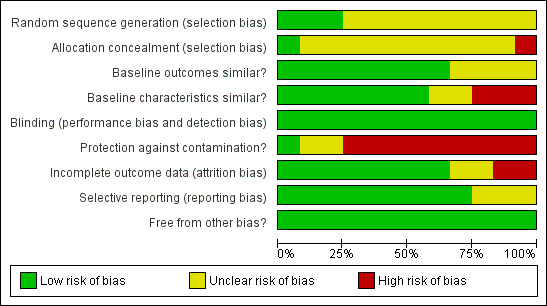
Risk of bias graph: review authors' judgements about each risk of bias item presented as percentages across all included studies.
3.
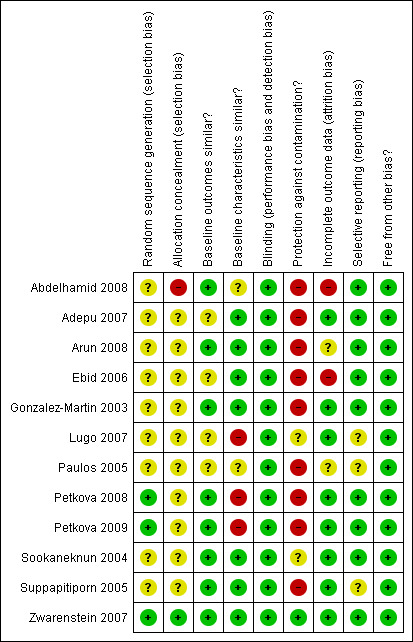
Risk of bias summary: review authors' judgements about each risk of bias item for each included study.
Eleven of the 12 studies in this review had a risk of bias. Only three of 12 studies had an adequately generated sequence for randomisation (Petkova 2008; Petkova 2009; Zwarenstein 2007). Ten of 12 studies did not explicitly describe whether allocation concealment was done (Adepu 2007; Arun 2008; Ebid 2006; Gonzalez‐Martin 2003,Lugo 2007; Paulos 2005; Petkova 2008; Petkova 2009; Sookaneknun 2004; Suppapitiporn 2005) and in one study an on‐site computer system was used for the allocation concealment (Zwarenstein 2007). Baseline measurements of outcomes were comparable in only four of 12 studies (Abdelhamid 2008; Arun 2008; Gonzalez‐Martin 2003; Petkova 2008), however it was unclear in the other four studies (Adepu 2007; Ebid 2006; Lugo 2007; Paulos 2005). Baseline characteristics were similar between the intervention group and control group in seven of 12 studies (Adepu 2007; Arun 2008; Ebid 2006; Gonzalez‐Martin 2003; Sookaneknun 2004; Suppapitiporn 2005; Zwarenstein 2007), however it was unclear in the other two studies (Abdelhamid 2008; Paulos 2005). Furthermore, there was high risk of bias for the protection against contamination in nine studies (Abdelhamid 2008; Adepu 2007; Arun 2008; Ebid 2006; Gonzalez‐Martin 2003; Paulos 2005; Petkova 2008; Petkova 2009; Suppapitiporn 2005) and unclear in two studies (Lugo 2007; Sookaneknun 2004). As only objective outcomes were included in this review, all studies were coded as having blinded assessment of outcomes. There was high risk of bias in assessment of outcome data in two of 12 studies (Abdelhamid 2008; Ebid 2006), unclear in two studies (Arun 2008; Paulos 2005) and at low risk of bias in the rest of the studies. The absence of selective reporting of results could not be assessed in Gonzalez‐Martin 2003, Paulos 2005 and Suppapitiporn 2005 as the outcomes to be measured was not listed in the methods sections of the studies. Other forms of bias were not identified in all 12 studies.
Effects of interventions
for the main comparison.
| 1(c) Comparison of the delivery of patient targeted services by pharmacists versus usual care | |||
|
Patient or population: Pharmacies or pharmacists delivering services in outpatient settings and patients with various diseases* Settings: Chile (2), Thailand (2) , Bulgaria (2), India (2), Sudan (1), Egypt(1) and Paraguay (1) Intervention: Counselling/Patient Education (3), Counselling/Patient Education + Booklet (4), Counselling + Drug Review (1), Pharmaceutical plan with scheduled follow‐up + Patient education + Booklet (4), Counselling + Booklet + Special medical container (1), Counselling + Special medical container (1) Comparison: Usual care provided by pharmacists | |||
| Outcomes | Impact | No of Participants (studies) | Quality of the evidence (GRADE) |
|
Clinical outcomes (fasting blood glucose,random blood glucose, glycosylated haemoglobin, systolic blood pressure, blood cholesterol, peak expiratory flow rate; follow‐up: 16 to 24 weeks) (Abdelhamid 2008; Adepu 2007; Arun 2008; Ebid 2006; Gonzalez‐Martin 2003; Lugo 2007; Paulos 2005; Petkova 2008; Sookaneknun 2004; Suppapitiporn 2005; Zwarenstein 2007) |
Small improvements in outcomes | 1791 (10) |
⊕⊕⊝⊝ low1 |
|
Quality of life (measured with asthma specific assessment form, brief pain inventory for arthritis, paediatric asthma quality of life questionnaire, SF‐36, diabetes dependent quality of life questionnaire, health related quality of life for asthma/COPD; follow‐up 9 to 24 weeks) (Abdelhamid 2008; Arun 2008; Ebid 2006; Gonzalez‐Martin 2003; Paulos 2005; Petkova 2008; Petkova 2009) |
Small improvements in quality of life | 777 (7) |
⊕⊕⊕⊝ moderate2 |
|
Health service utilisation (rate of hospitalisation, emergency room visits, general practitioner visits; follow‐up: 18 to 20 weeks) (Abdelhamid 2008, Ebid 2006; Petkova 2008; Petkova 2009) |
Decreased health service utilisation | 590 (4) |
⊕⊕⊝⊝ low1 |
|
Cost (follow‐up: 6 months) (Ebid 2006) |
Reduction in cost |
350 (1) |
⊕⊕⊝⊝ low3 |
| GRADE Working Group grades of evidence High quality: Further research is very unlikely to change our confidence in the estimate of effect. Moderate quality: Further research is likely to have an important impact on our confidence in the estimate of effect and may change the estimate. Low quality: Further research is very likely to have an important impact on our confidence in the estimate of effect and is likely to change the estimate. Very low quality: We are very uncertain about the estimate. | |||
1. The quality of evidence was downgraded to 'low' because of study limitations (risk of bias) in most of the studies and due to the inconsistencies (heterogeneous outcome)
2. The quality of evidence was downgraded to 'moderate' due to the inconsistencies (heterogeneous outcome)
3. The quality of evidence was downgraded to 'low' because of the inclusion of a single study and imprecision round the estimate of effect .
2.
| 2(c) Comparison of the delivery of healthcare professional targeted services by pharmacists versus usual care | |||
|
Patient or population: Pharmacies or pharmacists delivering services in outpatient settings and asthmatic patients Settings: South Africa (1) Intervention: Educational sessions to general practitioners (GPs) aimed at improving diagnosis, prescribing and follow‐up care Comparison: Usual services | |||
| Outcomes | Impact | No of Participants (studies) | Quality of the evidence (GRADE) |
| Patient Outcome Asthma symptom score (0‐9 score, where 9 indicates maximum impairment and 0 indicates no impairment) (follow‐up: 3 months) |
Mean difference of asthma symptom score was ‐0.85 between intervention and control group | 43 general practices/ 318 asthmatic children (1) |
⊕⊕⊝⊝ low1 |
| Health Service Utilisation | No Studies | ||
| Cost | No Studies | ||
| GRADE Working Group grades of evidence High quality: Further research is very unlikely to change our confidence in the estimate of effect. Moderate quality: Further research is likely to have an important impact on our confidence in the estimate of effect and may change the estimate. Low quality: Further research is very likely to have an important impact on our confidence in the estimate of effect and is likely to change the estimate. Very low quality: We are very uncertain about the estimate. | |||
1.The quality of evidence was downgraded to 'low' due to imprecision and only one study included.
All included outcomes are listed in the Characteristics of included studies table and the Data and analyses tables.
No studies were identified that met the criteria for comparison of the delivery of patient targeted services by: (a) pharmacists versus other healthcare professionals, and (b) pharmacists versus untrained health workers.
Comparison of the delivery of patient targeted services by pharmacists versus usual care
Eleven of 12 studies that compared the effect of pharmacist interventions targeted at patients versus usual care were included in this review. Detailed descriptions are presented in Analysis 1.1.
1.1. Analysis.
Comparison 1 (c) Comparison of the delivery of patient targeted services by pharmacists versus usual care, Outcome 1 Outcomes.
| Outcomes | |||||||
|---|---|---|---|---|---|---|---|
| Study | Outcomes |
Pre‐ Intervention (intervention vs. control group) |
Post‐ Intervention (intervention vs.control group) |
Change due to intervention (intervention vs. control group) |
Result‐interval(ΔI‐ΔC) | Significance | Notes |
| Abdelhamid 2008 | PATIENT 1) Peak expiratory flow rate |
not reported | not reported | not reported | non‐sig.** | p>0.05 | *calculated from reported data **exact value not reported |
| Abdelhamid 2008 | PROCESS 1) Rate of hospitalisation |
not reported | not reported | not reported | decreased significantly in intervention group (p<0.05) while non‐significantly increased (p>0.05) in control group | p<0.05† | †p‐value for intervention vs. control at the end of study |
| Adepu 2007 | PATIENT 1) Blood Glucose level(BGL) 2) ADDQOL score |
198.31 mg/dl vs 173.6 mg/dl not reported |
142 mg/dl vs 171 mg/dl not reported |
‐56.31 vs ‐2.6 not reported |
‐53.71 mg/dl Significant improvement in intervention group as compared to control group † |
p<0.01* p<0.001* |
†exact value not reported * statistically significant |
| Adepu 2007 | PROCESS n/a |
||||||
| Arun 2008 | PATIENT 1) Fasting Plasma glucose level (mg/dl) 2) Over all Health related Quality of life (HRQoL) |
140.04 (24.16) vs 134.38 (20.46) 11.70 vs. 11.87 |
115.1 vs 149.28 16.94 vs. 11.66 |
‐24.94±12.54 vs.14.9±11.24 5.24 vs. ‐0.21 |
‐39.84† 5.45† |
p=0.0001* not reported |
*Statistically significant ‡not significant †calculated from reported data |
| Arun 2008 | PROCESS n/a |
||||||
| Ebid 2006 | PATIENT Patients with COPD 1) HRQOL a.General Health b.Unhealthy days (physically) c. Unhealthy days (mentally) d. Days of activity limitation 2. PEFR,% predicted Asthmatic patients 1) HRQOL a. General Health b. Unhealthy days (physically) c. Unhealthy days (mentally) d. Days of activity limitation 2) PEFR,% predicted |
a. not reported b.not reported c.not reported d. not reported 2.51.2± 8.6 vs 50.3 ±8.5 a. not reported b. not reported c.not reported d.not reported 2. not reported |
a. 3.8±0.9 vs. 1.9±0.7 b. 4.8±1.0 vs.8.1±2.3 c. 5.1±1.0 vs. 7.5±2.3 d. 6.2±1.3 vs. 12.0±3.1 2. 56.2±19.4 vs. 50.3±18.1 a. 4.1±0.7 vs. 2.5±0.9 b. 3.6±0.8 vs. 7.7±2.3 c. 4.5±0.9 vs. 6.8±2.3 d. 4.3±0.8 vs. 10.2±3.7 2. 87.2±11.2 vs.70.8±13.2 |
a. not reported b. not reported c. not reported d. not reported 2. 5.0 vs 0 a. not reported b. not reported c.not reported d. not reported 2. not reported |
a. not reported b. not reported c. not reported d. not reported 2. 5.0 a. not reported b. not reported c. not reported d. not reported 2. not reported |
a. p* b. p* c. p* d. p* 2. p† a. p* b. p* c. p* d. p* 2. p* |
*exact value not reported, however, significant improvement in the intervention group as compared to control group †Not significant |
| Ebid 2006 | PROCESS Patients with COPD 1) Number of visits to PCs or OPCs 2) Number of ER visits and hospitalisation 3) Costs for patient with COPD Asthmatic patients 1) Number of visits to PCs or OPCs 2) Number of ER visits and hospitalisation 3) Costs for patient with Asthma |
1) not reported 2) not reported 3) not reported 1) not reported 2) not reported 3) not reported |
1)1.8±0.4 vs. 3.9±0.9 2) 0.81±0.16 vs.1.9±0.68 3) 340±116 vs.902±342 1) 1.1±0.20 vs. 2.2±0.51 2) 0.34±0.10 vs. 0.73±0.27 3) 225±77 vs.491±177 |
1) not reported 2) not reported 3)not reported 1) not reported 2) not reported 3) not reported |
1)not reported 2) not reported 3) not reported 1) not reported 2) not reported 3) not reported |
1) p* 2) p* 3) p* 1) p* 2) p* 3) p* |
*exact value not reported, however, significant improvement in the intervention group as compared to control group |
| Gonzalez‐Martin 2003 | PATIENT 1) Paediatric asthma quality of life questionnaire (PAQLQ) score 1) emotion 2) activities 3) symptoms 2) Spirometric values a. FVC b. FEV1 |
1) 5.2±0.4 vs. 5.2±0.4 2) 3.8 ±0.3 vs. 4.0±0.3 3) 4.1±0.5 vs. 4.6±0.4 a. 3.08±0.97 vs. 2.66 ± 0.19 b. 2.41 ±0.76 vs. 2.34 ±0.22 |
1) 6.5 vs. 5.2‡ 2) 6 vs. 4.1‡ 3) 6 vs. 4.8‡ a. 3.13±1.14 vs. 2.85±0.29 b. 2.48±0.89 vs. 2.51±0.27 |
1) 1.3vs 0† 2) 2.2 vs. 0.1† 3) 1.9 vs. 0.2† a. 0.05 vs. 0.19† b. 0.07 vs. 0.17† |
1) 1.3
2) 2.1 3) 1.7 a. ‐.14 b. ‐.1 |
1) p<0.01 2) p<0.01 3) p<0.02 a. p=n.s* b. p=n.s* |
* exact p‐value not provided †calculated from reported data ‡data extrapolated from a graph |
| Gonzalez‐Martin 2003 | PROCESS n/a |
||||||
| Lugo 2007 | PATIENT 1) Systolic‐ blood pressure (mmHg) 2) Diastolic‐ blood pressure (mmHg)† 3) Percentage of patients in various categories of hypertension † |
1) 147 vs. 148 2) 89 (intervention group) 3) 45% in stage II, 42% in stage I, 9% in pre‐hypertension and 3% in normal (intervention group) |
1) 128 vs. 154 2) 83 (intervention group) 3) 9% in stage II, 45% in stage I, 39% in pre‐hypertension and 6% in normal (intervention |
1) ‐19 vs. 6 2) ‐6 vs. 0 ** 3) ‐36% in stage II, ‐3% in stage II, 30% in pre‐hypertension and 3% in normal (intervention group) |
1) ‐25 2) ‐6 3) not reported |
1) p<0.05* 2) p<0.05* 3)p<0.0001*‡ |
‡p‐value for change in intervention group over study period *statistically significant **no change in control group reported †exact value for control group is not reported |
| Lugo 2007 | PROCESS n/a |
||||||
| Paulos 2005 | PATIENT 1) Blood Cholesterol level (mg/dl) 2)Triglyceride level (mg/dl) 3) % of patients with decrease in total cholesterol 4) % of patients with decrease in triglyceride level. 5) QOL index |
1) 205.1±44.7 vs. 203.2±40.6 2) 190.7±88.7 vs. 163.6±116. 3) not reported 4) not reported 5) not reported |
1) 178.1±31.1 vs. 199.1±37.6 2) 140.3±47.6 vs. 193.2±108.0 3) 72.8 vs. 33.3 4) 77.3 vs. 27.8 5) not reported |
1) ‐27.1±41.1 vs. ‐1.4±37.2 2)‐50.5±80.3 vs. 29.6±118.5 3) not reported 4) not reported 5) not reported |
1) ‐25.7 2) ‐80.1 3) not reported 4) not reported 5) Significant improvement in intervention as compared to control |
1) p=0.0266* 2) p=0.0169* 3) not reported 4) not reported 5)p<0.002† |
*p‐value for change in intervention group over study period †p‐value for intervention vs. control at the end of study |
| Paulos 2005 | PROCESS n/a |
||||||
| Petkova 2008 | PATIENT 1) PEF rate (L/min.) 2) QOL |
1) 335.45±15.73 vs. 332.14±14.49 2) 3.55±1.33 vs. 3.39±0.68 |
1)338.64±12.55 vs. 333.57±14.00 2) 3.77±1.02 vs. 3.00±0.90 |
1) 3.19 vs. 1.43 2) 0.22 vs. ‐.39 |
1) 1.76 2) 0.61 |
1) p<0.05* 2) p<0.001† p=0.039‡ |
*p‐value for intervention vs. control at the end of study †‐p‐value for change in intervention over a study. ‡p‐value for change in control over a study period |
| Petkova 2008 | PROCESS 1)Hospitalisation rate 2) Visit to G.P i) <2‐3 times ii) >6 times |
1) 36.4% vs. 85.7% 2) i) 63.7% vs. 17.9% ii) 9.1% vs.3.6% |
1) 13.6% vs. 78.6% 2) i)86.4% vs. 21.4% ii) 4.5% vs. 3.6% |
1) ‐22.8% vs. ‐7.1% 2) i) 22.7 % vs. 3.5% ii) ‐4.6% vs.0% |
1) ‐15.7% 2) i) 19.2% ii) ‐4.6% |
1) p=0.001* 2) p=0.018† |
*p‐value for intervention vs. control at the end of study †‐p‐value for change in intervention over a study |
| Petkova 2009 | PATIENT Arthritis interference in patients’ daily routine. Pain interference with i) General activity ii) Mood iii) Walking ability iv) Normal Work v) Relation with other people vi) Sleep vii) Enjoyment of life |
i) 7.63±1.235 vs. 7.67±1.229 ii) 7.16±1.851 vs. 7.14±1.612 iii) 7.93±1.370 vs.8.00±1.272 iv) 6.81±2.228 vs. 6.51±2.120 v) 4.26±2.391 vs. 4.00±2.370 vi) 7.98±1.752 vs. 8.09±1.231 vii) 6.95±1.812 vs. 6.93±1.737 |
i) 7.47±1.316 vs. 7.63±1.134 ii) 6.95±1.690 vs. 7.09±1.630 iii) 7.72±1.368 vs.7.88±1.258 iv) 6.67±2.212 vs. 6.56±1.980 v) 4.14±2.210 vs. 3.74±2.183 vi) 7.79±1.390 vs. 8.02±1.282 vii) 6.58±1.803 vs. 7.09±1.90 |
i) ‐0.16 vs. ‐0.04* ii) ‐0.21 vs. ‐0.05* iii) ‐0.21 vs. ‐0.12* iv) ‐0.14 vs. 0.05* v) ‐0.12 vs. ‐0.26* vi) ‐0.19 vs.‐0.07* vii) ‐0.37 vs. 0.16* |
i) ‐0.12 ii)‐0.16 iii) ‐0.09 iv) ‐0.19 v) 0.14 vi) ‐0.12 vii) ‐0.53 |
i) p <0.05 ‡ ii) p <0.05 ‡ iii) p <0.05 ‡ iv) p <0.05 ‡ v) p <0.05‡ vi)p <0.05‡ vii) p <0.05‡ |
*calculated from the reported data. ‡p value for change in intervention group over a study period. |
| Petkova 2009 | PROCESS Visits to GP i) Not at all ii)More than six times |
i) 7% vs. 7% ii) 23.3% vs. 18.6% |
i) 18.6% vs.2.3% ii)9.3% vs.18.6% |
i)11.6% vs.‐4.7% ii) ‐14% vs.0% |
i) 16.3% ii)‐14% |
p=0.003‡ p<0.05‡ |
‡p value for change in intervention group over a study period. |
| Sookaneknun 2004 | PATIENT 1) Systolic blood pressure (mmHg) 2) Diastolic blood pressure (mmHg) 3)% of patients controlled for systolic blood pressure and diastolic blood pressure |
1) 144.76±19.69 vs. 142.41±19.81 2) 85.72±13.56vs 85.86±12.94 3) 22.88 vs. 17.94 |
1)121.47±14.90 vs.
124.77±17.97 2) 71.55±10.80 vs. 74.23±11.87 3) 66.10 vs.57.26 |
1) ‐23.29 ±19.10 vs. ‐18.64±17.67 * 2) ‐14.18 vs. ‐11.73* 3) 43.22 vs. 39.32 * |
1) ‐4.56 2) ‐2.45 3) 3.9 |
1) p<0.001 2) p<0.001 3) p =0.061 |
*calculated from reported data |
| Sookaneknun 2004 | PROCESS n/a |
||||||
| Suppapitiporn 2005 | PATIENT a. All Intervention group vs. Control group 1) FPG (mg %) 2) HbA1c (mg%) b.Intervention1 vs. Control 1) FPG (mg %) 2) HbA1c (mg %) c.Intervention 2 vs. Control 1) FPG (mg %) 2) HbA1c (mg %) d. Intervention 3 vs. Control group 1) FPG (mg %) 2) HbA1c (mg %) e. Intervention 4 vs. Control 1) FPG (mg %) 2) HbA1c (mg %) |
a. 1) 152.36±39.73 vs. 150.16±41.78 2) 8.16±1.44 vs. 8.01±1.51 b. 1) 147.46±36.07 vs. 150.16±41.78 2) 8.20±1.07 vs. 8.01±1.51 c. 1)139.78±33.15 vs.150.16±41.78 2) 7.92±1.40 vs. 8.01±1.51 d. 1) 168.60±39.30 vs. 150.16±41.78 2) 8.36±1.74 vs. 8.01 ±1.51 e. 1) 162.42±44.42 vs. 150.16±41.78 2) 8.07±1.53 vs. 8.01±1.51 |
a. 1) 145.20±46.0 vs. 159.16±54.90 2) 7.91±1.27 vs. 8.80±1.36 b. 1)130.21±33.96 vs.159.16±54.90 2) 7.91±1.11 vs. 8.80±1.36 c. 1) 141.21±45.8 vs. 159.16±54.90 2) 7.96±1.31 vs. 8.80±1.36 d. 1)158.34±57.81 vs. 159.16±54.90 2) 7.92±1.04 vs. 8.80±1.36 e. 1)160.98±50.39 vs. 159.16±54.90 2) 7.87±1.47 vs. 8.80±1.36 |
a. 1) ‐7.16 vs. 9 2) ‐0.25 vs. 0.79 b. 1) ‐17.25 vs. 9 2)‐.29 vs. 0.79 c. 1) 1.43 vs. 9 2) 0.04 vs. 0.79 d. 1) ‐10.26 vs. 9 2) ‐0.44 vs. 0.79 e. 1) ‐1.44 vs. 9 2) ‐0.2 vs. 0.79 |
a. 1) ‐16.16 2) ‐1.04 b. 1) ‐26.25 2) ‐1.08 c. 1) ‐7.57 2) ‐0.75 d. 1) ‐19.26 2) ‐1.23 e. 1)‐10.44 2) ‐.99 |
a. 1) p=0.013*† 2) p<0.001*† b. 1) p=0.016*‡ 2) p=0.001*‡ c. 1)n/a 2) p=0.005*‡ d. 1) not reported 2) not reported e. 1) not reported 2) p=0.000*‡ |
*statistical significant difference †p‐value for intervention vs. control at follow up ‡p‐value for change in intervention group over a study. |
| Suppapitiporn 2005 | PROCESS n/a |
||||||
Clinical outcomes
All studies targeting patients reported patient outcomes. Patient targeted pharmacist interventions resulted in improvement in most of the clinical outcomes, although the improvement was not always statistically significant. The peak expiratory flow rate increased by 1.76 l/min in the intervention group as compared to the control group in one study (Abdelhamid 2008) however the result was not statistically significant. The effect size of the improvement of peak expiratory flow rate was not reported in the other study although the result was statistically significant (Petkova 2008). In patients with asthma, a statistically significant difference was not found in forced vital capacity (FVC) and forced expiratory flow (FEV) from spirometry testing before and after the intervention (Gonzalez‐Martin 2003). Two studies demonstrated a reduction in systolic and diastolic blood pressure (Lugo 2007; Sookaneknun 2004). Reduction in systolic and diastolic blood pressure due to pharmacist intervention (Lugo 2007; Sookaneknun 2004) was ‐25 mm Hg and ‐6 mm Hg and ‐4.56 mm Hg and ‐2.45 mm Hg, respectively. However, in one study, reporting of standard deviations was incomplete (Lugo 2007). Two studies targeting diabetic patients showed a statistically significant reduction in the fasting plasma glucose level (Arun 2008; Suppapitiporn 2005) and one study showed a statistically significant reduction in the random blood glucose level (Adepu 2007). The reduction in fasting plasma glucose levels due to pharmacist interventions (Arun 2008; Suppapitiporn 2005) was ‐39.84 mg/dl and ‐16.16 mg/dl, respectively. In patients with diabetes, the glycosylated haemoglobin level decreased by ‐1.04% in the intervention group as compared to the control group (Suppapitiporn 2005). When each intervention versus control was analysed in this study, the mean percentage point difference between the intervention and control groups ranged from ‐0.75% to ‐1.23 %. In one study, the total cholesterol level and triglyceride level of the dyslipidemic patients decreased by ‐25.7 mg/dl and ‐80.1 mg/dl in the intervention group as compared to the control group, respectively (Paulos 2005). In the same study, there was an increase in the proportion of patients with decreased cholesterol.
Overall, pharmacist‐provided services targeted towards the patient point to small improvements in some of the clinical outcomes such as management of high glucose levels among diabetic patients and management of blood‐pressure and cholesterol levels. For outcomes such as peak expiratory flow rate and forced vital capacity, we could not rule out the role of chance in these findings.
Quality of life outcomes
Seven of 11 studies reporting patient outcomes collected data on quality of life outcomes (QOL) by using various QOL questionnaires (Adepu 2007; Arun 2008; Ebid 2006; Gonzalez‐Martin 2003; Paulos 2005; Petkova 2008; Petkova 2009). One study targeted at diabetic patients showed a statistically significant improvement in QOL; however numerical data for this effect were not reported (Adepu 2007). A second study targeting diabetic patients reported an increment in QOL score by 5.45 (score range 0 to 30) in the intervention group, but it was not clear whether this result was statistically significant (Arun 2008). In Gonzalez‐Martin 2003, there was an increment of the emotion, activities and symptom score (on a scale range from 1 to 7 for each item) by 1.3, 2.1 and 1.7, respectively, in the intervention group as compared to control group. The mean difference of the QOL score assessed by using an asthma specific assessment form (score range 1 to 5) was 0.61 between the intervention and control groups in Petkova 2008. Small but statistically significant improvements in QOL were reported in a study targeting arthritic patients (Petkova 2009). A study targeting dyslipidemic patients also showed a statistically significant improvement in QOL (Paulos 2005), however the effect size was not reported. Lastly, another study targeting patients with asthma and COPD demonstrated a statistically significant increment in QOL score in the intervention group, but the difference between the intervention and control groups was not reported (Ebid 2006). Due to the poor reporting, the overall effect size of improvement in QOL by the pharmacist intervention could not be estimated as the included studies used different measures of QOL or reported different outcomes. However, most of the studies showed a statistically significant improvement in QOL score.
In summary, the measurement of QOL in the seven studies varied greatly but suggests that pharmacist interventions targeting patients may improve the QOL outcomes.
Process outcomes (health service utilisation and cost)
Four of 11 studies targeting patients reported process outcomes (Abdelhamid 2008; Ebid 2006; Petkova 2008; Petkova 2009). In two studies, the rate of hospitalisation decreased statistically significantly in the intervention groups as compared to the control groups (Abdelhamid 2008; Petkova 2008). Effect sizes for health service utilisation were not reported in two studies (Abdelhamid 2008; Ebid 2006). The hospitalisation rate of asthmatic patients decreased by 15.7%; the 'need for visits to general practitioners (GP) less than two to three times' parameter increased by 19.2% and the 'need for visits to GPs greater than six times' parameter decreased by 4.6% (Petkova 2008). In arthritic patients, the 'no need of visit to GP' parameter increased by 16.3% and the 'need of visit to GP for more than six times' parameter decreased by 14% (Petkova 2009). Similarly, in another study the number of visits to private clinics (PCs) or outpatients clinics (OPCs) and emergency rooms of hospitals decreased in the intervention group in both asthmatic patients and patients suffering from COPD (Ebid 2006). Specific effect sizes were not reported. In the same study, medication costs for patients with COPD and asthma were also decreased.
Overall, pharmacist‐provided services were able to reduce health service utilisations such as GP visits and hospitalisation rate.
Comparison between interventions
The pharmacist interventions targeting patients were counselling and patient education; counselling with patient education plus an educational booklet; counselling and drug review; a pharmaceutical care plan with scheduled follow‐up; counselling, booklet and special medication container; and counselling and special medication container (Table 3). For the blood glucose outcome, counselling and 'counselling plus a booklet plus medication container' were the most effective interventions as compared to other interventions such as 'counselling plus medication container' or 'counselling plus a booklet' (Suppapitiporn 2005). A pharmaceutical care plan with scheduled follow‐up also showed an effective result (Arun 2008) for this outcome. For blood pressure, a pharmaceutical care plan with scheduled follow‐up was more effective in Lugo 2007 as compared to Sookaneknun 2004. A pharmaceutical care plan also showed an effective result for the improvement of blood triglyceride and cholesterol levels (Paulos 2005). 'Counselling and booklet' (Petkova 2008) was more effective in improving peak expiratory flow rate as compared to 'counselling and drug review' (Abdelhamid 2008) among asthmatic patients. The effect of 'counselling plus a booklet' on arthritic patients was small but significant (Petkova 2009). The rate of hospitalisation decreased by 19.2% and GP visits decreased by 15.7% among asthmatic patients when assessing 'counselling and a booklet' (Petkova 2008). Similarly, 'counselling and a booklet' was assessed in Petkova 2009 and increased the 'no need to visit to GP' parameter by 16.3% and 'the need to visit a GP for more than six times' parameter by 14%. The single study assessing the effect of the pharmacist intervention on medication costs assessed an intervention of a pharmaceutical care plan with scheduled follow‐up (Ebid 2006). The pharmaceutical care significantly reduced the medication costs in Ebid 2006. Most of the studies did not report effect sizes, hence it was not possible to compare the pharmacist interventions. Overall, counselling plus a booklet and a pharmaceutical care plan with scheduled follow‐up were the most effective interventions.
Comparison 2(c): comparison of the delivery of healthcare professional targeted services by pharmacists versus usual care
One study that compared the effectiveness of a pharmacist intervention targeted at healthcare professionals versus usual care was included in this review (Zwarenstein 2007). A single pharmacist delivered outreach visits in this study and the improvement in the asthma symptom score due to the intervention was 0.85 with a P value of 0.03 (with little or no difference in symptoms at the lower end of the CI). A detailed description is presented in Analysis 1.1.
Quality of the evidence (GRADE analysis)
A Grade analysis was done to determine the quality of the evidence for the clinical outcomes, quality of life, health service utilisation and cost for comparisons 1(c) and 2(c) (Table 1; Table 2). There was a small improvement in clinical outcomes with the patient targeted pharmacist‐provided services as compared to usual care and the quality of the evidence was graded low. There were small improvements in the quality of life scores and the quality of evidence was graded low. The health service utilisation was also decreased for this comparison and the quality of evidence was graded low. Medication cost was also decreased by the pharmacist interventions and the quality of evidence was low. The study that targeted healthcare professionals comparing pharmacist provided services to usual care showed that the intervention decreased the asthma symptom score, however the quality of evidence was graded low.
Assessment of heterogeneity
The three studies that demonstrated little impact had small sample sizes (21 to 90), which may explain the lack of statistical significance (Gonzalez‐Martin 2003; Petkova 2008; Petkova 2009). Five of 11 studies did not present data supporting statements about the outcomes thus making it difficult to estimate the magnitude of effect (Abdelhamid 2008; Adepu 2007; Arun 2008; Ebid 2006; Paulos 2005). We tried to contact the authors, but none of them responded. Only a single study discussed the clinical importance of the intervention effect on the outcome (Zwarenstein 2007). Among the eligible studies, there was great heterogeneity in comparison groups, intervention type, outcomes assessed, duration of intervention, length of follow‐up and the measurement used for outcomes. An attempt was made to perform a meta‐analysis by subgrouping studies based on the disease state and outcome type. Unfortunately, there were insufficient data across the 12 included trials to perform subgroup analyses for any disease state. For example, in the two studies assessing disease control in adult asthmatic patients, studies used different quality of life questionnaires (Abdelhamid 2008; Petkova 2008). Due to the different outcome measures and measurement units, pooling data from these outcomes was not possible. As single studies assessed outcomes for hyperlipidemia, chronic obstructive pulmonary disease (COPD) and arthritis, meta‐analysis was not possible. Although three studies (Adepu 2007; Arun 2008; Suppapitiporn 2005) assessed the effectiveness of the interventions on blood glucose, only one study (Suppapitiporn 2005) reported the pre‐intervention and post‐intervention value of the outcome and its standard deviation. Hence, meta‐analysis could not be performed. For similar reasons it was not possible to perform a meta‐analysis for blood pressure‐related outcomes. Consequently, data were presented separately for each included study.
Discussion
Summary of main results
This review has demonstrated that pharmacist interventions targeting patients may improve patient outcomes and health service utilisation in middle income countries. Pharmacist interventions targeting patients resulted in a small improvement of clinical outcomes. A small Improvement in quality of life was demonstrated in most of the studies although some studies did not report a measure of effect. Although few studies assessed process outcomes (health service utilisation and cost), health service utilisation such as the rate of hospitalisation and the need for general practitioner visits were also found to be reduced in all of the studies that reported these outcomes. Regarding cost, only medication costs were assessed in a single study and were found to be reduced (Ebid 2006). However, a number of studies did not report this outcome. None of the included studies specifically mentioned the clinical significance or beneficial effect, however clinical significance or beneficial effect can be deduced from the data.
Only one study examined pharmacist interventions targeting healthcare professionals and it found very small improvements in asthma symptom scores with little or no difference in symptoms at the lower end of the confidence interval. In addition, a single pharmacist delivered outreach visits to healthcare professionals in this study, which might preclude the generalisability of the result due to the pharmacist's personality and personal rapport with practices.
There was heterogeneity noted in the type of pharmacist interventions delivered and the outcome variables measured. However, 'counselling plus a booklet' and a pharmaceutical care plan with scheduled follow‐up showed mostly positive outcomes. Interventions differed by site of delivery (for example the outpatient department of hospitals, primary care clinic, community pharmacy), the length of each intervention session (for example 20 minute session with pharmacist, 50 minute session with pharmacist) and the frequency of the intervention (for example 11 sessions per 22 weeks, six sessions over six months).
The most common interventions provided involved simple patient education. Few studies assessed complete pharmaceutical care follow‐up, by providing medication therapy optimisation, monitoring of disease control, compliance assessment, identifying and resolving drug‐related problems and maintaining manual records for each patient. The terminology used for these services in the studies was ‘pharmaceutical care’, but this is likely to be similar to what is now called 'medication therapy management' (MTM). However, most of the pharmacist interventions targeting patients in other studies conducted in high income countries were complex and comprehensive; these services included MTM consisting of medication optimisation, monitoring of disease control, adverse drug reactions, identification of drug‐drug interactions, compliance assessment and patient education (Nkansah 2010). The only included study targeted towards healthcare professionals involved academic detailing and tools such as visual aids for improving diagnosis, prescribing and follow‐up. Pharmacist interventions targeting healthcare professionals in high income countries included oral or written recommendations to physicians regarding therapy modifications or resolution of medication‐related problems with multiple follow‐up visits with patients extending over several months, ranging from one month to 12 months (Nkansah 2010). In the studies conducted in high income countries, the duration of each intervention was longer, ranging from 14 to 120 minutes with one to 22 intervention events conducted over the longer study period that spanned from six weeks to 23 months, compared to low‐ and middle‐income countries. In the studies conducted in low‐ and middle‐income countries, the duration of the intervention ranged from 20 to 50 minutes with three to 11 interventions conducted over a period of nine weeks to six months.
Overall completeness and applicability of evidence
Studies which compared the effect of pharmacist‐provided non‐dispensing services targeted at patients and healthcare professionals with services delivered by other healthcare professionals or untrained workers could not be found. Thus, this review could not assess all of the listed objectives. Only 12 studies which compared pharmacist interventions versus usual care were included in this review. All eligible studies were from middle income countries. Hence, the result of this review is highly applicable to those types of countries. Unfortunately studies conducted in low income countries could not be found. Most of the excluded studies were before and after uncontrolled studies that had few points of measurement before and after the intervention. These studies were also conducted in middle income countries. Thus, there is a need to design and conduct higher quality studies in both low as well as middle income countries. Inclusion of high quality studies from a diverse range of countries would increase the external validity of this comparison.
Eleven of 12 studies included in this review examined pharmacist interventions targeting patients and the remaining one examined the effect on pharmacist interventions targeting healthcare professionals. Only four studies measured health service utilisation; a single study measured medication cost and all 12 studies assessed patient outcomes. Five studies did not report enough data to calculate an effect size for outcomes and instead only provided qualitative statements about results (Abdelhamid 2008; Adepu 2007; Arun 2008; Ebid 2006; Paulos 2005). Some outcomes reported were subjective, however only objective outcomes were included in this study to reduce the risk of bias. Most of the studies enrolled small numbers of participants, that is less than 100 in number (Adepu 2007; Gonzalez‐Martin 2003; Paulos 2005; Petkova 2008; Petkova 2009).
As noted above, the findings of this review are applicable to middle income countries. There are various reasons such as lack of resources; variation in the organisation of services, qualifications of pharmacists; and cultural barriers which might preclude the applicability of the results to low income countries. In addition to the pharmacist, there should be sufficient resources such as access to medicines or diagnostic tests in order to successfully implement pharmacist interventions. In addition, the qualifications of pharmacists might vary between low income countries and middle income countries, which can cause the results of pharmacist interventions to differ.
Quality of the evidence
A number of studies had some limitations in their methodological quality. Although most studies were blinded, many did not explicitly report methods to conceal allocation of participants to the intervention and control groups. Given the nature of practice‐based interventions, it is not always possible to blind patients or pharmacists. The impact of a lack of blinding was likely to be minimal as the outcome variables included in this review were objective (for example blood pressure measurement, validated quality of life questionnaire etc). Although most of the studies described the sequence generation as simple randomisation or computer generation, baseline values of variables other than the primary outcomes were not comparable between the intervention and control groups. This may be a consequence of small sample sizes rather than the method of randomisation. In a few studies, baseline measurement of primary outcomes was not reported. A single study met the protection against contamination criteria (Zwarenstein 2007). This is challenging to accomplish in studies conducted in low resource settings as most studies occur within one clinic setting or one healthcare practice group (with multiple health professionals).
Four studies did not explicitly report clinical importance for patient outcomes such as the blood pressure outcome and blood glucose level outcome or worthwhile effects on health service utilisation of the pharmacist interventions (Abdelhamid 2008; Adepu 2007; Arun 2008; Ebid 2006). Even if there are statistically significant changes in outcomes due to pharmacist interventions, mention of clinical importance or worthwhile effect could help the reader better interpret the implications of study results. Hence, ideally, clinical importance or worthwhile effects should be reported in the studies along with statistical significance for each outcome.
In summary, this review demonstrates that pharmacist interventions targeting patients can improve a number of clinical outcomes and health service utilisation, although the effect size was not always large or statistically significant. In some studies, due to the poor reporting of numerical values, the effect size and statistical significance for outcomes, the results were not interpretable. Meta‐analysis, which is performed by pooling data from multiple studies, might have helped in determining the true effect and magnitude of the pharmacist interventions. However, due to limitations in the data reported in studies and heterogeneity in the types of outcomes, clinical conditions and approaches to measurement of outcomes, a meta‐analysis could not be performed. Overall, the greatest limitation was the poor reporting of study results, such as no explicit reporting of means and standard deviations along with the exact value of statistical significance, which thus precluded the estimation of the strength of the effect. In addition, limitations in reporting of methodological components such as allocation concealment, sequence generation and follow‐up of patients and professionals impacted our ability to thoroughly assess study quality. Therefore, standardised outcome measures for various clinical conditions, proper reporting of outcome data and methodological improvements could help in assessing the impact of pharmacist interventions in low‐ and middle‐income countries.
Agreements and disagreements with other studies or reviews
The findings are consistent with the results of other reviews (Beney 2000; Nkansah 2010). All the reviews indicated that pharmacist interventions can lead to improved patient outcomes and health service utilisation for multiple disease states, although effect size may not always be substantial or statistically significant.
Authors' conclusions
Implications for practice.
Studies for the comparison of patient targeted services provided by pharmacists versus services provided by other healthcare professionals or untrained healthcare workers were not found. Similarly, studies for the comparison of healthcare professional targeted services provided by pharmacists versus services provided by other healthcare professionals or untrained health care workers were not found. Therefore, conclusions could not be drawn regarding these interventions.
The majority of included studies that compared patient targeted pharmacist intervention versus usual care supported the roles of pharmacists in improving the patient outcomes and health service utilisation as well as delivering patient counselling and care regarding drug therapy and management of their disease condition.
We were uncertain about the beneficial effect of the educational session by pharmacists to healthcare professionals as well as the applicability and generalisability of the findings from this single study. As no study assessed health service utilisation and costs for the comparison, conclusions could not be drawn in this area.
Implications for research.
High‐quality studies to examine the effect of pharmacist‐provided non‐dispensing services should be conducted in low income countries in addition to middle income countries. Similarly, studies which compare the effect of pharmacist‐provided non‐dispensing services and services delivered by other healthcare professionals and untrained health workers in developing countries are also required. In addition to simple patient education, medication therapy management consisting of medication optimisation, monitoring of disease control, adverse drug reactions, identification of drug‐drug interactions and compliance assessment should also be evaluated in this setting. To guide the reader in interpreting results, clinical significance of the effect or a worthwhile effect should be reported along with numerical data and statistical analyses. Besides assessment of patient outcomes, measurement of process outcomes including health service utilisation and costs should be included as an objective in future studies. To increase the power of studies a larger number of participants should be enrolled so that adequate differences in the effect between intervention and control groups can be detected. Standardisation of reporting of methodological quality, outcome data and measurement of reliable outcomes for various disease states are required to produce valid, reliable and generalisable results. Although the objective of this review was not to assess the impact of pharmacists working in a multi‐disciplinary team, there are no such studies that evaluate the effect of the pharmacist working in a multi‐disciplinary team versus usual care that have been conducted in these countries. Hence, there is also a need for conducting such type of studies in low‐ and middle‐income countries.
Acknowledgements
First and foremost I offer my sincerest gratitude to my supervisor, Professor Janet Hiller, whose supervision, encouragement and support from the preliminary to concluding stages enabled me to successfully complete this review. Moreover, it is my pleasure to thank Professor Lisa Bero, The University of California, San Francisco who suggested the idea for this review and without whom the review would not have been possible. I am also heartily grateful to Dr Nancy Nkansah, The University of California, San Francisco who provided invaluable suggestions and assisted me in accessing required articles.
Besides that, I would also like to thank Maureen Bell, Lucia Zuzolo and Linda Mundy who helped me in successfully running the literature searches. I would also like to give special thanks to librarian Cathy Mahar and The University of South Australia for permitting me to use the library facility. In addition, I would like to offer my appreciation to Mrs Adriana Parrella who helped me in extracting data from the Spanish articles.
Furthermore, I would also like to offer my sincere thanks to Dr Joseph L Mathew, Subish Palaian, Kadir Alam, Ramesh Adepu, Dr David Hughes, Sunantha Osiri, Dr Pornanong Aramwit and Wajira Mahes Palipane who had helped in accessing full texts of the relevant studies.
I am grateful to my friends Shakti Shrestha, Bhuwan KC and Arjun Poudel who helped in searching full texts of the potentially relevant articles.
Lastly, I offer my warm wishes and blessing to my parents and friends who supported me in any respect during the completion of the review.
Appendices
Appendix 1. Classification of low‐ and middle‐income countries according to the World Bank
Low income economies
Afghanistan
Guinea‐Bisau
Rwanda
Bangladesh
Haiti
Senegal
Benin
Kenya
Sierra Leone
Burkina Faso
Korea, Dem Rep.
Somalia
Burundi
Kyrgyz Republic
Tajikistan
Cambodia
Lao PDR
Tanzania
Central African Republic
Liberia
Togo
Chad
Madagascar
Uganda
Comoros
Malawi
Uzbekistan
Congo, Dem. Rep
Mali
Vietnam
Eritrea
Mauritania
Yemen, Rep.
Ethiopia
Mozambique
Zambia
Gambia, The
Myanmar
Zimbabwe
Ghana
Nepal
Guinea
Niger
Lower middle income economies
Albania
Honduras
Paraguay
Angola
India
Philippines
Armenia
Indonesia
Samoa
Azerbaijan
Iran, Islamic Rep.
São Tomé and Principe
Belize
Iraq
Solomon Islands
Bhutan
Jordan
Sri Lanka
Bolivia
Kiribati
Sudan
Cameroon
Kosovo
Swaziland
Cape Verde
Lesotho
Syrian Arab Republic
China
Maldives
Thailand
Congo, Rep.
Marshall Islands
Timor‐Leste
Côte d'Ivoire
Micronesia, Fed. Sts.
Tonga
Djibouti
Moldova
Tunisia
Ecuador
Mongolia
Turkmenistan
Egypt, Arab Rep.
Morocco
Ukraine
El Salvador
Nicaragua
Vanuatu
Georgia
Nigeria
West Bank and Gaza
Guatemala
Pakistan
Guyana
Papua New Guinea
Upper‐middle‐income economies
Algeria
American Samoa
Argentina
Belarus
Bosnia and Herzegovina
Botswana
Brazil
Bulgaria
Chile
Columbia
Cost Rica
Cuba
Dominicia
Dominican Republic
Fiji
Gabon
Grenada
Jamaica
Kazakhstan
Latvia
Lebanon
Libya
Lithuania
Macedonia, FYR
Malaysia
Mauritius
Mayotte
Mexico
Montenegro
Namibia
Palau
Panama
Peru
Poland
Romania
Russian Federation
Serbia
Seychelles
South Africa
St. Kitts and Nevis
St. Lucia
St. Vincent and the Grenadines
Suriname
Turkey
Uruguay
Venezuela, RB
Appendix 2. Search strategy for MEDLINE
1. Pharmacy [mh] OR Pharmacy [tiab] OR pharmacists [mh] OR pharmacists [tiab] OR pharmacist [mh] OR pharmacist [tiab] OR pharmacies [mh] OR pharmacies [tiab] OR community pharmacy [mh] OR community pharmacy [tiab] OR “community pharmacy services” [tiab] OR community pharmacy services [mh] OR community pharmacies [mh] OR community pharmacies [tiab] OR “pharmaceutical care” [tiab] OR “pharmaceutical cares” [tiab] OR pharmaceutical services [tiab] OR pharmaceutical services [mh] OR pharmaceutical service [tiab]
2. “low‐ and middle‐income countries” [tiab] OR low‐and middle‐income countries [mh] OR low‐ and middle‐income nations [mh] OR “low‐ and middle‐income nations” [tiab] OR developing countries [mh] OR “developing countries” [tiab] OR developing nations[mh] OR “developing nations” [tiab] OR “least developed countries” [tiab] OR least developed countries [mh] OR “less developed countries” [tiab] OR less developed countries [mh] OR less developed nations[mh] OR “less developed nations” [tiab] OR “least developed nations”[tiab] OR least developed nations [mh] OR “under developed nations” [tiab] OR under developed nations [mh] OR “underdeveloped countries” [tiab] OR under developed countries [mh] OR “poor countries” [tiab] OR poor countries [mh] OR third‐world countries [mh] OR “third world countries” [tiab] OR “third‐world nations” [tiab] OR third world nations [mh] OR third world [tiab]
3. Afghanistan [mh] OR Bangladesh [mh] OR Benin [mh] OR Burkina Faso [mh] OR Burundi [mh] OR Cambodia [mh] OR Central African Republic [mh] OR Chad [mh] OR Comoros[mh] OR Congo [mh] OR Eritrea [mh] OR Ethiopia[mh] OR Gambia [mh] OR Ghana[mh] OR Guinea [mh] OR Guinea‐Bissau [mh] OR Haiti[mh] OR Kenya[mh] OR Korea [mh] OR Kyrgyz Republic[mh] OR Laos [mh] OR Liberia [mh] OR Madagascar [mh] OR Malawi [mh] OR Mali [mh] OR Mauritania [mh] OR Mozambique[mh] OR Myanmar[mh] OR Nepal[mh] OR Niger[mh] OR Rwanda [mh] OR Senegal[mh] OR “Sierra Leone” [mh] OR Somalia [mh] OR Tajikistan[mh] OR Tanzania [mh] OR Togo [mh] OR Uganda [mh] OR Uzbekistan[mh] OR Vietnam[mh] OR Yemen [mh] OR Zambia[mh] OR Zimbabwe [mh] OR Albania [mh] OR Angola [mh] OR Armenia[mh] OR Azerbaijan [mh] OR Belize [mh] OR Bhutan[mh] OR Bolivia[mh] OR Cameroon[mh] OR Cape Verde [mh] OR China [mh] OR Congo [mh] OR “Cote d'Ivoire” [mh] OR Djibouti [mh] OR Ecuador[mh] OR Egypt [mh] OR El Salvador [mh] OR Georgia[mh] OR Guatemala[mh] OR Guyana[mh] OR Honduras [mh] OR India [mh] OR Indonesia[mh] OR Iran [mh] OR Iraq[mh] OR Jordan[mh] OR Kiribati [mh] OR Kosovo [mh] OR Lesotho [mh] OR Maldives [mh] OR Marshall Islands[mh] OR Micronesia [mh] OR Moldova [mh] OR Mongolia [mh] OR Morocco [mh] OR Nicaragua [mh] OR Nigeria[mh] OR Pakistan [mh] OR OR Papua New Guinea OR Paraguay [mh] OR Philippines [mh] OR Samoa [mh] OR Sao Tome and Principe [mh] OR Solomon Island [mh] OR Sri Lanka[mh] OR Sudan[mh] OR Syrian Arab Republic [mh] OR Swaziland [mh] OR Thailand [mh] OR Timor‐Leste[mh] OR Tonga [mh] OR Tunisia [mh] OR Turkmenistan [mh] OR Ukraine [mh] OR Vanuatu [mh] OR West Bank and Gaza [mh] OR Algeria[mh] OR American Samoa[mh] OR Argentina [mh] OR Belarus [mh] OR Bosnia and Herzegovina [mh] OR “Bosnia‐Herzegovina”[mh] OR Botswana [mh] OR Brazil [mh] OR Bulgaria[mh] OR Chile[mh] OR Colombia [mh] OR Costa Rica[mh] OR Cuba [mh] OR Dominica [mh] OR “Dominican Republic” [mh] OR Fiji [mh] OR Gabon [mh] OR Grenada [mh] OR Jamaica [mh] OR Kazakhstan[mh] OR Latvia [mh] OR Lebanon [mh] OR Libya [mh] OR Lithuania[mh] OR Macedonia [mh] OR Malaysia[mh] OR Mauritius [mh] OR Mayotte[mh] OR Mexico [mh] OR Montenegro[mh] OR Namibia [mh] OR Palau [mh] OR Panama[mh] OR Peru[mh] OR Poland [mh] OR Romania [mh] OR Russian Federation [mh] OR Serbia[mh] OR Seychelles[mh] OR South Africa[mh] OR “St. Kitts and Nevis” [mh] OR St. Lucia [mh] OR St.Vincent and the Grenadines [mh] OR Suriname [mh] OR Turkey[mh] OR Uruguay [mh] OR Venezuela [mh] OR Afghanistan [tiab] OR Bangladesh [tiab] OR Benin [tiab] OR “Burkina Faso” [tiab] OR Burundi [tiab] OR Cambodia [tiab] OR “Central African Republic” [tiab] OR Chad [tiab] OR Comoros[tiab] OR Congo [tiab] OR Eritrea [tiab] OR Ethiopia[tiab] OR Gambia [tiab] OR Ghana[tiab] OR Guinea [tiab] OR Guinea‐Bissau [tiab] OR Haiti[tiab] OR Kenya[tiab] OR Korea [tiab] OR “Kyrgyz Republic”[tiab] OR “Lao PDR” [tiab] OR laos [tiab] OR Liberia [tiab] OR Madagascar [tiab] OR Malawi [tiab] OR Mali [tiab] OR Mauritania [tiab] OR Mozambique[tiab] OR Myanmar[tiab] OR Nepal[tiab] OR Niger[tiab] OR Rwanda [tiab] OR Senegal[tiab] OR “Sierra Leone” [tiab] OR Somalia [tiab] OR Tajikistan[tiab] OR Tanzania [tiab] OR Togo [tiab] OR Uganda [tiab] OR Uzbekistan[tiab] OR Vietnam[tiab] OR Yemen [tiab] OR Zambia[tiab] OR Zimbabwe [tiab] OR Albania [tiab] OR Angola [tiab] OR Armenia[tiab] OR Azerbaijan [tiab] OR Belize [tiab] OR Bhutan[tiab] OR Bolivia[tiab] OR Cameroon[tiab] OR Cape Verde [tiab] OR China [tiab] OR Congo [tiab] OR “Cote d'Ivoire” [tiab] OR Djibouti [tiab] OR Ecuador[tiab] OR Egypt [tiab] OR “El Salvador” [tiab] OR Georgia[tiab] OR Guatemala [tiab] OR Guyana [tiab] OR Honduras [tiab] OR India [tiab] OR Indonesia[tiab] OR Iran [tiab] OR Iraq[tiab] OR Jordan[tiab] OR Kiribati [tiab] OR Kosovo [tiab] OR Lesotho [tiab] OR Maldives [tiab] OR Marshall Islands[tiab] OR Micronesia [tiab] OR Moldova [tiab] OR Mongolia [tiab] OR Morocco [tiab] OR Nicaragua [tiab] OR Nigeria[tiab] OR Pakistan [tiab] OR Papua New Guinea[tiab] OR Paraguay [tiab] OR Philipines [tiab] OR Samoa [tiab] OR “Sao Tome and Principe” [tiab] OR “Solomon Islands” [tiab] OR Sri Lanka[tiab] OR Sudan[tiab] OR “Syrian Arab Republic” [tiab] OR Swaziland [tiab] OR Thailand [tiab] OR Timor‐Leste[tiab] OR Tonga [tiab] OR Tunisia [tiab] OR Turkmenistan [tiab] OR Ukraine [tiab] OR Vanuatu [tiab] OR “West Bank and Gaza” [tiab] OR Algeria[tiab] OR American Samoa[tiab] OR Argentina [tiab] OR Belarus [tiab] OR “Bosnia and Herzegovina” [tiab] OR “Bosnia‐Herzegovina”[tiab] OR Botswana [tiab] OR Brazil [tiab] OR Bulgaria[tiab] OR Chile[tiab] OR Colombia [tiab] OR Costa Rica[tiab] OR Cuba [tiab] OR Dominica [tiab] OR “Dominican Republic” [tiab] OR Fiji [tiab] OR Gabon [tiab] OR Grenada [tiab] OR Jamaica [tiab] OR Kazakhstan[tiab] OR Latvia [tiab] OR Lebanon [tiab] OR Libya [tiab] OR Lithuania[tiab] OR Macedonia [tiab] OR Malaysia[tiab] OR Mauritius [tiab] OR Mayotte[tiab] OR Mexico [tiab] OR Montenegro[tiab] OR Namibia [tiab] OR Palau [tiab] OR Panama[tiab] OR Peru[tiab] OR Poland [tiab] OR Romania [tiab] OR Russian Federation [tiab] OR Serbia[tiab] OR Seychelles[tiab] OR South Africa[tiab] OR “St. Kitts and Nevis” [tiab] St. Lucia [tiab] OR St.Vincent and the Grenadines [tiab] OR Suriname [tiab] OR Turkey[tiab] OR Uruguay [tiab] OR Venezuela [tiab]
4. Randomized controlled trial [pt] OR clinical trial [pt] OR random* OR (pre test OR pretest OR post test OR postest) OR impact OR intervention* OR evaluat* OR effect* OR compare* OR controlled clinical trial [pt] OR patient education as topic[mh] OR treatment outcome [mh] OR quality of life [mh] OR patient compliance [mh] OR patient compliance [tiab] OR counseling [mh] OR counseling [tiab] OR counselling [tiab] OR counselling [mh] OR patient satisfaction [tiab] OR patient satisfaction [mh] OR random allocation [mh] OR random allocation [tiab] OR Outpatients [tiab] OR Outpatients [mh] OR Ambulatory Care [tiab] OR Ambulatory care [mh] OR outpatient clinics[tiab] [OR] outpatient clinics [mh]
5. (#1 AND (#2 OR 3) AND #4 ) (Limit to Human)
Appendix 3. Result table 1(c) Comparison of the delivery of healthcare professional targeted services by pharmacists versus usual care
| 1(c) Comparison of the delivery of patient targeted services by pharmacists versus usual care | ||||
| Outcomes | Impact | No of Participants (studies) | Quality of the evidence (GRADE) | Comments |
| Clinical Outcomes | ||||
| Fasting Blood Glucose Level (FBG) (follow‐up: mean 5.5 months) [Intervention: Counselling/Patient Education] |
Mean difference of FBG between intervention and control group ranged from ‐16.16 mg/dl to ‐39.84 mg/dl |
514 (2) | ⊕⊕⊕⊝ moderate | The evidence was downgraded from high to moderate because 'risk of bias' was serious as concealment of allocation; follow‐up and reporting regarding outcome were not clear. |
| Glycosylated Haemoglobin (HbA1c ) (follow‐up: 6 months) [Interventions: Counselling + Booklet + Special medication container or Counselling + Special medication container or Counselling or Counselling + Booklet] |
When each intervention versus control was analysed, the mean percentage point difference between intervention and control ranged from ‐0.75 mg% to ‐1.23 mg% | 360(1) | ⊕⊕⊕⊕ high | |
| Systolic/Diastolic Blood Pressure (SBP/DBP) (follow‐up: mean 6 months) [Interventions: Pharmaceutical plan with scheduled follow‐up + Patient education + Booklet] |
Mean difference of SBP between intervention and control group ranged from ‐4.56 mmHg to ‐25 mmHg and DBP ranged from ‐2.45 mmHg to ‐6 mmHg | 305(2) | ⊕⊕⊕⊝ moderate | The evidence was downgraded from high to moderate because 'risk of bias' can be serious as concealment of allocation; follow‐up and reporting regarding outcome were not clear. |
| Blood Cholesterol Level and Triglyceride level (follow‐up: 16 weeks) [Interventions: Pharmaceutical plan with scheduled follow‐up + Patient education + Booklet] |
Mean difference of cholesterol level group was ‐25.7mg/dl and triglyceride level was ‐80.1 mg/dl between intervention and control |
42(1) | ⊕⊕⊕⊝ moderate | The evidence was downgraded from high to moderate because 'risk of bias' can be serious as concealment of allocation; follow‐up and reporting regarding outcome were not clear. |
| Peak Expiratory Flow Rate (PEFR) (follow‐up: mean 20.6 weeks) [Intreventions: Counselling/Patient Education + Booklet, Counselling + Drug Review and Pharmaceutical plan with scheduled follow‐up + Patient education + Booklet] |
Mean difference of PEFR was 1.76 l/min. between intervention and control group* | 500(3) | ⊕⊕⊕⊝ moderate | The evidence was downgraded from high to moderate because risk of bias was serious as concealment of allocation was not done in a study and attrition bias was not addressed in two studies. |
| Random Blood Glucose Level (RBGL) (follow‐up: 6 months) [Intervention: Counselling/Patient Education + Booklet] |
Mean difference of RBGL was ‐53.71 mg/dl between intervention and control group | 70(1) | ⊕⊕⊕⊕ high | |
|
Quality of Life (QOL) Score | ||||
| Asthma specific assessment form (1‐ “interference all of the time,” to 5‐“interference none of the time”) (follow‐up: 4 months) [Intervention: Counselling/Patient Education + Booklet] |
Mean difference of score between intervention and control group was 0.61 | 50(1) | ⊕⊕⊕⊕ high | |
| Brief Pain Inventory for Arthritis (0 being "no interference" and 10 being "interferes completely") (follow‐up: 4 months) [Intervention:Counselling/Patient Education + Booklet] |
Mean difference of scores ranged from ‐0.12 to ‐0.53 for different items between intervention and control group | 90(1) | ⊕⊕⊕⊕ high | |
| Paediatric asthma quality of life questionnaire (PAQLQ) score (3 domains‐emotion, activities and symptoms ‐ score on each item ranged from 1 to 7, where 1 indicate maximum impairment and 7 indicates no impairment) (follow‐up: 9 weeks) [Intervention: Counselling/Patient Education] |
Mean difference on score for emotion, activities and symptom was 1.3, 2.1 and 1.7 respectively between intervention and control group | 21(1) | ⊕⊕⊕⊕ high | |
| QOL (SF‐36) for hyperlipidemia (follow‐up: 16 weeks) [Interventions: Pharmaceutical plan with scheduled follow‐up + Patient education + Booklet] |
Statistically significant improvement in the QOL score in the intervention group as compared to control group** | 42(1) | ⊕⊕⊕⊝ moderate | The evidence was downgraded from high to moderate because 'risk of bias' was serious (due to unclear allocation concealment, attrition bias and selective reporting of outcome) |
| Overall Quality of Life (OQOL) (score from 0 to 30) (follow‐up: 5 months) [Intervention: Counselling/Patient Education] |
Mean difference of score of OQOL was +5.45 between intervention and control group | 154(1) | ⊕⊕⊕⊕ high | |
| Diabetes Dependent Quality of Life questionnaire (ADDQOL) (follow‐up: 6 months) [Intervention: Counselling/Patient Education + Booklet] |
Statistically significant improvement in the QOL in the intervention group as compared to control group** | 70(1) | ⊕⊕⊕⊕ high | |
| Health related Quality of Life Score (HRQOL) for Asthma/COPD (follow‐up: 6 months) [Interventions: Pharmaceutical plan with scheduled follow‐up + Patient education + Booklet] |
Statistically significant improvement in the HRQOL in the intervention group as compared to control group** | 350(1) | ⊕⊕⊕⊝ moderate | The evidence was downgraded from high to moderate because 'risk of bias' was serious (as concealment of allocation was unclear and attrition bias was not addressed in the study) |
| Health Sevice Utilisation | ||||
| Rate of Hospitalisation (follow‐up: mean 20.6 weeks) [Intervention:Counselling/Patient Education + Booklet, Pharmaceutical plan with scheduled follow‐up + Patient education + Booklet and Counselling + Drug Review] |
Mean difference of percentage of rate of hospitalisation between intervention and control was ‐15.76%* | 500(3) | ⊕⊕⊕⊝ moderate | The evidence was downgraded from high to moderate because of risk of bias was serious (as concealment of allocation was not done in a study and attrition bias was not addressed in two studies) |
| Number of General Practitioner (GP) visit (follow‐up: mean 18.6 weeks) [Interventions: Counselling/Patient Education + Booklet and Pharmaceutical plan with scheduled follow‐up + Patient education + Booklet] |
Mean difference of percentage of ‘need of GP visits for greater than 6 times’ parameter between intervention and control group ranged from 4.6% to 14% Mean difference of percentage of ‘need of GP visits for less than 2‐3 times’ was 19.2% between intervention and control group. Mean difference of “no need of visit to GP” parameter between intervention and control group was 16.3% |
490(3) | ⊕⊕⊕⊝ moderate | The evidence was downgraded from high to moderate because 'risk of bias' was serious (as concealment of allocation was unclear in three studies and attrition bias was not addressed in a single study) |
|
Cost Medication Cost (follow‐up: 6 months) [Interventions: Pharmaceutical plan with scheduled follow‐up + Patient education + Booklet] |
Statistically significant reduction in cost between intervention and control group** | 350(1) | ⊕⊕⊕⊝ moderate | The evidence was downgraded from high to moderate because of risk of bias was serious (as concealment of allocation was unclear and attrition bias was not addressed in the study) |
| *Effect size reported of only a single study **Effect size not reported | ||||
| GRADE Working Group grades of evidence High quality: Further research is very unlikely to change our confidence in the estimate of effect. Moderate quality: Further research is likely to have an important impact on our confidence in the estimate of effect and may change the estimate. Low quality: Further research is very likely to have an important impact on our confidence in the estimate of effect and is likely to change the estimate. Very low quality: We are very uncertain about the estimate. | ||||
Appendix 4. Result table 2(c) Comparison of the delivery of healthcare professional targeted services by pharmacists versus usual care
| 2(c) Comparison of the delivery of healthcare professional targeted services by pharmacists versus usual care | ||||
| Outcomes | Impact | No of Participants (studies) | Quality of the evidence (GRADE) | Comments |
| Asthma symptom score (0‐9 score, where 9 indicates maximum impairment and 0 indicates no impairment) (follow‐up: 3 months) |
Mean difference of asthma symptom score was ‐0.85 between intervention and control group | 43 general practices/ 318 asthmatic children (1) |
⊕⊕⊕⊕ high | |
| GRADE Working Group grades of evidence High quality: Further research is very unlikely to change our confidence in the estimate of effect. Moderate quality: Further research is likely to have an important impact on our confidence in the estimate of effect and may change the estimate. Low quality: Further research is very likely to have an important impact on our confidence in the estimate of effect and is likely to change the estimate. Very low quality: We are very uncertain about the estimate. | ||||
Data and analyses
Comparison 1. (c) Comparison of the delivery of patient targeted services by pharmacists versus usual care.
| Outcome or subgroup title | No. of studies | No. of participants | Statistical method | Effect size |
|---|---|---|---|---|
| 1 Outcomes | Other data | No numeric data |
Comparison 2. (c) Comparison of the delivery of health care professional‐targeted services by pharmacists vs. usual care.
| Outcome or subgroup title | No. of studies | No. of participants | Statistical method | Effect size |
|---|---|---|---|---|
| 1 Outcome | Other data | No numeric data |
2.1. Analysis.
Comparison 2 (c) Comparison of the delivery of health care professional‐targeted services by pharmacists vs. usual care, Outcome 1 Outcome.
| Outcome | |||||||
|---|---|---|---|---|---|---|---|
| Study | Outcomes | Pre‐intervention (intervention vs. control) | Post‐ intervention (intervention vs. control) | Change due to intervention(intervention ‐ control) | Result Interval(ΔI‐ΔC) | Significance | Notes |
| Zwarenstein 2007 | PATIENT Asthma symptom score |
7.71±0.11 vs. 7.48±0.09 | 3.63±0.26 vs. 4.24±0.27 | ‐4.08±0.23vs. ‐3.24±0.30 | ‐0.84 | p=0.03* | *statistically significant |
| Zwarenstein 2007 | PROCESS n/a |
||||||
Characteristics of studies
Characteristics of included studies [ordered by study ID]
Abdelhamid 2008.
| Methods | Randomised controlled trial Unit of randomisation and analysis: patient |
|
| Participants | Shaab Teaching Hospital, Khartoum, Sudan (lower middle income country) Asthmatic patients of emergency department or referral clinic patients ‐ 100 (60 intervention group, 40 control group) provider (delivering intervention) ‐ 1 practice ‐ 1 no unit of analysis error |
|
| Interventions | targeted towards PATIENTS Drug therapy of asthma was reviewed by pharmacist according to the British Thoracic Society Guideline. In addition, educational program on disease, non‐drug therapy measures, pharmacotherapy, self‐management and inhalation technique were also delivered. versus usual care Length of each intervention: Not clear Number of intervention episodes: every 2 weeks for 22 weeks |
|
| Outcomes | PATIENT 1) Peak expiratory flow rate PROCESS 1) Rate of hospitalisation |
|
| Notes | ||
| Risk of bias | ||
| Bias | Authors' judgement | Support for judgement |
| Random sequence generation (selection bias) | Unclear risk | No description of sequence generation |
| Allocation concealment (selection bias) | High risk | Sample was randomly selected from those attended the emergency department or referral clinic |
| Baseline outcomes similar? | Low risk | Peak expiratory rate was similar |
| Baseline characteristics similar? | Unclear risk | Statistical analysis of variables were not reported and some of the differences look large |
| Blinding (performance bias and detection bias) | Low risk | Objective outcomes |
| Protection against contamination? | High risk | Randomisation by patient in a single centre |
| Incomplete outcome data (attrition bias) All outcomes | High risk | Patients lost but no description of how this taken into account in analysis |
| Selective reporting (reporting bias) | Low risk | All outcomes listed in methods were reported in results |
| Free from other bias? | Low risk | None identified |
Adepu 2007.
| Methods | Randomised controlled trial Unit of randomisation and analysis: patient |
|
| Participants | Two community pharmacies in Calicut and Kerala in India (lower middle income country) Type‐2 diabetes mellitus patients patients ‐ 70 (35 intervention group, 35 control group) provider (delivering intervention) ‐ not clear practice ‐ 2 no unit of analysis error |
|
| Interventions | targeted towards PATIENTS Intervention group received counselling on diabetes mellitus, medication, diet and lifestyle modifications along with the patient information leaflet explaining disease, diet and lifestyle modifications.vs. Usual care Length of each intervention: Not clear Number of intervention episodes: It is not clear; however, study was conducted for 6 months. Unit of analysis error: Not clear |
|
| Outcomes | PATIENT 1) Random capillary blood glucose measurement 2) Assessment of the quality of life by administering a disease‐specific audit of Diabetes Dependent Quality of Life questionnaire (ADDQOL) including 18 life domain along with the two additional over view questions. 18 life domains such as freedom to eat, freedom to drink and enjoyment of food, family life, sex life, ease of travelling, working life and finance were included |
|
| Notes | ||
| Risk of bias | ||
| Bias | Authors' judgement | Support for judgement |
| Random sequence generation (selection bias) | Unclear risk | No description provided |
| Allocation concealment (selection bias) | Unclear risk | Not explicitly described |
| Baseline outcomes similar? | Unclear risk | Glucose levels different at baseline, but not clear is statistically significance |
| Baseline characteristics similar? | Low risk | Demographic values, disease history duration and treatment aspect were similar between the groups |
| Blinding (performance bias and detection bias) | Low risk | Objective outcomes |
| Protection against contamination? | High risk | Communication between groups was possible as patients were randomised |
| Incomplete outcome data (attrition bias) All outcomes | Low risk | Intervention: 32 patients completed the study Control: 28 patients completed the study |
| Selective reporting (reporting bias) | Low risk | All outcomes listed in methods were reported in results |
| Free from other bias? | Low risk | None identified |
Arun 2008.
| Methods | Randomised controlled trial Unit of randomisation and analysis: patient |
|
| Participants | Three primary health centres in Northern Tamil Nadu, India (lower middle income country) Type‐2 diabetes patients patients ‐ 154 ( 104 intervention group, 50 control group) provider (delivering intervention) ‐ not clear practice ‐ 3 unit of analysis error: not clear |
|
| Interventions | targeted towards PATIENT Counselling delivered by pharmacist (content of counselling is not explicitly described) versus usual care Length of each intervention: not clear Number of intervention episodes: intervention was delivered every month over 5 months |
|
| Outcomes | PATIENT 1) Fasting plasma glucose level (mg/dl) 2) Health related Quality of life (HRQoL) was assessed using Ferrans and Powers questionnaire (0‐30 score range) |
|
| Notes | ||
| Risk of bias | ||
| Bias | Authors' judgement | Support for judgement |
| Random sequence generation (selection bias) | Unclear risk | Not explicitly described |
| Allocation concealment (selection bias) | Unclear risk | Not explicitly described |
| Baseline outcomes similar? | Low risk | Blood pressure between control and intervention group was similar |
| Baseline characteristics similar? | Low risk | Demographic values were similar between the groups |
| Blinding (performance bias and detection bias) | Low risk | Objective outcomes |
| Protection against contamination? | High risk | Two people from same family or friends could have been assigned to different group as the study was conducted by randomising patients |
| Incomplete outcome data (attrition bias) All outcomes | Unclear risk | Only numbers of patients who completed study given |
| Selective reporting (reporting bias) | Low risk | All outcomes listed in methods reported in results |
| Free from other bias? | Low risk | Data was collected from the patients from someone other than the pharmacist doing the intervention |
Ebid 2006.
| Methods | Randomised controlled trial Unit of randomisation and analysis: patient |
|
| Participants | University affiliated outpatient pharmacy of EL‐Demerdash Teaching Hospital Cairo, Egypt (lower middle income country) Patients with asthma or chronic obstructive pulmonary disease (COPD) patients ‐ asthmatic patients 200 ( 100 intervention group, 100 control group); patients with COPD 150 (75 intervention group, 75 control group) provider (delivering intervention) ‐ not clear practice ‐ 1 no unit of analysis error |
|
| Interventions | targeted towards PATIENTS Pharmaceutical‐care, which includes educational session on disease, planning goals, medication, and mode of action of drug, side‐effects and risk‐factors for disease was provided. In addition, 12‐paged booklet consisting of essential information on asthma/COPD, self‐care and management was also provided. Asthmatic patients and patients with COPD were educated separately versus usual care Length of each intervention: Education session consisting of 2 hours baseline interview of 5 to 8 persons followed by individual session of 20‐30 minutes Number of intervention episodes: every month over 6 months (6 times) |
|
| Outcomes | PATIENTS 1) Health Related Quality of Life (HRQOL) score PROCESS 1) Number of visits to Private clinics (PCs) or Outpatient clinics (OCs) 2) Number of Emergency Room (ER) visits and hospitalisation |
|
| Notes | ||
| Risk of bias | ||
| Bias | Authors' judgement | Support for judgement |
| Random sequence generation (selection bias) | Unclear risk | Not explicitly described |
| Allocation concealment (selection bias) | Unclear risk | Not explicitly described |
| Baseline outcomes similar? | Unclear risk | Differences in baseline measurements for primary outcomes was not reported |
| Baseline characteristics similar? | Low risk | Demographic values, smoking pattern, duration of disease were similar between the intervention and control group |
| Blinding (performance bias and detection bias) | Low risk | the technical staff did not know whether the patients belonged to the control or intervention group and the outcome was objective |
| Protection against contamination? | High risk | Single centre trial |
| Incomplete outcome data (attrition bias) All outcomes | High risk | No data reported or imputed for patients lost to follow‐up |
| Selective reporting (reporting bias) | Low risk | Outcomes listed in methods were reported in results |
| Free from other bias? | Low risk | None identified |
Gonzalez‐Martin 2003.
| Methods | Randomised controlled trial Unit of randomisation and analysis: patient |
|
| Participants | Outpatient clinic of the Department of Pediatrics of the Catholic University of Chile (upper‐middle income country) Children with stable and moderate asthma as defined by the American Thoracic Society Guidelines who were scheduled for outpatient visits with their internist over one year period patients 21 (11 intervention group, 10 control group) provider (delivering intervention) ‐ not clear practice ‐ 1 no unit of analysis error |
|
| Interventions | targeted towards PATIENTS Face to face educational session on asthma, medication therapy, self‐management, inhalation techniques along with the provision of explanatory booklet illustrating all these topics versus usual care Length of each intervention: 30 minutes Number of intervention episodes: 3 over 9 weeks |
|
| Outcomes | PATIENTS 1) Pediatric asthma quality of life questionnaire (PAQLQ) assessment which includes three domains i.e. emotion, activities limitation and symptoms ‐ score on each item ranged from 1 to 7, where 1 indicate maximum impairment and 7 indicates no impairment 2) Spirometric value measurement: Forced vital capacity (FVC) and forced expiratory flow (FEV) |
|
| Notes | ||
| Risk of bias | ||
| Bias | Authors' judgement | Support for judgement |
| Random sequence generation (selection bias) | Unclear risk | Not explicitly described |
| Allocation concealment (selection bias) | Unclear risk | Not explicitly described |
| Baseline outcomes similar? | Low risk | Difference was not statistically significant for mean age, FEV1, emotion, score, activities score, and symptom score. |
| Baseline characteristics similar? | Low risk | Clinical characteristics were similar between the intervention and control group |
| Blinding (performance bias and detection bias) | Low risk | Objective outcomes |
| Protection against contamination? | High risk | Intervention and control groups were treated in the same clinic |
| Incomplete outcome data (attrition bias) All outcomes | Low risk | All 21 participants enrolled completed the study |
| Selective reporting (reporting bias) | Low risk | Outcomes listed in methods were reported in results |
| Free from other bias? | Low risk | None identified |
Lugo 2007.
| Methods | Randomised controlled trial Unit of randomisation and analysis: patient |
|
| Participants | Four community pharmacies in Paraguay (lower‐middle income country) Hypertensive patients patients ‐ 70 ( 35 intervention group, 35 control group) provider (delivering intervention) ‐ not clear practice ‐ 4 no unit of analysis error |
|
| Interventions | targeted towards PATIENT Patients received the program (pharmaceutical follow‐up) over 6 months with each patient’s care and recommended advice recorded. Pharmaceutical care was based on Hepler and Strand 1990, which includes interviews, counselling and educational session with patients regarding medication and healthy lifestyle. Forms were also provided to the patients to record their medicine usage. Provision of periodic outcome measurement, counselling and distribution of education pamphlets along with a basket of healthy food to encourage healthy lifestyle versus usual care Length of each intervention: not clear Number of intervention episodes: It is not clear; however, study was conducted for 6 months |
|
| Outcomes | PATIENTS Blood pressure 1) Systolic 2) Diastolic 3) Distribution of patients in various categories of hypertension. |
|
| Notes | ||
| Risk of bias | ||
| Bias | Authors' judgement | Support for judgement |
| Random sequence generation (selection bias) | Unclear risk | Not explicitly described |
| Allocation concealment (selection bias) | Unclear risk | Not explicitly described |
| Baseline outcomes similar? | Unclear risk | Not explicitly mentioned |
| Baseline characteristics similar? | High risk | different hypertension histories |
| Blinding (performance bias and detection bias) | Low risk | Objective outcomes |
| Protection against contamination? | Unclear risk | Chances of contamination |
| Incomplete outcome data (attrition bias) All outcomes | Low risk | Complete outcome data reported |
| Selective reporting (reporting bias) | Unclear risk | data not clearly provided for intervention and control group for all outcomes |
| Free from other bias? | Low risk | None identified |
Paulos 2005.
| Methods | Randomised controlled trial Unit of randomisation and analysis: patient |
|
| Participants | A community pharmacy in Santiago, Chile (upper‐middle income country) Patients being treated for dyslipidemia patients ‐ 42 ( 23 intervention group, 19 control group) provider (delivering intervention) ‐ 1 practice ‐1 no unit of analysis error |
|
| Interventions | targeted towards PATIENT Intervention includes complete pharmaceutical plan with scheduled follow‐up. Pharmaceutical care includes: i. Measuring total cholesterol level and triglycerides level ii. Providing educational session/counselling to patients about the role of cholesterol in illness and health, risk‐factors associated with cardiovascular disease and medication iii. In each interview, drug‐related problems (DRP) were also determined, resolved and prevented based on the information obtained from the patients and medical records. Patients detected with DRP were referred to a physician iv. Specifically designed brochure for educating out‐patients on the disease and healthy lifestyle was provided and explained in the third and fourth interview and were followed‐up with question and answer session to ensure full‐understanding. vs. Usual care Length of the each intervention: 20‐25 minutes Number of intervention episodes: 5 times over 16 weeks |
|
| Outcomes | PATIENTS 1) Blood Cholesterol level 2) Triglyceride level 3) % of patients with decrease in total cholesterol 4) % of patients with decrease in triglyceride level 5) Assessment of Quality of Life index using SF‐36 |
|
| Notes | ||
| Risk of bias | ||
| Bias | Authors' judgement | Support for judgement |
| Random sequence generation (selection bias) | Unclear risk | Not explicitly described |
| Allocation concealment (selection bias) | Unclear risk | Not explicitly described |
| Baseline outcomes similar? | Unclear risk | Significance for differences in baseline measurements for primary outcomes was not reported |
| Baseline characteristics similar? | Unclear risk | Not explicitly mentioned |
| Blinding (performance bias and detection bias) | Low risk | Objective outcomes |
| Protection against contamination? | High risk | Randomised by patient within one practice |
| Incomplete outcome data (attrition bias) All outcomes | Unclear risk | Only number of patients who completed the study given |
| Selective reporting (reporting bias) | Unclear risk | Not explicitly mentioned |
| Free from other bias? | Low risk | None identified |
Petkova 2008.
| Methods | Randomised controlled trial Unit of randomisation and analysis: patient |
|
| Participants | Ten community pharmacies in Sofia, Bulgaria (upper‐middle income country) Patients registered as having asthma patients ‐ 50 ( 22 intervention group, 28 control group) provider (delivering intervention) ‐ One pharmacist and 10 pre‐graduating pharmacists who had passed their exam in pharmaceutical care practice ‐ 10 no unit of analysis error |
|
| Interventions | targeted towards PATIENTS Educational program on the disease, possible adverse drug reactions, recognition of early signs of exacerbation, instruction on the appropriate use of medication, training in the inhaler technique, the identification and control of asthma attacks, tobacco use and efficacy of different methods on smoking cessation. Furthermore, educational leaflets were distributed after an educational session. Length of each intervention: Not clear Number of intervention episodes: 4 educational sessions over 4 months |
|
| Outcomes | PATIENTS 1) Peak Expiratory Flow rate (L/min.) by using peak flow‐meter 2) Quality of Life score: Patient’s quality of life was assessed though a disease‐specific instrument Asthma specific form (score: 1‐ “interference all of the time,” to 5‐“interference none of the time”) which included 8 questions like duration and severity of disease, reasons for triggering asthma, application of inhaler during the past 4 weeks, availability of shortness of breath during past 4 weeks, frequency of hospitalisation and urgent medical aid calls (UMA) in the past 4 weeks and fully experienced day at work and at home in the past 4 weeks versus usual care PROCESS 1) Hospitalisation rate 2) GP visits |
|
| Notes | ||
| Risk of bias | ||
| Bias | Authors' judgement | Support for judgement |
| Random sequence generation (selection bias) | Low risk | Random numbers used |
| Allocation concealment (selection bias) | Unclear risk | reported that separation was based on the willingness to take part in the educational program |
| Baseline outcomes similar? | Low risk | PEF rate and QOL score was similar |
| Baseline characteristics similar? | High risk | Mean age lower in intervention group as compared to control group and large differences in some variables |
| Blinding (performance bias and detection bias) | Low risk | Objective outcomes and GP visits and Hospitalisation were verified through medical records |
| Protection against contamination? | High risk | Chance of contamination if patients of different groups were from the same family or if they were related. |
| Incomplete outcome data (attrition bias) All outcomes | Low risk | Complete outcome data reported |
| Selective reporting (reporting bias) | Low risk | All outcomes listed in method was reported in result |
| Free from other bias? | Low risk | None identified |
Petkova 2009.
| Methods | Randomised control trials Unit of randomisation and analysis: patient |
|
| Participants | Twenty community pharmacy in Sofia, Bulgaria (upper middle income country) Registered rheumatoid arthritis and osteoarthritis patients in the StIvan Rilski University Multiple profile Hospital. patients‐ 90 ( 45 intervention group, 45 control group) provider (delivering intervention) ‐ One pharmacist and 5 pre‐graduating pharmacists who had passed their exam in pharmaceutical care. practice ‐ 20 no unit of analysis error |
|
| Interventions | targeted towards PATIENTS Educational program was delivered by pharmacists on: a) Information about disease, factor contributing in complications, how to differentiate the different kinds of arthritis, risk factors for development of arthritis. b) The correct application of “heat” and “cold” therapy. c) The importance of physical training and joint protection. d) Pain management, pharmacotherapy and possible adverse drug reactions (ADRs) during treatment. vs. Usual care Length of each intervention: Not clear Number of intervention episodes: 4 sessions over 4 month period |
|
| Outcomes | PATIENTS Patients’ subjective opinion of their quality of life were analysed by using Brief Pain Inventory which uses 0 to 10 scales with 0 being “no interference” and 10 being “complete interference” and was based on pain interference with various domains like general activity, mood, walking ability, normal work, relation with other people, sleep and enjoyment of life. PROCESS Visits to GP i. Not at all ii. More than 6 times |
|
| Notes | ||
| Risk of bias | ||
| Bias | Authors' judgement | Support for judgement |
| Random sequence generation (selection bias) | Low risk | Random numbers used |
| Allocation concealment (selection bias) | Unclear risk | Not explicitly described |
| Baseline outcomes similar? | Low risk | Score of arthritis interference in patients’ daily routine was found to be similar in both groups. |
| Baseline characteristics similar? | High risk | Mean age lower in control group |
| Blinding (performance bias and detection bias) | Low risk | Objective outcomes (objective outcomes assessed; Brief Pain Index‐validated pain assessment tool—assuming appropriately translated for Bulgarian population) |
| Protection against contamination? | High risk | Single centre trial |
| Incomplete outcome data (attrition bias) All outcomes | Low risk | One patient from intervention and two patients from controlled group ceased the study which might not affect the result |
| Selective reporting (reporting bias) | Low risk | Outcomes listed in method was reported in result |
| Free from other bias? | Low risk | None identified |
Sookaneknun 2004.
| Methods | Randomised controlled trial Unit of randomisation and analysis : patient |
|
| Participants | One university‐affiliated community pharmacy in Mahasarakham and two primary care units in in Takonyarng village and Kharmrieng village, Thailand (Lower‐middle income country) Hypertensive patients patients‐ 235 ( 118 intervention group, 117 control group) provider (delivering intervention) ‐ a research pharmacist practice‐3 no unit of analysis error |
|
| Interventions | targeted towards PATIENTS Pharmacist intervention consists of counselling on the use of medications, identifying, resolving and preventing drug related problems (DRP) and monitoring of blood pressure. In addition, pharmacists provided education to patients on non‐pharmacological approach of controlling the disease, like exercise, healthy diet, smoking, alcohol and weight reduction etc. Educational leaflets along with the diary to record lifestyle were also provided to the patients versus usual care Length of each intervention: 30‐50 minutes Number of intervention episodes: every month over 6 months (6 times) |
|
| Outcomes | PATIENTS Blood Pressure 1) Systolic 2) Diastolic 3) % of patients controlled for systolic blood pressure and diastolic blood pressure |
|
| Notes | ||
| Risk of bias | ||
| Bias | Authors' judgement | Support for judgement |
| Random sequence generation (selection bias) | Unclear risk | Not explicitly described |
| Allocation concealment (selection bias) | Unclear risk | Not explicitly described |
| Baseline outcomes similar? | Low risk | Baseline measurement of systolic and diastolic blood pressure was found to be equal in intervention and control group |
| Baseline characteristics similar? | Low risk | Demographic variables and disease was similar between two groups |
| Blinding (performance bias and detection bias) | Low risk | Objective outcomes |
| Protection against contamination? | Unclear risk | Single centre trial |
| Incomplete outcome data (attrition bias) All outcomes | Low risk | Intention‐to‐treat analysis done although few patients dropped out from both intervention and control group |
| Selective reporting (reporting bias) | Low risk | Outcomes listed in methods were reported in results |
| Free from other bias? | Low risk | None identified |
Suppapitiporn 2005.
| Methods | Randomised controlled trial Unit of randomisation and analysis: patient |
|
| Participants | Outpatient department of King Chulalongkorn Memorial Hospital, Thailand (lower middle income country) Type‐2 diabetes patients patients ‐ 360 (180 intervention group, 180 control group) provider (delivering intervention) ‐ 1 practice ‐ 1 no unit of analysis error |
|
| Interventions | targeted towards PATIENT 4 intervention groups Intervention1 (n=50): disease counselling and education by pharmacists + diabetes booklet + special medication containers Intervention 2 (n=50): received counselling + special medication containers Intervention 3 (n=30): disease counselling and education Intervention 4 (n=50): disease counselling + diabetes information booklet versus usual care Length of each intervention: Not clear Number of intervention episodes: 3 interventions at 0, 3 and 6 months |
|
| Outcomes | PATIENTS 1) Mean Fasting Plasma Glucose (FPG) 2) HbA1c |
|
| Notes | ||
| Risk of bias | ||
| Bias | Authors' judgement | Support for judgement |
| Random sequence generation (selection bias) | Unclear risk | Not specified |
| Allocation concealment (selection bias) | Unclear risk | Not explicitly described |
| Baseline outcomes similar? | Low risk | FPG (mg %) and HbA1c (mg %) were similar between intervention and control groups |
| Baseline characteristics similar? | Low risk | Demographic variables and medical history were similar between the groups |
| Blinding (performance bias and detection bias) | Low risk | Outcome variables were objective and medical records were used to assess outcome |
| Protection against contamination? | High risk | Subjects recruited from the single hospital |
| Incomplete outcome data (attrition bias) All outcomes | Low risk | Appears that outcome data was collected on all patients enrolled |
| Selective reporting (reporting bias) | Unclear risk | Outcomes not listed in methods |
| Free from other bias? | Low risk | None identified |
Zwarenstein 2007.
| Methods | Cluster randomised trial Unit of randomisation and analysis: general practice |
|
| Participants | General Practices, Mitchells Plain, Cape Town, South Africa (upper‐middle income country) 43 general practices (21 intervention group, 22 control group) 318 asthmatic children provider (delivering intervention) ‐ 1 no unit of analysis error |
|
| Interventions | targeted towards HEALTH CARE PROFESSIONALS
pharmacist versus no intervention Educational session for GPs which contained 8 key messages aimed at improving diagnosis, prescribing and follow‐up care for children with diagnosis. The intervention was academic detailing and tools such as visual aids were used. Length of each intervention: 30 minutes Number of intervention episodes: 2 visits over 3 months |
|
| Outcomes | PATIENT Change in asthma symptoms score reported by parent or guardian based on the three attack frequency questions. Question was weighed by 0 to 3 points depending on the frequency of attacks in last 12 months. Furthermore, 1 to 2 episodes equalled 1 point, 3 episodes equalled 2 points, and 4 or more equalled 3 points. The maximum score that could be attained was 9 and minimum was 0 |
|
| Notes | ||
| Risk of bias | ||
| Bias | Authors' judgement | Support for judgement |
| Random sequence generation (selection bias) | Low risk | Random numbers used |
| Allocation concealment (selection bias) | Low risk | Used computer generator list |
| Baseline outcomes similar? | Low risk | Similar asthma symptom score between intervention and control groups |
| Baseline characteristics similar? | Low risk | Demographic variables similar |
| Blinding (performance bias and detection bias) | Low risk | Objective outcomes assessed; Asthma Sx score ‐ validated tool |
| Protection against contamination? | Low risk | Cluster randomisation |
| Incomplete outcome data (attrition bias) All outcomes | Low risk | Complete outcome data reported |
| Selective reporting (reporting bias) | Low risk | All outcomes listed in method was reported in result |
| Free from other bias? | Low risk | None identified |
Characteristics of excluded studies [ordered by study ID]
| Study | Reason for exclusion |
|---|---|
| Abu 2009 | Intervention was not delivered by pharmacists. Jordan (Lower middle income country) |
| Aguwa 2008 | Before and after uncontrolled study with only one point of measurement before as well as after the intervention. Nigeria (Lower middle income country) |
| Agyepong 2002 | Intervention was delivered by multi‐disciplinary team. Ghana (Low income country) |
| Akoria 2008 | Intervention was not delivered by pharmacists. Nigeria (Lower middle income country) |
| Alam 2007 | Commentary Nepal (Low income country) |
| Anderson 2004 | Study was conducted in USA. USA (High income country) |
| Angalakuditi 2003 | Before and after uncontrolled study with only one point of measurement before as well as after the intervention. India (Lower middle income country) |
| Angunawela, 1991 | Intervention was delivered by multi‐disciplinary team. Sri Lanka (Lower middle income country) |
| Aramwit 2003 | Interrupted time series analysis with three data points not clearly reported. Only mean of three points was reported in the result. Thailand (Lower middle income country) |
| Armando 2001 | No comparison of pre and post measurements. Descriptive study of the intervention. Argentina (Upper middle income country) |
| Armando 2005 | No comparison of pre and post measurements. Descriptive study of the intervention. Argentina (Upper middle income country) |
| Awad 2006 | Intervention was not delivered by pharmacists. Sudan (Lower middle income country) |
| Beaton 2004 | Study was conducted in USA. USA (High income country) |
| Birrell 2000 | Retrospective study. Tanzania (Low income country) |
| Botha 1992 | Interrupted time series analysis with only one point of measurement before and two points of measurement after the intervention. South Africa (Upper middle income country) |
| Brimkulov 2009 | Intervention was not delivered by pharmacists. Kyrgyzstan (Low income country) |
| Castro‐Rios 2008 | Intervention was not delivered by pharmacists. Mexico (Upper middle income country) |
| Chaikoolvatana 2006 | Both inpatients and outpatients were included as participants. Thailand (Lower middle income country) |
| Chaiyakunapruk 2006 | Cross‐sectional study. Thailand (Lower middle income country) |
| De Andrade 2009 | Outcome was patient satisfaction. Brazil (Upper middle income country) |
| De Lyra 2008 | Before and after uncontrolled study with only one point of measurement before as well as after the intervention. Brazil (Upper middle income country) |
| De Souza 2007 | Before and after uncontrolled study with only one point of measurement before as well as after the intervention. Brazil (Upper middle income country) |
| Domecq 1991 | Before and after uncontrolled study with only one point of measurement before as well as after the intervention. Chile (Upper middle income country) |
| Dowse 2001 | Outcomes were knowledge and drug adherence (not desired outcome). South Africa (Upper middle income country) |
| Dowse 2005 | Patients were followed up for only a few days and outcome was knowledge (not desired outcome). South Africa (Upper middle income country) |
| Dubey 2006 | Commentary. Nepal (Low income country) |
| Eltayeb 2005 | Profession of individual delivering the intervention was not clear. Sudan (Lower middle income country) |
| Erhun 2005 | Retrospective control group. Nigeria (Lower middle income country) |
| Esmaily 2009 | Intervention delivered by multi‐disciplinary team. Iran (Lower middle income country) |
| Garjani 2009 | Intervention was not delivered by pharmacists. Iran (Lower middle income country) |
| Gonzalez 1996a | Intervention was not delivered by pharmacists. Cuba (Upper middle income country) |
| Greenberg 2005 | Intervention was not delivered by pharmacists. Russia (Upper middle income country) |
| Gupta 2005 | Intervention was delivered by multidisciplinary team. India (Lower middle income country) |
| Gutierrez 1994 | Intervention was not delivered by pharmacists. Mexico (Upper middle income country) |
| Jing 2009 | Retrospective study. Malaysia (Upper middle income country) |
| Lyra 2007 | Qualitative reporting of outcome Brazil (Upper middle income country) |
| Mao 2008 | Intervention was not delivered by pharmacists. China (Lower middle income country) |
| Me'emary 2009 | Intervention was not delivered by pharmacists. Syrian Arab Republic (Lower middle income country) |
| Meyer 2001 | Intervention was not delivered by pharmacists. South Africa (Upper middle income country) |
| Mohagheghi 2005 | Intervention was not delivered by pharmacists. Iran (Lower middle income country) |
| Nascimento 2009 | Observational, longitudinal, non‐concurrent study. Brazil (Upper middle income country) |
| Ngoh 1997 | Pharmacist intervention was for basic short counselling. Cameroon (Lower middle income country) |
| Odusanya 2004 | Profession of individual delivering the intervention was not clear. Nigeria (Lowermiddle income country) |
| Ofori‐Adjei 1996 | Intervention was not delivered by pharmacists. Ghana (Low income country) |
| Oparah 2006 | Before and after uncontrolled study with only one point of measurement before and after the intervention. Nigeria (Lower middle income country) |
| Osiri 2001 | Cross‐sectional study Thailand (Lower middle income country) |
| Pankonin 2008 | Cross‐sectional study Vietnam (Low income country) |
| Park 2007 | Intervention was delivered by multi‐disciplinary team. Korea, Republic (High income country) |
| Perera 1988 | Cross‐sectional study Sri Lanka (Lower middle income country) |
| Perez 2003 | Hospital‐based intervention Colombia (Upper middle income country) |
| Perez‐Cuevas 1996 | Intervention was not delivered by pharmacists Mexico (Upper middle income country) |
| Petkova 2005 | Interrupted time series analysis with only one point of measurement before and three points of measurement after the intervention. Bulgaria (Upper middle income country) |
| Petkova 2006 | Interrupted time series analysis with only one point of measurement before and three points of measurement after the intervention. Bulgaria (Upper middle income country) |
| Ratanajamit 2009 | Hospital‐based intervention. Thailand (Lower middle income country) |
| Rivera 2006 | Before and after uncontrolled study with only one point of measurement before and after the intervention. Mexico (Upper middle income country) |
| Rosen 1978 | Study conducted in USA. USA (High income country) |
| Rosen 1978a | Study conducted in USA. USA (High income country) |
| Santos 2006 | No comparison of pre and post measurements. Brazil (Upper middle income country) |
| Santoso 1996 | Intervention was not delivered by pharmacists Indonesia (Lower middle income country) |
| Suryaprakasha 1983 | Commentary India (Lower middle income country) |
| Turnacilar 2009 | Interrupted time series analysis with only one point of measurement before and six points of measurement after the intervention Turkey (Upper middle income country) |
| Udomthavornsuk 1991 | Intervention was not delivered by pharmacists. Thailand (Lower middle income country) |
| Wood 2008 | Commentary South Africa (Upper middle income country) |
Characteristics of studies awaiting assessment [ordered by study ID]
Adisa 2012.
| Methods | Randomised controlled trial |
| Participants | Diabetic patients (Nigeria) |
| Interventions | Pharmacist based educational, behavioural and motivational intervention |
| Outcomes | Fasting plasma glucose level and medication adherence |
| Notes |
AJP 2011.
| Methods | Not known |
| Participants | Not known |
| Interventions | Not known |
| Outcomes | Not known |
| Notes | Abstract is not available. |
Azzopardi 2010.
| Methods | Randomised controlled trial |
| Participants | Rheumatoid arthritis patients on methotrexate |
| Interventions | Clinical pharmacist intervention |
| Outcomes | Quality of life using SF‐36 questionnaire |
| Notes | Country where the study was conducted is not clear |
Correr 2011.
| Methods | Non‐randomised controlled trial (NRCT) |
| Participants | Type 2 diabetic patients (Brazil) |
| Interventions | Pharmacotherapy follow‐up (PF) on metabolic control and clinical outcomes in type 2 diabetic patients. |
| Outcomes | Glycosylated Haemoglobin A1 (HbA1) and fasting capillary glycaemia. |
| Notes |
Costa 2012.
| Methods | Prospective controlled study |
| Participants | HIV positive patients (Brazil) |
| Interventions | Pharmacotherapeutic follow‐up (PFU) |
| Outcomes | CD4 count |
| Notes | Type of study is not clear |
Dewulf 2011.
| Methods | Interventional study |
| Participants | Patients with inflammatory bowel disease at hospital (Brazil) |
| Interventions | Pharmaceutical care program |
| Outcomes | Quality of life (QOL) and disease clinical activity indexes (CAI) |
| Notes | Type of study is not clear |
Dewulf 2012.
| Methods | Randomised controlled trial |
| Participants | Patients with inflammatory bowel disease at outpatient department (Brazil) |
| Interventions | Pharmaceutical care program |
| Outcomes | Compliance to medicine therapy (CMT), patient knowledge on drugs used (KDU), quality of life (QOL) and disease clinical activity indexes (CAI) |
| Notes |
Fahimi 2011.
| Methods | Randomised controlled trial |
| Participants | Patients on warfarin therapy |
| Interventions | Pharmacist‐based warfarin‐monitoring service |
| Outcomes | Control of international normalized ratio (INR) within the therapeutic range |
| Notes |
Farsaei 2011.
| Methods | Randomised Controlled Trial |
| Participants | Type 2 diabetic patients (Iran) |
| Interventions | Clinical pharmacist‐led patient education program for type 2 diabetic patients |
| Outcomes | Fasting blood glucose level and glycosylated haemoglobin |
| Notes |
Fuchs 2010.
| Methods | Randomised controlled trial |
| Participants | Hypertensive patients under drug treatment (Brazil) |
| Interventions | Pharmacist care with home BP measuring device |
| Outcomes | Systolic and diastolic blood pressure |
| Notes |
Lavoie 2011.
| Methods | Randomised controlled trial |
| Participants | Asthmatic patients |
| Interventions | Motivational intervention |
| Outcomes | Inhaled corticosteroid (ICS) adherence |
| Notes | Country where the study was conducted is not clear |
Lee 2012.
| Methods | Prospective trial |
| Participants | Hypertensive patients |
| Interventions | Pharmacist counselling service regarding hypertension, lifestyle modification and drug compliance checking |
| Outcomes | Systolic and diastolic blood pressure |
| Notes | Country where the study was conducted is not clear |
Lores 2011.
| Methods | Prospective and intervention study |
| Participants | Congestive heart failure patients |
| Interventions | Pharmacotherapeutic monitoring by pharmacists |
| Outcomes | Detection, prevention and resolution of adverse events |
| Notes | Outcomes and type of study is not clear as the article is in Spanish |
Magedanz 2012.
| Methods | Before and after study |
| Participants | Cardiac patients (Brazil) |
| Interventions | Antimicrobial stewardship program by Pharmacist |
| Outcomes | Consumptions of antibiotics |
| Notes |
Malaty 2011.
| Methods | Randomised controlled trial |
| Participants | Nonpregnant females aged 18‐80 years who had been prescribed with fluconazole |
| Interventions | Pharmacist educational intervention on vulvovaginal candidiasis |
| Outcomes | Utilisation of fluconazole |
| Notes | Country where the study was conducted is not clear |
Maria 2012.
| Methods | Not known |
| Participants | Patients on Antiretroviral therapy |
| Interventions | Pharmaceutical care program on adherence to Antiretroviral therapy |
| Outcomes | Adherence rate |
| Notes | Country where the study was conducted is not clear |
Mohammad 2011.
| Methods | Not known |
| Participants | Patients discharged from hospital |
| Interventions | (1) Therapeutic drug monitoring, (2) resolution of medication discrepancies (3) medication and adherence counselling, and (4) identification and prevention of adverse drug events (ADEs). |
| Outcomes | Resolving important medication‐related problems and needs |
| Notes | Country where the study was conducted is not clear |
Mori 2010.
| Methods | Not known |
| Participants | Hypertensive patients (Brazil) |
| Interventions | Educational program aimed at improving hypertensive patients' compliance to treatment |
| Outcomes | Serum levels of cholesterol and fractions of tryacylglicerol (TG), urine sodium and potassium, arterial pressure (AP), body mass index (BMI) and waist‐hip ratio (WHR) |
| Notes |
Moten 2010.
| Methods | Controlled study |
| Participants | Type 2 diabetic patients |
| Interventions | Medication therapy management (MTM) by pharmacists |
| Outcomes | Medication therapy management activities and glycosylated haemoglobin level |
| Notes | Country where the study was conducted is not clear and the research is in progress. |
Ola‐Olorun 2012.
| Methods | Randomised controlled trial |
| Participants | Hypertensive patients (Nigeria) |
| Interventions | Short message service (SMS) of mobile telephone to provide medicine information to patients with chronic illnesses |
| Outcomes | Adherence to therapy |
| Notes | Outcome is not clear |
Olives 2012.
| Methods | Randomised controlled study |
| Participants | Patients discharged with outpatient antibiotics |
| Interventions | Multimodality discharge instructions |
| Outcomes | Antibiotic compliance |
| Notes | Country where the study was conducted is not clear. |
Pinelli 2012.
| Methods | Not known |
| Participants | Renal transplant recipients (RTR) with diabetes |
| Interventions | Pharmacist‐managed diabetes and cardiovascular risk reduction care |
| Outcomes | Mean change in haemoglobin A1c (A1c) and percentage of RTR who obtained therapeutic goals |
| Notes | Country where the study was conducted is not clear. |
Saokaew 2012.
| Methods | Non randomised controlled study |
| Participants | Patients who had been receiving long‐term warfarin therapy for at least 3 months (Thailand) |
| Interventions | Pharmacist managed warfarin therapy |
| Outcomes | Time in therapeutic range (TTR), both actual‐ and expanded‐TTR, bleeding and thromboembolic complications, and physician’ acceptance of pharmacist suggestions. |
| Notes |
Shapiro 2010.
| Methods | Not known |
| Participants | Not known |
| Interventions | Not known |
| Outcomes | Not known |
| Notes |
Tahaineh 2011.
| Methods | Randomised controlled study |
| Participants | Dyslipidaemic patients (Jordan) |
| Interventions | Clinical pharmacy services |
| Outcomes | Change in low density lipoprotein cholesterol levels |
| Notes |
Tse 2011.
| Methods | Not known |
| Participants | Patients with respiratory disorders |
| Interventions | Clinical pharmacists consultation |
| Outcomes | Medication compliance |
| Notes | Country where the study was conducted is not clear. |
Contributions of authors
Sami Pande: development of the protocol, developing search strategies, searching studies, accessing articles, reviewing of articles for inclusion and exclusion, abstraction of data for the included papers, interpretation of results and writing and editing of the review.
Janet E Hiller: assisted with the development of the protocol, access to articles, reviewing of articles for inclusion and exclusion, abstraction of data for the included papers, review and editing of all drafts, assistance with interpretation of results and approval of the final version of the review.
Nancy Nkansah: assisted with interpretation of data, provided general advice on the review, duplicate risk of bias assessment of the subset of studies, edited the review draft, assisted in accessing articles and approval of the final version of the review.
Lisa Bero: study design, duplicate risk of bias assessment of the subset of studies, editing of review and approval of the final version of the review.
Declarations of interest
Sami Pande: none
Janet E Hiller: none
Nancy Nkansah: none
Lisa Bero: none
New
References
References to studies included in this review
Abdelhamid 2008 {published data only}
- Abdelhamid E, Awad A, Gismallah A. Evaluation of a hospital pharmacy‐based pharmaceutical care services for asthma patients. Pharmacy Practice 2008, issue 1:25‐32. [DOI] [PMC free article] [PubMed]
Adepu 2007 {published data only}
- Adepu R, Rasheed A, Nagavi B. Effect of patient counseling on quality of life in type‐2 diabetes mellitus patients in two selected South Indian community pharmacies: A study. Indian Journal of Pharmaceutical Sciences 2007; Vol. 69, issue 4:519‐24.
Arun 2008 {published data only}
- Arun K, Murugan R, Kanna M, Rajalakshmi S, Kalaiselvi R, Komathi V. The impact of pharmaceutical care on the clinical outcome of diabetes mellitus among a rural patient population. International Journal of Diabetes in Developing Countries 2008; Vol. 28, issue 1:15‐8. [DOI] [PMC free article] [PubMed]
Ebid 2006 {published data only}
- Ebid AH, Abdel‐Wahab E. Bronchial asthma and COPD: Impact of pharmaceutical care on outcomes and quality of life in Egyptian patients. Bulletin of Pharmaceutical Sciences 2006; Vol. 29, issue Part 1:167‐85.
Gonzalez‐Martin 2003 {published data only}
Lugo 2007 {published data only}
- Lugo De Ortellado G, Bittner MR, Chavez H, Perez S. Implementation of a pharmaceutical care program for the detection of hypertension and drug therapy to be followed up in community pharmacies. Acta Farmaceutica Bonaerense 2007; Vol. 26, issue 4:590‐5.
Paulos 2005 {published data only}
Petkova 2008 {published data only}
Petkova 2009 {published data only}
- Petkova VB. Education for arthritis patients: A community pharmacy based pilot project. Pharmacy Practice 2009; Vol. 7, issue 2:88‐93. [DOI] [PMC free article] [PubMed]
Sookaneknun 2004 {published data only}
Suppapitiporn 2005 {published data only}
- Suppapitiporn S, Chindavijak B, Onsanit S. Effect of diabetes drug counseling by pharmacist, diabetic disease booklet and special medication containers on glycemic control of type 2 diabetes mellitus: a randomized controlled trial. Journal of the Medical Association of Thailand. 2006/04/21 2005; Vol. 88 Suppl 4:S134‐41. [0125‐2208: (Print)] [PubMed]
Zwarenstein 2007 {published data only}
- Zwarenstein M, Bheekie A, Lombard C, Swingler G, Ehrlich R, Eccles M, et al. Educational outreach to general practitioners reduces children's asthma symptoms: A cluster randomised controlled trial. Implementation Science 2007; Vol. 2:30. [DOI] [PMC free article] [PubMed]
References to studies excluded from this review
Abu 2009 {published data only}
- Abu Rumman K, Ottmani S, Abu Sabra N, Baghdadi S, Seita A, Blanc L. Training on the practical approach to lung health: effect on drug prescribing in PHC settings in Jordan. Eastern Mediterranean Health Journal. 2009/05/28 2009; Vol. 15, issue 1:111‐21. [1020‐3397: (Print)] [PubMed]
Aguwa 2008 {published data only}
Agyepong 2002 {published data only}
- Agyepong IA, Ansah E, Gyapong M, Adjei S, Barnish G, Evans D. Strategies to improve adherence to recommended chloroquine treatment regimes: a quasi‐experiment in the context of integrated primary health care delivery in Ghana. Social Science & Medicine. 2002/11/01 2002; Vol. 55, issue 12:2215‐26. [0277‐9536: (Print)] [DOI] [PubMed]
Akoria 2008 {published data only}
- Akoria OA, Isah AO. Prescription writing in public and private hospitals in Benin City, Nigeria: the effects of an educational intervention. The Canadian Journal of Clinical Pharmacology. 2008/07/22 2008; Vol. 15, issue 2:e295‐305. [1710‐6222: (Electronic)] [PubMed]
Alam 2007 {published data only}
- Alam K, Palaian S, Shankar RP, Bista D, Mishra P, Prabhu MM. Role of pharmacist in counseling asthma patients. Pharmacy Times 2007; Vol. 39, issue 6:13‐8.
Anderson 2004 {published data only}
- Anderson RJ. Cost analysis of a managed care decentralized outpatient pharmacy anticoagulation service. Journal of Managed Care Pharmacy 2004; Vol. 10, issue 2:159‐65. [DOI] [PMC free article] [PubMed]
Angalakuditi 2003 {published data only}
- Angalakuditi MV, Sunderland VB. Liquid medication dosing errors: A pre‐post time series in India. International Journal of Pharmacy Practice 2003; Vol. 11, issue 2:105‐10.
Angunawela, 1991 {published data only}
Aramwit 2003 {published data only}
- Aramwit P, Assawawitoontip S. Evaluation of patient counseling on blood pressure control of out‐patients with hypertension at Chulalongkorn Hospital. Journal of the Medical Association of Thailand 2003; Vol. 86 Suppl 2:496‐500. [PubMed]
Armando 2001 {published data only}
- Armando PD, Semería N, Tenllado MI, Sola N. Dáder program in Argentina: Results of the first trimester activities. Pharmaceutical Care Espana 2001; Vol. 3, issue 3:196‐203.
Armando 2005 {published data only}
- Armando P, Semería N, Tenllado M, Sola N. Pharmacotherapeutic follow‐up of patients in community pharmacies. Seguimiento Farmacoterapéutico de Pacientes en Farmacias Comunitarias 2005; Vol. 36, issue 3:129‐34. [DOI] [PMC free article] [PubMed]
Awad 2006 {published data only}
Beaton 2004 {published data only}
Birrell 2000 {published data only}
Botha 1992 {published data only}
- Botha JH, Tyrannes I, Miller R, Wesley AG. Pharmacokinetic consultation program in a pediatric asthma clinic. American Journal of Hospital Pharmacy 1992; Vol. 49, issue 8:1936‐40. [PubMed]
Brimkulov 2009 {published data only}
- Brimkulov N, Ottmani SE, Pio A, Chubakov T, Sultanova A, Davletalieva N, et al. Feasibility test results of the Practical Approach to Lung Health in Bishkek, Kyrgyzstan. The International Journal of Tuberculosis and Lung Disease. 2009/04/02 2009; Vol. 13, issue 4:533‐9. [1027‐3719: (Print)] [PubMed]
Castro‐Rios 2008 {published data only}
- Castro‐Rios A, Reyes‐Morales H, Perez‐Cuevas R. [An evaluation of a continuing medical education program for primary care services in the prescription of hypoglycemic agents in diabetes mellitus type 2]. Salud Publica de Mexico. 2008/12/17 2008; Vol. 50 Suppl 4:S445‐52. [1606‐7916: (Electronic)] [DOI] [PubMed]
Chaikoolvatana 2006 {published data only}
- Chaikoolvatana A, Chanakit T, Juengrakpong A. The evaluation of a recurrent Adverse Drug Reaction Prevention Program in the north‐east region of Thailand. Journal of the Medical Association of Thailand. 2006/06/08 2006; Vol. 89, issue 5:699‐705. [0125‐2208: (Print)] [PubMed]
Chaiyakunapruk 2006 {published data only}
- Chaiyakunapruk N, Laowakul A, Karnchanarat S, Pikulthong N, Ongphiphadhanakul B. Community pharmacy‐based implementation and evaluation of an osteoporosis self‐assessment tool for Asians. Journal of the American Pharmaceutical Association. 2006/06/03 2006; Vol. 46, issue 3:391‐6. [1544‐3191: (Print)] [DOI] [PubMed]
De Andrade 2009 {published data only}
- Andrade TU, Burini DM, Mello MDO, Bersácula NDS, Saliba RAD, Bravim FT, et al. Evaluation of the satisfaction level of patients attended by a pharmaceutical care program in a private communitarian pharmacy in Vitória (ES, Brazil). Revista Brasileira de Ciencias Farmaceuticas/Brazilian Journal of Pharmaceutical Sciences 2009; Vol. 45, issue 2:349‐55.
De Lyra 2008 {published data only}
- Lyra Jr DP, Marcellini PS, Pelá IR. Effect of pharmaceutical care intervention on blood pressure of elderly outpatients with hypertension. Revista Brasileira de Ciencias Farmaceuticas/Brazilian Journal of Pharmaceutical Sciences 2008; Vol. 44, issue 3:451‐7.
De Souza 2007 {published data only}
Domecq 1991 {published data only}
- Domecq C, Apud P, Paulos C. Evaluation of an educational program on ambulatory patients consuming histamine H2‐receptor antagonists. Acta Farmaceutica Bonaerense 1991; Vol. 10, issue May‐Aug:97‐104.
Dowse 2001 {published data only}
Dowse 2005 {published data only}
Dubey 2006 {published data only}
- Dubey AK, Palaian S, Shankar PR, Mishra P, Prabhu M, Bhandari RB, et al. Introduction to medication errors and the error prevention initiatives in a teaching hospital in Western Nepal. Pakistan Journal of Pharmaceutical Sciences 2006; Vol. 19, issue 3:244‐51. [PubMed]
Eltayeb 2005 {published data only}
- Eltayeb IB, Awad AI, Mohamed‐Salih MS, Daffa‐Alla MA, Ahmed MB, Ogail MA, et al. Changing the prescribing patterns of sexually transmitted infections in the White Nile Region of Sudan. Sexually Transmitted Infections. 2005/10/04 2005; Vol. 81, issue 5:426‐7. [1368‐4973: (Print)] [DOI] [PMC free article] [PubMed]
Erhun 2005 {published data only}
Esmaily 2009 {published data only}
Garjani 2009 {published data only}
- Garjani A, Salimnejad M, Shamsmohamadi M, Baghchevan V, Vahidi RG, Maleki‐Dijazi N, et al. Effect of interactive group discussion among physicians to promote rational prescribing. Eastern Mediterranean Health Journal. 2009/06/27 2009; Vol. 15, issue 2:408‐15. [1020‐3397: (Print)] [PubMed]
Gonzalez 1996a {published data only}
- Gonzalez Ochoa E, Armas Perez L, Bravo Gonzalez JR, Cabrales Escobar J, Rosales Corrales R, Abreu Suarez G. Prescription of antibiotics for mild acute respiratory infections in children. Bulletin of the Pan American Health Organization. 1996/06/01 1996; Vol. 30, issue 2:106‐17. [0085‐4638: (Print)] [PubMed]
Greenberg 2005 {published data only}
Gupta 2005 {published data only}
Gutierrez 1994 {published data only}
- Gutierrez G, Guiscafre H, Bronfman M, Walsh J, Martinez H, Munoz O. Changing physician prescribing patterns: evaluation of an educational strategy for acute diarrhea in Mexico City. Medical Care. 1994/05/01 1994; Vol. 32, issue 5:436‐46. [0025‐7079: (Print)] [PubMed]
Jing 2009 {published data only}
- Jing YS, Lai PSM, Siew SC, Siew PC. The impact of pharmacist intervention on the use of activated vitamin D in a tertiary referral hospital in Malaysia. International Journal of Pharmacy Practice 2009; Vol. 17, issue 5:305‐11. [PubMed]
Lyra 2007 {published data only}
- Lyra DP Jr, Rocha CE, Abriata JP, Gimenes FR, Gonzalez MM, et al. Influence of Pharmaceutical Care intervention and communication skills on the improvement of pharmacotherapeutic outcomes with elderly Brazilian outpatients. Patient Education and Counseling. 2007/08/19 2007; Vol. 68, issue 2:186‐92. [0738‐3991: (Print)] [DOI] [PubMed]
Mao 2008 {published data only}
Me'emary 2009 {published data only}
- Me'emary F, Ottmani SE, Pio A, Baghdadi S, Assafin G, Koraym M, et al. Results of the feasibility test of the Practical Approach to Lung Health in the Syrian Arab Republic. Eastern Mediterranean Health Journal. 2009/09/08 2009; Vol. 15, issue 3:504‐15. [1020‐3397: (Print)] [PubMed]
Meyer 2001 {published data only}
Mohagheghi 2005 {published data only}
Nascimento 2009 {published data only}
- Nascimento YDA, Carvalho WDS, Acurcio FDA. Drug‐related problems observed in a pharmaceutical care service, Belo Horizonte, Brazil. Revista Brasileira de Ciencias Farmaceuticas/Brazilian Journal of Pharmaceutical Sciences 2009; Vol. 45, issue 2:321‐30.
Ngoh 1997 {published data only}
Odusanya 2004 {published data only}
- Odusanya OO, Oyediran MA. The effect of an educational intervention on improving rational drug use. The Nigerian Postgraduate Medical Journal 2004; Vol. 11, issue 2:126‐31. [PubMed]
Ofori‐Adjei 1996 {published data only}
Oparah 2006 {published data only}
- Oparah AC, Adje DU, Enato EFO. Outcomes of pharmaceutical care intervention to hypertensive patients in a Nigerian community pharmacy. International Journal of Pharmacy Practice 2006; Vol. 14, issue 2:115‐22.
Osiri 2001 {published data only}
- Osiri S, Richards M. Primary care treatment of upper respiratory tract infections in NE Thailand by pharmacists and physicians. Journal of Social and Administrative Pharmacy 2001; Vol. 18, issue 6:232‐8.
Pankonin 2008 {published data only}
Park 2007 {published data only}
Perera 1988 {published data only}
- Perera UA, Angunawela I. Basic drug information to patients attending medical clinics of a teaching hospital. The Ceylon Medical Journal. 1988/03/01 1988; Vol. 33, issue 1:27‐9. [0009‐0875: (Print)] [PubMed]
Perez 2003 {published data only}
Perez‐Cuevas 1996 {published data only}
- Perez‐Cuevas R, Guiscafre H, Munoz O, Reyes H, Tome P, Libreros V, et al. Improving physician prescribing patterns to treat rhinopharyngitis. Intervention strategies in two health systems of Mexico. Social Science & Medicine. 1996/04/01 1996; Vol. 42, issue 8:1185‐94. [0277‐9536: (Print)] [DOI] [PubMed]
Petkova 2005 {published data only}
- Petkova V. Evaluation of the impact of a pharmaceutical care program on patients with asthma. Ankara Universitesi Eczacilik Fakultesi Dergisi 2005; Vol. 34, issue 4:251‐62.
Petkova 2006 {published data only}
- Petkova V, Ivanova A, Petrova G. Education of patients with diabetes in the community pharmacies (pilot project in Bulgaria). Ankara Universitesi Eczacilik Fakultesi Dergisi 2006; Vol. 35, issue 2:111‐24.
Ratanajamit 2009 {published data only}
- Ratanajamit C, Kaewpibal P, Setthawacharavanich S, Faroongsarng D. Effect of pharmacist participation in the health care team on therapeutic drug monitoring utilization for antiepileptic drugs. Journal of the Medical Association of Thailand 2009; Vol. 92, issue 11:1500‐7. [PubMed]
Rivera 2006 {published data only}
- Rivera S, Lopez Orozco M. Design, implementation and assessment of a health education service on the correct use of drugs in a pediatric Mexican hospital. Diseño, Implementación y Evaluación de un Servicio de Educación Sanitaria Sobre el Uso Correcto de los Medicamentos en un Hospital Pediátrico Mexicano 2006; Vol. 4, issue 1:9‐12.
Rosen 1978 {published data only}
- Rosen CE, Copp WM, Holmes S. Effectiveness of a specially trained pharmacist in a rural community mental health center. Public Health Reports 1978; Vol. 93, issue 5:464‐7. [PMC free article] [PubMed]
Rosen 1978a {published data only}
- Rosen CE, Holmes S. Pharmacist's impact on chronic psychiatric outpatients in community mental health. American Journal of Hospital Pharmacy. 1978/06/01 1978; Vol. 35, issue 6:704‐8. [0002‐9289: (Print)] [PubMed]
Santos 2006 {published data only}
- Santos AC, Pereira DA, Silva OA, Lopes LC. Pharmacotherapeutic follow‐up for patients with pulmonary tuberculosis with Dáder method. Seguimento Farmacoterapêutico em Pacientes com Tuberculose Pulmonar Através da Metodologia Dáder 2006; Vol. 27, issue 3:269‐73.
Santoso 1996 {published data only}
Suryaprakasha 1983 {published data only}
- Suryaprakasha Rao P. Hospital pharmacist in geriatric care. Indian Journal of Hospital Pharmacy 1983; Vol. 20, issue 6:229‐34.
Turnacilar 2009 {published data only}
Udomthavornsuk 1991 {published data only}
- Udomthavornsuk B, Tatsanavivat P, Patjanasoontorn B, Khomthong R, Bhuripanyo K, Saengnipanthkul S, et al. Intervention of inappropriate antibiotic use at a university teaching hospital. Journal of the Medical Association of Thailand. 1991/10/01 1991; Vol. 74, issue 10:429‐36. [0125‐2208: (Print)] [PubMed]
Wood 2008 {published data only}
- Wood R, Kaplan R, Bekker LG, Brown S, Rivett U. The utility of pharmacy dispensing data for ART programme evaluation and early identification of patient loss to follow‐up. Southern African Journal of HIV Medicine 2008, issue 30:44‐50.
References to studies awaiting assessment
Adisa 2012 {published data only}
- Adisa R, Fakeye T O. Pharmacists‐based intervention strategies to address compliance problems among poorly controlled type 2 diabetes in ambulatory care settings in Nigeria. International Journal of Pharmacy Practice 2012;20:41‐2. [Google Scholar]
AJP 2011 {published data only}
- Pharmacist intervention improves patient adherence to antidepressants. Australian Journal of Pharmacy 2011;92:100. [Google Scholar]
Azzopardi 2010 {published data only}
- Azzopardi L, Hudson S, Mallia C, Cassar K, Coleiro B, Cassar P J, et al. Pharmaceutical care for rheumatoid arthritis patients on methotrexate attending an outpatient hospital clinic. Rheumatology 2010;49:i130. [Google Scholar]
Correr 2011 {published data only}
- Correr C J, Melchiors A C, Fernandez‐Llimos F, Pontarolo R. Effects of a pharmacotherapy follow‐up in community pharmacies on type 2 diabetes patients in Brazil. International journal of clinical pharmacy [Online] 2011; Vol. 33:273‐80. Available: http://www.mrw.interscience.wiley.com/cochrane/clcentral/articles/381/CN‐00812381/frame.html.. [DOI] [PubMed]
Costa 2012 {published data only}
- Costa C G R, Carnevale R C, Holsback V S S, Braz N C, Santos C Z, Moriel P, et al. Can a year of pharmacotherapeutic follow‐up reduce the incidence of drug‐related problems and increase CD4 counts in HIV‐positive outpatients?. European Journal of Hospital Pharmacy: Science and Practice 2012;19:228. [Google Scholar]
Dewulf 2011 {published data only}
- Dewulf N L, Santos V D, Pereira L R, Troncon L E. A structured program of pharmaceutical care benefits outpatients with inflammatory bowel diseases undergoing continuous drug therapy. International Journal of Clinical Pharmacy 2011;140:S207. [Google Scholar]
Dewulf 2012 {published data only}
- Dewulf N D L S, Santos V, Pereira L, Troncon L E D A. A structured pharmaceutical care program benefits outpatients with inflammatory bowel diseases. Gastroenterology 2012;34:212. [Google Scholar]
Fahimi 2011 {published data only}
- Fahimi F, Sharif‐Kashani B, Hossein‐Ahmadi Z, Salamzadeh J, Namdar R, Mousavi S, et al. The first pharmacist‐based warfarin‐monitoring service in Iran. Journal of Pharmaceutical Health Services Research 2011;2:59‐62. [Google Scholar]
Farsaei 2011 {published data only}
- Farsaei S, Sabzghabaee A M, Zargarzadeh A H, Amini M. Effect of pharmacist‐led patient education on glycemic control of type 2 diabetics: A randomized controlled trial. Journal of Research in Medical Sciences 2011;16:43‐9. [PMC free article] [PubMed] [Google Scholar]
Fuchs 2010 {published data only}
- Fuchs S C, Fuchs F D, Moreira L B, Gus M, Wiehe M, Fuchs F C, et al. Efficacy of home blood pressure monitoring on blood pressure control: A randomized controlled trial. Circulation 2010;122:e78. [DOI] [PubMed] [Google Scholar]
Lavoie 2011 {published data only}
- Lavoie K, Moullec G, Blais L, Beauchesne M F, Lemiere C, Labrecque M, et al. The efficacy of brief motivational interviewing to improve medication adherence in poorly controlled, nonadherent asthmatics: Results from a randomised controlled pilot study. Chest 2011;140:915A. [DOI] [PMC free article] [PubMed] [Google Scholar]
Lee 2012 {published data only}
- Lee W Y, Chan M C, Cheun T K, So K H, Yu C M. Impact of pharmacist counselling service on blood pressure control of borderline hypertensive patients. European Heart Journal 2012;14:A25. [Google Scholar]
Lores 2011 {published data only}
- Lores Delgado D, Lazo Roblejo Y, Bermudez Camps I B, Zuniga Moro A. Pharmacotherapeutic monitoring in patients with congestive heart failure, dispensarized at the Principal Municipal Pharmacy at Santiago de Cuba. Pharmaceutical Care Espana 2011;13:114‐22. [Google Scholar]
Magedanz 2012 {published data only}
- Magedanz L, Silliprandi E M, dos Santos R P. Impact of the pharmacist on a multidisciplinary team in an antimicrobial stewardship program: a quasi‐experimental study. Int J Clin Pharm 2012;34:290‐4. [DOI] [PubMed] [Google Scholar]
Malaty 2011 {published data only}
- Malaty J, Cook S, Green C. Influence of a pharmacist initiated educational intervention on patients' utilization of fluconazole for vulvovaginal candidiasis in an outpatient setting. Journal of the American Pharmacists Association 2011;51:299‐300. [Google Scholar]
Maria 2012 {published data only}
- Maria Belen F I M B, Jose Manuel F O J M, Isabel M C I, Cristina G P C, Angeles F C A, Elena S Y E, et al. The improvement of adherence to antiretroviral treatment through the pharmaceutical care and the analysis of factors affecting it. European Journal of Hospital Pharmacy: Science and Practice 2012;19:242. [Google Scholar]
Mohammad 2011 {published data only}
- Mohammad R A, Kim J J, Donihi A C, Coley K. Impact of hospital‐based pharmacist advocates in care transitions: Identification and description of medication related interventions after patient discharge from hospital to home. Pharmacotherapy 2011;31:388e. [Google Scholar]
Mori 2010 {published data only}
- Mori Alpm, Heimann J C, Dorea E L, Bernik M M S, Storpirtis S. Pharmaceutic guidance to hypertensive patients at USP University Hospital: effect on adherence to treatment. Brazilian Journal of Pharmaceutical Sciences [Online] 2010; Vol. 46:353‐62. Available: http://www.mrw.interscience.wiley.com/cochrane/clcentral/articles/752/CN‐00789752/frame.html.
Moten 2010 {published data only}
- Moten M, Barner J, Jokerst J. Medication therapy management and diabetes outcomes of diabetic patients who receive clinical pharmacy services. Journal of the American Pharmacists Association 2010;50:312. [Google Scholar]
Ola‐Olorun 2012 {published data only}
- Ola‐Olorun O J, Afolabi M O, Ogunsina A O, Oyebisi T O, Akinyemi O A, Akintomide A O, et al. Exploring medicine information needs of hypertensive patients using short message service (SMS) of mobile phone. Pharmacoepidemiology and Drug Safety 2012;21:116. [Google Scholar]
Olives 2012 {published data only}
- Olives T D, Patel R G, Nelson R S, Yew A, Joing S, Miner J R. Randomized controlled trial of three instructional modalities for patients prescribed outpatient antibiotics from the ED: The potential of cell phone technology to reach limited health literacy patients. Academic Emergency Medicine 2012;19:S219. [Google Scholar]
Pinelli 2012 {published data only}
- Pinelli N R, Clark L M, Malinzak L, Goggins M, Patel A. Pharmacist‐managed diabetes and cardiovascular risk reduction clinic in renal transplant recipients: Preliminary findings. American Journal of Transplantation 2012;12:288‐9. [Google Scholar]
Saokaew 2012 {published data only}
- Saokaew S, Sapoo U, Nathisuwan S, Chaiyakunapruk N, Permsuwan U. Anticoagulation control of pharmacist‐managed collaborative care versus usual care in Thailand. Int J Clin Pharm 2012;34:105‐12. [DOI] [PubMed] [Google Scholar]
Shapiro 2010 {published data only}
- Shapiro L. Pharmacist intervention boosts patient compliance. Drug Topics 2010;154:27. [Google Scholar]
Tahaineh 2011 {published data only}
- Tahaineh L, Albsoul‐Younes A, Al‐Ashqar E, Habeb A. The role of clinical pharmacist on lipid control in dyslipidaemic patients in North of Jordan. International journal of clinical pharmacy [Online] 2011; Vol. 33:229‐36. Available: http://www.mrw.interscience.wiley.com/cochrane/clcentral/articles/801/CN‐00810801/frame.html. [DOI] [PubMed]
Tse 2011 {published data only}
- Tse T, Althunian T, Burrows J, Yang I, Masel P. An evaluation of the role and potential benefits of the clinical pharmacists involvement in respiratory outpatient clinic. Respirology 2011;16:52. [Google Scholar]
Additional references
Aderemi‐Williams 2007
Anderson 2002
APAaNAoCDS 2008
- APAaNAoCDS. Medication Therapy Management in Pharmacy Practice: Core elements of an MTM Service Model Version 2.0. Journal of the American Pharmaceutical Association. American Pharmacists Association and National Association of Chain Drug Stores Foundation, 2008; Vol. 48, issue 3:341‐53. [DOI] [PubMed]
Beney 2000
Blenkinsopp 2003
Christensen 2006
Fabricant 1987
- Fabricant SJ, Hirschhorn N. Deranged distribution, perverse prescription, unprotected use: the irrationality of pharmaceuticals in the developing world. Health Policy and Planning 1987; Vol. 2, issue 3:204‐13.
FIP 1997
- International Pharmaceutical Federation. Standards for quality of pharmacy services: Good Pharmacy Practice. International Pharmaceutical Federation, 1997.
Geest 1982
- Geest S. The illegal distribution of western medicines in developing countries: pharmacists, drug pedlars, injection doctors and others. a bibliographic exploration. Medical Anthropology 1982:197‐216.
Geest 1987
Ghani 2010
- Ghani K, Gillani W, Ghani M. Pharmacy teaching and practices problems in developing countries: review. International Journal of Pharmacy Teaching & Practices 2010;1(1):11‐7. [Google Scholar]
Hepler 1990
- Hepler CD, Strand LM. Opportunities and responsibilities in pharmaceutical care. American Journal of Pharmaceutical Education 1990; Vol. 47:533‐43. [PubMed]
Holloway 2006
- Holloway K. Promoting rational use of medicines. International Network for Rational Use of Drugs News 2006; Vol. 16, issue 1:3‐4.
Horn 2006
Kaboli 2006
Kamat 1998
Kane 2003
le Grand 1999
Lipton 1992
Lipton 1994
Nkansah 2010
- Nkansah N, Mostovetsky O, Yu C, Chheng T, Beney J, Bond CM, et al. Effect of outpatient pharmacists’ non‐dispensing roles on patient outcomes and prescribing patterns. Cochrane Database of Systematic Reviews 2010, issue 7:CD000336. [DOI] [PMC free article] [PubMed]
Royal 2006
- Royal S, Smeaton L, Avery A, Hurwitz B, Sheikh A. Interventions in primary care to reduce medication related adverse events and hospital admissions: systematic review and meta‐analysis. Quality & Safety in Health Care 2006; Vol. 15, issue 1:23‐31. [DOI] [PMC free article] [PubMed]
Singhal 1999
Smith 2009
Tully 2000
WHO 1994
- WHO. The role of the pharmacist in the health care system. World Health Organization. Geneva: World Health Organization (WHO), 1994.
WHO 1997
- WHO. The role of pharmacist in the health care system. World Health Organization. Geneva: World Health Organization (WHO), 1997.
WHO 1998
- WHO. The role of the pharmacist in self‐Care and self‐medication. World Health Organization. Geneva: Department of Essential Drugs and Other Medicines World Health Organization, 1998.
WHO 2006
- WHO. New tool to enhance role of pharmacists in health care. World Health Organization 2006.
WHO 2009
- WHO. Medicines use in primary care in developing and transitional countries. World Health Organization. Geneva: WHO, 2009.
World Bank Group 2009
- World Bank Group. Country and lending groups. The World Bank Group. The World Bank Group, 2009.