

Abstract
Objective:
To prospectively examine the associations of combined lifestyle factors with incident cardiovascular disease (CVD) and mortality in patients with diabetes.
Patients and Methods:
Patients with prevalent diabetes were included from five prospective, population-based cohorts in China (Dongfeng-Tongji cohort and Kailuan study), the UK (UK Biobank study), and the US (National Health and Nutrition Examination Survey and NIH-AARP Diet and Health Study). Healthy lifestyle scores were constructed according to non-current smoking, low-to-moderate alcohol drinking, regular physical activity, healthy diet, and optimal bodyweight; the healthy level of each lifestyle factor was assigned for 1 point, or zero for otherwise, and the range of the score was 0–5. Cox proportional hazards models were used to estimate hazard ratios (HRs) for incident CVD, CVD mortality, and all-cause mortality adjusting for sociodemographic, medical, and diabetes-related factors, and outcomes were obtained via linkage to medical records and death registries. Data were collected from October 18, 1988 to September 30, 2020.
Results:
A total of 6945 incident CVD cases were documented among 41,350 participants without CVD at baseline from two Chinese cohorts and UK Biobank during 389,330 person-years of follow-up, and 40,353 deaths were documented among 101,219 participants from all five cohorts during 1238,391 person-years of follow-up. Adjusted HRs (95% CIs) comparing patients with 4–5 vs. 0–1 healthy lifestyle factors were 0.67 (0.60–0.74) for incident CVD, 0.58 (0.50–0.68) for CVD mortality, and 0.60 (0.53–0.68) for all-cause mortality. Findings remained consistent across different cohorts, subgroups, and sensitivity analyses.
Conclusion:
The international analyses document that adherence to multi-component healthy lifestyles was associated with lower risks of CVD and premature deaths among patients with diabetes.
Diabetes is a global public health threat affecting 0.5 billion people worldwide in 2019 and accounts for about 10% of annual health expenditure.1 Diabetes is associated with a higher risk of cardiovascular disease (CVD), which is the major cause of morbidity and mortality in diabetes, and contributes to premature mortality and disability-adjust life years lost.2 To reduce the disease and economic burden of diabetes, identifying scalable cost-effective interventions should be prioritized in a sustainable healthcare system.
Lifestyle modifications are regarded as the cornerstone of glycemic control and preventing complications and premature deaths for patients with diabetes.3 However, evidence is limited in patients with diabetes regarding the combined effects of lifestyle factors, which are interrelated and communal risk factors of major non-communicable diseases. Current evidence from randomized controlled trials of lifestyle interventions among individuals with diabetes remains debatable, and the extrapolation of findings was restricted given the predefined population (e.g., overweight and obese adults aged 45–75 years with type 2 diabetes in the Look AHEAD [Action for Health in Diabetes] study), small sample sizes, and heterogeneous adherence to the interventions which focused on selected lifestyle factors.4–9 On the other hand, several cohort studies have evaluated associations between combined lifestyle factors and health outcomes among patients with diabetes, and a recent meta-analysis reported results for all-cause mortality (7 studies), CVD mortality (4 studies), and incident CVD (3 studies).10 However, those studies generally had limitations such as small sample sizes, few outcome events, and insufficient confounding adjustment (e.g., socioeconomic factors, diabetes duration, or medication use),11–17 and evidence from Asians was rather limited.
To address the knowledge gaps, we investigated the associations of combined healthy lifestyles with incident CVD and premature deaths among patients with diabetes through leveraging data sources from five population-based prospective cohorts from China, the UK, and the US.
PATIENTS AND METHODS
Study Population
Patients with prevalent diabetes were identified from two Chinese cohorts (i.e., the Dongfeng-Tongji cohort [DFTJ]18 and Kailuan study19), UK Biobank,20 and two US cohorts (i.e., National Health and Nutrition Examination Survey [NHANES]21 and National Institutes of Health [NIH]-AARP Diet and Health Study22). Participants were invited to complete questionnaire surveys, physical examinations, and blood collections in the cohorts except for the NIH-AARP Diet and Health Study, which only mailed questionnaires to participants. Diabetes was determined by self-reported physician-diagnosed diabetes, use of glucose-lowering medication, or glucose biomarkers including fasting blood glucose (FBG), glycated hemoglobin A1c (HbA1c), or glucose levels from oral glucose tolerance tests (Table 1 and Supplemental Methods).23 A total of 126,095 participants were identified to have diabetes in the five cohorts. We excluded participants with incomplete information on lifestyle factors and major covariates, leaving a total of 101,219 participants in the mortality analyses (Supplemental Figure 1). The analyses for incident CVD were only conducted in two Chinese cohorts and UK Biobank since follow-up information on incident CVD was unavailable in two US cohorts, and we further excluded patients with prevalent CVD, leaving 41,350 patients in the CVD analyses. These cohort studies were approved by institutional review boards in relevant institutes, and informed consent was obtained from each participant. Detailed study designs, participant inclusion and exclusion, and ethnic approval are provided in Supplemental Methods.
TABLE 1.
| Cohorts | Self-reports | FBG≥7.0 mmol/L | HbA1c≥6.5% (48 mmol/mol) | 2-hour PG≥11.1 mmol/L |
|---|---|---|---|---|
|
| ||||
| DFTJ | √ | √ | √ | |
| Kailuan study | √ | √ | ||
| UK Biobank | √ | √ | ||
| NHANES | √ | √ | √ | √ |
| NIH-AARP | √ | |||
DFTJ, Dongfeng-Tongji cohort; FBG, fasting blood glucose; HbA1c, hemoglobin A1c; 2-hour PG, 2-hour plasma glucose during the oral glucose tolerance tests; NHANES, National Health and Nutrition Examination Survey; NIH-AARP, National Institutes of Health-AARP Diet and Health Study. Details are shown in Supplemental Methods.
Construction of Healthy Lifestyle Score
We constructed a composite healthy lifestyle score based on five major lifestyle factors, including non-current smoking, low-to-moderate alcohol drinking, regular physical activity, healthy diet, and optimal bodyweight or waist circumference according to previous studies.10 The healthy levels of lifestyle factors were defined according to previous publications from five cohorts or clinical guidelines. For smoking, non-current smoking was defined as the healthy level.10 Given that existing evidence indicated low-to-moderate alcohol drinking was associated with the lowest risks of CVD and mortality,24, 25 low-to-moderate alcohol drinking (1–14 or 28 g/day for women or men according to the US dietary guideline26) were defined as the healthy level, which was consistent with previous studies among participants with diabetes.14, 17, 27 Due to the different methods of data acquisition or different criteria across races, physical activity, diet, and bodyweight/waist circumference were defined based on cohort-specific criteria (Table 2). Briefly, weekly exercise for ≥150 min (DFTJ) or 80 min (Kailuan study),19, 28 top third of total physical activity (UK Biobank),29 weekly ≥150 minutes of moderate-to-vigorous leisure-time physical activity (NHANES 1999–2014),29 top third of leisure-time physical activity (NHANES 1988–94),29 and ≥20-min physical activity for ≥3 times/week (NIH-AARP Diet and Health Study) were defined as the healthy level for physical activity in respective cohorts.30 Dietary quality was assessed according to intakes of vegetable, fruit, and meat (DFTJ),31 salt intake (Kailuan study),19 recent dietary recommendations for cardiovascular health (UK Biobank),29 and Healthy Eating Index (two US cohorts).29 Considering the obesity paradox, i.e., higher body mass index (BMI) was associated with better survival, was commonly reported in patients with type 2 diabetes,32 we used waist circumference instead of BMI to evaluate individuals’ obesity status.33 Waist circumference of <85/90 cm for women/men (two Chinese cohorts, according to the Chinese Diabetes Society recommendation34) and <80/94 cm for women/men (UK Biobank and NHANES, according to the World Health Organization recommendations35) were defined as healthy levels. However, waist circumference was only reported by some but not all participants in the NIH-AARP Diet and Health Study, thus BMI of 18.5–24.9 kg/m2 was used as the healthy level in this cohort.36 Information on cigarette smoking, alcohol drinking, and physical activity was collected through questionnaires in all five cohorts. Dietary information was collected through 24-hour dietary recalls in the NHANES, food frequency questionnaires in the NIH-AARP Diet and Health Study, and questionnaires in other cohorts. Weight and height were self-reported by participants from the NIH-AARP Diet and Health Study, while waist circumference was measured by trained staff in the other four cohorts. Detailed procedures for collecting five lifestyle factors are described in Supplemental Methods. Participants scored one point for each lifestyle factor when they met the criterion for the healthy level, or zero for otherwise. A healthy lifestyle score thus ranged from 0 to 5, and a higher score indicates greater adherence to healthy lifestyles. To increase the statistical power, participants with 0 or 1 healthy lifestyle factor were merged as one group and those with 4 or 5 healthy lifestyle factors were also merged because only 0.9%–4.4% and 0.7%–3.0% of participants followed 0 and 5 healthy lifestyle factors, respectively.
TABLE 2.
Definitions of Healthy Lifestyle Factors in Different Cohortsa
| Factors | Healthy level | Unhealthy level |
|---|---|---|
|
| ||
| Cigarette smoking14 | Non-current smoking | Current smoking |
| Alcohol drinking14 | Women: 1–14 g/day; men: 1–28 g/day | Women: none or >14 g/day; men: none or >28 g/day |
| Physical activity | DFTJ: weekly exercise ≥150 min14 | DFTJ: weekly exercise <150 min14 |
| Kailuan study: weekly exercise ≥80 min19 | Kailuan study: weekly exercise <80 min19 | |
| UK Biobank: top third of total physical activity29 | UK Biobank: bottom two-thirds of total physical activity29 | |
| NHANES 1999–2014: weekly ≥150 minutes of moderate-to-vigorous leisure time physical activity14 | NHANES 1999–2014: weekly <150 minutes of moderate-to-vigorous leisure time physical activity14 | |
| NHANES 1988–94: top third of metabolic-equivalent-time-weighted frequency of leisure-time physical activity29 | NHANES 1988–94: bottom two-thirds of metabolic-equivalent-time-weighted frequency of leisure-time physical activity29 | |
| NIH-AARP: participation in at least 20 minutes of physical activity 3 or more times per week30 | NIH-AARP: participation in at least 20 minutes of physical activity <3 times per week30 | |
| Diet | DFTJ: daily intakes of vegetable and fruit and no daily intake of meat31 | DFTJ: no daily intakes of vegetable or fruit or daily intake of meat31 |
| Kailuan study: low or medium self-perceived salt intake19 | Kailuan study: high self-perceived salt intake19 | |
| UK Biobank: meeting ≥5 items of more recent dietary recommendations for cardiovascular health29,b | UK Biobank: meeting <5 items of more recent dietary recommendations for cardiovascular health29,b | |
| NHANES 1988–94: top 40% of HEI-1995 score29,c | NHANES 1988–94: bottom 60% of HEI-1995 score29,c | |
| NHANES 1999–2014 and NIH-AARP: top 40% of HEI-2015 score29’d | NHANES 1999–2014 and NIH-AARP: bottom 60% of HEI-2015 score29,d | |
| Bodyweight | DFTJ and Kailuan study: waist circumference <85 cm and <90 cm for women and men, respectively34 | DFTJ and Kailuan study: waist circumference ≥85 cm and ≥90 cm for women and men, respectively34 |
| UK Biobank and NHANES: waist circumference <80 cm and <94 cm for women and men, respectively35 | UK Biobank and NHNAES: waist circumference ≥80 cm and ≥94 cm for women and men, respectively35 | |
| NIH-AARP: BMI 18.5–24.9 kg/m2 36 | NIH-AARP: BMI <18.5 or ≥25.0 kg/m2 36 | |
DFTJ, Dongfeng-Tongji cohort; HEI, Healthy Eating Index; NHANES, National Health and Nutrition Examination Survey; NIH-AARP, National Institutes of Health-AARP Diet and Health Study.
The recommendation included fruit intakes of ≥3 servings/d, vegetable intakes of ≥3 servings/d, whole grain intakes of ≥3 servings/d, (shell)fish intakes of ≥2 servings/wk, dairy intakes of ≥2 servings/d, refined grain intakes of ≤2 servings/d, processed meat intakes of ≤1 serving/wk, unprocessed meat intakes of ≤2 servings/wk, and no sugar-sweetened beverage intakes.
HEI-1995 score included intakes of grains, vegetables, fruits, milk, meat, total fat, saturated fat, cholesterol, and sodium, and variety of foods.
HEI-2015 score included intakes of total and whole fruits, total vegetables, greens and beans, whole grains, dairy, total protein foods, seafood and plant proteins, fatty acids, refined grains, sodium, added sugars, and saturated fats.
Follow-up and Outcomes
The follow-up duration was calculated from baseline when participants first reported to have diabetes, until the occurrence of events, deaths, or the censoring dates, whichever came first. The primary outcomes were incident CVD (including fatal and nonfatal ischemic heart disease and stroke) and all-cause mortality, and the secondary outcomes included CVD mortality and incident ischemic heart disease and stroke. In the NHANES, CVD mortality was not available, and deaths from heart disease were used. Detailed outcome ascertainment including ICD-9/10 codes, data sources, and censoring dates in individual cohorts are provided in Supplemental Methods.
Statistical Analysis
Associations between the healthy lifestyle score and outcomes were investigated using the Cox proportional hazards regression, and HRs (95% CIs) were estimated after adjustment for major covariates, including age (continuous), sex, race, marital status, education attainment, household income, employment status, prevalent hypertension, CVD, and cancer, years since diabetes diagnoses, use of glucose-lowering, antihypertensive, and lipid-lowering medications, family history of diabetes, CVD, and cancer, and baseline FBG or HbA1c and total cholesterol levels. These covariates were slightly different in five cohorts due to data availability and different cohort-specific definitions, and details are provided in Supplemental Methods. We also investigated associations between individual lifestyle factors and all outcomes with other lifestyle factors mutually adjusted in the models.
Subgroup analyses of associations between the healthy lifestyle score and primary outcomes were conducted according to age (<65 and ≥65 years),37 sex, educational attainment, ideal BMI (yes/no, defined as 18.5–23.9 kg/m2 in Chinese cohorts, or 18.5–24.9 kg/m2 in the UK and US cohorts),34, 36 prevalent hypertension, and prevalent dyslipidemia.28 In cohorts except for the NIH-AARP Diet and Health Study, additional subgroup analyses were conducted for diabetes duration (diagnoses through FBG or HbA1c screening, self-reported diagnoses within and over 5 years), use of glucose-lowering medications, and meeting glycemic target (FBG of 4.4–7.2 or 5.0–7.2 mmol/L for those aged <65 or ≥65 years in Chinese cohorts; HbA1c of <7.0% or 7.5% [53 or 58 mmol/mol] for those aged <65 or ≥65 years in the UK and US cohorts).37, 38 Meta-regressions were used to estimate P values for the difference between subgroups (Supplemental Methods).39
Several sensitivity analyses were conducted. First, given the recent evidence on dose-response adverse effects of alcohol drinking on multiple health outcomes,40 we redefined the healthy level of alcohol drinking as none or low-to-moderate alcohol consumption (i.e., ≤14 g/d and ≤28 g/d of ethanol intakes for women and men, respectively). Second, we excluded events occurring in the first two years to minimize the potential reverse causation. Third, considering that the diagnosis of CVD or cancer could alter both lifestyles and risks of outcomes, we excluded participants with prevalent CVD or cancer to reduce possible confounding. Fourth, to consider the different strengths of the associations between different lifestyle factors and outcomes, we constructed weighted lifestyle scores by summing the numbers of healthy lifestyle factors weighted by the coefficients of their associations with outcomes (the absolute values of the coefficients were obtained from the meta-analyses which pooled the results from multiple cohorts). Fifth, multiple imputations (5 imputations) were used in each cohort for imputing missing covariates to reduce the influence of non-responses,41 according to information on other non-missing variables. Sixth, we divided each lifestyle factor into three levels and created a new lifestyle score to further differentiate individuals’ healthy lifestyles (details are provided in Supplemental Methods). Seventh, to test the contribution of individual lifestyle factors, we omitted one lifestyle factor each time from the score to reconstruct a lifestyle score including four factors, and participants were categorized into scores 0–1, 2, and 3–4. The omitted factor was additionally adjusted in the models.
Analyses within each cohort were performed by SAS version 9.4 (SAS Institute Inc, Cary, NC), and results from different cohorts were pooled using the random-effects model of meta-analysis by STATA version 14.0 (StataCorp, College Station, TX). Two-sided P values <.05 were considered statistically significant.
RESULTS
Patients’ Characteristics
Of the 101,219 participants, 26,362 were from China (the DFTJ and Kailuan study), 24,179 were from the UK (the UK Biobank), and 50,678 were from the US (the NHANES and NIH-AARP Diet and Health Study). The mean age of participants at baseline ranged between 56.2 (the Kailuan study) and 65.3 years (DFTJ) across cohorts (Table 3). In the UK and US cohorts, the majority of participants (66.6%–89.1%) were Whites. The proportions with less than high school education were much higher in two Chinese cohorts (65.3% and 81.4%) than the UK and US cohorts (27.3%–31.9%). The prevalence of five healthy lifestyle factors varied across cohorts and cannot be directly compared because of different definitions. Prevalent comorbidities also differed at baseline: the prevalence of hypertension was lower in the NIH-AARP Diet and Health Study (34.7% vs. 63.1%–87.0%), which might be because hypertension was defined through self-reports alone in this study but through both self-report and measured blood pressure in the other four cohorts, while the percentages of patients with cancer were generally higher in the UK and US cohorts (10.3%–15.5%) compared to other studies (1.1%–7.0%).
TABLE 3.
Baseline Demographic Characteristics of Participants from Different Cohortsa
| Characteristics | DFTJ (n = 8440) | Kailuan study (n = 17,922) | UK Biobank (n = 24,179) | NHANES (n = 6958) | NIH-AARP (n = 43,720) |
|---|---|---|---|---|---|
|
| |||||
| Mean age, years | 65.3 (7.8) | 56.2 (10.7) | 59.7 (7.0) | 59.5 (13.3) | 62.5 (5.1) |
| Male sex | 4099 (48.6) | 14,853 (82.9) | 15,163 (62.7) | 3477 (49.7) | 29,475 (67.4) |
| White | 0 | 0 | 21,537 (89.1) | 2821 (66.6) | 38,931 (89.0) |
| Currently not in a relationship | 1002 (11.9) | 346 (1.9) | - | 2937 (38.5) | 12,967 (29.7) |
| Less than high school | 5515 (65.3) | 14,592 (81.4) | 6588 (27.3) | 3012 (30.2) | 13,934 (31.9) |
| Low household incomeb | - | 11760 (65.6) | 7424 (30.7) | 1455 (14.6) | - |
| Unemployed | - | - | 3062 (12.7) | 1872 (24.5) | - |
| Non-current smoking | 7046 (83.5) | 11,677 (65.2) | 21,427 (88.6) | 5766 (82.4) | 39,275 (89.8) |
| Moderate alcohol drinking | 1215 (14.4) | 4022 (22.4) | 8257 (34.2) | 2888 (46.9) | 33,187 (75.9) |
| Regular exercise | 6911 (81.9) | 3294 (18.4) | 8610 (35.6) | 2301 (37.2) | 17,132 (39.2) |
| Healthy diet | 2445 (29.0) | 15,906 (88.8) | 7197 (29.8) | 2826 (40.0) | 17,488 (40.0) |
| No overweight/obesity | 4395 (52.1) | 7417 (41.4) | 3500 (14.5) | 690 (9.5) | 7786 (17.8) |
| Cancer at baseline | 595 (7.0) | 196 (1.1) | 2498 (10.3) | 902 (15.5) | 4789 (11.0) |
| Cardiovascular disease at baseline | 2652 (31.4) | 1541 (8.6) | 4998 (20.7) | 1622 (22.5) | 14,013 (32.1) |
| Hypertension at baseline | 6204 (73.5) | 11,315 (63.1) | 21,045 (87.0) | 4930 (69.0) | 15,152 (34.7) |
| Family history of cancer | 417 (4.9) | 409 (2.3) | 7282 (30.1) | - | 21,218 (48.5) |
| Family history of CVD | 1286 (15.2) | 2257 (12.6) | 14,968 (61.9) | 994 (16.5) | - |
| Family history of diabetes | 1317 (15.6) | 2711 (15.1) | 10,550 (43.6) | 4243 (61.5) | 13,522 (30.9) |
| Use of antihypertensive medications | 4117 (48.8) | 3959 (22.1) | 16,747 (69.3) | 3572 (51.8) | - |
| Use of glucose-lowering medications | 3584 (42.5) | 4052 (22.6) | 14,783 (61.1) | 3781 (53.8) | - |
| Use of lipid-lowering medications | 2186 (25.9) | 407 (2.3) | 17,754 (73.4) | 2163 (34.7) | - |
| Mean years after diagnoses of diabetes, years | 5.0 (6.6) | 3.0 (5.5) | 8.5 (12.3) | 7.1 (10.8) | - |
| Mean fasting blood glucose at baseline, mmol/L | 8.1 (4.4) | 8.8 (4.5) | - | - | - |
| Mean hemoglobin A1c at baseline, % | - | - | 7.1 (1.3) | 7.1 (1.7) | - |
| Mean total cholesterol at baseline, mmol/L | 5.0 (1.2) | 5.3 (1.7) | 4.6 (1.1) | 5.2 (1.3) | - |
CVD, cardiovascular disease; DFTJ, Dongfeng-Tongji cohort; HEI, Healthy Eating Index; NHANES, National Health and Nutrition Examination Survey; NIH-AARP, National Institutes of Health-AARP Diet and Health Study. Numbers are mean (SD) or n (%). In the NHANES, all estimates accounted for complex survey designs. Definitions of healthy lifestyle factors are shown in Table 2.
Low household income was defined as monthly household income per capita of <1000 RMB in the Kailuan study, household income of <£18,000 in the UK Biobank, and family poverty to income ratio of ≤1 in the NHANES.
Distributions of baseline characteristics in individual cohorts are presented in Supplemental Tables 1–5. Compared to those with 0–1 healthy lifestyle factors, participants with 4–5 healthy lifestyle factors were more likely to be older in the Kailuan study, UK Biobank, and NIH-AARP Diet and Health Study, but younger in the DFTJ; more likely to be female in Chinese cohorts, but male in the UK and US cohorts; less likely to have prevalent hypertension and CVD across five cohorts; and had lower blood total cholesterol levels in the Kailuan study, UK Biobank, and NHANES. There were modest differences in most of the characteristics between participants included and excluded from the analyses (Supplemental Table 6).
Associations of Combined Lifestyle Factors with Incident CVD and Mortality
During 389,330 person-years of follow-up (median=10.4 years), 6945 incident CVD cases were documented in two Chinese cohorts and UK Biobank. Associations between the healthy lifestyle score and incident CVD were consistent across cohorts, and the HRs (95% CIs) comparing patients with 4–5 vs. 0–1 healthy lifestyle factors were 0.69 (0.57–0.83) in the DFTJ, 0.66 (0.54–0.80) in the Kailuan study, and 0.66 (0.57–0.77) in the UK Biobank (Table 4). The pooled age-adjusted rates of incident CVD (95% CIs) per 1000 person-years were 19.6 (10.0–29.2) for patients with 4–5 healthy lifestyle factors and 29.7 (20.6–38.8) for patients with 0–1 healthy lifestyle factors, and the pooled multivariable-adjusted HR (95% CI) was 0.67 (0.60–0.74). Besides, each additional healthy lifestyle factor was associated with an HR of 0.88 (0.86–0.90) for incident CVD. Patients with 4–5 healthy lifestyle factors also had lower risks of incident ischemic heart disease (HR, 0.69; 95% CI, 0.61–0.78) and stroke (HR, 0.67; 95% CI, 0.57–0.79) compared with those with 0–1 healthy lifestyle factors (Table 5).
TABLE 4.
Associations of Baseline Lifestyle Score with Risks of Incident Cardiovascular Disease and Mortality in Individuals with Diabetesa
| Number of healthy lifestyle factors |
Each additional healthy lifestyle factor | ||||
|---|---|---|---|---|---|
| 0–1 | 2 | 3 | 4–5 | ||
|
| |||||
| Incident cardiovascular disease | |||||
| Dongfeng-Tongji cohort | |||||
| No. of events/person-years | 212 / 3714 | 609 / 12,080 | 648 / 16,071 | 235 / 6446 | 1704 / 38,311 |
| Age-adjusted rate of events (95% CI) | 58.5 (50.6–66.5) | 49.7 (45.7–53.6) | 40.6 (37.5–43.7) | 37.0 (32.3–41.7) | - |
| HR (95% CI) | 1 | 0.88 (0.75–1.03) | 0.73 (0.62–0.85) | 0.69 (0.57–0.83) | 0.88 (0.84–0.92) |
| Kailuan study | |||||
| No. of events/person-years | 330 / 21,954 | 839 / 66,654 | 621 / 54,595 | 142 / 12,737 | 1932 / 155,940 |
| Age-adjusted rate of events (95% CI) | 16.2 (14.4–18.1) | 12.5 (11.7–13.4) | 11.2 (10.3–12.1) | 10.0 (8.3–11.7) | - |
| HR (95% CI) | 1 | 0.80 (0.70–0.91) | 0.74 (0.65–0.85) | 0.66 (0.54–0.80) | 0.91 (0.86–0.95) |
| UK Biobank | |||||
| No. of events/person-years | 1238 / 62,940 | 1186 / 72,042 | 661 / 43,195 | 224 / 16,902 | 3309 / 195,079 |
| Age-adjusted rate of events (95% CI) | 20.3 (19.2–21.4) | 16.4 (15.4–17.3) | 14.7 (13.6–15.8) | 12.9 (11.2–14.6) | - |
| HR (95% CI) | 1 | 0.82 (0.75–0.89) | 0.74 (0.67–0.82) | 0.66 (0.57–0.77) | 0.87 (0.84–0.90) |
| Pooled | |||||
| No. of events/person-years | 1780 / 88,608 | 2634 / 150,776 | 1930 / 113,861 | 601 / 36,085 | 6945 / 389,330 |
| Age-adjusted rate of events (95% CI) | 29.7 (20.6–38.8) | 25.8 (16.5–35.1) | 22.0 (12.3–31.7) | 19.6 (10.0–29.2) | - |
| HR (95% CI) | 1 | 0.83 (0.77–0.88) | 0.74 (0.69–0.79) | 0.67 (0.60–0.74) | 0.88 (0.86–0.90) |
| All-cause mortality | |||||
| Dongfeng-Tongji cohort | |||||
| No. of deaths/person-years | 211 / 6575 | 454 / 20,865 | 444 / 25,520 | 154 / 9992 | 1263 / 62,952 |
| Age-adjusted rate of deaths (95% CI) | 32.4 (28.0–36.7) | 20.9 (19.0–22.9) | 17.7 (16.0–19.3) | 15.9 (13.4–18.4) | - |
| HR (95% CI) | 1 | 0.70 (0.59–0.82) | 0.58 (0.50–0.69) | 0.54 (0.44–0.67) | 0.82 (0.77–0.87) |
| Kailuan study | |||||
| No. of deaths/person-years | 332 / 24,603 | 1110 / 71,725 | 859 / 58,584 | 215 / 13,843 | 2516 / 168,755 |
| Age-adjusted rate of deaths (95% CI) | 17.1 (15.2–19.0) | 15.5 (14.6–16.4) | 14.0 (13.1–15.0) | 13.3 (11.5–15.1) | - |
| HR (95% CI) | 1 | 0.99 (0.88–1.12) | 0.90 (0.80–1.03) | 0.79 (0.67–0.95) | 0.93 (0.89–0.97) |
| UK Biobank | |||||
| No. of deaths/person-years | 1438 / 85,146 | 1207 / 94,097 | 630 / 55,622 | 205 / 20,869 | 3480 / 255,734 |
| Age-adjusted rate of deaths (95% CI) | 17.6 (16.7–18.5) | 12.7 (12.0–13.4) | 10.9 (10.0–11.7) | 9.5 (8.2–10.8) | - |
| HR (95% CI) | 1 | 0.75 (0.69–0.81) | 0.64 (0.59–0.71) | 0.59 (0.51–0.68) | 0.81 (0.78–0.84) |
| National Health and Nutrition Examination Survey | |||||
| No. of deaths/person-years | 881 / 20,381 | 994 / 24,216 | 492 / 15,091 | 155 / 5713 | 2522 / 65,401 |
| Age-adjusted rate of deaths (95% CI) | 46.6 (43.5–49.6) | 39.6 (37.2–42.1) | 31.1 (28.3–33.8) | 25.9 (21.8–30.0) | - |
| HR (95% CI) | 1 | 0.81 (0.71–0.93) | 0.63 (0.52–0.75) | 0.53 (0.41–0.69) | 0.80 (0.75–0.86) |
| NIH-AARP Diet and Health Study | |||||
| No. of deaths/person-years | 4026 / 72,621 | 11,004 / 234,551 | 9976 / 232,676 | 5566 / 145,701 | 30,572 / 685,549 |
| Age-adjusted rate of deaths (95% CI) | 57.7 (55.9–59.5) | 47.7 (46.8–48.6) | 42.5 (41.6–43.3) | 36.7 (35.7–37.7) | - |
| HR (95% CI) | 1 | 0.79 (0.76–0.81) | 0.68 (0.65–0.70) | 0.57 (0.55–0.59) | 0.85 (0.84–0.86) |
| Pooled | |||||
| No. of deaths/person-years | 6888 / 209,326 | 14,769 / 445,454 | 12,401 / 387,493 | 6295 / 196,118 | 40353 / 1238,391 |
| Age-adjusted rate of deaths (95% CI) | 34.3 (16.3–52.2) | 27.3 (11.7–42.8) | 23.2 (9.0–37.5) | 20.2 (6.9–33.6) | - |
| HR (95% CI) | 1 | 0.80 (0.74–0.87) | 0.68 (0.61–0.76) | 0.60 (0.53–0.68) | 0.84 (0.81–0.88) |
HR, hazard ratio; NIH, National Institutes of Health. In the National Health and Nutrition Examination Survey, all estimates accounted for complex survey designs. Covariates included in models are listed in Supplemental Methods. Data on incident cardiovascular disease were unavailable in the National Health and Nutrition Examination Survey and NIH-AARP Diet and Health Study, and thus these two cohorts were not included in the analyses.
TABLE 5.
Associations of Baseline Lifestyle Score with Risks of Subtypes of Cardiovascular Disease and Cardiovascular Disease Mortality in Individuals with Diabetesa
| Number of healthy lifestyle factors |
||||
|---|---|---|---|---|
| Outcomes | 0–1 | 2 | 3 | 4–5 |
|
| ||||
| Incident ischemic heart disease | ||||
| HR (95% CI) from the DFTJ | 1 | 0.94 (0.79–1.13) | 0.79 (0.66–0.95) | 0.72 (0.58–0.89) |
| HR (95% CI) from the Kailuan study | 1 | 0.81 (0.63–1.04) | 0.74 (0.57–0.96) | 0.56 (0.37–0.83) |
| HR (95% CI) from the UK Biobank | 1 | 0.82 (0.76–0.90) | 0.75 (0.68–0.84) | 0.69 (0.59–0.81) |
| Pooled HR (95% CI) | 1 | 0.84 (0.78–0.90) | 0.76 (0.70–0.83) | 0.69 (0.61–0.78) |
| Incident stroke | ||||
| HR (95% CI) from the DFTJ | 1 | 0.80 (0.62–1.04) | 0.70 (0.54–0.90) | 0.68 (0.50–0.93) |
| HR (95% CI) from the Kailuan study | 1 | 0.81 (0.69–0.93) | 0.75 (0.64–0.87) | 0.71 (0.57–0.89) |
| HR (95% CI) from the UK Biobank | 1 | 0.78 (0.65–0.93) | 0.66 (0.53–0.82) | 0.59 (0.43–0.83) |
| Pooled HR (95% CI) | 1 | 0.80 (0.72–0.89) | 0.72 (0.64–0.80) | 0.67 (0.57–0.79) |
| Cardiovascular disease mortality | ||||
| HR (95% CI) from the DFTJ | 1 | 0.64 (0.50–0.82) | 0.65 (0.51–0.83) | 0.51 (0.37–0.71) |
| HR (95% CI) from the Kailuan study | 1 | 1.00 (0.77–1.29) | 0.89 (0.69–1.16) | 0.85 (0.60–1.20) |
| HR (95% CI) from the UK Biobank | 1 | 0.78 (0.68–0.90) | 0.61 (0.51–0.73) | 0.50 (0.37–0.67) |
| HR (95% CI) from the NHANESb | 1 | 0.81 (0.71–0.93) | 0.63 (0.52–0.75) | 0.53 (0.41–0.69) |
| HR (95% CI) from the NIH-AARP | 1 | 0.83 (0.78–0.88) | 0.73 (0.68–0.77) | 0.59 (0.55–0.63) |
| Pooled HR (95% CI) | 1 | 0.81 (0.74–0.89) | 0.70 (0.62–0.78) | 0.58 (0.50–0.68) |
HR, hazard ratio; DFTJ, Dongfeng-Tongji cohort; NHANES, National Health and Nutrition Examination Survey; NIH-AARP, National Institutes of Health-AARP Diet and Health Study. Covariates included in models are listed in Supplemental Methods. For the analysis of incident cardiovascular disease, only those free from prevalent cardiovascular disease were included in the analysis.
In the NHANES, all estimates accounted for complex survey designs, and only deaths from heart disease were considered as cardiovascular disease deaths.
During a total of 1238,391 person-years of follow-up (median=11.0 years), 40,353 deaths were documented in the five cohorts. Generally, associations between the healthy lifestyle score and mortality were consistent across cohorts, and the HRs (95% CIs) comparing patients with 4–5 vs. 0–1 healthy lifestyle factors ranged between 0.53 (0.41–0.69) in the NHANES and 0.79 (0.67–0.95) in the Kailuan study (Table 4). Pooled age-adjusted rates of deaths (95% CIs) were 20.2 (6.9–33.6) and 34.3 (16.3–52.2) per 1000 person-years for patients with 4–5 and 0–1 healthy lifestyle factors, respectively; and the pooled multivariable-adjusted HR (95% CI) was 0.60 (0.53–0.68). Besides, each additional healthy lifestyle factor was associated with an HR of 0.84 (0.81–0.88) for all-cause mortality. Adopting more healthy lifestyle factors was also associated with lower CVD mortality (Table 5), and the pooled HRs (95% CI) comparing patients with 4–5 vs. 0–1 healthy lifestyle factors were 0.58 (0.50–0.68).
Subgroup Analyses and Sensitivity Analyses
Consistent results were observed in different subgroups by diabetes-related clinical features, sociodemographic characteristics, and metabolic health status across all cohorts (Pbetween-group>.11, Figure 1).
FIGURE 1.
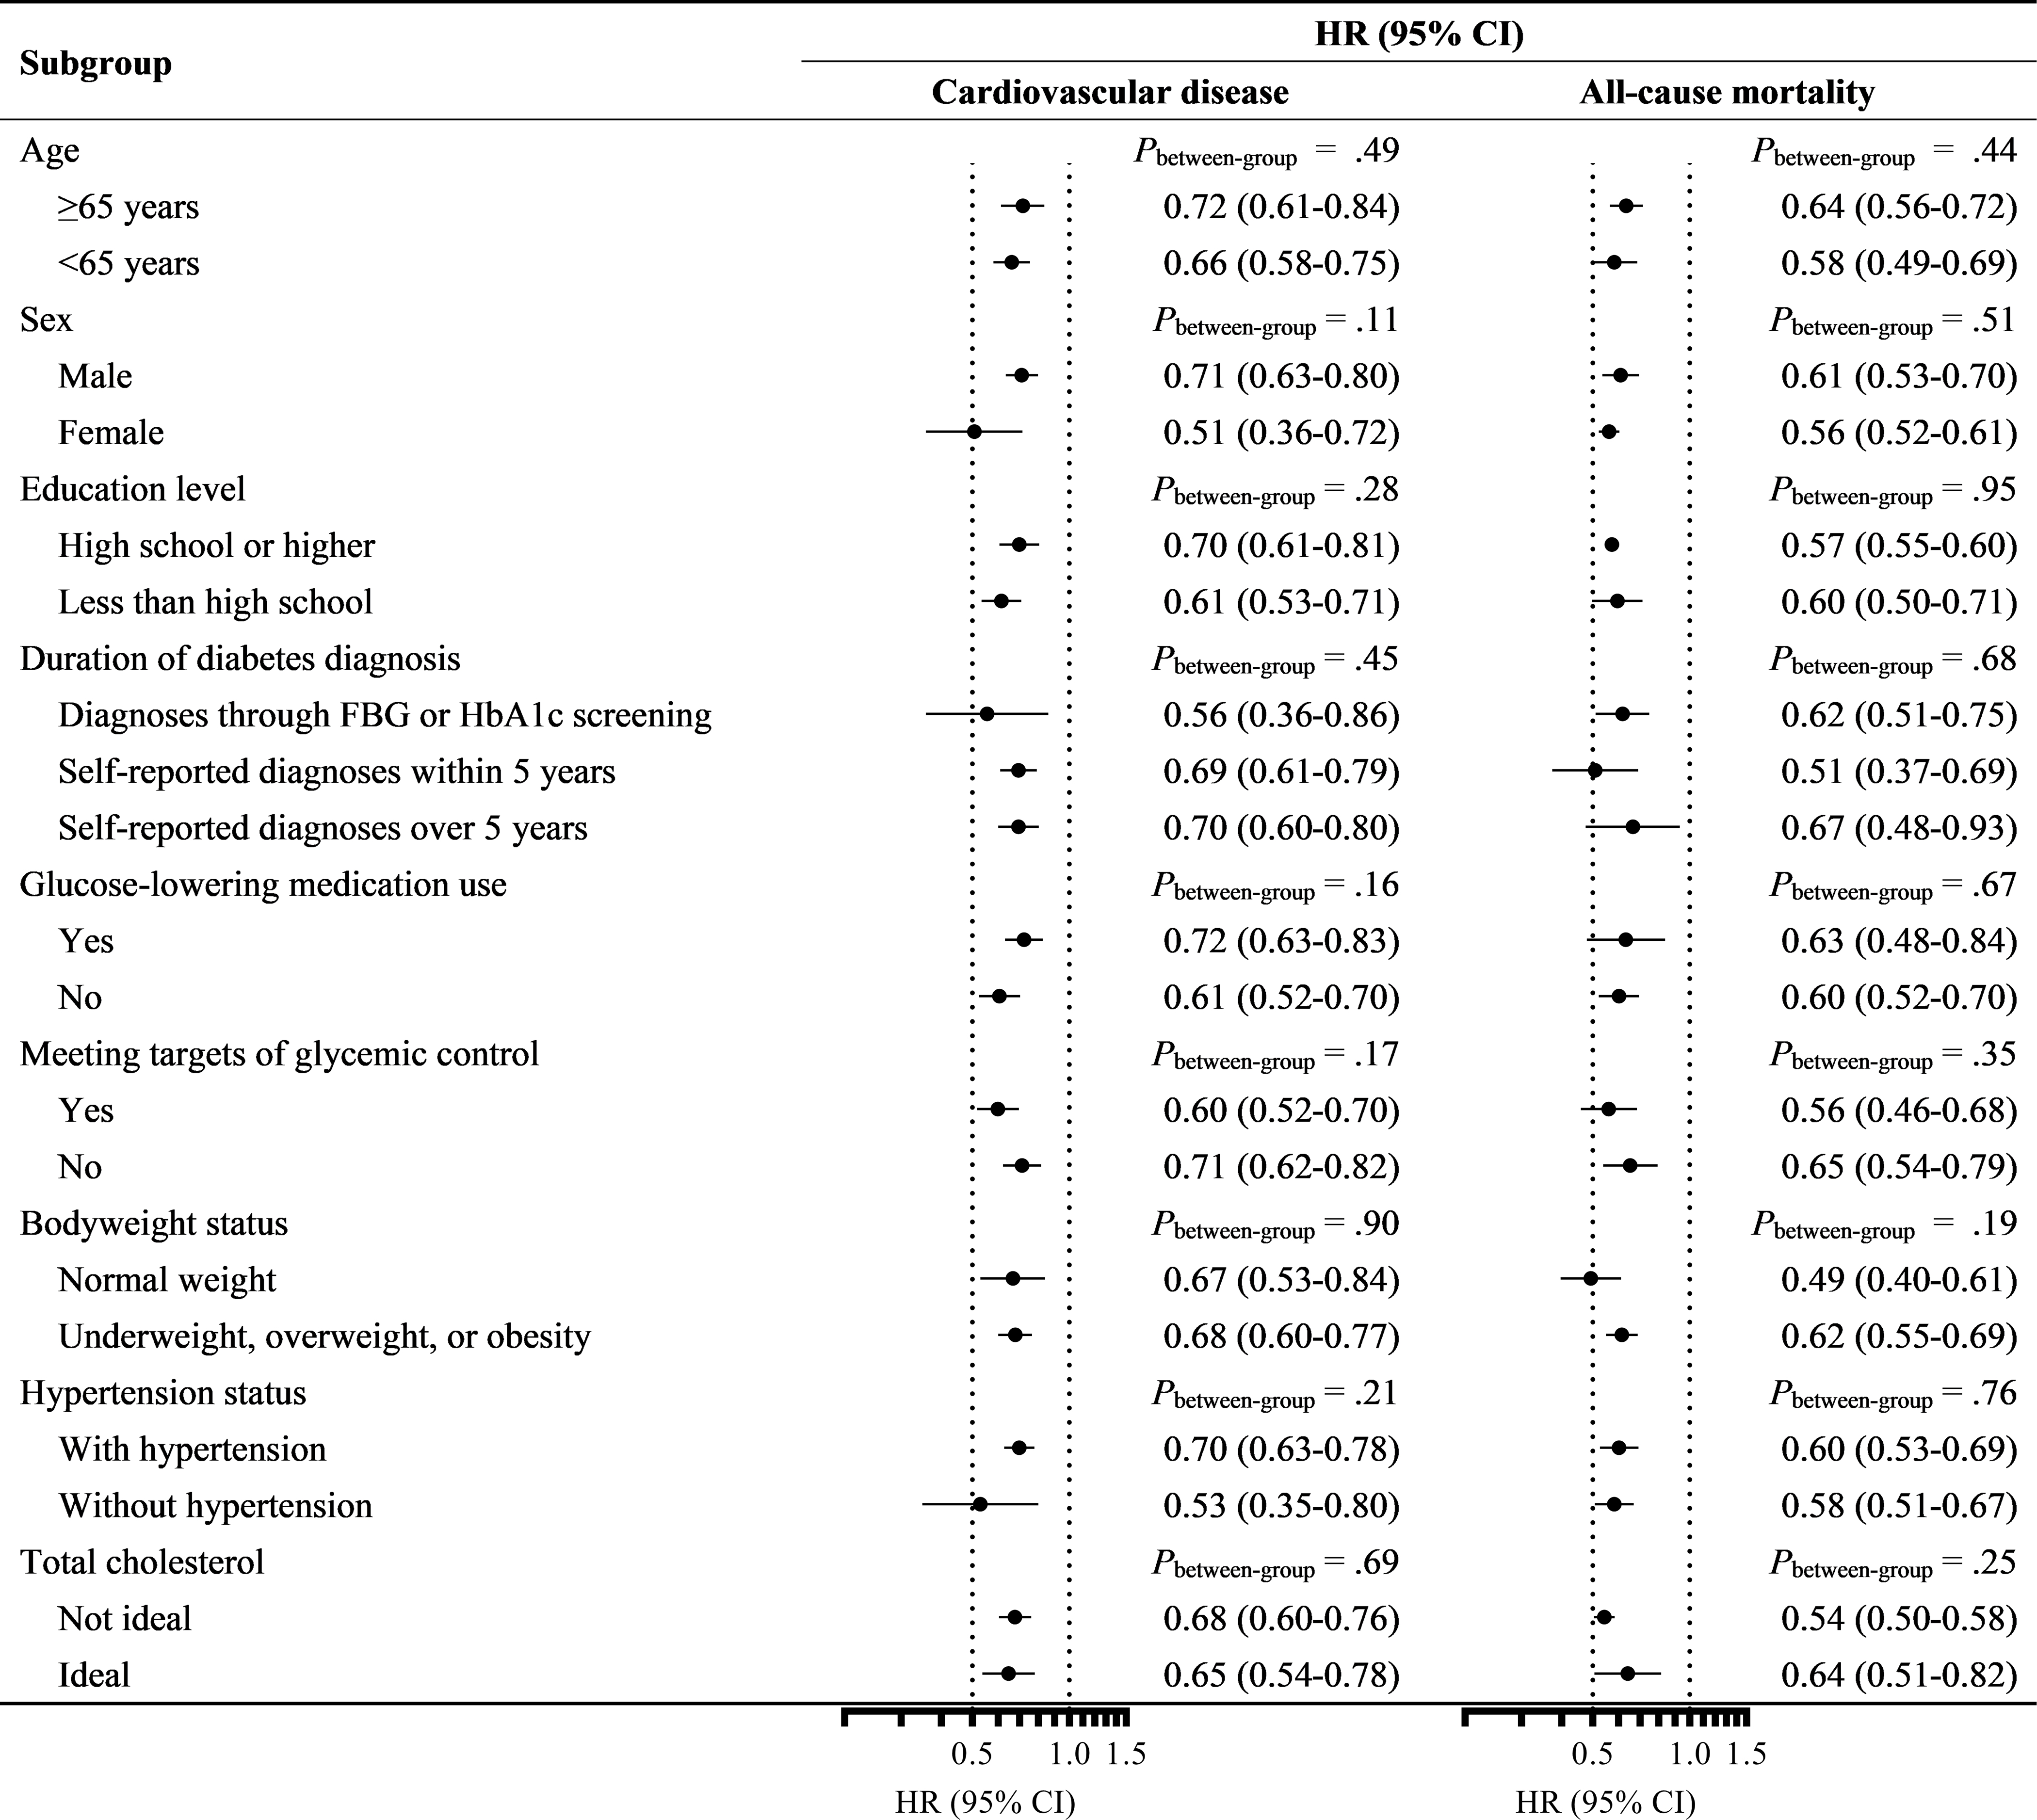
Associations of baseline lifestyle score with incident cardiovascular disease and mortality in individuals with diabetes stratified by demographic characteristics, disease status, and metabolic health. The dots indicated the HRs comparing individuals with 4 or 5 versus 0 or 1 healthy lifestyle factors, and the horizontal lines indicated the 95% CIs. Only those free from prevalent cardiovascular disease were included in the analysis of incident cardiovascular disease. Data from the NIH-AARP were not included in the stratified analyses by diabetes duration, glucose-lowering medication use, and meeting targets of glycemic control since no related information was available. CI, confidence interval; FPG, fasting plasma glucose; HbA1c, hemoglobin A1c; HR, hazard ratio; NIH-AARP, National Institutes of Health-AARP Diet and Health Study.
The associations did not change appreciably in different sensitivity analyses of redefining the healthy level of alcohol drinking, excluding events occurring in the first two years of follow-up, excluding patients with prevalent CVD or cancer, using the weighted lifestyle scores, using multiple imputation to handle missing covariates, or using 3-level lifestyle factors to create lifestyle score (Table 6 and Supplemental Table 7).
TABLE 6.
Associations of Baseline Lifestyle Score with Risks of Cardiovascular Disease and Mortality in Individuals with Diabetes: Sensitivity Analysesa
| Number of healthy lifestyle factors |
||||
|---|---|---|---|---|
| Analyses and outcomes | 0–1 | 2 | 3 | 4–5 |
|
| ||||
| Defining healthy alcohol drinking as <14 g/d of ethanol intake for females and <28 g/d for males | ||||
| Incident CVD | 1 | 0.93 (0.79–1.09) | 0.83 (0.75–0.93) | 0.71 (0.59–0.87) |
| All-cause mortality | 1 | 0.77 (0.69–0.86) | 0.69 (0.60–0.79) | 0.59 (0.48–0.72) |
| Excluding events occurring in the first two years of follow-up | ||||
| Incident CVD | 1 | 0.83 (0.78–0.89) | 0.76 (0.70–0.82) | 0.66 (0.59–0.74) |
| All-cause mortality | 1 | 0.80 (0.73–0.89) | 0.68 (0.61–0.77) | 0.60 (0.53–0.69) |
| Excluding those with prevalent CVD or cancer | ||||
| Incident CVD | 1 | 0.83 (0.78–0.88) | 0.74 (0.69–0.80) | 0.68 (0.62–0.76) |
| All-cause mortality | 1 | 0.81 (0.73–0.89) | 0.72 (0.63–0.82) | 0.62 (0.52–0.74) |
| Weighted score b | ||||
| Incident CVD | 1 | 0.86 (0.81–0.92) | 0.78 (0.73–0.83) | 0.72 (0.62–0.84) |
| All-cause mortality | 1 | 0.75 (0.66–0.86) | 0.71 (0.62–0.80) | 0.61 (0.55–0.68) |
| Multiple imputation | ||||
| Incident CVD | 1 | 0.85 (0.80–0.90) | 0.75 (0.70–0.80) | 0.68 (0.62–0.74) |
| All-cause mortality | 1 | 0.82 (0.74–0.92) | 0.70 (0.60–0.82) | 0.62 (0.52–0.74) |
CVD, cardiovascular disease; NHANES, National Health and Nutrition Examination Survey; NIH-AARP, National Institutes of Health-AARP Diet and Health Study. Data are presented as hazard ratio (95% CI). In the NHANES, all estimates accounted for complex survey designs. Covariates included in models are listed in Supplemental Methods. For the analysis of incident CVD, only those free from prevalent CVD were included in the analysis.
For weighted score, the HRs were comparing quintiles 2, 3, and 4 versus quintile 1.
As for individual lifestyle factors, we found healthy levels of physical activity, bodyweight or waist circumference, and non-smoking were associated with HRs (95% CIs) of 0.86 (0.81–0.91), 0.84 (0.79–0.90), and 0.83 (0.78–0.88) for incident CVD compared with the unhealthy levels, respectively; while healthy levels of diet, alcohol drinking, physical activity, and non-smoking were associated with HRs (95% CI) of 0.91 (0.86–0.97), 0.83 (0.76–0.91), 0.80 (0.76–0.84), and 0.67 (0.58–0.77) for all-cause mortality compared with the unhealthy levels (Supplemental Figure 2). Although associations of different lifestyle factors were various, associations of combined healthy lifestyle factors with incident CVD and mortality remained largely unchanged when one lifestyle factor was omitted each time from the total score (Supplemental Table 8).
DISCUSSION
Combined healthy lifestyles were associated with substantially lower risks of incident CVD and mortality among patients with diabetes from multiple cohorts. The associations were consistent across sociodemographic, metabolic, and diabetes-related subgroups and robust in different sensitivity analyses.
Although the associations of overall healthy lifestyles with lower risks of incident CVD and mortality are well-established in general populations,42, 43 evidence is still sparse among patients with diabetes. Clinical trials support achieving glycemic control through comprehensively weight-related lifestyle interventions including diet and physical activity in patients with diabetes.44, 45 However, current evidence from clinical trials regarding the effects of lifestyle interventions on CVD among patients with diabetes remains equivocal. The Look AHEAD trial recruited 5145 overweight/obese adults with type 2 diabetes and reported no significant risk reduction in composite cardiovascular outcomes or all-cause mortality among those receiving 4-year intensive lifestyle intervention (promoting weight loss through restricted caloric intakes and increased physical activity) during a median of 9.6-year follow-up, as compared to the regular diabetes support and education.4, 5 While a posthoc analysis reported participants in the intensive lifestyle intervention group with >10% weight loss in the first year had ~20% lower risks of composite cardiovascular outcomes compared with those in the diabetes support and education group,7 indicating the importance of adherence to lifestyle interventions and weight control for long-term health. The Steno-2 Study found intensive multifactorial intervention was associated with 46%–59% lower risks of death and cardiovascular events compared with the conventional treatment among patients with type 2 diabetes and microalbuminuria.9 However, the multifactorial intervention included both lifestyle modification and pharmacotherapy, and the specific contribution from lifestyle modifications was unclear; in addition, this study failed to increase participants’ physical activity level and reduce bodyweight. Besides, the trial had limitations restricting the generalizability of findings, such as a narrow sampling frame of predefined populations, small sample sizes, and targeting limited components of lifestyles. Thus, large population-based cohort studies with wide population characteristics and long follow-up periods are still warranted to provide more solid evidence.
A recent meta-analysis of 10 cohort studies among 34,385 patients with type 2 diabetes reported that healthy lifestyles were associated with 52%–56% lower risks of all-cause mortality (7 studies) and incident CVD (3 studies).10 However, most prior studies had <1000 participants,10 and the largest prior study included 11,527 US health professionals and nurses with newly diagnosed diabetes, of whom 2311 developed CVD.14 In addition, most studies were from western countries, and there were only two Asian studies among Chinese patients with diabetes which had a relatively smaller sample size (n<5700) and only mortality outcomes.11, 46 In addition, most previous studies did not fully control confounding from socioeconomic status,11, 13, 17 comorbidities,15–17 or diabetes treatment.12–17 In the current analyses of 5 cohorts from China, the UK, and the US, we included >100,000 participants with diabetes, which were about 3 times the size in all previous studies combined. Besides, we tried to harmonize the definitions of healthy lifestyles and analysis methods across studies, while substantial heterogeneity across published studies was reported in the meta-analysis.10
Our findings also highlighted the importance of comprehensive healthy lifestyles for diabetes care. Although associations of different lifestyle factors with mortality and morbidities varied among patients with diabetes, we found the associations of combined lifestyle factors remained similar when omitting one lifestyle factor each time from the healthy lifestyle score, indicating the needs to maintain a comprehensively healthy lifestyle rather than focusing on specific factors alone.
Our study has some major strengths. To our knowledge, it has been the largest population-based prospective study on this topic. The large sample size, prospective design, long-term follow-ups, standardized variable definition and analysis approach, and consistent and robust evidence across cohorts with diverse characteristics consolidate the generalizability of our findings. Moreover, although risks of subtypes of CVD were different across populations, our analyses found similar associations of healthy lifestyles with risks of coronary heart disease and stroke, indicating the universal health benefits of healthy lifestyles among patients with diabetes. Besides, previous studies did not consider the modification of diabetes-related clinical features, i.e., diabetes duration, use of glucose-lowering medications, and glycemic control;10 while our subgroup analyses indicated that the protective associations between healthy lifestyles and risks of CVD and mortality were consistent regardless patients’ clinical features, highlighting the importance of lifestyle management throughout all stages of diabetes.
Several limitations should be acknowledged. First, information on lifestyle factors was self-reported, and misclassification bias was inevitable. However, the potential misclassifications would be expected to be non-differential due to the prospective study design, so the true associations could be underestimated. Second, the definitions of healthy levels of physical activity and diet were not identical across cohorts due to different tools of data collection, thus the associations between healthy lifestyle scores and outcomes cannot be directly compared across cohorts; on the other hand, these definitions were tailored to local practice, and the consistent associations between healthy lifestyle scores of different definitions and lower CVD and mortality risks emphasized the values of adopting healthy lifestyles in public health practice. Third, although we extensively controlled potential confounders, there was still the possibility of residual and unmeasured confounding, such as different adherence to medication and self-glucose monitoring. Fourth, selection bias could be possible because study participants had different characteristics compared with those excluded from the current analyses due to missing data. However, multiple imputations generated similar results to the main analyses. Fifth, as we only used the lifestyle information at baseline, we are unable to examine the trajectories and changes of lifestyle factors in relation to outcomes. Sixth, follow-up information on other major diabetic complications (e.g., microvascular outcomes) was unavailable in our cohorts, which needs further investigations. Seventh, subgroup analyses were not designed a priori and might be underpowered, so the results should be cautiously interpreted. Eighth, participants in the cohorts might not be representative of patients with diabetes in China, the UK, and the US (except for the NHANES); thus, future studies with nationally representative samples are still needed. Ninth, reverse causation remained possible given the relatively short follow-up duration. Patients reporting non-current smoking or drinking might quit due to illness, and patients with lower bodyweight might experience unintentional weight loss due to illness. However, the results from sensitivity analysis of excluding events occurring in the first two years of follow-up and subgroup analyses by diabetes-related clinical factors remained consistent. Tenth, diabetes was defined through self-reports or single-measured biomarkers, and misclassification was possible. Besides, we cannot differentiate the types of diabetes due to the lack of data; however, over 92.5% of participants were diagnosed with diabetes after age 30, and the proportion of diabetes other than type 2 diabetes would be minimum.
CONCLUSION
Our international analyses document that adherence to multi-component healthy lifestyles was associated with substantially lower risks of incident CVD and mortality among patients with diabetes in China, the UK, and the US, regardless of patients’ sociodemographic, metabolic, and diabetes-related features. Our findings highlight the urgent need for public health programs and clinical interventions targeting multiple health behaviors to improve diabetes care. Future research should also be directed to the effects of longitudinal lifestyle changes on multiple health outcomes in patients at different stages of diabetes, especially involving the less studied microvascular complications, nerve damage, and infections.
Supplementary Material
ACKNOWLEDGMENTS
Yan-Bo Zhang, Xiong-Fei Pan, Qi Lu, Yan-Xiu Wang, and Ting-Ting Geng contributed equally to this work and are joint first authors. Drs An Pan, Gang Liu, and Shou-Ling Wu are joint senior authors.
Grant Support:
This work was supported by the National Natural Science Foundation of China (81930124, 82021005, and 82073554), Fundamental Research Funds for the Central Universities (2021GCRC075 and 2021GCRC076), Hubei Province Science Fund for Distinguished Young Scholars (2021CFA048), and China Postdoctoral Science Foundation (2021M691129).
Abbreviations and Acronyms:
- BMI
body mass index
- CVD
cardiovascular disease
- DFTJ
Dongfeng-Tongji cohort
- FBG
fasting blood glucose
- HbA1c
hemoglobin A1c
- Look AHEAD
Look Action for Health in Diabetes
- NHANES
National Health and Nutrition Examination Survey
- NIH
National Institutes of Health
Footnotes
Potential Competing Interests: The authors report no competing interests.
Financial support and conflict of interest disclosure: This work was supported by the National Natural Science Foundation of China (81930124, 82021005, and 82073554), Fundamental Research Funds for the Central Universities (2021GCRC075 and 2021GCRC076), Hubei Province Science Fund for Distinguished Young Scholars (2021CFA048), and China Postdoctoral Science Foundation (2021M691129). The authors report no competing interests.
Publisher's Disclaimer: This is a PDF file of an unedited manuscript that has been accepted for publication. As a service to our customers we are providing this early version of the manuscript. The manuscript will undergo copyediting, typesetting, and review of the resulting proof before it is published in its final form. Please note that during the production process errors may be discovered which could affect the content, and all legal disclaimers that apply to the journal pertain.
Contributor Information
Yan-Bo Zhang, Department of Epidemiology and Biostatistics, Ministry of Education Key Laboratory of Environment and Health, School of Public Health, Tongji Medical College, Huazhong University of Science and Technology, Wuhan, China.
Xiong-Fei Pan, Key Laboratory of Birth Defects and Related Diseases of Women and Children, Ministry of Education, West China Second University Hospital, Sichuan University, Chengdu, China; Division of Epidemiology, Department of Medicine, Vanderbilt Epidemiology Center, Vanderbilt University Medical Center, Nashville, TN.
Qi Lu, Department of Nutrition and Food Hygiene, Hubei Key Laboratory of Food Nutrition and Safety, School of Public Health, Tongji Medical College, Huazhong University of Science and Technology, Wuhan, China.
Yan-Xiu Wang, Department of Cardiology, Kailuan Hospital, North China University of Science and Technology, Tangshan, China.
Ting-Ting Geng, Department of Epidemiology and Biostatistics, Ministry of Education Key Laboratory of Environment and Health, School of Public Health, Tongji Medical College, Huazhong University of Science and Technology, Wuhan, China.
Yan-Feng Zhou, Department of Epidemiology and Biostatistics, Ministry of Education Key Laboratory of Environment and Health, School of Public Health, Tongji Medical College, Huazhong University of Science and Technology, Wuhan, China.
Linda M. Liao, Division of Cancer Epidemiology & Genetics, National Cancer Institute, National Institutes of Health, Bethesda, MD.
Zhou-Zheng Tu, Department of Epidemiology and Biostatistics, Ministry of Education Key Laboratory of Environment and Health, School of Public Health, Tongji Medical College, Huazhong University of Science and Technology, Wuhan, China.
Jun-Xiang Chen, Department of Epidemiology and Biostatistics, Ministry of Education Key Laboratory of Environment and Health, School of Public Health, Tongji Medical College, Huazhong University of Science and Technology, Wuhan, China.
Peng-Fei Xia, Department of Epidemiology and Biostatistics, Ministry of Education Key Laboratory of Environment and Health, School of Public Health, Tongji Medical College, Huazhong University of Science and Technology, Wuhan, China.
Yi Wang, Department of Epidemiology and Biostatistics, Ministry of Education Key Laboratory of Environment and Health, School of Public Health, Tongji Medical College, Huazhong University of Science and Technology, Wuhan, China.
Zhen-Zhen Wan, Department of Epidemiology and Biostatistics, Ministry of Education Key Laboratory of Environment and Health, School of Public Health, Tongji Medical College, Huazhong University of Science and Technology, Wuhan, China.
Kun-Quan Guo, Affiliated Dongfeng Hospital, Hubei University of Medicine, Shiyan, China.
Kun Yang, Affiliated Dongfeng Hospital, Hubei University of Medicine, Shiyan, China.
Han-Dong Yang, Affiliated Dongfeng Hospital, Hubei University of Medicine, Shiyan, China.
Shuo-Hua Chen, Department of Cardiology, Kailuan Hospital, North China University of Science and Technology, Tangshan, China.
Guo-Dong Wang, Department of Cardiology, Kailuan Hospital, North China University of Science and Technology, Tangshan, China.
Xu Han, Department of Cardiology, Kailuan Hospital, North China University of Science and Technology, Tangshan, China.
Yi-Xin Wang, Department of Epidemiology and Biostatistics, Ministry of Education Key Laboratory of Environment and Health, School of Public Health, Tongji Medical College, Huazhong University of Science and Technology, Wuhan, China.
Danxia Yu, Division of Epidemiology, Department of Medicine, Vanderbilt Epidemiology Center, Vanderbilt University Medical Center, Nashville, TN.
Mei-An He, Department of Occupational and Environmental Health, Ministry of Education Key Laboratory of Environment and Health, School of Public Health, Tongji Medical College, Huazhong University of Science and Technology, Wuhan, China.
Xiao-Min Zhang, Department of Occupational and Environmental Health, Ministry of Education Key Laboratory of Environment and Health, School of Public Health, Tongji Medical College, Huazhong University of Science and Technology, Wuhan, China.
Lie-Gang Liu, Department of Nutrition and Food Hygiene, Hubei Key Laboratory of Food Nutrition and Safety, School of Public Health, Tongji Medical College, Huazhong University of Science and Technology, Wuhan, China.
Tangchun Wu, Department of Occupational and Environmental Health, Ministry of Education Key Laboratory of Environment and Health, School of Public Health, Tongji Medical College, Huazhong University of Science and Technology, Wuhan, China.
Shou-Ling Wu, Department of Cardiology, Kailuan Hospital, North China University of Science and Technology, Tangshan, China.
Gang Liu, Department of Nutrition and Food Hygiene, Hubei Key Laboratory of Food Nutrition and Safety, School of Public Health, Tongji Medical College, Huazhong University of Science and Technology, Wuhan, China.
An Pan, Department of Epidemiology and Biostatistics, Ministry of Education Key Laboratory of Environment and Health, School of Public Health, Tongji Medical College, Huazhong University of Science and Technology, Wuhan, China.
REFERENCES
- 1.International Diabetes Federation. IDF Diabetes Atlas 9th edition 2019. https://diabetesatlas.org/upload/resources/material/20200302_133351_IDFATLAS9e-final-web.pdf. Accessed July 21, 2021. [PubMed]
- 2.Zheng Y, Ley SH, Hu FB. Global aetiology and epidemiology of type 2 diabetes mellitus and its complications. Nat Rev Endocrinol. 2018;14(2):88–98. [DOI] [PubMed] [Google Scholar]
- 3.Davies MJ, D’Alessio DA, Fradkin J, et al. Management of hyperglycemia in type 2 diabetes, 2018. A consensus report by the American Diabetes Association (ADA) and the European Association for the Study of Diabetes (EASD). Diabetes Care. 2018;41(12):2669–2701. [DOI] [PMC free article] [PubMed] [Google Scholar]
- 4.Wing RR, Bolin P, Brancati FL, et al. Cardiovascular effects of intensive lifestyle intervention in type 2 diabetes. N Engl J Med. 2013;369(2):145–154. [DOI] [PMC free article] [PubMed] [Google Scholar]
- 5.Gregg EW, Lin J, Bardenheier B, et al. Impact of intensive lifestyle intervention on disability-free life expectancy: the Look AHEAD study. Diabetes Care. 2018;41(5):1040–1048. [DOI] [PMC free article] [PubMed] [Google Scholar]
- 6.de Vries TI, Dorresteijn JAN, van der Graaf Y, Visseren FLJ, Westerink J. Heterogeneity of treatment effects from an intensive lifestyle weight loss intervention on cardiovascular events in patients with type 2 diabetes: data from the Look AHEAD trial. Diabetes Care. 2019;42(10):1988–1994. [DOI] [PMC free article] [PubMed] [Google Scholar]
- 7.Gregg EW, Jakicic JM, Blackburn G, et al. Association of the magnitude of weight loss and changes in physical fitness with long-term cardiovascular disease outcomes in overweight or obese people with type 2 diabetes: a post-hoc analysis of the Look AHEAD randomised clinical trial. Lancet Diabetes Endocrinol. 2016;4(11):913–921. [DOI] [PMC free article] [PubMed] [Google Scholar]
- 8.Gaede P, Vedel P, Larsen N, Jensen GV, Parving HH, Pedersen O. Multifactorial intervention and cardiovascular disease in patients with type 2 diabetes. N Engl J Med. 2003;348(5):383–393. [DOI] [PubMed] [Google Scholar]
- 9.Gaede P, Lund-Andersen H, Parving HH, Pedersen O. Effect of a multifactorial intervention on mortality in type 2 diabetes. N Engl J Med. 2008;358(6):580–591. [DOI] [PubMed] [Google Scholar]
- 10.Zhang Y, Pan XF, Chen J, et al. Combined lifestyle factors and risk of incident type 2 diabetes and prognosis among individuals with type 2 diabetes: a systematic review and meta-analysis of prospective cohort studies. Diabetologia. 2020;63(1):21–33. [DOI] [PubMed] [Google Scholar]
- 11.Lin CC, Li CI, Liu CS, et al. Impact of lifestyle-related factors on all-cause and cause-specific mortality in patients with type 2 diabetes: the Taichung Diabetes Study. Diabetes Care. 2012;35(1):105–112. [DOI] [PMC free article] [PubMed] [Google Scholar]
- 12.Bonaccio M, Di Castelnuovo A, Costanzo S, et al. Impact of combined healthy lifestyle factors on survival in an adult general population and in high-risk groups: prospective results from the Moli-sani Study. J Intern Med. 2019;286(2):207–220. [DOI] [PubMed] [Google Scholar]
- 13.Dunkler D, Kohl M, Teo KK, et al. Population-attributable fractions of modifiable lifestyle factors for CKD and mortality in individuals with type 2 diabetes: a cohort study. Am J Kidney Dis. 2016;68(1):29–40. [DOI] [PubMed] [Google Scholar]
- 14.Liu G, Li Y, Hu Y, et al. Influence of lifestyle on incident cardiovascular disease and mortality in patients with diabetes mellitus. J Am Coll Cardiol. 2018;71(25):2867–2876. [DOI] [PMC free article] [PubMed] [Google Scholar]
- 15.Long GH, Cooper AJ, Wareham NJ, Griffin SJ, Simmons RK. Healthy behavior change and cardiovascular outcomes in newly diagnosed type 2 diabetic patients: a cohort analysis of the ADDITION-Cambridge study. Diabetes Care. 2014;37(6):1712–1720. [DOI] [PMC free article] [PubMed] [Google Scholar]
- 16.Mancini GBJ, Maron DJ, Hartigan PM, et al. Lifestyle, Glycosylated Hemoglobin A1c, and Survival Among Patients With Stable Ischemic Heart Disease and Diabetes. J Am Coll Cardiol. 2019;73(16):2049–2058. [DOI] [PubMed] [Google Scholar]
- 17.Patel YR, Gadiraju TV, Gaziano JM, Djousse L. Adherence to healthy lifestyle factors and risk of death in men with diabetes mellitus: The Physicians’ Health Study. Clin Nutr. 2018;37(1):139–143. [DOI] [PMC free article] [PubMed] [Google Scholar]
- 18.Wang F, Zhu J, Yao P, et al. Cohort Profile: the Dongfeng-Tongji cohort study of retired workers. Int J Epidemiol. 2013;42(3):731–740. [DOI] [PubMed] [Google Scholar]
- 19.Zhang Q, Zhou Y, Gao X, et al. Ideal cardiovascular health metrics and the risks of ischemic and intracerebral hemorrhagic stroke. Stroke. 2013;44(9):2451–2456. [DOI] [PubMed] [Google Scholar]
- 20.Sudlow C, Gallacher J, Allen N, et al. UK biobank: an open access resource for identifying the causes of a wide range of complex diseases of middle and old age. PLoS Med. 2015;12(3):e1001779. [DOI] [PMC free article] [PubMed] [Google Scholar]
- 21.Centers for Disease Control and Prevention/National Center for Health Statistics. About the National Health and Nutrition Examination Survey. www.cdc.gov/nchs/nhanes/about_nhanes.htm. Accessed June 12, 2021.
- 22.Schatzkin A, Subar AF, Thompson FE, et al. Design and serendipity in establishing a large cohort with wide dietary intake distributions: the National Institutes of Health-American Association of Retired Persons Diet and Health Study. Am J Epidemiol. 2001;154(12):1119–1125. [DOI] [PubMed] [Google Scholar]
- 23.American Diabetes Association. 2. Classification and diagnosis of siabetes: standards of medical care in diabetes-2020. Diabetes Care. 2020;43(Suppl 1):S14–S31. [DOI] [PubMed] [Google Scholar]
- 24.Costanzo S, Castelnuovo AD, Donati MB, Iacoviello L, Gaetano GD. Wine, beer or spirit drinking in relation to fatal and non-fatal cardiovascular events: a meta-analysis. Eur J Epidemiol. 2011;26(11):833–850. [DOI] [PubMed] [Google Scholar]
- 25.Stockwell T, Zhao J, Panwar S, Roemer A, Naimi T, Chikritzhs T. Do “moderate” drinkers have reduced mortality risk? A systematic review and meta-analysis of alcohol consumption and all-cause mortality. J Stud Alcohol Drugs. 2016;77(2):185–198. [DOI] [PMC free article] [PubMed] [Google Scholar]
- 26.US Department of Agriculture, US Department of Health and Human Services. Dietary guidelines for Americans, 2020–2025. https://www.dietaryguidelines.gov/sites/default/files/2020-12/Dietary_Guidelines_for_Americans_2020-2025.pdf. Accessed December 9, 2021.
- 27.Nöthlings U, Ford ES, Kroger J, Boeing H. Lifestyle factors and mortality among adults with diabetes: findings from the European Prospective Investigation into Cancer and Nutrition-Potsdam study. J Diabetes. 2010;2(2):112–117. [DOI] [PubMed] [Google Scholar]
- 28.Lloyd-Jones DM, Hong Y, Labarthe D, et al. Defining and setting national goals for cardiovascular health promotion and disease reduction: the American Heart Association’s strategic Impact Goal through 2020 and beyond. Circulation. 2010;121(4):586–613. [DOI] [PubMed] [Google Scholar]
- 29.Zhang YB, Chen C, Pan XF, et al. Associations of healthy lifestyle and socioeconomic status with mortality and incident cardiovascular disease: two prospective cohort studies. BMJ. 2021;373:n604. [DOI] [PMC free article] [PubMed] [Google Scholar]
- 30.Pelser C, Arem H, Pfeiffer RM, et al. Prediagnostic lifestyle factors and survival after colon and rectal cancer diagnosis in the National Institutes of Health (NIH)-AARP Diet and Health Study. Cancer. 2014;120(10):1540–1547. [DOI] [PMC free article] [PubMed] [Google Scholar]
- 31.Han X, Wei Y, Hu H, et al. Genetic risk, a healthy lifestyle, and type 2 diabetes: the Dongfeng-Tongji cohort study. J Clin Endocrinol Metab. 2020;105(4). [DOI] [PubMed] [Google Scholar]
- 32.Carnethon MR, De Chavez PJ, Biggs ML, et al. Association of weight status with mortality in adults with incident diabetes. JAMA. 2012;308(6):581–590. [DOI] [PMC free article] [PubMed] [Google Scholar]
- 33.Dallongeville J, Bhatt DL, Steg PH, et al. Relation between body mass index, waist circumference, and cardiovascular outcomes in 19,579 diabetic patients with established vascular disease: the REACH Registry. Eur J Prev Cardiol. 2012;19(2):241–249. [DOI] [PubMed] [Google Scholar]
- 34.Pan XF, Wang L, Pan A. Epidemiology and determinants of obesity in China. Lancet Diabetes Endocrinol. 2021;9(6):373–392. [DOI] [PubMed] [Google Scholar]
- 35.World Health Organization. Waist circumference and waist-hip ratio: report of a WHO expert consultation, Geneva, 8–11 December 2008. https://apps.who.int/iris/handle/10665/44583. Accessed June 6, 2021.
- 36.WHO Consultation on Obesity, World Health Organization. Obesity: preventing and managing the global epidemic: report of a WHO consultation. https://apps.who.int/iris/handle/10665/42330. Accessed July 21, 2021. [PubMed]
- 37.American Diabetes Association. 12. Older adults: standards of medical care in diabetes-2020. Diabetes Care. 2020;43(Suppl 1):S152–S162. [DOI] [PubMed] [Google Scholar]
- 38.American Diabetes Association. 6. Glycemic targets: standards of medical care in diabetes-2020. Diabetes Care. 2020;43(Suppl 1):S66–S76. [DOI] [PubMed] [Google Scholar]
- 39.Cochrane Training. Chapter 10: Analysing data and undertaking meta-analyses. https://training.cochrane.org/handbook/current/chapter-10#section-10-11-4. Accessed July 20, 2022.
- 40.GBD Alcohol Collaborators. Alcohol use and burden for 195 countries and territories, 1990–2016: a systematic analysis for the Global Burden of Disease Study 2016. Lancet. 2018;392(10152):1015–1035. [DOI] [PMC free article] [PubMed] [Google Scholar]
- 41.Yuan Y Multiple imputation using SAS software. J Stat Softw. 2011;45:1–25. [DOI] [PMC free article] [PubMed] [Google Scholar]
- 42.Zhang YB, Pan XF, Chen J, et al. Combined lifestyle factors, all-cause mortality and cardiovascular disease: a systematic review and meta-analysis of prospective cohort studies. J Epidemiol Community Health. 2021;75(1):92–99. [DOI] [PubMed] [Google Scholar]
- 43.Zhang YB, Pan XF, Chen J, et al. Combined lifestyle factors, incident cancer, and cancer mortality: a systematic review and meta-analysis of prospective cohort studies. Br J Cancer. 2020;122(7):1085–1093. [DOI] [PMC free article] [PubMed] [Google Scholar]
- 44.Gillies CL, Abrams KR, Lambert PC, et al. Pharmacological and lifestyle interventions to prevent or delay type 2 diabetes in people with impaired glucose tolerance: systematic review and meta-analysis. BMJ. 2007;334(7588):299. [DOI] [PMC free article] [PubMed] [Google Scholar]
- 45.Schellenberg E, Dryden D, Vandermeer B, Ha C, Korownyk C. Lifestyle interventions for patients with and at risk for type 2 diabetes: a systematic review and meta-analysis. Ann Intern Med. 2013;159(8):543–551. [DOI] [PubMed] [Google Scholar]
- 46.Pan XF, Li Y, Franco OH, Yuan JM, Pan A, Koh WP. Impact of Combined Lifestyle Factors on All-Cause and Cause-Specific Mortality and Life Expectancy in Chinese: The Singapore Chinese Health Study. J Gerontol A Biol Sci Med Sci. 2020;75(11):2193–2199. [DOI] [PMC free article] [PubMed] [Google Scholar]
Associated Data
This section collects any data citations, data availability statements, or supplementary materials included in this article.