Abstract
Vibrio cholerae biotype El Tor is perpetuating the longest cholera pandemic in recorded history. The genomic islands VSP-1 and VSP-2 distinguish El Tor from previous pandemic V. cholerae strains. Using a co-occurrence analysis of VSP genes in >200,000 bacterial genomes we built gene networks to infer biological functions encoded in these islands. This revealed that dncV, a component of the cyclic-oligonucleotide-based anti-phage signalling system (CBASS) anti-phage defence system, co-occurs with an uncharacterized gene vc0175 that we rename avcD for anti-viral cytodine deaminase. We show that AvcD is a deoxycytidylate deaminase and that its activity is post-translationally inhibited by a non-coding RNA named AvcI. AvcID and bacterial homologues protect bacterial populations against phage invasion by depleting free deoxycytidine nucleotides during infection, thereby decreasing phage replication. Homologues of avcD exist in all three domains of life, and bacterial AvcID defends against phage infection by combining traits of two eukaryotic innate viral immunity proteins, APOBEC and SAMHD1.
Vibrio cholerae is the aetiological agent of the diarrhoeal disease cholera, for which there have been seven recorded pandemics. The El Tor biotype, responsible for the seventh pandemic (1961 to present), acquired two genomic islands of unknown origins, named the Vibrio Seventh Pandemic Islands 1 and 2 (VSP-1 and VSP-2)1, that are not present in previous pandemic strains and are hypothesized to have a crucial role in El Tor’s evolution to pandemicity2. VSP-1 and VSP-2 comprise ~39 kb DNA and encode ~36 putative open reading frames (ORFs), many of which remain to be characterized (Extended Data Fig. 1a,b)3–7. While the majority of the genes in these two islands remain to be studied, it is hypothesized that the biological functions they encode may contribute to environmental persistence8 and/or the pathogenicity5 of the El Tor biotype.
In support of this idea, VSP-1 encodes a phage defence system encompassing the genes dncV, capV, vc0180 and vc0181 called the cyclic-oligonucleotide-based anti-phage signalling system (CBASS)9 (Fig. 1a). CBASS limits phage invasion of bacterial populations via a process termed abortive replication whereby, upon phage infection, cyclic GMP–AMP (cGAMP) synthesis by DncV activates cell lysis by stimulating the phospholipase activity of CapV9,10. Such phage defence systems are critical for the adaptation and spread of pandemic V. cholerae as three lytic phages, ICP1, ICP2 and ICP3, eradicate V. cholerae both in vivo and in environmental niches to limit cholera epidemics11–13. Thus, the ability to counteract phage infection is hypothesized to be a key driver in the emergence of pandemic V. cholerae.
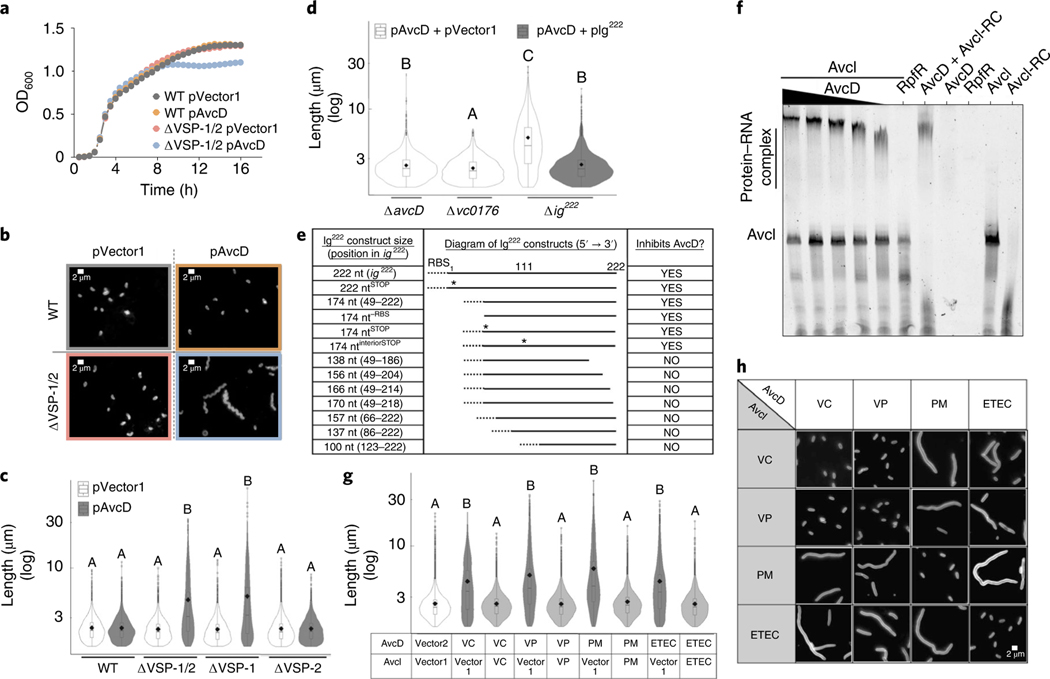
Fig. 1 |. AvcD-induced filamentation is inhibited by sRNA Avci.
Growth curves (a) and representative images (b) of WT El Tor V. cholerae and ΔVSP-1/2 strains expressing avcD from a Ptac-inducible plasmid (pAvcD) or an empty vector control (pVector1). Cells were stained with FM4–64 before imaging. Scale bar, 2 μm. This experiment was repeated at least three times. c, Cell length distributions of WT V. cholerae and VSP island mutants expressing pAvcD or pVector1. d, Cell length distributions of VSP-1 gene locus mutants expressing pAvcD in combination with either pIg222 or a vector control (pVector2). e, Table reporting the capacity of various ig222 Ptac-inducible constructs to prevent AvcD-induced cell filamentation when expressed in combination with pAvcD in Δig222 V. cholerae. Dotted line denotes a non-native RBS, ‘*’ indicates a putative start codon mutated to a stop. f, An AvcD–AvcI complex formed in an AvcD concentration-dependent manner as determined by EMSA. Trace quantities of non-specific binding of AvcD to the AvcI reverse complement (AvcI-RC) were observed. This experiment was repeated at least three times, yielding similar results. g, Cell length distributions of E. coli co-expressing Ptac-inducible plasmids encoding avcD homologues and their cognate avcI or vector controls. VC, Vibrio cholerae; VP, Vibrio parahaemolyticus; PM, Proteus mirabilis; ETEC, E. coli ETEC. h, Representative images of E. coli co-expressing various combinations of Ptac-inducible plasmids encoding homologues of avcD and avcI. Scale represents 2 μm. Error bars represent s.e.m. from three biological replicates. All violin plots represent ~1,000–3,000 cells measured per strain (n = 3 biological samples) with summary statistics: mean (diamonds), median (horizontal black line), interquartile range (box) and data below and above the interquartile range (vertical lines). Different letters indicate significant differences using two-way analysis of variance (ANOVA) with Tukey’s post-hoc test (c and d) or to two-sided Dunnett’s post-hoc test (g) against the control strain (pVector1 + pVector2) at P < 0.05.
During our search for VSP-1 and VSP-2 gene networks, we determined that the unstudied gene vc0175, renamed herein as avcD for anti-viral cytidine deaminase (CDA) (formerly named dcdV14), co-occurs in bacterial genomes with dncV. Given that AvcD encodes a putative deoxycytidine deaminase, we hypothesized that this enzyme provides defence against phages by altering nucleotide concentrations upon phage infection.
Results
Correlation analysis identifies VSP-1 and VSP-2 gene networks.
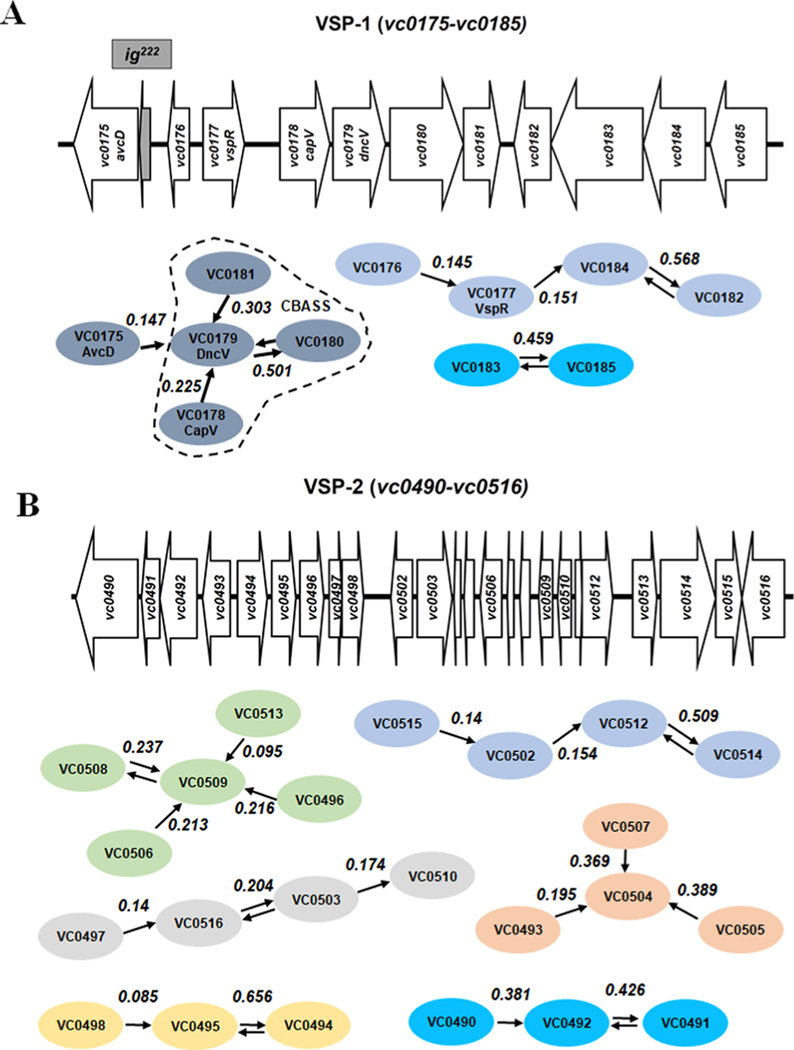
To assign predicted functions to VSP-1 and VSP-2 genes, we built networks of VSP island genes (groups of genes that are likely to accomplish a shared biological task) based on their co-occurrence across all sequenced bacterial genomes (>200,000) in the National Center for Biotechnology Information (NCBI) non-redundant database. We hypothesized that VSP genes co-occurring together in the genomes of diverse taxa were likely to share evolutionary history and thus a conserved biological function. Our freely available program ‘GeneCoOccurrence’ (available at https://github.com/clinte14/GeneCoOccurrence) predicted, along with other networks (Extended Data Fig. 1a,b), a VSP-1 gene network centred on dncV that contains the CBASS anti-phage system9 (Extended Data Fig. 1a). Curiously, the VSP-1 deoxycytidylate deaminase (DCD), vc0175, which we renamed anti-viral CDA (avcD), was also found to co-occur with dncV (Extended Data Fig. 1a). Recognizing that the co-occurrence of dncV and avcD may indicate a shared or common biological purpose, we sought to understand the function of avcD.
AvcD inhibits growth of V. cholerae in the absence of VSP-1.
We found that over-expressing avcD (pAvcD) in wild-type (WT) V. cholerae did not affect growth. However, growth was impaired in a double VSP island deletion mutant (ΔVSP-1/2) when over-expressing avcD (Fig. 1a). Expression of pAvcD in ΔVSP-1/2 produced filamentous cell morphologies, suggesting that these cells have a defect in cell division that manifests in a reduced growth yield (Fig. 1b). We performed the same image analysis in single island mutants and found that cell lengths increased only in strains lacking VSP-1 (Fig. 1c). Expression of pAvcD in a strain lacking a previously unannotated 222-nucleotide ORF (Δig222), encoded immediately 5′ of avcD in VSP-1 (Extended Data Fig. 1a), produced a filamentous cell morphology that was abrogated when ig222 was provided in trans (Fig. 1d). Importantly, AvcD-dependent filamentation was not observed in strains lacking either annotated locus flanking ig222 (avcD and vc0176) (Fig. 1d).
AvcD activity is inhibited by the non-coding sRNA AvcI.
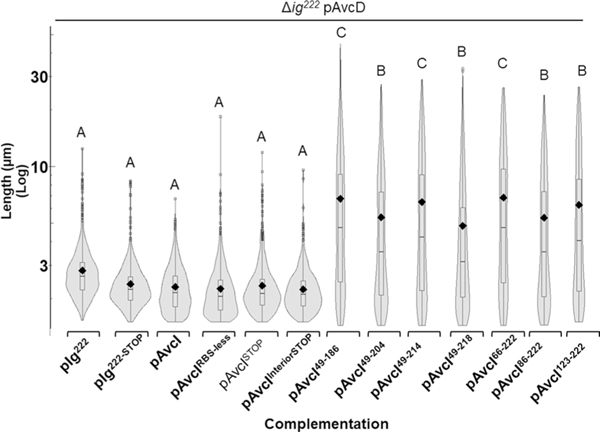
To determine whether the AvcD inhibiting component encoded in ig222 was a small peptide or an untranslated small regulatory RNA (sRNA), we deconstructed the ig222 locus in an inducible plasmid by truncating the locus, removing the plasmid-encoded ribosome binding site (RBS) and mutating potential start codons (‘*’). We then explored whether these constructs retained the capacity to inhibit AvcD-induced filamentation in Δig222 when co-expressed with pAvcD. We found the minimum inhibitory length of the ig222 locus is between 157 nt and 174 nt and neither the lack of the RBS nor nonsense mutations of three possible start codons abrogated its ability to suppress filamentation (Fig. 1e and Extended Data Fig. 2). Collectively, these results suggest that the AvcD-inhibitory component of ig222 is a novel sRNA, and we refer to the 174 nt locus within ig222 as AvcI, for AvcD Inhibitor (formerly difV14) (Fig. 1e).
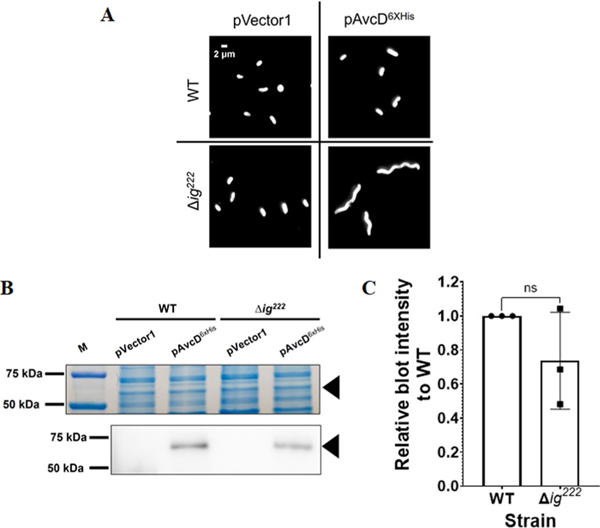
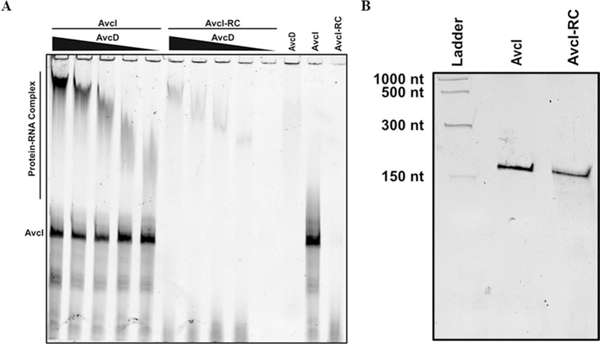
To determine whether AvcI regulates AvcD at the level of pre- or post-translation, we expressed an avcD C-terminally tagged 6× histidine construct (AvcD6xHIS) in WT and Δig222 V. cholerae and measured the cellular abundance of AvcD6xHIS using western blotting. Expression of AvcD6xHIS manifested in a filamentous cell phenotype in Δig222 that was not observed in the WT strain, indicating the tagged protein retains its native activity and is also negatively regulated by AvcI (Extended Data Fig. 3a). However, the cellular abundance of AvcD6xHIS was not different between these two strains (Extended Data Fig. 3b,c). Additionally, incubation of purified AvcD with in vitro transcribed AvcI RNA revealed robust AvcD–AvcI complex formation (Fig. 1f). While AvcD also interacted with the AvcI reverse complement sequence (AvcI-RC), this interaction was not as strong as AvcI (Extended Data Fig. 4a). A negative control protein, RpfR-FI15 (Fig. 1f), did not interact with AvcI. Native gels were used for the binding reactions, which results in different migration between AvcI and AvcI-RC; however, the sizes of AvcI and AvcI-RC were identical as determined using denaturing polyacrylamide gel electrophoresis (PAGE) (Extended Data Fig. 4b). This result is consistent with the formation of a distinct three-dimensional RNA structure by AvcI but not AvcI-RC (Fig. 1f and Extended Data Fig. 4a). Together, we conclude that AvcI RNA interacts with AvcD to suppress AvcD-dependent cell filamentation, although the RNA-binding specificity parameters of AvcD require further analysis.
Conservation of AvcID activity in bacteria.
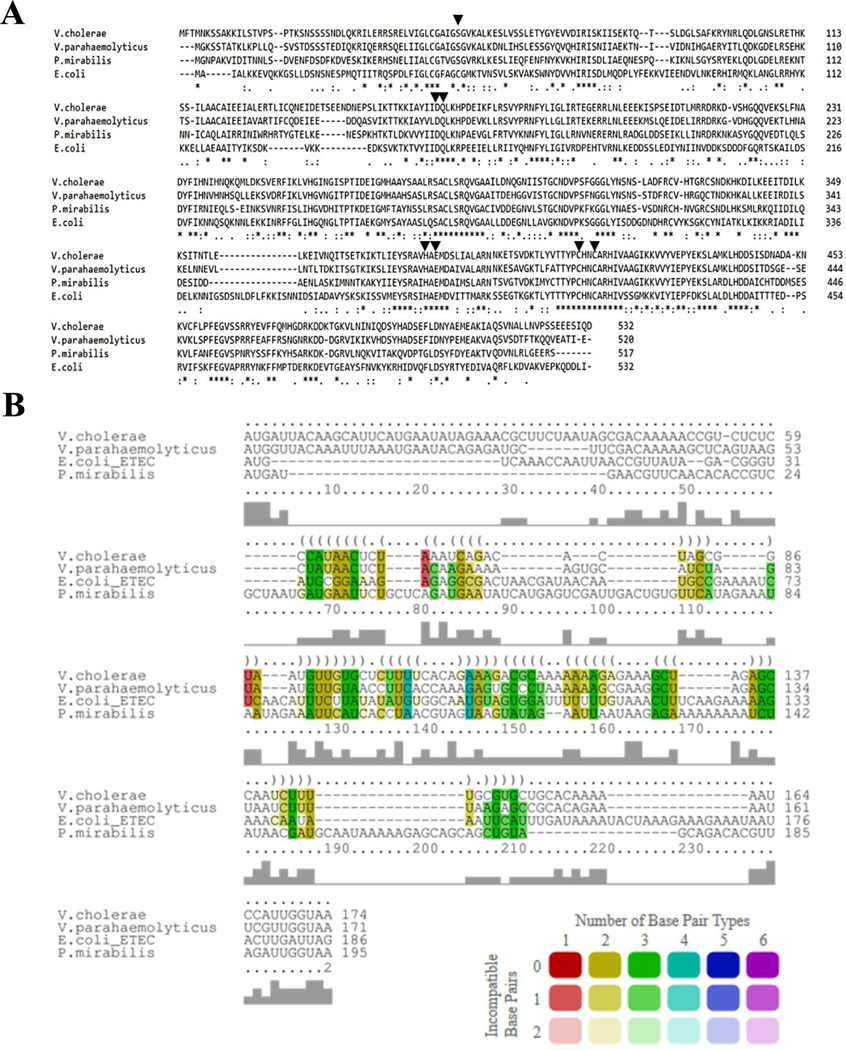
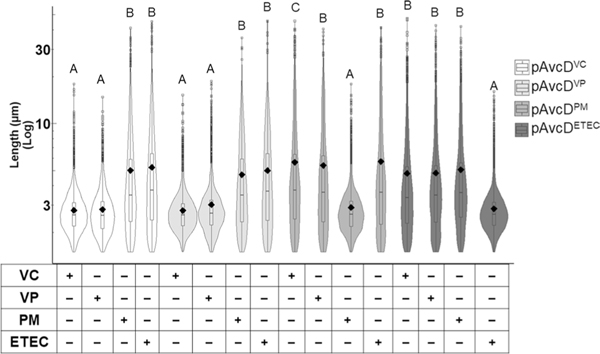
To determine if AvcD activity and its regulation by AvcI are conserved, we evaluated the activity of three proteobacterial AvcD homologues from Vibrio parahaemolyticus, Proteus mirabilis and Escherichia coli ETEC (Extended Data Fig. 5). In common with V. cholerae avcD, all three avcD homologues induced filamentation upon over-expression in E. coli (Fig. 1g). Although there was little nucleotide sequence similarity in the sequences present 5′ of each avcD homologue (Extended Data Fig. 5b), we hypothesized that these sequences might encode avcI functional homologues. We found that co-expression of each avcI homologue with its corresponding avcD partner did indeed suppress cell filamentation in E. coli. (Fig. 1g). To further identify the functional conservation of the homologues, we co-expressed each species avcD with each species avcI in E. coli and found that cross-species inhibition of AvcD homologues occurs only between V. cholerae and V. parahaemolyticus, while AvcI from P. mirabilis and ETEC only inhibited the activity of their native AvcD partner (Fig. 1h and Extended Data Fig. 6). These data demonstrated that, although each AvcI can inhibit its cognate AvcD activity, the specific molecular interactions that mediate this process are not conserved across genus boundaries.
AvcD is widely conserved and has two distinct domains.
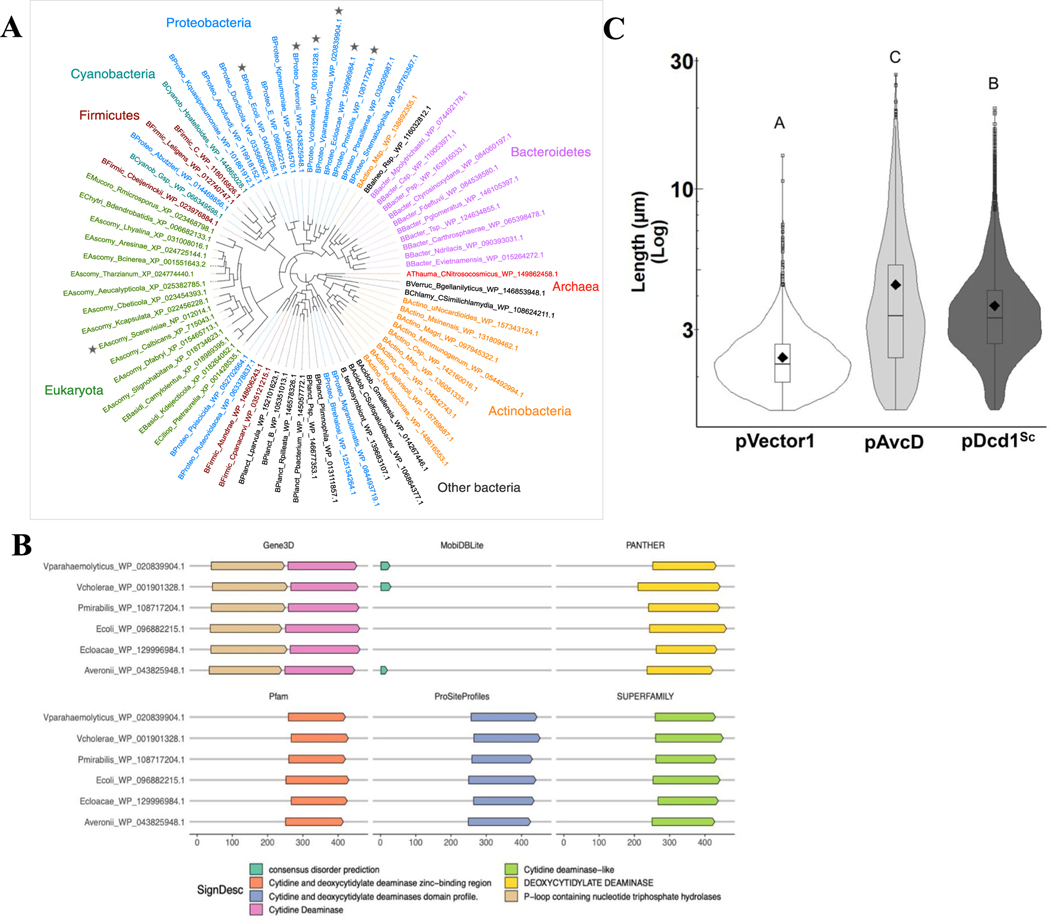
Using a selection of proteobacteria AvcD homologues as starting points, we performed a homology search across the tree of life (Methods) to determine the breadth of AvcD’s phylogenetic distribution. This analysis revealed a conserved two-domain AvcD core architecture consisting of an N-terminal P-loop NTPase (PLN)16 and a C-terminal DCD with homologues found in all three domains of life (Extended Data Fig. 7a,b and Supplementary Table 4). In support of functional homology among distant avcD homologues, expression of avcD from the eukaryotic Saccharomyces cerevisiae17 dcd1 (~30% similarity) also resulted in filamentation in E. coli cells (Extended Data Fig. 7c).
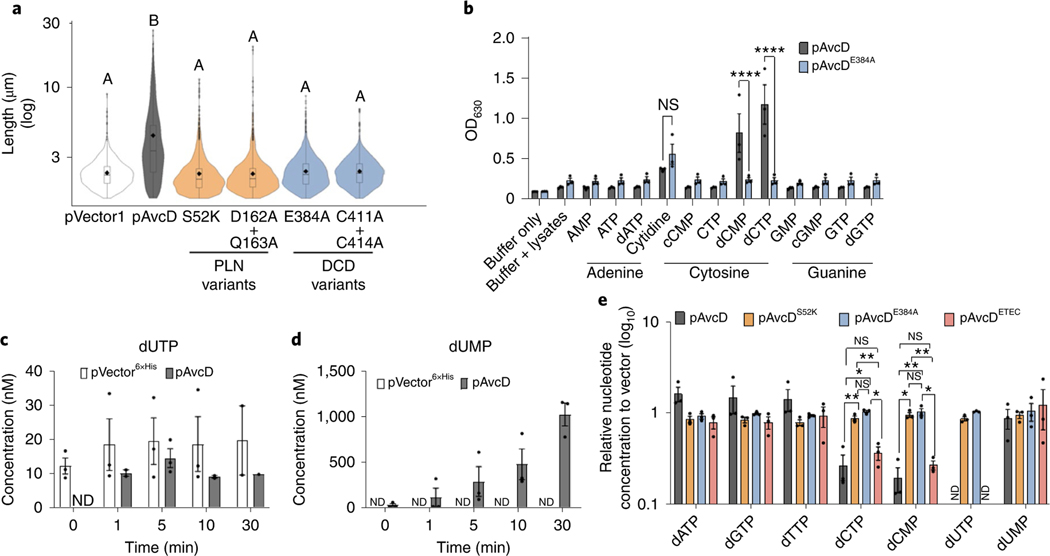
Inspection of a Phyre2 (ref. 18) model of V. cholerae AvcD (Extended Data Fig. 8a) revealed conserved catalytic residues in the PLN16 probably involved in performing a phosphotransfer reaction with nucleotide substrates and a zinc-dependent CDA active-site motif19 ([HAE]X28[PCXXC]) in the DCD domain. Ectopic expression of AvcD active site variants, in either the PLN (S52K and D162A + Q163A) or DCD domain (E384A and C411A + C414A), failed to induce E. coli filamentation (Fig. 2a), despite being abundantly expressed (Extended Data Fig. 8b), indicating that the catalytic activities originating from both the PLN and DCD domains are required for AvcD-induced filamentation.
Fig. 2 |. AvcD is a DCD.
a, Cell length distributions of E. coli expressing pAvcD, Ptac-inducible plasmids encoding a variety of AvcD active-site variants, or pVector1. The violin plot represents ~1,700–3,000 cells measured per strain (n = 3 biological samples), and different letters indicate significant differences at P < 0.05, according to two-way ANOVA with Tukey’s multiple comparison post-hoc test. b, Colorimetric assay detecting the evolution of ammonium from lysates of E. coli, previously expressing pAvcD or pAvcDE384A, incubated with 12 amine-containing nucleotide substrates (37.7 mM cytidine and 7.5 mM for all other substrates) for 30 min. Data represent the mean ± s.e.m., n = 3, two-way ANOVA Šídák’s multiple-comparison test. NS, not significant. P values for dCTP and dCMP: WT versus E384A, <0.0001. c,d, Quantification of dUTP (c) and dUMP (d) using UPLC–MS/MS, in the indicated cell lysates before and after addition of 1 μM dCTP. Each bar represents mean ± s.e.m., n = 3. e, In vivo nucleotide concentrations of E. coli expressing pAvcD, AvcD active-site variants (pAvcDS52K pAvcDE384A), or an AvcD homologue (pAvcDETEC) for 1 h measured by UPLC–MS/MS and normalized to a vector control strain. Data are graphed as mean ± s.e.m., n = 3, two-way ANOVA with Tukey’s multiple-comparison test. P values for dCTP: WT versus S52K, 0.0083; WT versus E384A, 0.0193; S52K versus ETEC, 0.0019; E384A versus ETEC, 0.0236. P values for dCMP: WT versus S52K, 0.044; WT versus E384A, 0.0045; S52K versus ETEC, 0.0039; E384A versus ETEC, 0.049. ND, none detected; NS, not significant.
As the substrates of CDAs are primarily free nucleotides20, we hypothesized that the AvcD DCD domain would also deaminate free nucleotides. Though attempts to purify active AvcD were unsuccessful, perhaps owing to the absence of unknown cellular co-factors, we found that soluble lysates from E. coli ectopically expressing AvcD specifically deaminated exogenous dCTP and dCMP substrates only, as none of the other amine-containing nucleotides we tested was deaminated (Fig. 2b). Deamination activity was not observed in the soluble lysates of E. coli expressing the AvcDE384A CDA active site variant, providing further evidence for this function (Fig. 2b).
AvcD deaminates dCTP and dCMP to ultimately make dUMP.
The deaminated products of dCTP and dCMP are dUTP and dUMP, respectively. To understand the dynamics of AvcD deamination of dCTP, we measured the concentrations of dUTP and dUMP over time in soluble lysates from AvcD-expressing cells following the addition of 1 μM dCTP using ultraperformance liquid chromatography–tandem mass spectrometry (UPLC–MS/MS). dUTP was not detected in AvcD-expressing lysates at time 0, suggesting that AvcD affects cellular nucleotide concentrations. Although the concentration of dUTP in AvcD containing lysates peaked after 5 min and receded after 10 min (Fig. 2c), the concentration of dUMP progressively increased to a final concentration of ~1 μM (Fig. 2d). No appreciable change in either dUTP or dUMP was observed in the vector control lysates for the duration of the experiment (Fig. 2c,d). The dUMP that was formed in AvcD lysates was not modified as it had the identical predicted mass of cellular dUMP. Collectively, these lysate experiments indicate that AvcD deaminates both dCTP and dCMP substrates and cellular lysates containing AvcD ultimately funnel dCTP to dUMP, suggesting that AvcD profoundly impacts nucleotide metabolism.
We quantified the in vivo impact of AvcD activity on the intracellular concentrations of deoxynucleotide species using UPLC–MS/MS following over-expression of AvcD, AvcDS52K, AvcDE384A, the ETEC AvcD homologue (AvcDETEC) and a vector control in E. coli. While all strains contained similar levels of dATP, dGTP, dTTP and dUMP, the intracellular abundances of dCTP and dCMP were significantly reduced in E. coli expressing AvcD and AvcDETEC (Fig. 2e and Supplementary Table 5). No dUTP was found following expression of AvcD or AvcDETEC, while dUTP was detected in the vector and two AvcD variant strains (Fig. 2e). Unlike the results observed with the in vitro AvcD lysates (Fig. 2d), no difference in dUMP was observed between any of the strains when nucleotides were extracted directly from live cells (Fig. 2e). We hypothesize that this discrepancy is due to compensatory metabolic pathways active in live cells21 that are lost during the preparation of cell lysates reported in Fig. 2d. Importantly, as we describe below, natural activation of AvcD shows increased in vivo accumulation of dUMP (Figs. 3g, 4g and 5d), analogous to our results in Fig. 2d.
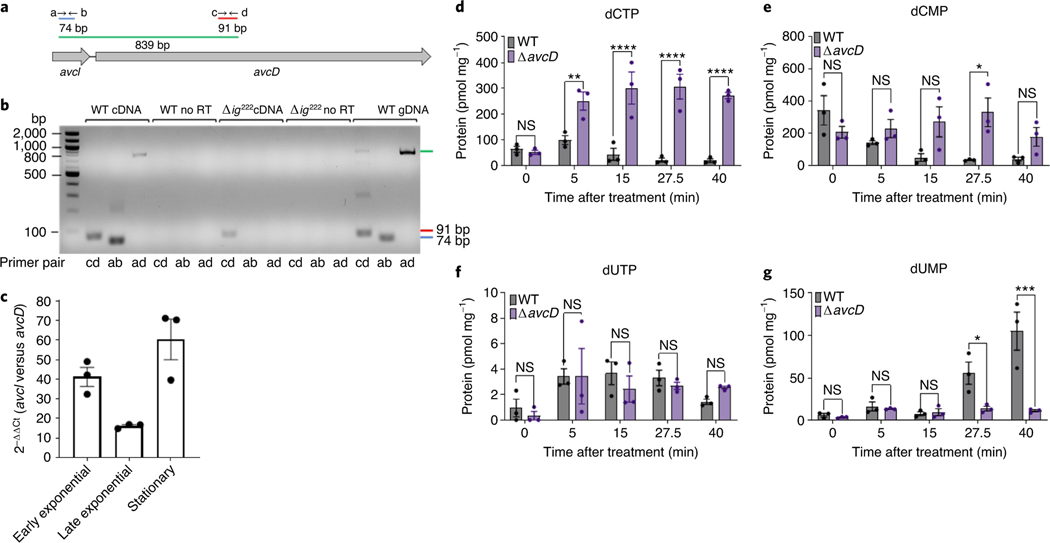
Fig. 3 |. Avci–AvcD is a toxin–antitoxin system.
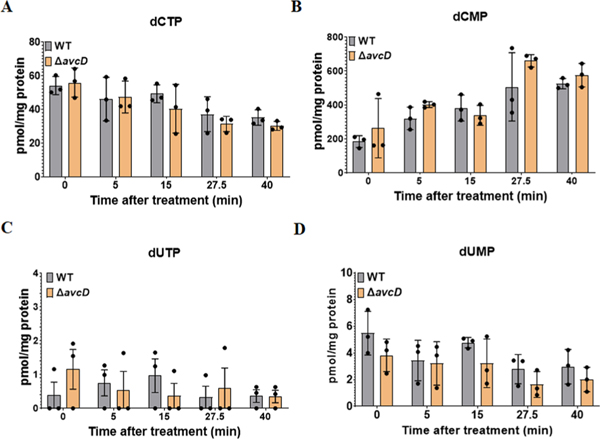
a, To-scale genomic diagram of avcI and avcD and the primers (a, b, c and d) used for generating diagnostic PCR products. b, PCR products amplified from nucleic acid templates (above) using the indicated primer pairs (below) resolved in a 1% agarose gel. All reactions were performed in duplicate using biologically independent samples with similar results. No RT, non-reverse transcribed RNA template control. gDNA, genomic DNA control. This was repeated three times, yielding similar results. c, Relative difference in transcript abundance between avcI and avcD at different growth phases in WT V. cholerae normalized to an endogenous gyrA control using qRT–PCR. Data are graphed as mean ± s.e.m., n = 3. d–g, In vivo abundance of dCTP (d), dCMP (e), dUTP (f) and dUMP (g) of WT and ΔavcD V. cholerae before and after addition of rifampicin (250 μg ml−1) measured using UPLC–MS/MS and normalized to total protein. Data represent the mean ± s.e.m. of three biological replicate cultures, two-way ANOVA with Šídák’s multiple-comparison test. NS, not significant. For dCTP, P values for WT versus ΔavcD mutant: 5 min, 0.0081; 15–40 min, <0.0001. For dCMP, P values at 27.5 min: 0.0274. For dUMP, P values at 27.5 min and 40 min: 0.0414 and 0.0001, respectively.
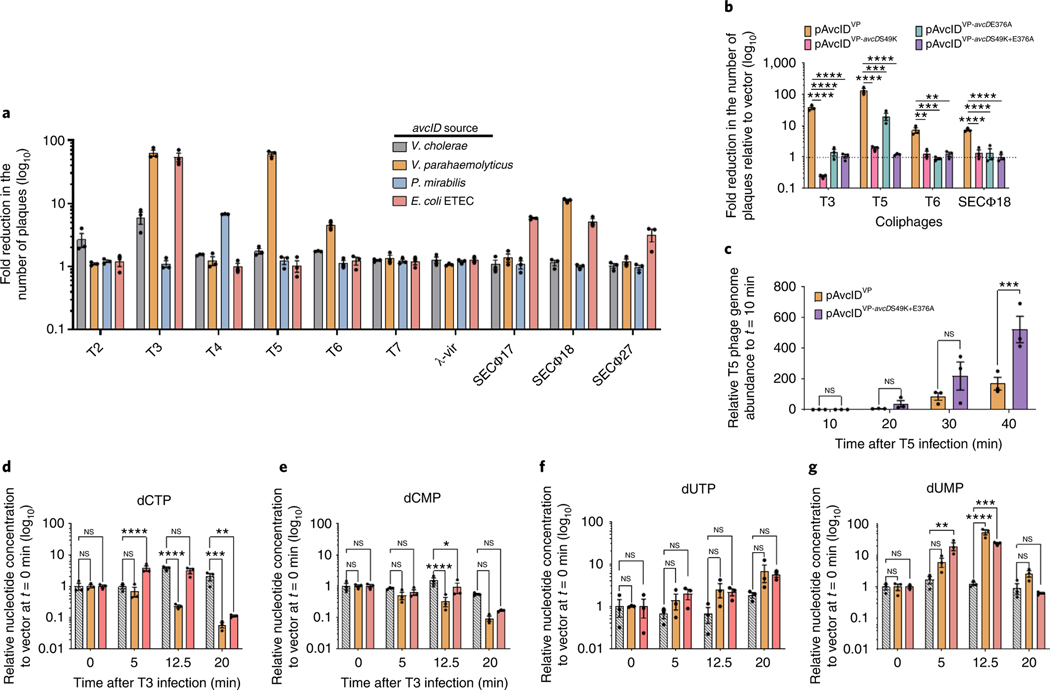
Fig. 4 |. avcID homologues provide phage defence.
a, Fold reduction in the number of plaques conferred by four homologous avcID systems to a naïve E. coli host challenged with a panel of coliphages. Fold reduction determined by serial dilution plaque assays comparing the efficiency of plaquing on an E. coli host maintaining a plasmid borne avcID system and its native promotor against a vector control strain. b, Efficiency of plaquing on strains encoding WT avcIDVP from V. parahaemolyticus (pAvcIDVP) or point mutations in the PLN (S49K), DCD (E376A) or a double domain point mutant (pAvcIDVP-avcDS49K+E376A) against a vector control strain. Data represent the mean ± s.e.m. of three biological replicate cultures, one-way ANOVA with Dunnett’s post-hoc test. P values for T3: WT versus S49K, < 0.001; WT versus E376A, <0.001; WT versus S49K + E376A, <0.001. P values for T5: WT versus S49K, <0.001; WT versus E376A, 0.0002; WT versus S49K + E376A, <0.0001. P values for T6: WT versus S49K, 0.0012; WT versus E376A, 0.0008; WT versus S49K + E376A, 0.0011. P values for SECФ18: WT versus S49K, <0.0001; WT versus E376A, <0.0001; WT versus S49K_E376A, <0.0001. c, The relative genome abundance of T5 infecting E. coli expressing pAvcIDVP or its double point mutation variants pAvcIDVP-avcDS49K+E376A. Data represent the mean ± s.e.m. of three biological replicate cultures, two-way ANOVA with two-sided Šídák’s multiple-comparison test. P values at 40 min: 0.0004. NS, not significant. d–g, In vivo abundance of dCTP (d), dCMP (e), dUTP (f) and dUMP (g) in an E. coli host carrying a vector control, pAvcIDVP or the avcID system with its native promoter from E. coli ETEC (pAvcIDETEC) before and after addition of T3 phage (MOI 5). Nucleotides measured using UPLC–MS/MS and normalized to total protein. Data represent the mean ± s.e.m. of three biological replicate cultures, two-way ANOVA with Dunnett’s post-hoc test (d–g). NS, not significant. For dCTP, P values: EV versus ETEC at 5 min, <0.0001; EV versus VP at 12.5 min, <0.0001; EV versus VP at 20 min, 0.0009; EV versus ETEC at 20 min, 0.001. For dCMP, P values: EV versus VP at 12.5 min, <0.0001; EV versus ETEC at 12.5 min, 0.0358. For dUMP, P values: EV versus ETEC at 5 min, 0.0017; EV versus VP at 12.5 min, <0.0001; EV versus ETEC at 12.5 min, 0.0001.
Fig. 5 |. AvcD mediates nucleotide pool depletion.
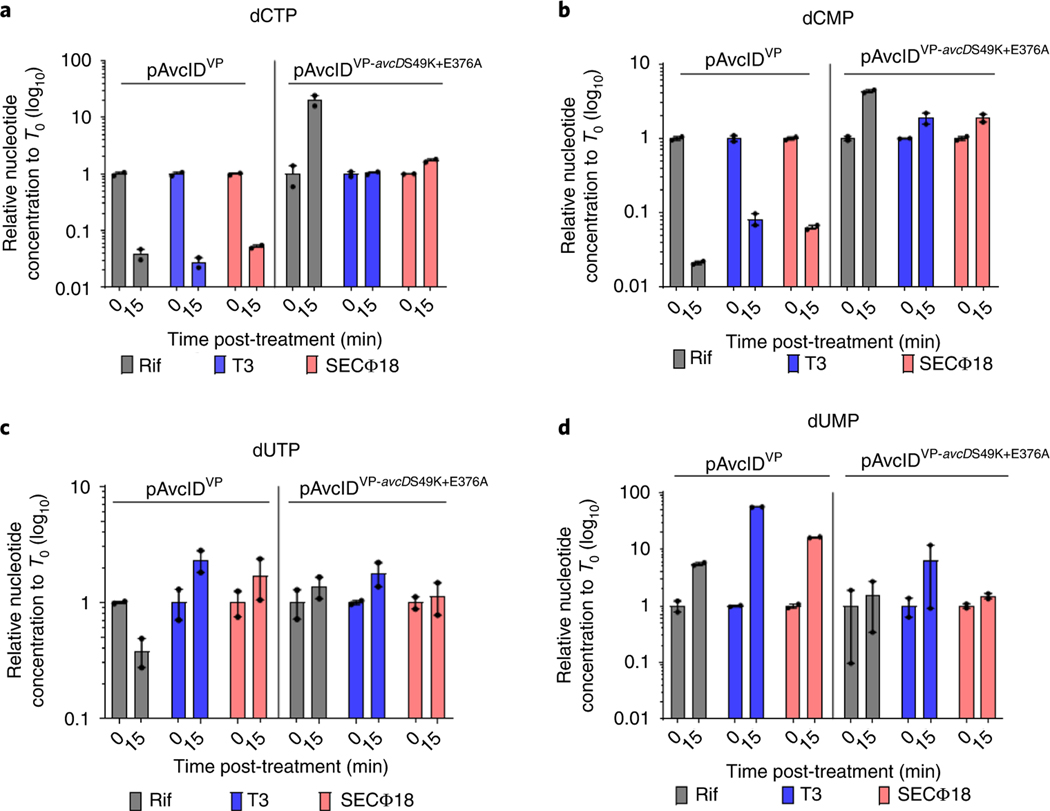
a–d, In vivo abundance of dCTP (a), dCMP (b), dUTP (c) and dUMP (d) of an E. coli host carrying vector control, the avcID system from V. parahaemolyticus with its native promoter (pAvcIDVP), or an inactive avcD mutant (pAvcIDVP-avcDS49K+E376A) before and after treatment with rifampicin or infected with phage (T3, MOI 5; SECΦ18, MOI 10). Nucleotides were measured using UPLC–MS/MS, normalized to total protein. Data represent the mean ± s.e.m. of two biological replicate cultures.
AvcD impairs genome replication.
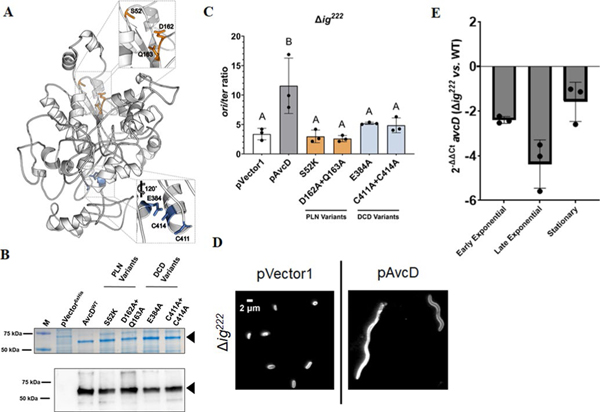
Thymineless death (TLD) is caused by thymine depletion during DNA replication resulting in replication fork instability22. E. coli cells undergoing TLD are filamentous and contain a high genomic-origin-to-terminus ratio (ori:ter). TLD-like phenotypes are also observed upon guanine depletion23. We found that a Δig222 V. cholerae mutant expressing AvcD both forms filaments (Fig. 1b) and has an approximately threefold higher ori:ter ratio than cells containing vector only (control) or avcD mutants (Extended Data Fig. 8c). While the TLD-like phenotypes associated with AvcD are probably artefacts of over-expression, they provide further evidence that active AvcD alters cellular nucleotide pools. We also found that Δig222 V. cholerae does not form filaments without ectopic AvcD expression (Extended Data Fig. 8d), probably owing to polar effects on expression of the genomic copy of avcD, which is reduced relative to WT V. cholerae (Extended Data Fig. 8e).
AvcI and AvcD resemble a toxin–antitoxin system.
To test if avcD and avcI are in an operon, we used diagnostic PCR with primers located in avcI and avcD on complementary DNAs (cDNA) produced by WT and Δig222 RNA (Fig. 3a). The presence of an 839-nt product using primers spanning avcI to avcD (‘ad’) only amplified using the WT cDNA template confirmed that both genes are present on a shared transcript (Fig. 3b). Additionally, we quantified the relative abundance of avcI and avcD RNA using qRT–PCR and found the avcI locus was at least 18-fold more abundant than avcD at all growth phases (Fig. 3c).
The co-transcription of avcI and avcD and the post-translational regulation of AvcD activity by the abundant sRNA AvcI is reminiscent of type III toxin–antitoxin (TA) systems24,25. In type III TA system toxIN, cessation of transcription depletes the abundance of the labile sRNA antitoxin ToxI, thereby liberating the ToxN endoribonuclease toxin25. We hypothesized that cessation of transcription might lead to activation of AvcD. To test this hypothesis, we treated WT and ΔavcD V. cholerae with either rifampicin or spectinomycin to block transcription or translation, respectively, and measured the intracellular abundance of dCTP, dCMP, dUTP and dUMP over time. Indeed, rifampicin treatment led to rapid and significant decreases in dCTP and dCMP and an increase in dUMP in WT V. cholerae but not the ΔavcD mutant (Fig. 3d–g). Spectinomycin did not differentially alter the abundance of these nucleotides in either strain (Extended Data Fig. 9a–d). Notably, no significant change in dUTP was observed between the strains in either condition. These data indicate that cessation of transcription, and not translation, leads to AvcD activation and demonstrate that AvcI is an sRNA antitoxin.
cGAMP does not activate the AvcID TA system.
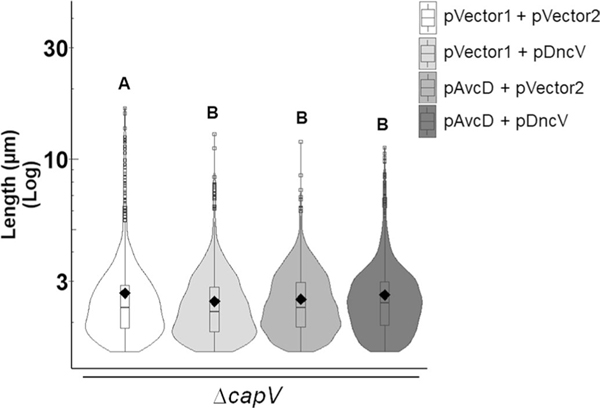
We initiated studies of avcD based on our discovery that this gene frequently co-occurs in bacterial genomes with the cGAMP synthase dncV5 (Extended Data Fig. 1a and Supplementary Table 1), a critical member of the CBASS anti-phage system9. We hypothesized that this co-occurrence was indicative of cGAMP allosteric activation of AvcD, analogous to the activation of the CBASS-effector CapV10. However, co-expression of both DncV and AvcD in ΔcapV V. cholerae, a strain that encodes avcI but can no longer induce CBASS-dependent autolysis9,10 via CapV, did not produce filamentous cells (Extended Data Fig. 10). This demonstrates that cGAMP does not activate AvcD.
AvcID is an anti-phage defence system.
CDAs are conserved anti-viral defence mechanisms in eukaryotes26–28, and several TA systems have been implicated in phage defence25,29–31. We hypothesized that avcID might constitute an anti-phage defence mechanism, and that its association with CBASS was the result of independent phage defence mechanisms clustering in mobile genetic elements to form ‘defence islands’32. To test anti-phage activity of avcID, we transformed a plasmid containing the V. cholerae, V. parahaemolyticus, P. mirabilis or ETEC avcID operon expressed from its native promoter into E. coli MG1655, which does not encode an avcID homologue, and infected this set of E. coli recombinants with a diverse panel of lytic coliphages (Supplementary Table 1). We showed that each avcID operon conferred its E. coli host with resistance to at least one of ten lytic coliphage tested (Fig. 4a). To assess whether phage defence requires the activity of the PLN, DCD or both domains of AvcD, we generated inactive variants of AvcD derived from V. parahaemolyticus (pAvcIDVP) and assessed phage defence for T3, T5 and T6, for which the WT variant demonstrated significant protection (Fig. 4a). In virtually all cases, mutation of either the PLN or DCD domain, or both, abolished AvcD-dependent protection, suggesting that both domains are necessary for phage defence (Fig. 4b). For reasons that we do not currently understand, one exception to this finding was the E376A DCD mutant exhibited substantial, but reduced, protection against T5 phage infection, suggesting that the PLN domain might have anti-phage activity on its own against certain phages. Consistent with depletion of dCTP and dCMP decreasing phage replication, T5 phage infecting E. coli containing the V. parahaemolyticus WT avcID operon (pAvcIDVP) contained fewer phage genomes relative to a strain containing a double active-site mutant allele of avcDVP (pAvcIDVP-avcDS49K+E376A) over the course of 40 min (Fig. 4c).
As the avcID operons from V. parahaemolyticus (pAvcIDVP) and E. coli ETEC (pAvcIDETEC) conferred robust protection against T3 phage, we infected E. coli maintaining these orthologous systems with T3 phage (multiplicity of infection (MOI) of 5) and measured the intracellular abundance of dCTP, dCMP, dUTP and dUMP over time. In the presence of each avcID orthologue, T3 infections significantly decreased intracellular dCTP and dCMP and increased dUMP, while the dUTP level was not changed (Fig. 4d–g).
To evaluate the dependence of changes in nucleotide levels following phage infection on the PLN and DCD domains of AvcD, E. coli carrying pAvcIDVP or the double domain active-site variant pAvcIDVP S47K+E376A were either infected with T3 or SECΦ18 or treated with a rifampicin control. In response to infection with either T3 or SECΦ18 phage, or treatment with rifampicin, pAvcIDVP depleted dCTP and dCMP while increasing dUMP (Fig. 5a,b,d). In contrast, pAvcIDVP-avcDS49K+E376A did not significantly decrease intracellular dCTP or dCMP nor increase dUMP (Fig. 5a,b,d). Consistent with earlier observations (Figs. 3f and 4f) dUTP was not significantly changed in these conditions (Fig. 5c). The interplay between the PLN and DCD domains remains unclear. We hypothesize that the PLN may function as a dNTPase that converts dUTP to dUMP after DCD deaminates dCTP/dCMP or it dephosphorylates dCTP to dCMP before the DCD domain deaminates it to dUMP. The PLN could also mediate regulation of the DCD domain.
Discussion
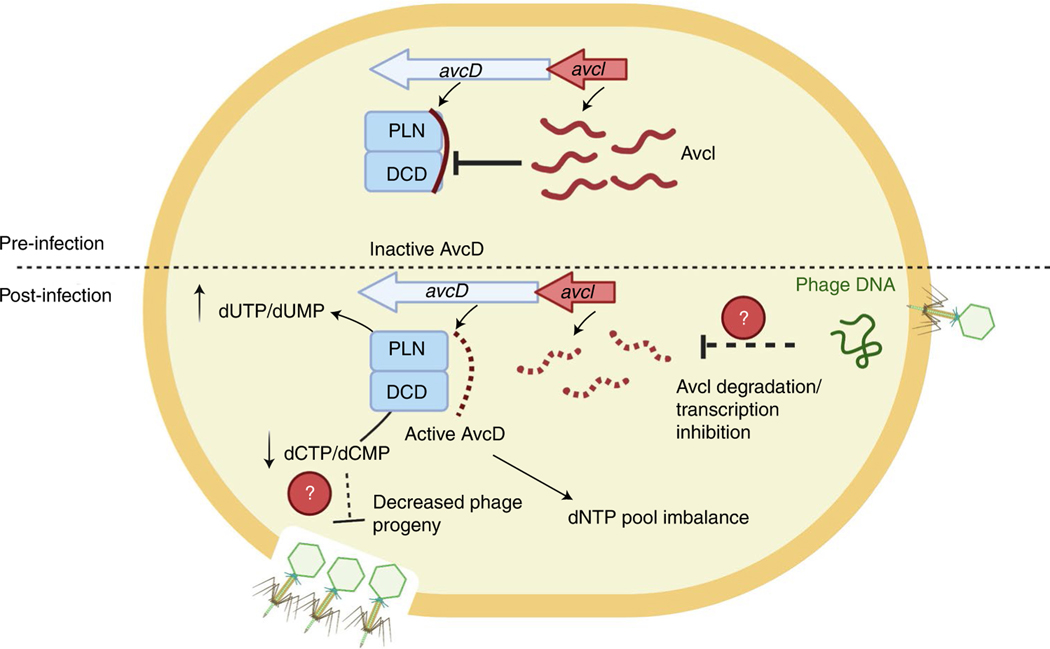
Taken together, our results suggest that AvcD depletes available dCMP and dCTP in order to protect against bacteriophage predation. We found that AvcD homologues are widely distributed across the tree of life, including in eukaryotes. Further, we found that the S. cerevisiae AvcD homologue has similar activity to AvcD in bacteria, although the requirement of the PLN and DCD domains for activity of this enzyme remains to be tested. Tal et al. independently came to many of the conclusions we describe in our report33. Finally, we hypothesize that AvcD becomes liberated from AvcI upon phage infection, either through cessation of transcription or degradation of AvcI (Fig. 6), although the molecular mechanism by which AvcD is activated remains to be formally determined.
Fig. 6 |. Model for AvciD-based anti-phage activity in bacteria.
Top: before infection, AvcD is maintained in an inactive state by the abundant sRNA, AvcI. Bottom: following infection, AvcD is liberated from AvcI, probably by the cessation of global transcription or the enhanced degradation of AvcI. Active AvcD rapidly depletes available dCMP and dCTP substrates promoting the accumulation of dUMP, via deamination, which probably impairs efficient phage DNA replication and new phage virion production.
In support of our model, inhibition of host transcription by infecting phage reduces the levels of ToxI sRNA antitoxin, activating the ToxN endonuclease to prevent phage production25. Our results suggest that AvcD-dependent depletion of dCTP and dCMP starves infecting phage of the nucleotides necessary for genome replication. However, AvcD might impact phage infection in other ways, for example by modification of cellular nucleotides such as disrupting phage transcription or by rendering newly replicated phage genomes sensitive to damage via DNA repair pathways. Purification of active AvcD would be useful in determining whether this enzyme targets other nucleotide species, such as double-stranded or single-stranded DNA or RNA. Unlike all previously described type III TA systems34, the AvcID system has a cytosine deaminase toxin and an RNA antitoxin that does not encode nucleotide repeats. Therefore, we propose that AvcID forms a distinct subclass of the type III TA family.
Exhausting deoxynucleotide pools to combat viral infection is a strategy that AvcD has in common with eukaryotic SAMHD1 (ref. 35). Additionally, AvcD shares functional similarity with the eukaryotic anti-viral APOBEC3 (ref. 36) enzymes, which do not utilize free deoxynucleotide substrates, but rather deaminate deoxycytidines in the minus-strand DNA of retroviruses, leading to viral genome instability. In a distinct way, AvcD utilizes deamination of dCTP and dCMP substrates to deplete their intracellular abundance, demonstrating that the utility of draining free deoxynucleotides is a biologically conserved anti-viral strategy.
Methods
The strains, plasmids and primers used in this study are listed in Supplementary Tables 1–3, respectively. Unless otherwise stated, cultures were grown in Luria–Bertani (LB) at 35 °C and supplemented with the following as needed: ampicillin (100 μg ml−1), kanamycin (100 μg ml−1), and isopropyl-β-d-thiogalactoside (IPTG) (100 μg ml−1). E. coli BW29427, a diaminopimelic acid auxotroph, was additionally supplemented with 300 μg ml−1 diaminopimelic acid. The V. cholerae El Tor biotype strain C6706str2 (ref. 37) was utilized in this study, and mutant strains were generated using the pKAS32 suicide vector38 using three fragments: 500 bp of sequence upstream of the gene of interest, 500 bp of sequence downstream of the gene of interest and cloned into the KpnI and SacI restriction sites of pKAS32 using by Gibson Assembly (NEB). Ptac-inducible expression vectors were constructed by Gibson Assembly with inserts amplified by PCR and pEVS143 (ref. 39) or pMMB67EH40 each linearized by EcoRI and BamHI, as well as pET28b digested with NcoI and XhoI for the C-terminal His tags. To generate the N-terminal His tag AvcD, pAvcD(4–532), avcD (corresponding to residues 4–532) was PCR amplified from pAvcD6xHis using Phusion High-Fidelity DNA Polymerase (NEB) with EWAvcDFwd and EWAvcDrev primers. Finally, In-Fusion Snap Assembly (Takara Bio) was used to integrate the purified insert into pET28b that had been linearized using the restriction enzymes NdeI and XhoI. pEVS141 (ref. 41) is used as an empty vector control for experiments using pEVS143-derived constructs. Site-directed mutagenesis was performed using the SPRINP method42. Plasmids were introduced into V. cholerae through biparental conjugation using an E. coli BW29427 donor. Transformation of E. coli for ectopic expression experiments was performed using electroporation with DH10b for expression of pEVS143- and pMMB67EH-derived plasmids. Transformation of E. coli for protein production experiments was performed using either electroporation or heat shock at with BL21(DE3) for expression with pET28b-based constructs.
GeneCoOccurrence bioinformatics analysis.
Our GeneCoOccurrence software package is built on Kim and Price’s approach43 of creating maximum related subnetworks using the co-occurrence of genes (in this case, the genes within genomic islands VSP-1 and VSP-2) to calculate genetic co-occurrence. The source code, documentation and a Docker container for this Python3 package are available at https://github.com/clinte14/GeneCoOccurrence. While VSP-1 is used to simplify the description of the method detailed below, both VSP-1 and VSP-2 were independently analysed in the same fashion. First, BLASTP was used to find homologues for each VSP-1 gene against the NCBI non-redundant protein database with an E-value cut-off of 10−4. The BLAST results were limited to bacterial genomes, and all taxa belonging to the genus Vibrio were removed to avoid bias from closely related vertical inheritance. The BLAST results were used to generate a presence or absence matrix of VSP-1 homologues with all species along one axis and VSP-1 genes along the other axis. Next, a pairwise Pearson correlation value was calculated between all VSP-1 genes i and j using binary data from the above-mentioned presence/absence matrix:
where N is the total number of unique species returned from the BLAST search and Cij the number of species with co-occurrence of genes i and j. While a Pearson correlation is warranted for a normally distributed binary dataset, it does not account for indirect correlation. For example, if genes i and j individually associate with a third gene, a Pearson correlation will incorrectly calculate a correlation between i and j. To help correct for indirect correlation, we calculate a partial correlation wij from the Pearson rij:
where the (i, j) element of the inverse matrix of Pearson rij is Pij (ref. 43).
The partial correlation correction wij has the advantage of generating a normalized output that ranges between −1 and 1. For example, a wijwij of −1 reveals that genes i and j never co-occur in the same species, while a value of 1 demonstrates that genes i and j always co-occur in the same species. A wij of 0 is the amount of co-occurrence expected between unrelated genes i and j drawn from a normal distribution. Using the above-mentioned approach, a partial correlation value wij was calculated for all genes i to j in VSP-1 and VSP-2 (Supplemental Tables 1 and 2). The single highest wij value for each VSP-1 gene was represented as an edge (that is, line) in our visualization (S1A and S1B). Any set of genes that contains no further edges was assigned to a unique maximum related subnetwork that suggests functional association of the gene products within a unique gene network.
Genomic identification, structural, and sequence analyses of AvcD and AvcI homologues.
AvcD from V. cholerae El Tor N16961 (WP_001901328.1) was identified as locus tag vc0175. AvcD and homologues profiles are performed using translated BLAST tblastn and run against the nucleotide collection (nr/nt) in the NCBI database, using >40% similarity cutoff. For previously annotated domains, the Pfam feature in KEGG44 was utilized to determine AvcD homologues. Out of all the AvcD homologues, AvcD homologues from Vibrio parahaemolyticus O1: Kuk str. FDA_R31 (ref. 45) (WP_020839904.1), Proteus mirabilis AR_379 (ref. 46) (WP_108717204.1) and E. coli O78:H11 H10407 (ref. 47) (ETEC) (WP_096882215.1) were analysed in this study. Genomic contextual information from prokaryotic gene neighbourhoods was retrieved from NCBI genome graphics feature to uncover avcI-like genes encoded as a hypothetical ORF 5′ of the avcD locus. If unannotated, the ORFinder feature from NCBI was used to determine the location and size of the putative avcI locus. To predict the structure of AvcD from V. cholerae, the amino acid sequence was submitted to Phyre2 (ref. 18) and structural visualization was performed using PyMol (https://pymol.org). The amino acid and nucleotide alignments were analysed using ClustalW Omega from EMBL-EBI web services48 and LocARNA49, respectively.
Identification and characterization of protein homologues.
All our molecular evolution and phylogenetic analyses for protein characterization were done using the MolEvolvR webapp: http://jravilab.org/molevolvr50.
Homology searches.
To ensure the identification of a comprehensive set of homologues (close and remote), we started with six representative proteobacterial AvcD proteins from V. cholerae, V. parahaemolyticus, P. mirabilis and E. coli ETEC described above along with E. cloacae (WP_129996984.1) and A. veronii (WP_043825948.1), and performed homologue searches using DELTABLAST against all sequenced genomes across the tree of life in the NCBI RefSeq database. Homology searches were conducted for each protein, and the search results were aggregated; the number of homologues per species and of genomes carrying each of the query proteins was recorded. These proteins were clustered into orthologous families using the similarity-based clustering program BLASTCLUST.
Characterizing homologous proteins.
Phyre2, InterProScan, HHPred, SignalP, TMHMM, Phobius, Pfam and custom profile databases were used to identify signal peptides, transmembrane regions, known domains and secondary structures of proteins in every genome. Custom scripts were written to consolidate the results in RStudio, and the domain architectures and protein function predictions were visualized using the MolEvolvR web application (https://jravilab.github.io/phage_defense_avcd/).
Phylogenetic analysis (MSA and Tree).
Thousands of homologues from all six starting points for AvcD proteins were consolidated and representatives were chosen from distinct lineages and genera, containing both the N- and C-terminal AvcD domains (PLN and DCD domains). Multiple sequence alignment (MSA) of the identified homologues was performed using Kalign51 and MUSCLE52 (msa R package53). The phylogenetic trees were constructed using FastTree54, FigTree55 and the R package ape56.
Growth curve assays.
Overnight cultures were diluted 1:1,000 into LB supplemented with antibiotics and IPTG in a 96-well microplate (Costar). Growth was monitored by measuring OD600 every 15 min for 15 h using a BioTek plate reader with continuous, linear shaking.
Fluorescence microscopy and analysis.
Cells were imaged as previously described57. Briefly, overnight cultures were diluted 1:1,000 into LB supplemented with antibiotics and IPTG. Cultures were grown and induced for 7–8 h, at which point cells were diluted to an OD600 of 0.5 in 1× PBS, then membrane stain FM4–64 dye (Thermo Fisher Scientific) was added to a final concentration of 20 μg ml−1. Then, 1% agarose pads in de-ionized water were cut into squares of approximately 20 × 20 mm and placed on microscope slides, and 2 μl of diluted cultures was spotted onto a glass coverslip, then gently placed onto the agarose pad. FM4–64 signal was visualized using a Leica DM5000b epifluorescence microscope with a 100×-brightfield objective under RFP fluorescence channel. Images were captured using a Spot Pursuit CCD camera and an X-cite 120 Illumination system. Each slide was imaged with at least 20 fields of view for each biological replicate. Cell lengths were processed using the Fiji plugin MicrobeJ58, and data were visualized and analysed using R by quantifying the length of the curvilinear (medial) axis of detected cells.
RNA isolation, qRT–PCR and co-transcription analysis.
Triplicate overnight cultures were subcultured 1:1,000 in 10 ml LB and grown to three different OD600:0.2 (early exponential), 1.0 (late exponential) and 2.5 (stationary). Then, 1 ml of each replicate was pelleted, and RNA was extracted using TRIzol reagent following the manufacturer’s directions (Thermo Fisher Scientific). RNA quality and quantity were determined using a NanoDrop spectrophotometer (Thermo Fisher Scientific). Then, 5 μg of purified RNA was treated with DNase (Turbo DNase, Thermo Fisher Scientific). cDNA synthesis was carried out using SuperScript III Reverse Transcriptase (Thermo Fisher Scientific). cDNA was diluted 1:64 into molecular-biology-grade water, and amplification was quantified using 2× SYBR Green (Applied Biosystems). For measuring gene expression or determining ori:ter ratios, 25 μl reactions consisted of 5 μl each of 0.625 μM primers 1 and 2, 12.5 μl of 2× SYBR master mix, and 2.5 μl of template (0.78 ng μl−1 cDNA for gene expression and 0.25 ng μl−1 V. cholerae genomic DNA for ori:ter59). qRT–PCR reactions were performed in technical duplicates for biological triplicate samples and included no reverse transcriptase reaction controls (‘no RT’) to monitor for contaminating genomic DNA in purified RNA samples. qRT–PCR reaction thermo profile was 95 °C for 20 s, then 40 cycles of 95 °C for 2 s and 60 °C for 30 s in the QuantStudio 3 Real-Time PCR system (Applied Biosystems). The gyrA gene was used as an endogenous control to calculate relative quantification (ΔCt).
To determine the co-transcription of avcI and avcD, PCR amplification was performed in 25 μl volumes using Q5 polymerase (NEB), 0.5 μM each of the forward and reverse primers as indicated, 0.2 mM dNTPs, and 3.5 μl of cDNA or no RT control templates (0.78 ng μl−1) from RNA purified from WT and Δig222 V. cholerae grown to late exponential phase in biological triplicate. The thermal profile was 98 °C for 30 s, 30 cycles of 98 °C for 10 s, 55 °C for 30 s, 72 °C for 10 s and one cycle of 72 °C for 2 min. PCR products were loaded on a 1% agarose gel and stained with EZ-Vision (VWR). Images were taken using the GelDoc system (Bio-Rad).
Protein purification.
pAvcD(4–532) was transformed via heat shock at 42 °C into E. coli strain BL21(DE3) and grown at 37 °C and 200 RPM to OD600 0.8–0.9 in LB medium containing 30 μM kanamycin. The medium was then supplemented with 100 μM ZnCl2, and AvcD expression was induced with 500 μM IPTG. Following induction, the cells were grown overnight at 18 °C and 200 RPM. The cells were then pelleted at 7,000g for 15 min. Cell pellets were resuspended in Buffer A (500 mM NaCl, 50 mM HEPES pH 7.5, 40 mM imidazole pH 7.5, 1 μg μl−1 DNAse and 1 mM phenylmethanesulfonyl fluoride) and lysed by two passages through a French press at approximately 25,000 pounds per square inch. Lysate was clarified at 35,000g at 4 °C for 45 min. The clarified lysate was passed over His60 superflow Ni resin (Takara Bio), and the protein-bound resin was washed with Buffer B (500 mM NaCl, 50 mM HEPES pH 7.5 and 70 mM imidazole pH 7.5). The resin was then resuspended in Buffer C (500 mM NaCl, 50 mM HEPES pH 7.5 and 40 mM imidazole pH 7.5), and the slurry was nutated overnight at 4 °C in the presence of 3.2 μg ml−1 thrombin (BioPharm Laboratories, LLC). Following overnight incubation, the resin was repacked into a column and eluted by gravity. SDS–PAGE of the eluate revealed that overnight digestion at 4 °C resulted in complete cleavage of AvcD from the His6 affinity tag. Following thrombin digestion, AvcD (residues 4–532) contained two heterologous N-terminal residues (Gly–Ser) derived from the thrombin cleavage sequence. To remove the majority of thrombin, the digested AvcD fraction was combined with p-aminobenzamidine-agarose (Millipore-Sigma) and nutated for 30 min at 4 °C. The protein–resin mixture was then repacked into a column, and AvcD was eluted by gravity. To inactivate residual thrombin, benzamidine was then added to the eluted AvcD to a final concentration of 50 mM. AvcD was then concentrated using a 10 kDa cut-off Vivaspin concentrator (Sartorius). The concentrated AvcD was loaded onto a Superdex 200 16/70 column (GE Healthcare) equilibrated in Buffer D (100 mM NaCl, 20 mM HEPES pH 7.5 and 1 mM tris (2-carboxyethyl) phosphine (TCEP)). S200 peak fractions were analysed by SDS–PAGE to assess purity. The purest AvcD-containing fractions were combined and concentrated using a 10 kDa cut-off Vivaspin concentrator to approximately 4.38 mg ml−1 (as evaluated using the Bradford method).
RNA synthesis and purification.
The method for RNA production was modified from previously described60. The AvcI DNA template for in vitro transcription was PCR amplified from pAvcI using Q5 High-Fidelity DNA Polymerase (NEB) and the oligonucleotide pair EJW002 and EJW003. To incorporate the T7 promoter into the final AvcI DNA template, forward primer, EJW002, included the T7 promoter sequence before the homologous sequence for AvcI. Additionally, the first two residues of the reverse primer, EJW003, were 2′-OMe modified to reduce 3′-end heterogeneity of the transcript61. The PCR reaction was analysed using a 1% agarose gel, and the band corresponding to the AvcI DNA template was excised and gel purified. AvcI RNA was synthesized by in vitro transcription using the T7-AvcI DNA template and the HiScribe T7 High Yield RNA Synthesis Kit (NEB). The transcription reactions were incubated at 37 °C for 4 h. Following transcription, DNase I (NEB) was added to a final concentration of 1× per reaction and incubated at 37 °C for an additional 15 min. AvcI was then purified using a guanidinium thiocyanate-phenol-chloroform extraction with Trizol® reagent (Thermo Fisher Scientific). Extracted RNA was subsequently precipitated with isopropanol. Precipitated RNA was pelleted via centrifugation and subsequently re-solubilized in RNA storage buffer (300 mM NaCl, 10 mM Tris pH 8.0 and 2 mM EDTA) for 4 h at 65 °C. Purity of product was evaluated using a denaturing 7 M urea PAGE. Individual aliquots of AvcI were flash frozen using liquid nitrogen and stored long term at −80 °C. Reverse complement AvcI was generated as described above using the oligonucleotide pair EJW016 and EJW017.
Electrophoretic mobility shift assay.
For electrophoretic mobility shift assay (EMSA), 10 μl binding reaction mixtures containing 60 μM, 30 μM, 15 μM, 7.5 μM or 3.75 μM AvcD or 357.6 μM RpfR with 0.5 μM AvcI or AvcI-RC RNA were incubated at 30 °C for 30 min in binding buffer (20 mM HEPES pH 7.5, 100 mM NaC and 1 mM TCEP). The controls contained either 60 μM AvcD, 0.5 μM AvcI or 0.5 μM AvcI-RC in Buffer D. EMSA loading buffer (40% sucrose, 10 mM Tris pH 8.0, 60 mM EDTA and 0.03% bromophenol blue) was added to each sample in a 1:1 ratio before loading 10 μl of sample onto the native 1× TBE 6% polyacrylamide gel. Native PAGE was carried out at 300 V for 40 min at 4 °C. The gel was subsequently stained with SYBR Gold (Thermo Fisher Scientific) and visualized using UV trans illumination and a 602/50 emission filter on a ChemiDoc MP Imaging System (Bio-Rad Laboratories).
Denaturing urea PAGE.
Denaturing urea PAGE of AvcI and AvcI-RC was performed using 1× TBE 8% polyacrylamide 7 M urea denaturing gels. For this, 10 μl AvcI or AvcI-RC at 0.5 μM in RNA storage buffer was mixed 1:1 with 2× RNA loading dye (NEB). Samples were heated for 5 min at 95 °C and loaded onto the gel. Denaturing PAGE was carried out at 300 V until the dye front had travelled three-quarters the length of the gel. The gel was then stained with ethidium bromide, and the RNA products were visualized using UV trans illumination and a 602/50 emission filter on a ChemiDoc MP Imaging System.
In vitro nucleic acid deamination assay.
Cell lysate preparation.
Overnight cultures were subcultured 1:333 and grown to an OD600 of ~0.5–1.0. Cultures were induced with 1 mM IPTG, supplemented with 100 μM ZnSO4 and grown for an additional 3 h. Cell pellets from 100 ml of induced cultures were collected in two successive 15 min centrifugation steps at 4,000g and 4 °C. Supernatants were decanted and pellets were flash frozen in an ethanol and dry ice bath and stored at −80 °C. Pellets were thawed on ice and suspended in 2 ml of lysis buffer E (50 mM NaPO4, pH 7.3, 300 mM NaCl, 2 mM β-mercaptoethanol, 20% glycerol and Roche cOmplete protease inhibitor (one tablet per 10 ml)). One millilitre of cell suspension was transferred to a microcentrifuge tube and sonicated on ice using a Branson 450 Digital Sonifier (20% amplitude, 20 s total, 2.5 s on, 2.5 s off). Crude lysates were centrifuged at 15,000g for 10 min at 4 °C and clarified lysates were transferred to fresh microcentrifuge tubes on ice. Clarified lysates were normalized for total protein to a concentration of 1.9 mg ml−1 as measured by Bradford reagent and a BSA standard. Then, 26.5 μl reactions composed of lysis buffer E, nucleic acid substrates and 3.5 μl of normalized clarified lysates were assembled in PCR strip tubes, mixed by gentle pipetting, and incubated at room temperature (~23 °C) for 1 h. NH4Cl solutions at the indicated concentration were dissolved in lysis buffer E and substituted for nucleic acid substrates as positive controls.
Ammonia detection.
The evolution of ammonia from the deamination of the nucleic acid substrates was observed using a phenol–hypochlorite reaction to produce indophenol in a clear 96-well microtitre plate and modified from Dong et al.62. Fifty microlitres of Reagent A (composition below) was added to each well followed by 20 μl of the completed in vitro deamination reaction described above. The phenol–hypochlorite reaction was initiated by the addition and gentle mixing of 50 μl Reagent B (composition below) to the wells. The reaction was incubated at 35 °C for 30 min and the absorbance (ABS630) was measured using a plate reader.
Reagent A = 1:1 (v/v), 6% (w/v) sodium hydroxide (Sigma) in water: 1.5% (v/v) sodium hypochlorite solution (Sigma, reagent grade) in water
Reagent B = 1:1:0.04 (v/v/v), water: 0.5% (w/v) sodium nitroprusside (Sigma) in water: phenol solution (Sigma, P4557)
Western blot.
Strains containing AvcD- and variant- C-terminal 6×-histidine fusions were grown, induced and collected as described above (‘In vitro nucleic acid deamination assay’: ‘Cell lysate preparation’), except for the His-tag fusion (pGBS98) which are induced for only 2 h with 100 μM IPTG and not subjected to sonication. The cell pellets were resuspended in 2 ml of chilled 1× PBS and subsequently normalized to OD of 1.0. One-millilitre aliquots were collected by centrifugation at 15,000g for 1 min. Cell pellets were subsequently resuspended in 90 μl of lysis buffer A and 30 μl of 4× Laemmli buffer, denatured for 10 min at 65 °C and centrifuged at 15,000g for 10 min. Five microlitres of sample was loaded into pre-cast 4–20% SDS–PAGE gels (Mini-PROTEAN TGX Precast Protein Gels, Bio-Rad) alongside size standards (Precision Protein Plus, Bio-Rad). Gels were run at room temperature for 90 min at 100 V in 1× Tris/glycine/SDS running buffer. Proteins were transferred to nitrocellulose membranes (Optitran). The membranes were blocked using 5% skim milk and incubated with 1:5,000 THE His Tag antibody, mAb, mouse (GenScript) followed by 1:4,000 goat anti-mouse IgG antibody (H&L) [HRP], pAb (GenScript), treated with Pierce ECL western blotting substrate and imaged using an Amersham Imager 600.
UPLC–MS/MS quantification of deoxynucleotides.
For measuring in vivo intracellular deoxynucleotide concentrations, overnight cultures were subcultured 1:1,000 and grown to OD600 of ~1.0. Plasmid expression was induced by the addition of 1 mM IPTG for 1 h, and 1 ml of cultures were collected by centrifugation at 15,000g for 1 min. Pellets were resuspended in 200 μl of chilled extraction buffer (acetonitrile, methanol, ultrapure water, formic acid (2:2:1:0.02, v/v/v/v)). To normalize in vivo nucleotide samples, an additional cell pellet was collected from 1 ml of culture by centrifugation at 15,000g for 1 min, resuspended in 200 μl lysis buffer F (20 mM Tris–HCl and 1% SDS, pH 6.8), and denatured for 10 min at 60 °C. Denatured lysates were centrifuged at 15,000g for 1 min to pellet cellular debris, and the supernatant was used to quantify the total protein concentration in the sample using the DC protein assay (Bio-Rad) and a BSA standard curve57. The concentrations of deoxynucleotides detected by UPLC–MS/MS were then normalized to total protein in each sample.
For the quantification of deoxynucleotides in vitro, E. coli BL21(DE3) clarified lysates were prepared as described for the deamination experiment above and normalized to 20 mg ml−1 of total protein and 200 μl of normalized clarified lysates were assembled in PCR strip tubes. To measure abundance of dUMP and dUTP before the addition of 1 μM dCTP, 20 μl of normalized clarified lysates was added to 200 μl of chilled extraction buffer. Twenty microlitres of 10 μM dCTP was then added to the remaining clarified lysate, and 20 μl lysates aliquots were removed 1, 5, 10 and 30 min after the addition of dCTP and mixed in 200 μl chilled extraction buffer.
All samples resuspended in extraction buffer, in vivo and in vitro, were immediately incubated at −20 °C for 30 min after collection and centrifuged at 15,000g for 1 min. The supernatant was transferred to a new tube, dried overnight in a speed vacuum and finally resuspended in 100 μl ultrapure water. Experimental samples and deoxynucleotides standards (1.9, 3.9, 7.8, 15.6, 31.3, 62.5 and 125 nM of dATP (Invitrogen), dGTP (Invitrogen), dTTP, (Invitrogen), dCTP (Invitrogen), dCMP (Sigma), dUTP (Sigma) and dUMP (Sigma)) were analysed by UPLC–MS/MS using an Acquity Ultra Performance LC system (Waters) coupled with a Xevo TQ-S mass spectrometer (Waters) with an ESI source in negative ion mode. The MS parameters were as follows: capillary voltage, 1.0 kV; source temperature, 150 °C; desolvation temperature, 400 °C; cone gas, 120 L h−1. Five microlitres of each sample was separated in reverse phase using Acquity UPLC Premier BEH C18, 2.1 × 100 mm, 1.7 μm particle size, VanGuard FIT at a flow rate of 0.3 ml min−1 with the following gradient of solvent A (8 mM N,N-dimethylhexylamine + 2.8 mM acetic acid in water, pH ~9) to solvent B (methanol): t = 0 min; A-100%:B-0%, t = 10 min; A-60%:B-40%, t =10.5; A-100%:B-0%, t = 15 min; A-100%:B-0% (end of gradient). The conditions of the MRM transitions were as follows (cone voltage (V), collision energy (eV)): dATP, 490 > 159 (34, 34); dCTP, 466 > 159 (34, 34); dGTP, 506 > 159 (15, 46); dTTP, 481 > 159 (25, 34); dUTP, 467 > 159 (25, 34); dCMP, 306 > 97 (43, 22); dUMP, 306 > 111 (22, 22).
In vivo dNTP quantification following termination of transcription and translation.
Overnight cultures were subcultured 1:1,000 into a pair of matched sister cultures and grown at 35 °C with aeration. Two millilitres of each sister culture was collected at time zero (OD600 ~1.0) with 1 ml for dNTP quantification and 1 ml for total protein quantification ‘UPLC–MS/MS quantification of deoxynucleotides’). Following the initial culture sampling, each sister culture was treated with either rifampicin (250 μg ml−1) to stop transcription or spectinomycin (200 μg ml−1) to stop translation. Following the initial antibiotic treatments, cultures were sampled for both dNTP and total protein quantifications for the duration of the experiment at indicated timepoints.
Phage infection and plaque assays.
Coliphages were propagated on E. coli MG1655 in LB, and their titre was determined using the small drop plaque assay method, as previously described9. Briefly, 1 ml of overnight cultures was mixed with 50 ml of MMB agar (LB + 0.1 mM MnCl2 + 5 mM MgCl2 + 5 mM CaCl2 + 0.5% agar), and tenfold serial dilutions of phages in MMB were dropped on top of them and incubated overnight at room temperature. The viral titre is expressed as plaque-forming units per ml (PFU ml−1).
E. coli MG1655 cells transformed with empty vector (pBRP15) and each associated pAvcI-AvcD plasmid were grown in LB overnight at 37 °C. Overnight cultures are subcultured 1:1,000 in melted MMB agar and let to solidify at room temperature. Tenfold serial dilutions of coliphages in MMB medium were dropped on top of them and incubated overnight at room temperature. Efficiency of plaquing was determined for each coliphage by comparing the PFUs on each of the AvcI-AvcD-containing strains with the control pBRP15 containing strain.
To measure the nucleotides after phage infection, cells were grown in LB overnight at 37 °C. Overnight cultures are subcultured 1:1,000 in LB and grown to OD600 of ~0.3. Three millilitres of culture was collected for a time zero reading: 1.5 ml for dNTP quantification and 1.5 ml for total protein quantification (‘UPLC–MS/MS quantification of deoxynucleotides’). The cultures are then infected with phage (T3, MOI of 5; SECϕ18, MOI of 10), and additional 3 ml was removed at each indicated subsequent timepoint.
DNA replication assay.
Overnight cultures were subcultured 1:100 in LB at 35 °C and grown to OD600 of ~0.3. The cultures were then infected with T5 phage at the final MOI of 1. Then, 1.5 ml of culture was collected at 10, 20, 30 and 40 min post-infection. Culture aliquots were centrifuged at 15,000g for 1 min, and the pellets were flash frozen in a dry ice–ethanol slurry. DNA was extracted using Wizard Genomic DNA Purification Kit (Promega), using the Gram-negative bacteria protocol and purified DNA from each sample was uniformly resuspended in 50 μl of DNA dehydration solution. DNA quality and quantity were determined using a NanoDrop spectrophotometer (Thermo Fisher Scientific). Primers targeting the T5 phage-tail fibre (ORF124) were used to quantify the abundance of T5 phage genome in each sample with qPCR as described above (‘RNA isolation, qRT–PCR and co-transcription analysis’). The relative abundance of T5 genomes was calculated using the difference of Ct between 10 min and each subsequent timepoint (2(−ΔCt)) for each strain.
Statistical analysis.
As specified in the figure legends, all of the statistical analyses for the violin plots were performed with R statistical computing software, while other data were analysed in GraphPad Prism Software. Statistical significance was denoted as follows: a single asterisk (*) indicates P < 0.05; double asterisks (**) indicate P < 0.01; triple asterisks (***) indicate P < 0.001; and quadruple asterisks (****) indicate P < 0.0001. Mean ± standard error of the mean (s.e.m.) and specific n values are reported in each figure legend.
Reporting summary.
Further information on research design is available in the Nature Research Reporting Summary linked to this article.
Extended Data
Extended Data Fig. 1 |. VSP-1 and VSP-2 schematic and predicted gene networks (MRS).
Cartoon of VSP-1 (A) and VSP-2 (B) from El Tor V. cholerae N16961 and gene network predictions from GeneCoOccurrence. Arrows indicate the highest partial correlation Wij each gene has to another (ovals). Two arrows are presented pointing in opposing directions where the highest correlation Wij is reciprocal between two genes. MRS = maximum relatedness subnetwork.
Extended Data Fig. 2 |. Complementation of various ig222 constructs to prevent AvcD induced cell filamentation.
Cell length distributions of Δig222 V. cholerae expressing pAvcD. All cell length distributions represent ~750–1000 cells measured per strain (n = 3 biological samples), with summary statistics: mean (diamonds), median (horizontal black line), interquartile range (box), and data below and above the interquartile range (vertical lines). Different letters indicate significant differences at p < 0.05, according to Two-way ANOVA with Tukey’s multiple comparison post-hoc test.
Extended Data Fig. 3 |. AvcD C-terminal 6x Histidine fusion maintains the same activity as the WT AvcD enzyme and the presence of avcI does not reduce the abundance of AvcD.
(A) Representative images of WT V. cholerae and Δig222 cultures maintaining an empty vector plasmid (pVector1) or Ptac-inducible avcD-6xHIS plasmid (pAvcD6xHis) grown in the presence of 100 μM IPTG for 2 h. Cells were stained with FM4–64 prior to imaging and performed in biological triplicate. (B) Representative coomassie stained PAGE gel (top) and matched anti-6x His antibody Western blot (bottom) of whole cell lysates normalized to total protein from V. cholerae WT and Δig222 cultures maintaining pVector1 or pAvcD6xHis. Black triangles correspond to AvcD6xHis (60.6 kDa). Analysis was performed in biological triplicate and the relative signal intensity (C) was the determined by comparing the intensities of AvcD6xHis from paired WT and Δig222 lysates probed on the same blots. Data represent the mean ± SEM of three biological replicate. Statistical significance was determined using two-sided Student’s t-test. P values between WT and Δig222 is 0.185. ns indicate not significant.
Extended Data Fig. 4 |. AvcD-Avci complex formation in solution and Denaturing urea PAGE analysis of Avci and Avci-RC.
(A) AvcD forms a complex with AvcI in an AvcD concentration-dependent manner as determined by EMSA. Trace quantities of AvcI reverse complement (AvcI-RC) binding to AvcD is observed. (B) AvcI and AvcI-RC run at essentially equivalent molecular weights on a 7 M urea denaturing PAGE. Low range ssRNA ladder (NEB). This was performed at least three times, yielding similar results.
Extended Data Fig. 5 |. multiple sequence alignment of AvcD homologs and Avci homologs explored in this study.
(A) Amino acid alignment of the V. cholerae AvcD and three homologs using EMBL-EBI ClustalW48. ‘*’ indicates 100% identity, ‘:’ indicates >75%, and ‘.’ Indicates >50% similarity. Black triangles indicate conserved residues in V. cholerae AvcD targeted for site-directed mutagenesis. (B) Nucleotide alignment of V. cholerae AvcI and three homologs using LocARNA49. The average secondary structure is indicated in dot-bracket notation (top). Consensus identities are correlated with the height of the bars below the corresponding nucleotide. Compatible base pairs are colored according to the number of different types C-G (1), G-C (2), A-U (3), U-A (4), G-U (5) or U-G (6) of compatible base pairs in the corresponding columns. The color saturation decreases with the number of incompatible base pairs.
Extended Data Fig. 6 |. Cross-species inhibition of avcD and avcI homologs.
Cell length distributions of E. coli co-expressing various combinations of Ptac-inducible plasmids encoding homologs of avcD and avcI. All cell length distributions represent ~1000–3000 cells measured per strain (n = 3 biological samples), with summary statistics: mean (diamonds), median (horizontal black line), interquartile range (box), and data below and above the interquartile range (vertical lines). Different letters indicate significant differences at p < 0.05, according to Two-way ANOVA with Tukey’s post-hoc test. VC = Vibrio cholerae, VP = Vibrio parahaemolyticus, PM = Proteus mirabilis, ETEC = E. coli ETEC.
Extended Data Fig. 7 |. Phylogenetic analysis and domain architectures of the six AvcD query proteins.
(A) Phylogenetic tree of AvcD homologs from representative phyla across the tree of life. Stars indicate the six proteobacterial starting points for the homology search, as well as the eukaryotic Saccharomyces cerevisiae dcd1 (triangle). (B) Domain architecture and secondary structure predictions for the six proteobacterial starting points (query proteins) were predicted using InterProScan (Methods). Results from six main analyses are shown here for the query proteins: Gene3D (including CATH structure database), Pfam, ProSiteProfiles, PANTHER, and SUPERFAMILY protein domain profile databases, and MobiDBLite for disorder prediction. No transmembrane regions (using TMHMM) or membrane/extracellular localization were predicted for any of the proteins (using Phobius); hence not shown. Numbers (bottom) indicate the amino acid position of predicted domains and features. (C) Cell length distributions of E. coli expressing pAvcD, a Ptac-inducible plasmid encoding dcd1 from S. cerevisiae (pDcd1Sc), or pVector1. All cell length distributions represent ~1000–3000 cells measured per strain (n = 3 biological samples), with summary statistics: mean (diamonds), median (horizontal black line), interquartile range (box), and data below and above the interquartile range (vertical lines). Different letters indicate significant differences at p < 0.05, according to Two-way ANOVA with Tukey’s post-hoc test.
Extended Data Fig. 8 |. Mutations in conserved residues of AvcD do not affect the stability or function of the protein.
(A) Phyre2 (ref. 18) predicted structure of AvcD from V. cholerae El Tor. Insets highlight conserved residues of the PLN (top) and DCD (bottom) domains selected for mutagenesis. (B) Representative Coomassie stained gel (top) and anti-6x His antibody Western blot (bottom) of whole cell lysates from E. coli BL21(DE3) cells maintaining an empty vector (pVector6xHis), inducible C-terminal 6x histidine tagged avcD (WT) or avcD variants (S52K, D162A + Q163A, E384A, and C411A + C414A) grown in the presence of 1 mM IPTG for 3 h. Sample inputs were normalized by culture OD600 and resolved by SDS-PAGE. Three biological replicates of each strain were analyzed with similar results. Black triangles correspond to the predicted molecular weight of the AvcD tagged fusions (60.6 kDa). M = molecular weight marker. (C) V. cholerae mutant expressing the indicated AvcD variants. ori/ter ratios of Chromosome 1 in Δig222 V. cholerae strains expressing the indicated pAvcD construct and quantified using qRT-PCR. Each bar represents the mean ± SEM, n=3. Different letters indicate significant differences (n=3) at p < 0.05, according to Two-way ANOVA with Tukey’s post-hoc test. (D) Representative images of Δig222 cultures maintaining an empty vector plasmid pVector 1 or pAvcD grown in the presence of 100 μM IPTG for 8 h. Cells were stained with FM4–64 prior to imaging and performed in biological triplicate. (E) Relative difference in avcD expression between Δig222 and WT V. cholerae at three different growth phases using qRT-PCR and an endogenous gyrA control. Data represent the mean ± SEM of three biological replicates.
Extended Data Fig. 9 |. Cessation of global translation, by treatment with spectinomycin, does not liberate AvcD enzymatic activity.
Intracellular abundance of dCTP (A), dCMP (B), dUTP (C), and dUMP (D) of WT and ΔavcD V. cholerae during spectinomycin treatment (200 μg/mL) measured by UPLC-MS/MS. Data represent the mean ± SEM of three biological replicate cultures. No statistically significant differences in nucleotide concentrations were observed between strains at any time point as determined by Two-way ANOVA with Two-way ANOVA with Šídák’s multiple-comparison test.
Extended Data Fig. 10 |. Ectopic expression of DncV and AvcD does not lead to filamentation in the ΔcapV mutant of V. cholerae.
Cell length distributions measured from three biological replicates of ΔcapV V. cholerae cultures co-expressing either two empty vectors, pDncV and an empty vector, pAvcD and an empty vector, or pDncV and pAvcD grown in the presence of 100 μM IPTG for 8 h. Distributions represent ~1200–1700 cells measured per strain (n=3 biological samples). Different letters indicate significant differences at p < 0.05, according to Two-way ANOVA with Tukey’s post-hoc test.
Supplementary Material
Acknowledgements
We thank S. Manning (STEC Center, Michigan State University), J. Jones (US FDA), A. Brown (US CDC) and M. Hao Kuo (Michigan State University) for providing us with E. coli ETEC, P. mirabilis, V. parahaemolyticus and S. cerevisiae strains, respectively, and M. Laub (Massachusetts Institute of Technology) for providing us with coliphages. We thank K. Yu and D. Pyeon for valuable suggestions and D. Jones and L. Chen from the MSU RTSF mass spectrometry facility core for their technical support. Figure 6 was generated using software from Biorender.com. This work was supported by National Institutes of Health (NIH) grants GM109259, GM110444 and AI158433 to C.M.W. and M.B.N., GM139537 and AI143098 to C.M.W., National Science Foundation (NSF) grant DBI-0939454 to C.M.W. and E.M.T., NIH grant GM110185 and the NSF CAREER Award 1750125 to K.N.P. and NSF Graduate Research Fellowship grant no. 1842399 to C.A.E. Any opinions, findings and conclusions or recommendations expressed in this material are those of the author(s) and do not necessarily reflect the views of the National Science Foundation.
Footnotes
Competing interests
The authors declare no competing interests.
Additional information
Extended data is available for this paper at https://doi.org/10.1038/s41564-022-01162-4.
Supplementary information The online version contains supplementary material available at https://doi.org/10.1038/s41564-022-01162-4.
Peer review information Nature Microbiology thanks the anonymous reviewers for their contribution to the peer review of this work. Peer reviewer reports are available.
Data availability
Data supporting the findings of this study are available here: https://figshare.com/articles/dataset/AvcID_NatureMicrobio_Full_Datasets_zip/19746904. Source data are provided with this paper.
References
- 1.Dziejman M. et al. Comparative genomic analysis of Vibrio cholerae: genes that correlate with cholera endemic and pandemic disease. Proc. Natl Acad. Sci. USA 99, 1556–1561 (2002). [DOI] [PMC free article] [PubMed] [Google Scholar]
- 2.Hu D. et al. Origins of the current seventh cholera pandemic. Proc. Natl Acad. Sci. USA 113, E7730–E7739 (2016). [DOI] [PMC free article] [PubMed] [Google Scholar]
- 3.O’Shea YA et al. The Vibrio seventh pandemic island-II is a 26.9 kb genomic island present in Vibrio cholerae El Tor and O139 serogroup isolates that shows homology to a 43.4 kb genomic island in V. vulnificus. Microbiology 150, 4053–4063 (2004). [DOI] [PubMed] [Google Scholar]
- 4.Nusrin S. et al. Peruvian Vibrio cholerae O1 El Tor strains possess a distinct region in the Vibrio seventh pandemic island-II that differentiates them from the prototype seventh pandemic El Tor strains. J. Med. Microbiol 58, 342–354 (2009). [DOI] [PubMed] [Google Scholar]
- 5.Davies BW, Bogard RW, Young TS & Mekalanos JJ Coordinated regulation of accessory genetic elements produces cyclic di-nucleotides for V. cholerae virulence. Cell 149, 358–370 (2012). [DOI] [PMC free article] [PubMed] [Google Scholar]
- 6.Murphy SG et al. Endopeptidase regulation as a novel function of the zur-dependent zinc starvation response. MBio 10, e02620–18 (2019). [DOI] [PMC free article] [PubMed] [Google Scholar]
- 7.Jaskólska M, Adams DW & Blokesch M. Two defence systems eliminate plasmids from seventh pandemic Vibrio cholerae. Nature 604, 323–329 (2022). [DOI] [PMC free article] [PubMed] [Google Scholar]
- 8.Beyhan S, Tischler AD, Camilli A. & Yildiz FH Differences in gene expression between the classical and El Tor biotypes of Vibrio cholerae O1. Infect. Immun 74, 3633–3642 (2006). [DOI] [PMC free article] [PubMed] [Google Scholar]
- 9.Cohen D. et al. Cyclic GMP–AMP signalling protects bacteria against viral infection. Nature 574, 691–695 (2019). [DOI] [PubMed] [Google Scholar]
- 10.Severin GB et al. Direct activation of a phospholipase by cyclic GMP–AMP in El Tor Vibrio cholerae. Proc. Natl Acad. Sci. USA 115, E6048–E6055 (2018). [DOI] [PMC free article] [PubMed] [Google Scholar]
- 11.Yen M, Cairns LS & Camilli A. A cocktail of three virulent bacteriophages prevents Vibrio cholerae infection in animal models. Nat. Commun 8, 14187 (2017). [DOI] [PMC free article] [PubMed] [Google Scholar]
- 12.O’Hara BJ, Barth ZK, McKitterick AC & Seed KD A highly specific phage defense system is a conserved feature of the Vibrio cholerae mobilome. PLoS Genet. 13, e1006838 (2017). [DOI] [PMC free article] [PubMed] [Google Scholar]
- 13.Silva-Valenzuela CA & Camilli A. Niche adaptation limits bacteriophage predation of Vibrio cholerae in a nutrient-poor aquatic environment. Proc. Natl. Acad. Sci. USA 10.1073/pnas.1810138116 (2019). [DOI] [PMC free article] [PubMed]
- 14.Severin GB et al. A broadly conserved deoxycytidine deaminase protects bacteria from phage infection. bioRxiv 10.1101/2021.03.31.437871 (2021). [DOI]
- 15.Waldron EJ et al. Structural basis of DSF recognition by its receptor RpfR and its regulatory interaction with the DSF synthase RpfF. PLoS Biol. 17, e3000123 (2019). [DOI] [PMC free article] [PubMed] [Google Scholar]
- 16.Leipe DD, Koonin EV & Aravind L. Evolution and classification of P-loop kinases and related proteins. J. Mol. Biol 333, 781–815 (2003). [DOI] [PubMed] [Google Scholar]
- 17.Handee W. et al. An energy-independent pro-longevity function of triacylglycerol in yeast. PLoS Genet. 12, e1005878 (2016). [DOI] [PMC free article] [PubMed] [Google Scholar]
- 18.Kelley LA, Mezulis S, Yates CM, Wass MN & Sternberg MJE The Phyre2 web portal for protein modeling, prediction and analysis. Nat. Protoc 10, 845–858 (2015). [DOI] [PMC free article] [PubMed] [Google Scholar]
- 19.Boussardon C. et al. The cytidine deaminase signature HxE(x) n CxxC of DYW1 binds zinc and is necessary for RNA editing of ndhD-1. New Phytol. 203, 1090–1095 (2014). [DOI] [PubMed] [Google Scholar]
- 20.Iyer LM, Zhang D, Rogozin IB & Aravind L. Evolution of the deaminase fold and multiple origins of eukaryotic editing and mutagenic nucleic acid deaminases from bacterial toxin systems. Nucleic Acids Res. 39, 9473–9497 (2011). [DOI] [PMC free article] [PubMed] [Google Scholar]
- 21.Vértessy BG & Tóth J. Keeping uracil out of DNA: physiological role, structure and catalytic mechanism of dUTPases. Acc. Chem. Res 42, 97–106 (2009). [DOI] [PMC free article] [PubMed] [Google Scholar]
- 22.Khan SR & Kuzminov A. Thymineless death in Escherichia coli is unaffected by chromosomal replication complexity. J. Bacteriol 201, e00797–18 (2019). [DOI] [PMC free article] [PubMed] [Google Scholar]
- 23.Itsko M. & Schaaper RM dGTP starvation in Escherichia coli provides new insights into the thymineless-death phenomenon. PLoS Genet. 10, e1004310 (2014). [DOI] [PMC free article] [PubMed] [Google Scholar]
- 24.Short FL, Akusobi C, Broadhurst WR & Salmond GPC The bacterial type III toxin–antitoxin system, ToxIN, is a dynamic protein–RNA complex with stability-dependent antiviral abortive infection activity. Sci Rep. 8, 1013 (2018). [DOI] [PMC free article] [PubMed] [Google Scholar]
- 25.Guegler CK & Laub MT Shutoff of host transcription triggers a toxin–antitoxin system to cleave phage RNA and abort infection. Mol. Cell 81, 2361–2373.e9 (2021). [DOI] [PMC free article] [PubMed] [Google Scholar]
- 26.Krishnan A, Iyer LM, Holland SJ, Boehm T. & Aravind L. Diversification of AID/APOBEC-like deaminases in metazoa: multiplicity of clades and widespread roles in immunity. Proc. Natl Acad. Sci. USA 115, E3201–E3210 (2018). [DOI] [PMC free article] [PubMed] [Google Scholar]
- 27.Lada AG et al. Mutator effects and mutation signatures of editing deaminases produced in bacteria and yeast. Biochemistry 76, 131–146 (2011). [DOI] [PMC free article] [PubMed] [Google Scholar]
- 28.Conticello SG, Thomas CJF, Petersen-Mahrt SK & Neuberger MS Evolution of the AID/APOBEC family of polynucleotide (deoxy)cytidine deaminases. Mol. Biol. Evol 22, 367–377 (2005). [DOI] [PubMed] [Google Scholar]
- 29.Dy RL, Przybilski R, Semeijn K, Salmond GPCC & Fineran PC A widespread bacteriophage abortive infection system functions through a type IV toxin–antitoxin mechanism. Nucleic Acids Res. 42, 4590–4605 (2014). [DOI] [PMC free article] [PubMed] [Google Scholar]
- 30.Koga M, Otsuka Y, Lemire S. & Yonesaki T. Escherichia coli rnlA and rnlB compose a novel toxin–antitoxin system. Genetics 187, 123–130 (2011). [DOI] [PMC free article] [PubMed] [Google Scholar]
- 31.Pecota DC & Wood TK Exclusion of T4 phage by the hok/sok killer locus from plasmid R1. J. Bacteriol 178, 2044–2050 (1996). [DOI] [PMC free article] [PubMed] [Google Scholar]
- 32.Makarova KS, Wolf YI, Snir S. & Koonin EV Defense islands in bacterial and archaeal genomes and prediction of novel defense systems. J. Bacteriol 193, 6039–6056 (2011). [DOI] [PMC free article] [PubMed] [Google Scholar]
- 33.Tal N. et al. Antiviral defense via nucleotide depletion in bacteria. bioRxiv 10.1101/2021.04.26.441389 (2021). [DOI]
- 34.Harms A, Brodersen DE, Mitarai N. & Gerdes K. Toxins, targets, and triggers: an overview of toxin–antitoxin biology. Mol. Cell 70, 768–784 (2018). [DOI] [PubMed] [Google Scholar]
- 35.Ayinde D, Casartelli N. & Schwartz O. Restricting HIV the SAMHD1 way: through nucleotide starvation. Nat. Rev. Microbiol 10, 675–680 (2012). [DOI] [PubMed] [Google Scholar]
- 36.Stavrou S. & Ross SR APOBEC3 proteins in viral immunity. J. Immunol 195, 4565–4570 (2015). [DOI] [PMC free article] [PubMed] [Google Scholar]
- 37.Helene Thelin K. & Taylor RK Toxin-coregulated pilus, but not mannose-sensitive hemagglutinin, is required for colonization by Vibrio cholerae O1 El Tor biotype and O139 strains. Infect. Immun 64, 2853–2856 (1996). [DOI] [PMC free article] [PubMed] [Google Scholar]
- 38.Skorupski K. & Taylor RK Positive selection vectors for allelic exchange. Gene 169, 47–52 (1996). [DOI] [PubMed] [Google Scholar]
- 39.Bose JL, Rosenberg CS & Stabb EV Effects of luxCDABEG induction in Vibrio fischeri: enhancement of symbiotic colonization and conditional attenuation of growth in culture. Arch. Microbiol 190, 169–183 (2008). [DOI] [PMC free article] [PubMed] [Google Scholar]
- 40.Fürste JP et al. Molecular cloning of the plasmid RP4 primase region in a multi-host-range tacP expression vector. Gene 48, 119–131 (1986). [DOI] [PubMed] [Google Scholar]
- 41.Dunn AK, Millikan DS, Adin DM, Bose JL & Stabb EV New rfp- and pES213-derived tools for analyzing symbiotic Vibrio fischeri reveal patterns of infection and lux expression in situ. Appl. Environ. Microbiol 72, 802–810 (2006). [DOI] [PMC free article] [PubMed] [Google Scholar]
- 42.Edelheit O, Hanukoglu A. & Hanukoglu I. Simple and efficient site-directed mutagenesis using two single-primer reactions in parallel to generate mutants for protein structure–function studies. BMC Biotechnol. 9, 61 (2009). [DOI] [PMC free article] [PubMed] [Google Scholar]
- 43.Kim P-J & Price ND Genetic co-occurrence network across sequenced microbes. PLoS Comput. Biol 7, e1002340 (2011). [DOI] [PMC free article] [PubMed] [Google Scholar]
- 44.Kanehisa M. Toward understanding the origin and evolution of cellular organisms. Protein Sci. 28, 1947–1951 (2019). [DOI] [PMC free article] [PubMed] [Google Scholar]
- 45.Lüdeke CHM, Kong N, Weimer BC, Fischer M. & Jones JL Complete genome sequences of a clinical isolate and an environmental isolate of Vibrio parahaemolyticus. Genome Announc. 3, e00216–15 (2015). [DOI] [PMC free article] [PubMed] [Google Scholar]
- 46.Lutgring JD et al. FDA–CDC antimicrobial resistance isolate bank: a publicly available resource to support research, development, and regulatory requirements. J. Clin. Microbiol 56, e01415–17 (2018). [DOI] [PMC free article] [PubMed] [Google Scholar]
- 47.Evans DJ & Evans DG Three characteristics associated with enterotoxigenic Escherichia coli isolated from man. Infect. Immun 8, 322–328 (1973). [DOI] [PMC free article] [PubMed] [Google Scholar]
- 48.Madeira F, Madhusoodanan N, Lee J, Tivey ARN & Lopez R. Using EMBL-EBI Services via Web Interface and Programmatically via Web Services. Curr. Protoc. Bioinforma 66, e74 (2019). [DOI] [PubMed] [Google Scholar]
- 49.Will S, Joshi T, Hofacker IL, Stadler PF & Backofen R. LocARNA-P: accurate boundary prediction and improved detection of structural RNAs. RNA 18, 900–914 (2012). [DOI] [PMC free article] [PubMed] [Google Scholar]
- 50.Burke JT, Chen SZ, Sosinski LM, Johnston JB & Ravi J. MolEvolvR: a web-app for characterizing proteins using molecular evolution and phylogeny. bioRxiv 10.1101/2022.02.18.461833 (2022). [DOI]
- 51.Lassmann T. Kalign 3: multiple sequence alignment of large data sets. Bioinformatics 10.1093/bioinformatics/btz795 (2019). [DOI] [PMC free article] [PubMed]
- 52.Edgar RC MUSCLE: multiple sequence alignment with high accuracy and high throughput. Nucleic Acids Res. 32, 1792–1797 (2004). [DOI] [PMC free article] [PubMed] [Google Scholar]
- 53.Bonatesta E, Horejs-Kainrath C. & Bodenhofer U. Multiple sequence alignment. https://www.bioinf.jku.at/software/msa/ (2020) [DOI] [PubMed]
- 54.Price MN, Dehal PS & Arkin AP FastTree 2—approximately maximum-likelihood trees for large alignments. PLoS ONE 5, e9490 (2010). [DOI] [PMC free article] [PubMed] [Google Scholar]
- 55.Rambaut A. FigTree. https://tree.bio.ed.ac.uk/software/figtree/ (2009).
- 56.Paradis E. et al. ape: Analyses of phylogenetics and evolution. https://ape-package.ird.fr/ (2020). [DOI] [PubMed]
- 57.Fernandez NL et al. Vibrio cholerae adapts to sessile and motile lifestyles by cyclic di-GMP regulation of cell shape. Proc. Natl Acad. Sci. USA 117, 29046–29054 (2020). [DOI] [PMC free article] [PubMed] [Google Scholar]
- 58.Schindelin J. et al. Fiji: an open-source platform for biological-image analysis. Nat. Methods 9, 676–682 (2012). [DOI] [PMC free article] [PubMed] [Google Scholar]
- 59.Dryselius R, Izutsu K, Honda T. & Iida T. Differential replication dynamics for large and small Vibrio chromosomes affect gene dosage, expression and location. BMC Genomics 9, 559 (2008). [DOI] [PMC free article] [PubMed] [Google Scholar]
- 60.Koirala D, Lewicka A, Koldobskaya Y, Huang H. & Piccirilli JA Synthetic antibody binding to a preorganized RNA domain of hepatitis C virus internal ribosome entry site inhibits translation. ACS Chem. Biol 15, 205–216 (2020). [DOI] [PMC free article] [PubMed] [Google Scholar]
- 61.Kao C, Rüdisser S. & Zheng M. A simple and efficient method to transcribe RNAs with reduced 3′ heterogeneity. Methods 23, 201–205 (2001). [DOI] [PubMed] [Google Scholar]
- 62.Dong H. et al. An enzymatic assay for high-throughput screening of cytidine-producing microbial strains. PLoS ONE 10, e0121612 (2015). [DOI] [PMC free article] [PubMed] [Google Scholar]
Associated Data
This section collects any data citations, data availability statements, or supplementary materials included in this article.
Supplementary Materials
Data Availability Statement
Data supporting the findings of this study are available here: https://figshare.com/articles/dataset/AvcID_NatureMicrobio_Full_Datasets_zip/19746904. Source data are provided with this paper.


