Abstract
Extrusion-based three-dimensional (3D) bioprinting is one of the most common methods used for tissue fabrication and is the most widely used additive manufacturing technique in all industries. In extrusion-based bioprinting, printing defects related to material deposition errors lead to a significant deviation from shape to function between the printed construct and design model. Using 3D extrusion-based bioprinter-associated optical coherence tomography (3D P-OCT), an in situ defect detection and feedback system was presented based on the accurate defect analysis and location, and a pre-built feedback mechanism. Using 3D P-OCT, multi-parameter quantification of the material deposition was carried out in real time, including the filament size, layer thickness, and layer fidelity. The material deposition errors under different paths were quantified and located specifically, including the start-stop points, straight-line path, and turnarounds. The pre-built feedback mechanism involving the control inputs, such as printing path, pressure, and velocity, provided the basis for in situ defect detection and real-time feedback control. In particular, the second printing repair can be performed after the broken filament defect is detected and located. After printing, fidelity can be quantitatively analyzed based on the point cloud registration between the 3D P-OCT result and the design model. In conclusion, 3D P-OCT enables in situ defect detection and feedback control, broken filament repair, and 3D fidelity analysis to achieve high-fidelity printing from shape to function.
Keywords: Optical coherence tomography, Extrusion-based bioprinting, Process monitoring, Defect detection, Feedback control, High fidelity
1. Introduction
With its potential to fabricate three-dimensional (3D) biomimetic functional tissue constructs and organs, 3D bioprinting has been applied in organ printing[1,2], microvasculature printing[3], disease modeling[4], and scaffold fabrication for tissue regeneration[5,6]. According to different prototyping principles and printed materials, 3D bioprinting follows three main approaches: droplet-based, extrusion-based, and photocuring-based bioprinting. Extrusion-based bioprinting employs pneumatic, mechanical or ram extruders to dispense materials, and other biological molecules. Using extrusion-based bioprinters, various biopolymers and multiple cell types encapsulated in hydrogels can be deposited in a defined trajectory to fabricate constructs with specific biological features[7]. Extrusion-based bioprinting has been widely used with the main advantages of a wide selection of biomaterials, low-cost equipment, and the ability to maintain great control of porosity and pore interconnectivity, which are important for proper cell growth in scaffolds[8]. Tissue scaffolds play an very important role in the process of tissue engineering for the growth of new or repairs of defected tissue[7]. However, researchers face some challenges in maintaining the desired 3D structure due to the system assembly error, nozzle calibration error, unstable material rheological properties, and unstable environmental control errors. In this study, we focus on the material deposition error due to the lack of online monitoring and feedback control, which limits the implementation of high-fidelity structures.
Material deposition errors result in deviations in the material path, filament size (FS), layer thickness (LT), pore size (PS), volume porosity (VP), and porosity connectivity (PC) between the printed structure and design model. In tissue-engineering scaffolds, specific PS values are required to accommodate cell growth and tissue regeneration[8,9]. 3D porous interconnected structures can facilitate cell growth and the transport of nutrients and metabolic waste, which is beneficial for large-size tissue repair[9,10]. High-fidelity structures can ensure that the constructs perfectly match the tissue defect site and provide sufficient mechanical support, particularly for bone defect repair[11]. Moreover, low fidelity can affect the consistency between drug screening and disease models[12]. Insufficient product quality assurance could lead to increased lead-times, operational costs, and part waste. Therefore, an increasing number of researchers have become aware of the significance of high-fidelity structures and the importance of precise material deposition[13]. Material deposition errors usually lead to low structural fidelity, poor consistency of constructs, and insufficient functional characteristics, which are mainly caused by the mismatch between the material extrusion and the three-axis mechanical movement.
The incorporation of sensing and feedback control in extrusion bioprinting is one way to reduce material deposition errors and improve the fidelity of the constructs. At present, X-ray CT[14,15], MRI[16], industrial camera[13], and 3D digital image correlation (3D-DIC)[17] are the main detection technologies commonly used in 3D printing; however, there are some limitations for in situ monitoring and 3D imaging detection of internal defects in 3D bioprinting. Simeunović and Hoelzle developed non-linear and linearized models of extrusion-based printing dynamics to avoid adversely impacting flow rate and achieve accurate material delivery at start-stop points[13]. Armstrong et al. presented an iteration-to-iteration process monitoring system that enabled direct process feedback in material deposition based on the laser displacement scanner integrated to the printing platform[6,18]. They modified the spatial material placement error and the material width error, and developed process control strategies based on the measured errors to adjust control inputs and ultimately eliminate material deposition errors. However, the laser displacement scanner can only provide surface profile information without penetration and 3D structural reconstruction; quantification and overall fidelity evaluation of large constructs were not provided. With 3D-DIC, Holzmond et al. monitored the surface geometry of a printed part to detect and locate defects in parts produced by a fused filament fabrication 3D printer[17]. They produced a point cloud model using a visualization toolkit based on GCode originally sent to the printer. Errors were detected and located by comparing the 3D-DIC measurement data with the reference point cloud model. The measured errors and defect locations are prerequisites for subsequent feedback control and defect repair. In situ defect detection and quantitative analysis, feedback control, and defect repair are the main challenges in high-fidelity 3D printing.
In the previous work, 3D extrusion-based bioprinter-associated optical coherence tomography (3D P-OCT) has been proposed[19]. OCT is a non-destructive, label-free, high-resolution, and fast tomographic imaging technique that are widely used in the biomedical and industrial testing fields[20,21]. OCT enables 3D volumetric imaging with micron-scale resolution over centimeter length scales and 3D P-OCT enables large-field full-depth imaging to meet the imaging requirements of large structures. 3D P-OCT can provide in situ process monitoring and multi-parameter evaluation layer by layer during extrusion-based bioprinting including LT, FS, layer fidelity, and 3D structure quantitative analysis, including material volume, VP, and PC[19]. This study mainly focuses on in situ defect detection and timely feedback control for print parameter compensation and defect repair.
In this study, three types of defects related to material deposition were considered, including material deposition path, FS, and LT. Moreover, the improved quantification methods using 3D P-OCT reconstructed results were proposed for defect detection and location. On this basis, a pre-built feedback mechanism was developed for timely feedback control after defect detection, which established a relationship between printed results and the input control parameters. The pre-built feedback mechanism was mainly aimed at the material deposition errors under three different paths: the start-stop points, straight path, and turnarounds. After the defects were identified and located, the input control parameters were adjusted in time by the pre-built feedback mechanism to ensure the accuracy of printing results, and the broken filament defects were repaired with the second printing. In addition to in situ defect detection and timely feedback control during the extrusion-based printing process, fidelity evaluation can be performed for each layer during the printing process and for the overall construct after printing.
In situ defect detection and location, timely feedback control, and defect repair can help achieve high-fidelity structure printing and promote the application of 3D bioprinting to accurately manufacture complex personalized structures. The presented “monitoring and feedback-as-you-build” quality assurance system can improve printing efficiency, reduce material waste, and ensure the consistency of printing structure, thus promoting the application and promotion of 3D bioprinting in organ transplantation and disease modeling.
2. Methods
2.1. System
The latest self-developed 3D P-OCT system (Regenovo Bio-Architect PX, Hangzhou Regenovo Biotechnology Co., LTD.) was used in this study, which associates a 3D bioprinter and OCT and has been reported in the previous study[19]. Briefly, the system consisted of a work station for printing model processing, a 3D mechanical motion module, a nozzle mount arm, and a sensor module for temperature, pressure, and distance sensing. In addition, 3D P-OCT integrated a self-developed swept-source OCT (SS-OCT) module, and the OCT probe was mounted next to the extrusion nozzle for in situ process monitoring. In the SS-OCT module, a wavelength-swept laser source (HSL-20-50-M, Santec, Japan) was used with a central wavelength of 1,310 nm, a bandwidth of 105 nm, and a 50-kHz A-scan rate, yielding a measured axial resolution of 7.2 μm in air. The probing light was focused onto the sample using an objective lens (focal length = 36 mm), and a lateral resolution of 15.0 μm was achieved. Interference signals were recorded using an In-GaAs balanced photodetector. The system sensitivity was measured at ~68 dB with 10-mW light on the sample, and the system exhibited a roll-off of ~5 dB at a depth of ~3 mm. With the two-dimensional high-speed galvanometer scanning module, the single 3D P-OCT dataset covered an area of 10 mm (x) × 10 mm (y) × 6.28 mm (z).
2.2. In situ defect detection algorithm flow
For in situ defect detection, layer-by-layer imaging is required for large-volume constructs and large-field imaging is essential for defect detection, location, and feedback. In the previous study[19], the simplified iterative closest point algorithm based on a point cloud has been proposed to achieve large-field, full-depth imaging (Figure S1 (1,000.8KB, pdf) ). This study mainly discusses in situ defect detection and feedback control based on improved quantification methods and a pre-built feedback mechanism were presented, and the closed-loop feedback control loop is shown in Figure 1A.
Figure 1.
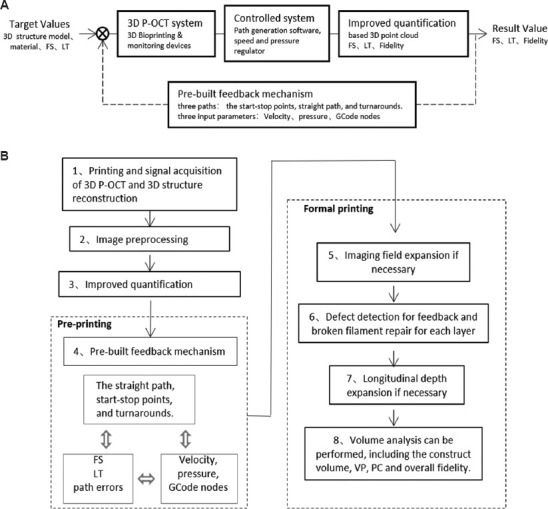
The closed-loop feedback control loop (A) and the algorithm flow (B) for in situ defect detection and feedback control with 3D P-OCT. 3D P-OCT: Three-dimensional extrusion-based bioprinter-associated optical coherence tomography.
On this basis, the detailed algorithm flow for in situ defect detection and feedback control with 3D P-OCT is shown in Figure 1B. The original signal acquisition of 3D P-OCT and 3D structure reconstruction was carried out in Step 1. In Step 2, 3D P-OCT intensity images were preprocessed to suppress speckle noise and fringe noise, including 3D Gaussian filtering with a kenel of 3*3*3, binarization with OTSU algorithm, the open operation, and then the close operation using a disk structure element of radius 5. In Step 3, three types defects related to material deposition were analyzed, including material deposition path, FS, and LT. In Step 4, the feedback mechanism was prebuilt mainly aimed at the material deposition errors under three different paths: the start-stop points, straight path, and turnarounds. The pre-built feedback mechanism established a relationship between printed results and the input control parameters, including velocity, pressure, and GCode path nodes. In formal printing, the single OCT imaging field and the printed construct size (x-y) were compared in Step 5, and lateral field expansion was necessary if the latter was larger. In Step 6, LT and FS were analyzed, and the broken filament was identified. The defect details and locations were used for further feedback, including pressure and velocity adjustment, and broken filament repair. In Step 7, the effective penetration depth of OCT and the printed construct size (z) was compared, and longitudinal depth expansion was necessary if the latter was larger. After printing, volume analysis can be performed with the full-volume imaging result of the printed construct, including the construct volume, VP, PC, and overall fidelity.
2.3. Quantification of FS, LT, and fidelity
In extrusion-based 3D bioprinting, FL and LT errors usually occur due to the mismatch between the rheological properties of the printing materials and the control inputs of pressure and velocity. Determining the appropriate pressure and velocity, and reducing FL and LT errors are the premise of high-fidelity 3D bioprinting. Therefore, new quantification methods for FL and LT were first determined, and then, the corresponding feedback mechanisms were pre-built for different defects during 3D bioprinting. By combining 3D P-OCT data and the design model, the layer fidelity and overall fidelity could be further assessed for the construct.
2.3.1. FS
In the previous work, the projection view in depth (z) of the 3D P-OCT data was used for the FS analysis. To avoid possible errors due to projection, 3D P-OCT data were used for more accurate FS quantification, as shown in Figure 2. The material of hydroxyapatite (Hap) was selected in this study, which was purchased from Shanghai Macklin Biochemical Co., Ltd. (China). The Hap paste was prepared by mixing 1.8 mL glycerin, 0.2 g of ammonium polyacrylate, 0.24 g polymethyl cellulose, and 7 g Hap in 4.5 mL deionized water. After stirring for 10 min, the paste was transferred to a syringe for printing. In Figure 3A, the 3D P-OCT data of the printed filament and the corresponding physical image are displayed. The cross-sectional image corresponding to the white dotted line is shown in Figure 3B and the binarized result is shown in Figure 3C. After binarization and inversion, Euclidean distance transformation of the 3D P-OCT data was performed, as shown in Figure 3D. The FS value can be expressed as 2 times the maximum value of Figure 3D, and the FS distribution of the entire filament is shown in Figure 3E. As shown in Figure 3E, the FS values at the start-stop points were larger, and the FS values at the middle straight segment were relatively uniform.
Figure 2.
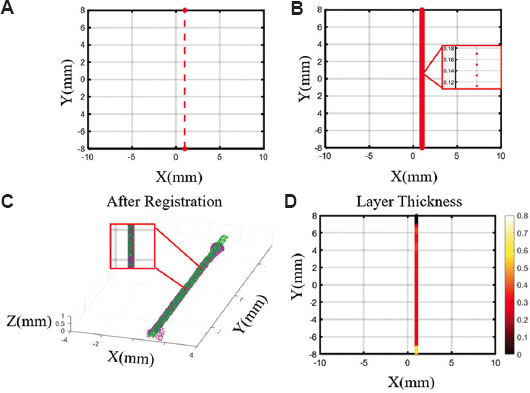
Layer thickness (LT) quantification based on the design model and three-dimensional extrusion-based bioprinter-associated optical coherence tomography (3D P-OCT) data. (A) GCode nodes before interpolation corresponding to the filament in Figure 3A. (B) GCode nodes after interpolation. (C) The registration results of the design model based on GCode nodes and 3D P-OCT data. (D) The spatial distribution of LT.
Figure 3.
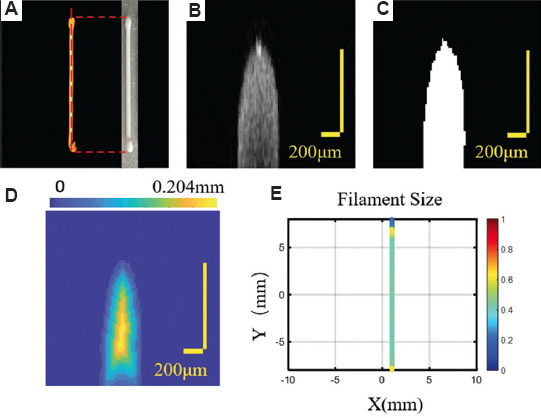
Filament size (FS) quantification based on three-dimensional extrusion-based bioprinter-associated optical coherence tomography (3D P-OCT). (A) 3D P-OCT data of the single filament and the corresponding physical photo. (B) The cross-section image corresponding to the white dot line in (A). (C) The binarized result of the cross-section image. (D) Euclidean distance transformation results of the binarized image. (E) FS distribution of the single filament.
2.3.2. LT
In the previous work, the LT calculation was focused on the actual material deposition height, which was not suitable for LT defect analysis and broken filament defect detection and repair. Here, a 3D design model was generated based on the GCode information and the LT defect was identified by comparing the 3D P-OCT data with the design model. Considering that the GCode path mainly contained key input nodes, where the pressure or velocity input parameters changed, the spatial resolution of the GCode nodes was much lower than that of the 3D P-OCT data. To maintain the same resolution as that of 3D P-OCT, the GCode nodes were first linearly interpolated. The nodes of the GCode path are shown in Figure 2A and B before and after interpolation. Based on the ellipse equivalent model proposed by Simeunović and Hoelzle[13], the design values of FS and LT can be equivalent to the size of the major and the minor axes of the ellipse. After interpolation, the points PTGCode of GCode nodes were transformed into an elliptic upper surface, and the surface points PTS_GCode (see the green points) were compared with the material surface points PTS_P-OCT (see the purple points) generated from 3D P-OCT data, as shown in Figure 2C. After registration, the material points PTS_P-OCT and GCode nodes PTGCode were projected onto the XY plane. For each GCode node in the XY plane PTxy_GCode (i), the nearest point in the material points PTxy_S_P-OCT (i) was determined, and the nearest distance between the nearest point pair was recorded as follow:

With the XY coordinate of PTxy_S_P-OCT (i), the corresponding point in 3D space PTS_P-OCT (i), t was found, and Z coordinates were recorded as the LT value zPTP-OCT (i) at the ith point. Considering that there might be broken filament defects, the LT value was defined based on the mean distance Mean_Disxy and standard deviation δ_Disxy of Disxy as follows:
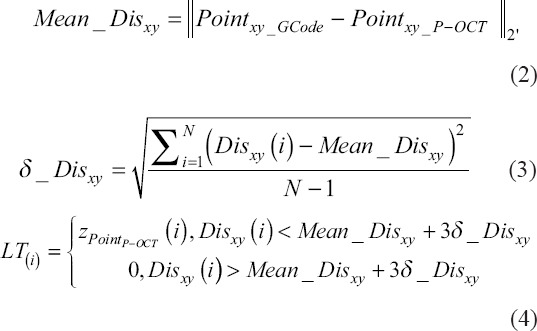
When the above LT(i) was zero, the corresponding position indicated a broken filament defect. When LT(i) was nonzero, it was the calculated LT value of the corresponding position. For the printed filament in Figure 2A, LT can be presented with a pseudo-color in the XY plane, as shown in Figure 2D. At the starting point, the LT value was determined to be zero when there was no material deposition, due to to the pressure response hysteresis.
2.3.3. Fidelity quantification
In addition to FS and LT analyses, fidelity analysis can provide a final estimation of the consistency between the construct and the designed model, which can be applied to each layer during the printing process and the overall construct after printing. During the printing process, the construct structure of each layer can be reconstructed using 3D P-OCT data, and the fidelity value can be obtained by comparing the reconstructed result with the design model of the current layer. The overall fidelity value was obtained by comparing the overall reconstructed results with the overall design model. An ideal 3D design model PT3D_GCode can be obtained by traversing the interpolated GCode with the above elliptic model. After 3D registration of the design model PT3D_GCode and the reconstructed result PTP-OCT, fidelity can be calculated using the following formulas:
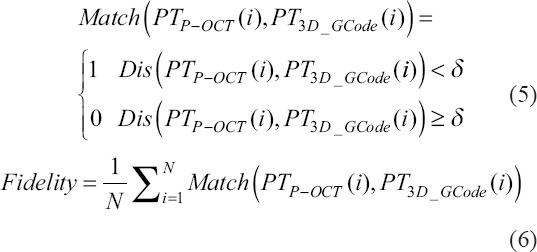
Where PTP-OCT (i) is the point in the reconstructed model, and PT3D_GCode (i) is the point in the design model. δ is the distance threshold used to judge the matching success rate between PTP-OCT (i) and PT3D_GCode (i) and N was the point number in PT3D_GCode. This ratio indicates the degree of fidelity.
2.4. Pre-built feedback mechanisms
2.4.1. Defects in the straight path and feedback mechanism
In the straight path section, FS and LT may be inconsistent with the designed values, which is mainly related to the rheological properties, input pressure, and velocity. According to the rheological properties of the target material and the target FS and LT values, the feedback mechanism was built through a pre-experiment. For example, when the target material is Hap with the target FS (0.48 mm) and LT (0.33 mm), a nozzle with the inner diameter of 0.41 mm was selected with different pressure and velocity inputs for pre-experiment. Specifically, the pressure range was set at 0.22 – 0.32 MPa with the interval of 0.02 MPa, and the velocity range was set at 6 – 13 mm/s with the interval of 1 mm/s. Parts of the printing paths and the corresponding input parameters are displayed in Figure 4A. The length of each filament was set as 8 mm and the overall field was within 19 mm × 19 mm in X-Y plane, which can be imaged with the wide field function of 3D P-OCT. With different combinations of pressure and velocity, the pre-experiment was repeated five times and the printed results are shown in Figure 4B. Figure 4C shows the 3D P-OCT result corresponding to the group in the red box in Figure 5B. Corresponding to the red line in Figure 5C, a cross-sectional image is displayed in Figure 4D. With the 3D P-OCT datasets of the pre-experiment, FS and LT with different pressure and velocity inputs are analyzed and plotted in Figure 4E and F, respectively. When the acceptable FS range was 0.48 ± 0.10 mm and the acceptable LT range was 0.33 ± 0.10 mm, suitable pressure and velocity input group can be obtained, as displayed in Figure 4G with the green boxes. Furthermore, the surface fitting functions of FS and LT can be generated using the above data with the corresponding material and needle conditions, as follows:
Figure 4.
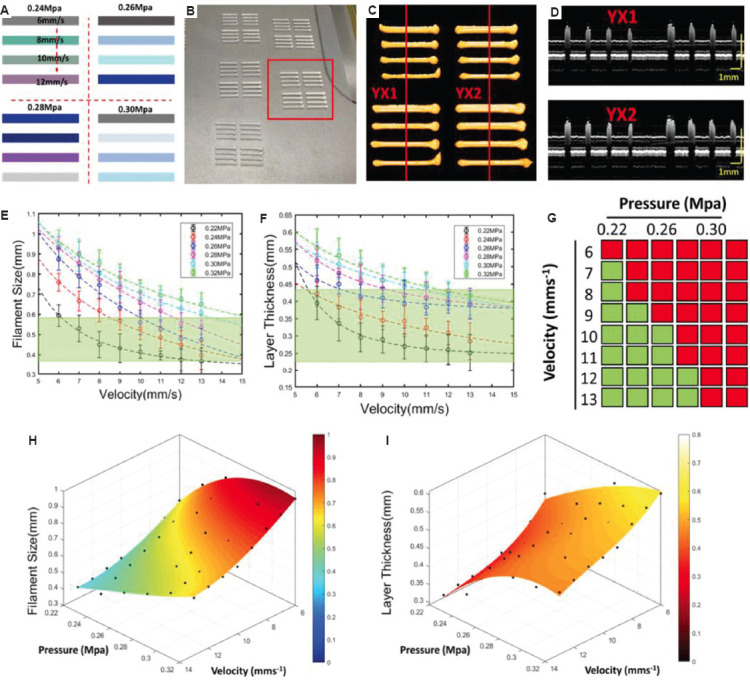
The pre-experiment for feedback mechanism in the straight path. (A) The designed paths with different input parameters of pressure and velocity. (B) The image of printed results with the inputs in (A). (C) Three-dimensional extrusion-based bioprinter-associated optical coherence tomography (3D P-OCT) result of one group of the printed filaments in (B). (D) The cross-section images corresponding to the red lines in (C). (E) Filament size (FS) measurement results under different pressure and velocity. (F) Layer thickness (LT) measurement results under different pressure and velocity. (G) The acceptability of different combinations of pressure and velocity for the target material, target FS, and LT. Moreover, the green region indicates the acceptable combinations velocity and pressure for the target FS and LT. (H) The surface fitting result of FS. (I) The surface fitting result of LT.
Figure 5.
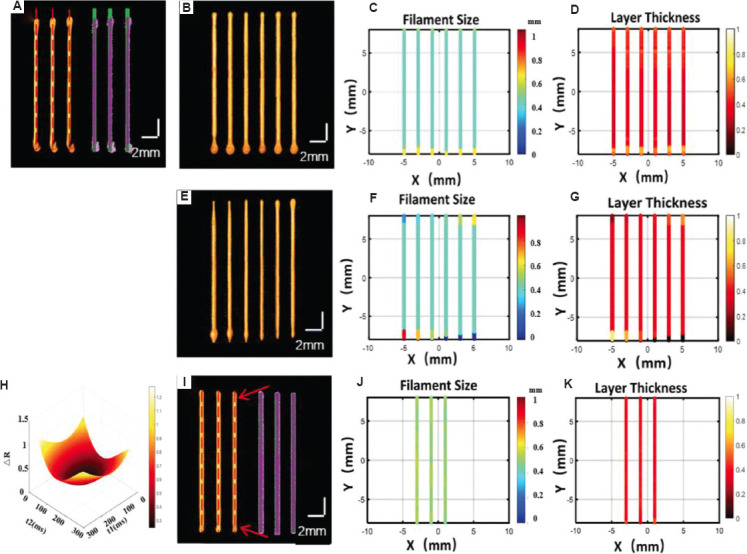
The pre-experiment for feedback mechanism at the start-stop points. (A) The comparison of the design path (see the red dot line) and three-dimensional extrusion-based bioprinter-associated optical coherence tomography (3D P-OCT) reconstructed result for three filaments before feedback, and the comparison of the design model (see the green point cloud) and the surface points of 3D P-OCT (see the purple point cloud). (B) 3D P-OCT results of different compensation for response hysteresis using path errors. (C) Filament size (FS) distribution of (B), and the blue color and the yellow color indicated the larger and small FS values at the start-stop points, respectively. (D) Layer thickness (LT) distribution of (B), and the black and white color indicated the larger and smaller LT values at the start-stop points. (E) 3D P-OCT results of different compensation parameters in the pre-experiment. (F) FS distribution of (E). (G) LT distribution of (E). (H) The result of surface fitting. (I) The printing results after feedback with response hysteresis compensation. (J) FS distribution of (I). (K) LT distribution of (I).
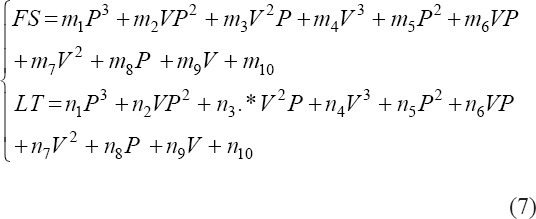
where V represents the velocity, P represents the pressure, m1, m2, … , m9 are coefficients to be solved in the function of FS, n1, n2,… n9 are coefficients to be solved in the function of LT. The two fitting surfaces are shown in Figure 4H and I. The optimum pressure and velocity inputs were 0.24 MPa and 11 mm/s for the target FS (0.48 mm) and LT (0.33 mm), respectively.
2.4.2. Defects of end points and feedback mechanism
There were material deposition errors at the start-stop points, as shown in Figure 5A. The left part shows the 3D P-OCT results, and the right part shows the registration results of the design model based on GCode nodes and 3D P-OCT results. There was no material deposition within a certain distance from the theoretical path starting point (red dotted line in Figure 4A), and too much material deposition occurred at the actual path starting point. Excessive material deposition also occurred at the end of the path. Armstrong et al. calculated the hysteresis time by combining the length of the material-free deposition at the start point with the printing speed[18]. According to the rheological properties of the above target material, the target FS and LT values, the optimum pressure, and velocity inputs of 0.24 MPa and 11 mm/s were selected for the response hysteresis pre-experiment. Using the Hap material and printing speed, an average 14.926 mm of material deposition length was printed when the designed length was 16 mm. Therefore, a corresponding hysteresis time of 98 ms was calculated. The corresponding results after compensation are shown in Figure 5B; however, there were still FS and LT errors (Figure 5B-D). To avoid material deposition errors at the start-stop points due to the hysteresis of the pneumatic response, including path length errors and excessive material deposition, a pre-experiment to compensate for the hysteresis of the pneumatic response was carried out by adjusting the pressure and velocity.
To compensate for the pressure response hysteresis at the starting point, the pressure input was provided in advance, and the specific advance was determined by the hysteresis time from the pre-experiment, which was related to the pressure and velocity inputs. As shown in Figure 5E, the upper part was 3D P-OCT result with different compensations (from 50 to 300 ms with 50 ms intervals) for response hysteresis at the start point. The lower part shows 3D P-OCT results with different compensation (from 50 to 300 ms with 50 ms intervals) at the stop point. With advanced extrusion from 50 to 300 ms, no material deposition at the theoretical path starting point in Figure 5A was improved. Correspondingly, the FS and LT distributions are shown in Figure 5F-G. Subsequently, the hysteresis compensation time t1 at the start point was determined by the deposition path error, FS, and LT errors within 1 mm of the material starting to deposit, as shown in Figure 5F-G. In addition, at the end point, the early termination of extrusion might be an effective solution. The time of the early termination of extrusion t2 can, then, be determined by the deposition path error at the stop point from Figure 5F-G. Furthermore, the surface fitting functions∆R of t1 and t2 can be generated using the above data with the corresponding material and needle conditions, as follow:

where c1, c2,…,c9 are the solution coefficients of the fitting function ∆R. The surface-fitting results are shown in Figure 5H. Based on the above fitting results, t1 and t2 were calculated as 148 ms and 144 ms, respectively, and the printed results after response hysteresis compensation are displayed in Figure 5I. The designed path (red dotted lines) and the actual material path remained the same. The FS and LT distributions (Figure 5J-K) also indicated that there was no significant excessive material deposition at the starting and ending points (see the red arrows).
2.4.3. Defects around the turnarounds and feedback mech
In addition to the straight path and end points mentioned above, material deposition errors often occur at turnarounds. There is a velocity change around the turnarounds, which leads to material deposition errors when the velocity does not match the pressure and rheological properties of the material. Armstrong et al. corrected the path error using reverse compensation[18]. This section mainly focuses on compensating for FS and LT defects around the turnarounds with feedback control for the common right-angle corner path (Figure 6A). In 3D bioprinting, GCode nodes are typically set at the corners in the path (see asterisk). Due to the acceleration and deceleration zones before and after the node, a lower average velocity typically leads to excessive material deposition, and FS and LT defects. To compensate for the FS and LT defects at the turnarounds, the node position and velocity were adjusted during the pre-experiment, as shown in Figure 6.
Figure 6.
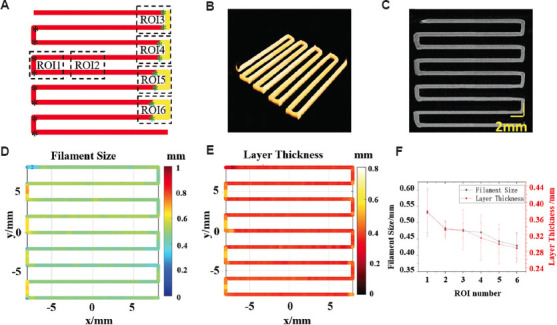
The pre-experiment for feedback mechanism around the turnarounds. (A) The common path and GCodes around the corners before (the left corners) and after (see ROI 3-6 in the right corners) node adjustment. (B) three-dimensional extrusion-based bioprinter-associated optical coherence tomography (3D P-OCT) result. (C) The enface image of 3D POCT. (D) Filament size (FS) distribution of (B). (E) Layer thickness (LT) distribution of (B). (F) Average FS and LT values in different regions with different input parameters.
Figure 6A-E showed the print path nodes, 3D P-OCT data, en-face image of 3D P-OCT, FS, and LT distributions, respectively. Turnarounds in the left part were the results without defect compensation, and the GCode nodes (black asterisk) were located at the right-angle corner (Figure 6A). Moreover, the FS and LT values were larger than straight path due to excessive material deposition error. Turnarounds in the right part were the result with defect compensation under different conditions. In Figure 6A, the red asterisks in ROI3, ROI4, ROI5, and ROI6 represented the adjusted nodes added at 0.5 mm, 1 mm, 1.5 mm, and 2 mm in front (or behind) of the corner node, respectively. At the same time, the speed of yellow path was increased from 11 mm/s to 12 mm/s. The analysis of FS and LT values in four areas ROI3-6 is shown in Figure 6F, and the average FS values in ROI1-6 were 0.531 ± 0.073 mm, 0.483 ± 0.021 mm, 0.475 ± 0.022 mm, 0.471 ± 0.028 mm, 0.443 ± 0.036 mm, and 0.430 ± 0.040 mm, respectively. The average LT values in ROI1-6 were 0.378 ± 0.052 mm, 0.333 ± 0.021 mm, 0.333 ± 0.050 mm, 0.313 ± 0.056 mm, 0.298 ± 0.0489 mm, and 0.288 ± 0.035mm, respectively. The result indicated that FS and LT defects in the turnarounds after compensation (ROI3-6) were smaller than that before compensation (ROI1). Among them, FS and LT results in ROI3 were closest to the target FS and LT (ROI2) in the straight path. With the pre-experiment, the target FS (0.480 mm) and LT (0.330 mm) for the target material (HA) can be obtained at the turnarounds under the compensation condition of adding nodes 0.5 mm in front (or behind) of the corner nodes and increasing the velocity to 12 mm/s at the turnarounds.
2.5. Statistical analysis
In this study, data processing and analysis were performed using MATLAB software, and a 3D perfusion map was rendered using Amira (ZIB, Indeed-Visual Concepts GmbH, Germany). All results are expressed as the mean ± standard error of the mean.
3. Results
3.1. Verification experiment of broken filament repair
The broken filament can directly lead to low consistency between the printed construct and the design model, and lower fidelity would, further, affect the structure and functional characteristics. To verify the detection and repair mechanism for the broken filaments described above, single-layer printing was applied with Hap broken filament detection and location based on LT analysis. The 3D P-OCT result of the single-layer printed structure is shown in Figure 7A, with the target FS (0.41 ± 0.10 mm) and LT (0.32 ± 0.10 mm). With the analysis methods of LT described in section 2.4.1, the spatial distribution and frequency statistics histogram of LT are shown in Figure 7B and C. Corresponding to the black line segment in Figure 7B, the LT values were zero at the broken filament with space coordinates from −1, 0, and 0.16 to 3.8, 0, and 0.16 and a length of 4.8 mm. Secondary printing was applied for broken filament repair based on the spatial location of defect detection.
Figure 7.
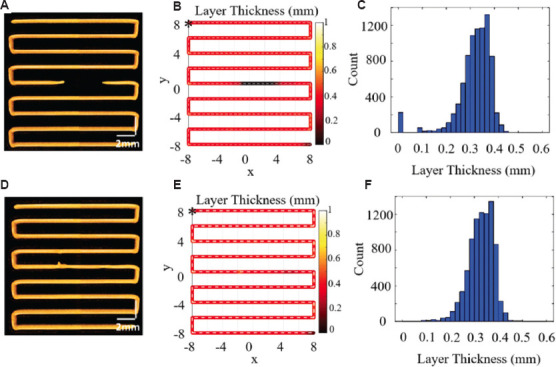
The result of broken filament repair based on three-dimensional extrusion-based bioprinter-associated optical coherence tomography (3D P-OCT). (A) 3D P-OCT results of the single-layer printing structure before repair. (B) Layer thickness (LT) distribution of the single-layer printing structure before repair. (C) Frequency statistics histogram of LT in (B). (D) 3D P-OCT results of the single-layer printing structure after repair. (E) LT distribution of the single-layer printing structure after repair. (F) Frequency statistics histogram of LT in (E).
The 3D P-OCT result of the single-layer printed structure after broken filament repair is shown in Figure 7D. The broken filament corresponding to the black line segment was repaired from the 2D distribution of LT, as shown in Figure 7E. At the same time, the frequency statistics histogram of LT in Figure 7F also shows that the LT frequency result of zero is zero, indicating that there was no broken filament after the repair. For multilayer constructs, the detection and repair of broken filament defects were the same as those for single-layer constructs. During the printing process, 3D P-OCT data acquisition and LT analysis were performed for each layer to detect and locate broken filament defects. For continuous broken filaments with a length greater than the target FS, secondary printing is required to repair the broken filament. With the broken filament location, GCode instructions can be generated to guide the secondary printing for repair.
3.2. Defect detection and feedback control of the large-size multi-layer construct
With the above target material, target FS, and LT values, a large multilayer construct was designed to verify the effectiveness of the defect detection and feedback control mechanism with 3D P-OCT. The 3D printed model (15 mm [x] × 15 mm [y] × 3.3 mm [z]) was first designed using CAD. Thereafter, the printing path was divided into ten layers with a common lattice pattern, as shown in Figure 8A. HAp was used as the printing material, and a nozzle with a 400-um inner diameter was selected. Based on the GCode information and the target FS and LT values, a 3D design model can be generated using the ellipse model, as shown in Figure 8B. Without the “monitoring and feedback-as-you-build” mechanism, the input parameters were chosen empirically with the pressure of 0.26 MPa and velocity of 9 mm/s, and the printed construct is shown in Figure 8C1. With in situ defect detection and the prebuilt feedback mechanism, the input control of pressure (0.24 MPa) and velocity (11 mm/s) was selected in the straight path, and the printed construct is shown in Figure 8D1. In terms of data acquisition of 3D P-OCT datasets, the lateral dataset numbers were set as Nx=2 and Ny=2 during lateral scanning and the translation step size Dz in depth direction was set as 0.32 mm and Nz was set as 10. Before feedback control, the 3D P-OCT result of Layer 10 before lateral field registration is shown in Figure 8C2. The 3D P-OCT results after lateral and longitudinal registration are shown in Figure 8C3 and Figure 8C4, respectively, from different angles. After defect detection and feedback control, the 3D P-OCT reconstructed result of Layer 10 before lateral field registration is shown in Figure 8D2. The 3D P-OCT reconstructed results after lateral and longitudinal registration are shown in Figure 8D3 and 4 from different angles.
Figure 8.
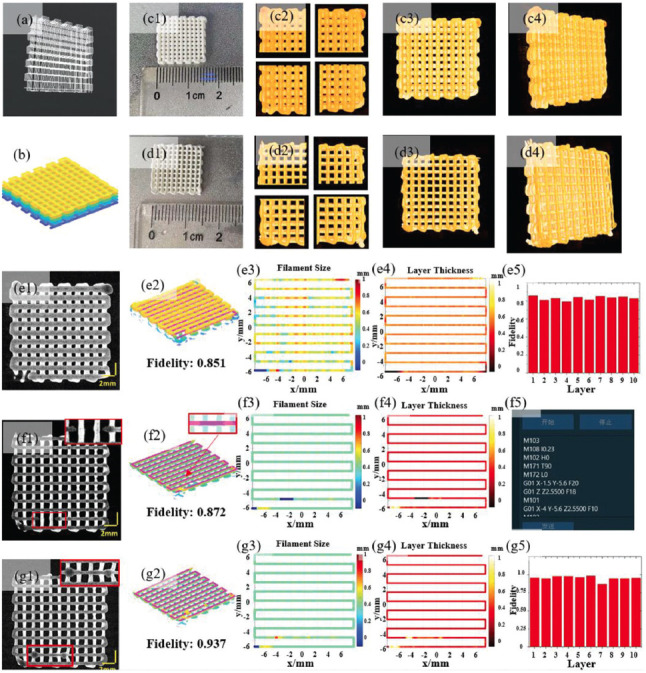
Multi-layer constructs before and after feedback control. (A) The design printing path of ten layers with the common lattice pattern. (B) Three-dimensional (3D) design model based on the ellipse model. (C) The printed result without feedback. c1: Image of the printed scaffold; c2: 3D extrusion-based bioprinter-associated optical coherence tomography (3D P-OCT) data of Layer 10 before lateral registration. c3: Top view of 3D P-OCT result after lateral and longitudinal registration. c4: 3D view of 3D P-OCT data after lateral and longitudinal registration. (D) The printed result after defect detection and feedback control. d1-d4: results corresponding to c1-c4 after defect detection and feedback control. (E) Analysis of Layer 7 before feedback. e1: enface image of 3D P-OCT of Layer 7; e2: registration of the design model and 3D P-OCT reconstructed model for the layer fidelity analysis. e3: Filament size (FS) distribution of Layer 7; e4: Layer thickness (LT) distribution of Layer 7; e5: Layer fidelity distribution for 10 layers in (c1). (F) Analysis of Layer 7 after feedback without broken filament repair. f1: enface image of 3D P-OCT of Layer 7. (f2-f4): results corresponding to e2-e4 after feedback without broken filament repair; (f5) GCode instructions for broken filament repair with the secondary printing. (G) Analysis of Layer 7 after feedback and broken filament repair. (g1) enface image of 3D P-OCT of Layer 7; (g2-g5): results corresponding to e2-e5 after feedback and broken filament repair.
Using 3D P-OCT reconstructed results, the overall size was calculated as 15.469 mm (x) × 15.918 mm (y) × 3.453 mm (z) (Figure 8C1) before feedback and 15.102 mm (x) × 15.061 mm (y) × 3.401 mm (z) (Figure 8D1) after feedback control and defect repair. Using 3D P-OCT reconstructed model and the design model, the overall fidelity can be calculated using Eq.(6) in section 2.4.3, which were 84.67% (Figure 8C1) and 93.07% (Figure 8D1) before and after the feedback control, respectively. During the printing process, each layer can be monitored in situ; and defect detection and feedback control can be applied using 3D P-OCT data. It is worth mentioning that a broken filament defect was detected and repaired in Layer 7 of the construct after feedback control in Figure 8D1. To compare the effectiveness of feedback control and defect repair, Layer 7 was selected for further detailed analysis.
Before feedback, the 3D P-OCT result of Layer 7 is shown in Figure 8E1, and the corresponding FS and LT distributions are shown in Figure 8E3 and 4, respectively. The distributions showed that there were larger FS and LT values in the start-stop points and turnarounds. By comparing the 3D P-OCT data and the design model of Layer 7, the layer fidelity was calculated as 0.851 as displayed in Figure 8E2. Furthermore, the fidelity value of each layer in Figure 8C can be calculated and the fidelity results are displayed in Figure 8E5. After feedback, the 3D P-OCT results of Layer 7 with broken filament defects are shown in Figure 8F1. The corresponding FS and LT distributions are shown in Figure 8F3 and 4. There were no significant defects in the start-stop points or the turnarounds. However, a 2.376 mm-length broken filament defect from location −3.500, −5.600, and 2.550 to −1.124, −5.600, and 2.550 was detected and located from the LT distribution, which is used to guide the secondary printing as shown in Figure 8F5. By comparing the 3D P-OCT data and the design model of Layer 7, the layer fidelity was calculated to be 0.872 as displayed in Figure 8F2. At the location of the broken filament defect, the secondary printing was performed for broken filament repair before printing the next layer. The 3D P-OCT result of Layer 7 after feedback control and broken filament repair is shown in Figure 8G1. The corresponding FS and LT distributions are shown in Figure 8G3 and 4, respectively, and no significant FS and LT defects were observed. By comparing 3D P-OCT data and the design model of Layer 7, the layer fidelity was calculated as 0.937 as displayed in Figure 8G2, with a 10.01% improvement from 0.852 before defect detection. Furthermore, the fidelity values of each layer in Figure 8D were calculated and are displayed in Figure 8G5. The average layer fidelity after feedback control and defect repair was significantly improved to 0.961 ± 0.017 (Figure 8G5) from 0.832 ± 0.024 (Figure 8G5) before feedback, which was comparable to the overall fidelity from 0.847 (Figure 8C1) and 0.931 (Figure 8D1).
As shown in Figure 9, 3D P-OCT data enabled mechanical analysis and 3D structural analysis of the overall construct. After feedback, the VP and PC of the construct increased from 37.68% and 98.14% to 46.32% and 98.78%, respectively (Figure 9D). Furthermore, 3D P-OCT data of the printed construct can be converted to STL format files using MIMICS. The mechanical stiffness of the printed constructs before and after feedback can be compared with the designed model using finite element analysis (FEA), which was implemented to simulate the stress and strain process of constructs under compression using ANSYS Workbench 17.0 (Figure 9A-C). After feedback, the compressive modulus of the construct improved from 84.4374% to 33.3622%, which was closer to that of the design model (22.09%).
Figure 9.
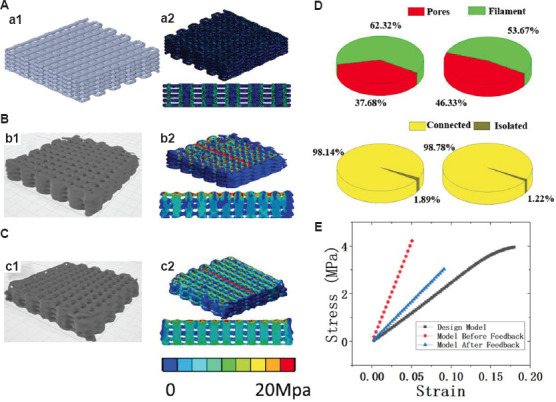
Mechanical and structural properties of the scaffolds. (A) Three-dimension (3D) design model (a1) with target filament size and layer thickness, and the finite element analysis (FEA) result (a2) with 3D view (up) and the cross-sectional view (down). (B) three-dimensional extrusion-based bioprinter-associated optical coherence tomography (3D P-OCT) model before feedback (b1) with target filament size and layer thickness, and FEA result (b2) with 3D view (up) and the cross-sectional view (down). (C) 3D P-OCT model after feedback (c1) with target filament size and layer thickness, and FEA result (c2) with 3D view (up) and the cross-sectional view (down). (D) Volume porosity (VP) and porosity connectivity (PC) of the scaffold before (left) and after (right) feedback. (E) Compressive curves corresponding to three models in (A-C).
4. Discussion and conclusion
3D bioprinting provides new technology for tissue and organ regeneration, drug screening, disease modeling, and other fields. 3D printing technology with high-fidelity structure and function is key to promoting the large-scale application of 3D bioprinting in biomedical field. However, printing defects lead to low fidelity from structure to function, due to the lack of in situ defect detection and timely feedback control. In situ defect detection and location, timely feedback control, and defect repair are necessary to promote the application of 3D bioprinting to accurately manufacture complex personalized structures. The “monitoring and feedback-as-you-build” quality assurance mechanism were presented to improve printing efficiency, reduce material waste, and maximize the printed structure’s fidelity to the design, thus promoting the application and promotion of 3D bioprinting in organ transplantation and disease modeling. First, in situ process monitoring was achieved using 3D P-OCT for large-field full-depth imaging based on point cloud registration. Based on the imaging data, spatially resolved FS and LT were analyzed and quantified for defect detection. The feedback control mechanism was built in advance for different segments of the printing path and different defects. Finally, the effectiveness of the “monitoring and feedback-as-you-build” quality assurance mechanism was verified by printing with multi-layer lattice bone scaffold.
With large-field imaging enabled by 3D P-OCT, the imaging and evaluation of the current layer can be implemented regardless of the size of the printed structure. FS and LT analyses, defect detection, and layer fidelity analysis can be implemented for timely feedback control. With large-field full-depth imaging after printing, the volume parameters can be analyzed, including the VP, PC, and fidelity of the overall printed structure.
With 3D P-OCT data, FS and LT quantitative analyses can be implemented, including the spatial distribution of FS and LT defects and the detection and location of broken filaments. Furthermore, the input parameters can be adjusted based on in situ defect detection and the pre-built feedback control mechanism. In the previous work, FS was analyzed using the 2D projection images from 3D P-OCT and Euclidean distance transformation. Armstrong et al. quantified filament width using surface points with a laser displacement scanner[18]. Both of the above methods are susceptible to small material deposition errors in the vertical direction of the path, such as small burrs, resulting in FS calculation deviation. In this study, FS quantization was based on 3D P-OCT data and Euclidean distance transformation in 3D space, with improved quantitative accuracy. In the previous work, LT analysis was performed only for the height of the actual material deposition, ignoring the consistency between the actual material deposition path, and the designed path. To quantify LT defects and detect broken filaments, the designed path was combined with LT analysis in this study. First, GCode nodes were interpolated to make the resolution consistent with that of the 3D P-OCT data, and the LT was analyzed at each node to determine the LT distribution and defect detection along the printing path.
Based on large-field full-depth imaging with 3D P-OCT, and FS and LT quantitative analyses, the feedback control mechanism can be pre-built to adjust the input parameters and defect repair. In this study, material deposition errors under three different paths were considered for the pre-built feedback mechanism, including start-stop points, straight-line paths, and the turnarounds. The first pre-experiment was carried out to explore the relationship between the target material and two printing parameters, velocity and pressure, and FS and LT of the filament extruded through a nozzle. Under the same pressure value, the FS value and velocity exhibited a linear relationship, which can be used as a follow-up feedback support. The response delay of the pressure might cause a delay in material deposition at the path starting point and excess deposition of material at the path ending point. To avoid material deposition errors at start-stop points, a second pre-experiment was carried out with the target material and the optimum input parameters of velocity and pressure to determine the degree of delay response of pressure and implement the corresponding correction with a certain advance start and stop of extrusion. For the common lattice printing pattern, material deposition error usually occurs at the turnarounds due to the mismatch of the input parameters of velocity and pressure. To avoid material deposition errors at the turnarounds, a third pre-experiment was conducted by adding GCode nodes and increasing the velocity around the turnarounds. In contrast, Armstrong et al. avoided excessive material deposition around turnarounds by increasing the pressure and decreasing the velocity[5]. The decreased velocity increases the adhesion of the material to the bottom surface. However, acceleration and deceleration strips existed around the turnarounds, and the average velocity was lower than the preset velocity from the first pre-experiment. Simultaneously, considering the response delay of pressure according to the second pre-experiment, only velocity adjustment was selected for the turnarounds.
Based on the above defect detection and the pre-built feedback mechanism, a single-layer structure was printed to verify the detection and location of the broken filament; and the second printing for defect repair. Further, printing experiment on multi-layer scaffolds was carried out to compare the scaffolds before and after using the presented “monitoring and feedback-as-you-build” mechanism. With the “monitoring and feedback-as-you-build” mechanism, the FS and LT values in the straight-line path were closer to the target values, and less FS and LT errors occurred including start-stop points and the turnarounds. In addition, the layer fidelity and overall fidelity were both higher after feedback, indicating better consistency with the design model. Moreover, high-fidelity printing can ensure batch consistency of printed structures to improve the reliability of drug screening and ensure the degree of anastomosis between the scaffold and the defect site. In particular, for bone tissue scaffolds, high-fidelity printing can provide personalized structure and mechanical properties that are closer to the design model. The volume quantification results showed that VP and PC improved to 46.32% and 98.78% after feedback from 37.68% to 98.14%, respectively, which was helpful for the cell attachment and transport of nutrients and metabolites in the scaffold. In tissue engineering, the mechanical stiffness of the printed model plays an important role in tissue regeneration. When the stiffness of the printed model is greater than the present value, the concentration of stress on the surrounding bone can lead to secondary bone damage. In contrast, insufficient stiffness of the printed model may lead to implant failure and even bone atrophy. FEA is a method of using mathematical approximation to simulate complex and real systems, which can provide a solid theoretical basis for mechanical property evaluation. The FEA results indicated that the compressive modulus of the construct after feedback improved significantly and was closer to that of the design model. In conclusion, our results showed that the scaffold with the “monitoring and feedback-as-you-build” mechanism was closer to the design model from structure to function.
However, there are still some limitations to our current research that need to be studied further. For example, only the common lattice printing path was considered in this study, and complex graded scaffold patterns[22] or curved paths were not analyzed. The printing material was focused on Hap without cells inside. Future work could apply the “monitoring and feedback-as-you-build” mechanism using different material with different rheological properties, such as hydrogel with cell encapsulated. In addition, the prebuilt feedback mechanism in this study relied heavily on pre-experimental data with the target material, target FS, and LT values. The prebuilt feedback mechanism requires new pre-experiments with the different nozzles and different bioinks that are selected for the printing task. Large databases must be built by collecting multiple groups of experimental data to realize fast and intelligent selection of printing parameters for better feedback control. In addition, machine learning and deep learning algorithms have gradually been applied to camera-based anomaly detection in 3D printing[23,24], which will be introduced in our future work to improve the robustness and reliability of defect detection. In this study, the broken filament defect was detected and repaired with the secondary printing. However, it may encounter some other defects in bioprinting, such as excess material deposition and collapse. For excess material deposition, a scraper can be used to remove it in the future. For collapse during printing, our current strategy is to detect it and terminate the current print in time.
Although 3D P-OCT imaging interrupts the printing process leading to longer printing cycles, high-fidelity structures is more attractive in the biomedical field. In the 3D P-OCT described in this study, the A-scan acquisition frequency was 50 kHz, which could be improved using a high-speed OCT system. Simultaneously, data processing can be accelerated by software by software. Furthermore, 3D P-OCT, with its advantage of 3D long-term and nondestructive imaging, provides a powerful monitoring tool for 4D bioprinting.[25,26] In this study, the extrusion bioprinter was considered in 3D P-OCT. In theory, OCT can be used in other printers with different integration methods and imaging results for different materials. For the extrusion printer, the droplet-based printer[27], or microfluidic printer[28], OCT imaging probe is easier to be integrated with small changes to the original printer. However, larger changes are required to integrate OCT imaging probe with other printers, such as stereolithography, selective laser sintering, and selective laser melting.
In conclusion, the “monitoring and feedback-as-you-build” mechanism was presented based on 3D P-OCT, defect detection, and the pre-built feedback mechanism. To the best of our knowledge, this is the first time that 3D P-OCT has been applied for in situ defect detection and feedback control to achieve high-fidelity printing from shape to function. The 3D FS and LT analysis methods ensured accurate defect detection and location for feedback and repair. The pre-built feedback mechanism provided reasonable feedback support for timely feedback control and adjustment of the input parameters. Based on the “monitoring and feedback-as-you-build” mechanism, the single-layer structure and multi-layer scaffold showed that in situ defect detection and feedback control could ensure less FS and LT errors to achieve high-fidelity printing from structure to function. The layer fidelity and overall fidelity showed that the structures after the feedback were much closer to the design model. The reconstruction model of 3D P-OCT, 3D volume parameter quantification of VP and PC, and FEA results demonstrated that the scaffold function fidelity after feedback was more advantageous, especially in bone tissue engineering. The presented “monitoring and feedback-as-you-build” quality assurance system can improve printing efficiency, reduce material waste, and ensure high-fidelity printing from structure to function. 3D P-OCT enables in situ defect detection and location, timely feedback control and defect repair, thus promoting the application of 3D bioprinting in organ transplantation and disease modeling.
Acknowledgment
None.
Funding
This work was supported by the National Natural Science Foundation of China (No. 31927801), and Key Research and Development Foundation, Science and Technology Department of Zhejiang Province (No. 2022C01123).
Conflict of interest
The authors declare that they have no known competing financial interests or personal relationships that could have appeared to influence the work reported in this paper.
Author contributions
Conceptualization: Ling Wang, Shanshan Yang, Xu Mingen
Investigation: Shanshan Yang, Qi Chen, Ling Wang, Xu Mingen
Software: Qi Chen, Shanshan Yang
Formal analysis: Shanshan Yang, Qi Chen,
Writing – original draft: Shanshan Yang, Qi Chen
Writing – review & editing: Shanshan Yang
Ethics approval and consent to participate
Not applicable.
Consent for publication
Not applicable.
Availability of data
All data that support the findings of this study have been included in the article.
References
- 1.Matai I, Kaur G, Seyedsalehi A, et al. Progress in 3D bioprinting technology for tissue/organ regenerative engineering. Biomaterials. 2009;226:119536. doi: 10.1016/j.biomaterials.2019.119536. https://doi.org/10.1016/j.biomaterials.2019.119536. [DOI] [PubMed] [Google Scholar]
- 2.Yang Q, Lian Q, Xu F. Perspective:Fabrication of integrated organ-on-a-chip via bioprinting. Biomicrofluidics. 2017;11:031301. doi: 10.1063/1.4982945. https://doi.org/10.1063/1.4982945. [DOI] [PMC free article] [PubMed] [Google Scholar]
- 3.De Moor L, Merovci I, Baetens S, et al. High-throughput fabrication of vascularized spheroids for bioprinting. Biofabrication. 2018;10:035009. doi: 10.1088/1758-5090/aac7e6. https://doi.org/10.1088/1758-5090/aac7e6. [DOI] [PubMed] [Google Scholar]
- 4.Memic A, Navaei A, Mirani B, et al. Bioprinting technologies for disease modeling. Biotechnol Lett. 2017;39:1279–90. doi: 10.1007/s10529-017-2360-z. https://doi.org/10.1007/s10529-017-2360-z. [DOI] [PubMed] [Google Scholar]
- 5.Kim JH, Yoo JJ, Lee SJ. Three-dimensional cell-based bioprinting for soft tissue regeneration. Tissue Eng Regen Med. 2016;13:647–662. doi: 10.1007/s13770-016-0133-8. https://doi.org/10.1007/s13770-016-0133-8. [DOI] [PMC free article] [PubMed] [Google Scholar]
- 6.Armstrong AA, Norato J, Alleyne AG, et al. Direct process feedback in extrusion-based 3D bioprinting. Biofabrication. 2019;12:015017. doi: 10.1088/1758-5090/ab4d97. https://doi.org/10.1088/1758-5090/ab4d97. [DOI] [PubMed] [Google Scholar]
- 7.Vaezi M, Zhong G, Kalami H, et al. Extrusion-based 3D printing technologies for 3Dscaffold engineering. Funct 3D Tissue Eng Scaffolds. 2018:235–254. https://doi.org/10.1016/b978-0-08-100979-6.00010-0. [Google Scholar]
- 8.Derakhshanfar S, Mbeleck R, Xu K, et al. 3D bioprinting for biomedical devices and tissue engineering:A review of recent trends and advances. Bioact Mater. 2018;3:144–156. doi: 10.1016/j.bioactmat.2017.11.008. https://doi.org/10.1016/j.bioactmat.2017.11.008. [DOI] [PMC free article] [PubMed] [Google Scholar]
- 9.Rustom LE, Boudou T, Nemke BW, et al. Multiscale porosity directs bone regeneration in biphasic calcium phosphate scaffolds. Acs Biomater Sci Eng. 2017;3:2768–2778. doi: 10.1021/acsbiomaterials.6b00632. https://doi.org/10.1021/acsbiomaterials.6b00632. [DOI] [PubMed] [Google Scholar]
- 10.Baji A, Wong SC, Srivatsan TS, et al. Processing methodologies for polycaprolactone-hydroxyapatite composites:A review. Mater Manuf Process. 2006;21:211–218. https://doi.org/10.1081/amp-200068681. [Google Scholar]
- 11.Ji K, Wang Y, Wei Q, et al. Application of 3D printing technology in bone tissue engineering. BioDes Manuf. 2018;1:203–210. https://doi.org/10.1007/s42242-018-0021-2. [Google Scholar]
- 12.Heinrich MA, Bansal R, Lammers T, et al. 3D-bioprinted mini-brain:A glioblastoma model to study cellular interactions and therapeutics. Adv Mater. 2019;31:e1806590. doi: 10.1002/adma.201806590. https://doi.org/10.1002/adma.201806590. [DOI] [PubMed] [Google Scholar]
- 13.Simeunović A, Hoelzle DJ. Nonlinear and linearized gray box models of direct-write printing dynamics. Rapid Prototyp J. 2020;26:1665–76. https://doi.org/10.1108/rpj-12-2018-0303. [Google Scholar]
- 14.Aloisi V, Carmignato S. Influence of Surface Roughness on X-Ray Computed Tomography Dimensional Measurements of Additive Manufactured Parts. Case Stud Nondestruct Test Eval. 2016;66:104–10. https://doi.org/10.1016/j.csndt.2016.05.005. [Google Scholar]
- 15.Ma Y, Ji Y, Zhong T, et al. Bioprinting-based PDLSC-ECM screening for in vivo repair of alveolar bone defect using cell-laden, injectable and photocrosslinkable hydrogels. ACS Biomater Sci Eng. 2017;3:3534–3545. doi: 10.1021/acsbiomaterials.7b00601. https://doi.org/10.1021/acsbiomaterials.7b00601. [DOI] [PubMed] [Google Scholar]
- 16.Morozov EV, Novikov MM, Bouznik VM. MRI monitoring and non-destructive quality measurement of polymeric patterns manufactured via stereolithography. Addit Manuf. 2016;12:16–24. https://doi.org/10.1016/j.addma.2016.05.015. [Google Scholar]
- 17.Holzmond O, Li X. In Situ real time defect detection of 3D printed parts. Addit Manuf. 2017;17:135–142. https://doi.org/10.1016/j.addma.2017.08.003. [Google Scholar]
- 18.Armstrong AA, Alleyne AG, Johnson AJ. 1D and 2D error assessment and correction for extrusion-based bioprinting using process sensing and control strategies. Biofabrication. 2020;12:045023. doi: 10.1088/1758-5090/aba8ee. https://doi.org/10.1088/1758-5090/aba8ee. [DOI] [PubMed] [Google Scholar]
- 19.Yang S, Wang L, Chen Q, et al. In Situ process monitoring and automated multi-parameter evaluation using optical coherence tomography during extrusion-based bioprinting. Addit Manuf. 2021;47:102251. https://doi.org/10.1016/j.addma.2021.102251. [Google Scholar]
- 20.Fujimoto JG, Pitris C, Boppart SA, et al. Optical coherence tomography:An emerging technology for biomedical imaging and optical biopsy. Neoplasia. 2000;2:9–25. doi: 10.1038/sj.neo.7900071. https://doi.org/10.1038/sj.neo.7900071. [DOI] [PMC free article] [PubMed] [Google Scholar]
- 21.DePond PJ, Guss G, Ly S, et al. In Situ measurements of layer roughness during laser powder bed fusion additive manufacturing using low coherence scanning interferometry. Mater Des. 2018;154:347–359. https://doi.org/10.1016/j.matdes.2018.05.050. [Google Scholar]
- 22.Armstrong AA, Pfeil A, Alleyne AG, et al. Process monitoring and control strategies in extrusion-based bioprinting to fabricate spatially graded structures. Bioprinting. 2021;21:e00126. https://doi.org/10.1016/j.bprint.2020.e00126. [Google Scholar]
- 23.Goh GD, Hamzah NM, Yeong WY. Anomaly detection in fused filament fabrication using machine learning. 3D Print Addit Manuf. Ahead of print. 2022 doi: 10.1089/3dp.2021.0231. https://doi.org/10.1089/3dp.2021.0231. [DOI] [PMC free article] [PubMed] [Google Scholar]
- 24.Jin Z, Zhang Z, Shao X, et al. Monitoring anomalies in 3D bioprinting with deep neural networks. ACS Biomater Sci Eng. 2021;40:33. doi: 10.1021/acsbiomaterials.0c01761. https://doi.org/10.1021/acsbiomaterials.0c01761. [DOI] [PubMed] [Google Scholar]
- 25.Yang Q, Gao B, Xu F. Recent advances in 4D bioprinting. Biotechnol J. 2020;15:e1900086. doi: 10.1002/biot.201900086. https://doi.org/10.1002/biot.201900086. [DOI] [PubMed] [Google Scholar]
- 26.Gao B, Yang Q, Zhao X, et al. 4D bioprinting for biomedical applications. Trends Biotechnol. 2016;34:746–756. doi: 10.1016/j.tibtech.2016.03.004. https://doi.org/10.1016/j.tibtech.2016.03.004. [DOI] [PubMed] [Google Scholar]
- 27.Ji Y, Yang Q, Huang G, et al. Improved resolution and fidelity of droplet-based bioprinting by upward ejection. ACS Biomater Sci Eng. 2019;5:4112–4121. doi: 10.1021/acsbiomaterials.9b00400. https://doi.org/10.1021/acsbiomaterials.9b00400. [DOI] [PubMed] [Google Scholar]
- 28.Qing H, Ji Y, Li W, et al. Microfluidic printing of three-dimensional graphene electroactive microfibrous scaffolds. ACS Appl Mater Interfaces. 2020;12:2049–2058. doi: 10.1021/acsami.9b17948. https://doi.org/10.1021/acsami.9b17948. [DOI] [PubMed] [Google Scholar]
Associated Data
This section collects any data citations, data availability statements, or supplementary materials included in this article.
Data Availability Statement
All data that support the findings of this study have been included in the article.


